DOI:
10.1039/D3NA00577A
(Paper)
Nanoscale Adv., 2024,
6, 722-731
Glutathione S-transferase templated copper nanoclusters as a fluorescent probe for turn-on sensing of chlorotetracycline†
Received
31st July 2023
, Accepted 12th December 2023
First published on 14th December 2023
Abstract
Hereby, facile-green copper nanoclusters templated by glutathione S-transferase (GST-CuNCs) have been innovatively synthesized via a simple one-pot stirring method at room temperature. The as-prepared nanoclusters exhibited uniform size with satisfactory fluorescence intensity, good stability and low cytotoxicity. Significantly, the fluorescence of the obtained GST-CuNCs could be considerably enhanced by the addition of chlorotetracycline (CTC) rather than other analogues of CTC, which was ascribed to the aggregation-induced enhancement caused by the interaction between CTC and GST. The enhanced fluorescence intensity demonstrated a good linear correlation with the CTC concentration in the range of 30–120 μM (R2 = 0.99517), and the low detection limit was 69.7 nM. Furthermore, the proposed approach showed favorable selectivity and anti-interference toward CTC among prevalent ions and amino acids. Additionally, this nanoprobe was also applied to the quantitative detection of CTC in serum samples with satisfactory outcomes, which demonstrated excellent prospects for practical applications.
1 Introduction
Chlorotetracycline (CTC) as a widely used broad-spectrum tetracycline antibiotic has been commonly employed for the treatment and prophylactic control of animal infectious diseases.1,2 However, excessive use of CTC can result in serious side effects, including environmental pollution, bacterial resistance, accumulation in food and so on.3–5 Thus, it is imperative to establish an approach for the determination of CTC. To date, CTC has been analyzed by high performance liquid chromatography (HPLC),6,7 Raman spectroscopy,8 capillary electrophoresis,9 electrochemical methods,10,11 enzyme-linked immunosorbent assay (ELISA)12 and some other methods. However, these methods required expensive instruments and complex operational processes, which incredibly limited their application for rapid and real-time determination. In recent years, fluorescence approaches have been utilized for the detection of tetracycline antibiotics due to their excellent sensitivity and simple operation. Some fluorescent materials such as carbon dots,13,14 nanoparticles,15 metal nanoclusters16 and metal–organic framework materials17 have been applied in CTC detection, whereas the majority of these probes were based on a fluorescence quenching response, which restricted their sensitivity and accuracy for practical applications.
In the last few years, metal nanoclusters (NCs) have attracted widespread attention owing to their unique physicochemical properties.18–21 In comparison to various noble metals (e.g. gold and silver), copper is relatively inexpensive and earth-abundant. Taking advantage of distinctive optical characteristics and low toxicity, copper nanoclusters (CuNCs) have been widely employed as satisfactory fluorescent sensors.22,23 Up to now, multifarious approaches have been reported for synthesizing CuNCs.24–26 However, several challenges should be overcome: (I) CuNCs were susceptible to being oxidized, (II) the size of CuNCs was difficult to control, (III) the commonly used reducing agents such as hydrazine hydrate were volatile and highly toxic, (IV) the templates or products were insoluble in water, (V) the reaction conditions strictly involved a high temperature (100 °C) and/or a relatively long reaction time (>12 h). Hence, it is exceedingly desirable to devise a straightforward and facile method for preparing water-soluble CuNCs with nontoxicity, high stability and excellent uniformity.
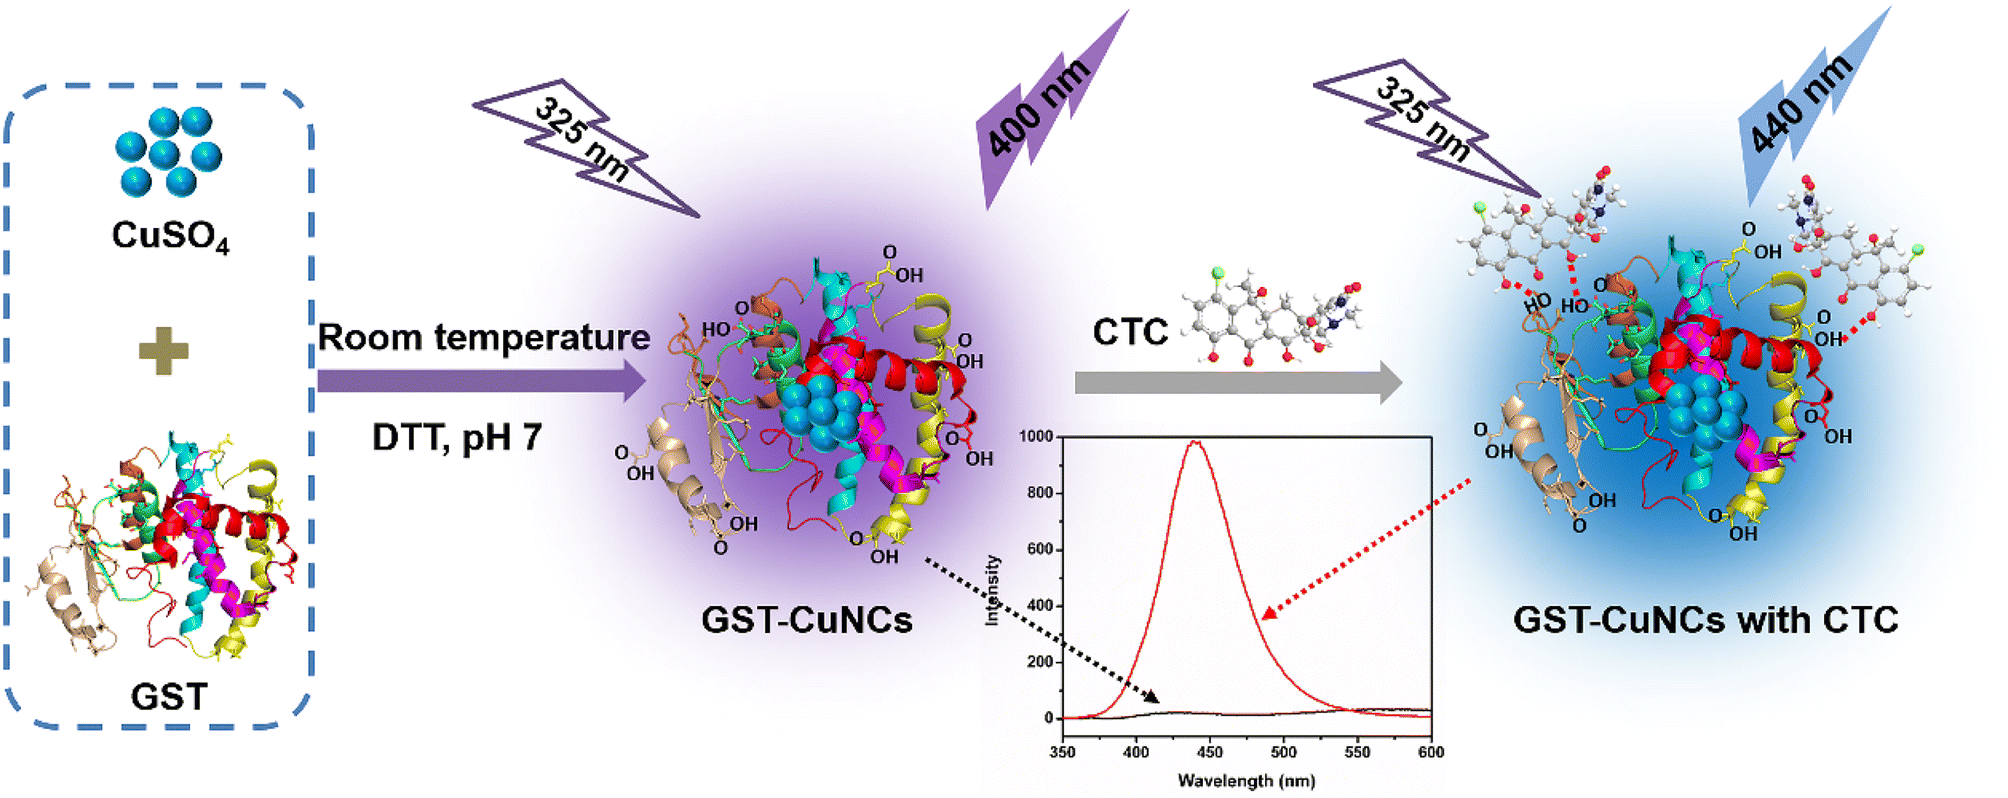
Herein, we developed a facile and green one-pot method to synthesize glutathione S-transferase (GST)-templated CuNCs (GST-CuNCs) at room temperature using dithiothreitol (DTT) as the reducing agent (Scheme 1). GST containing tryptophan and tyrosine residues can serve to reduce high-valence metal ions, promoting the fabrication of CuNCs through metal-GST coordination bonds.27,28 The obtained GST-CuNCs exhibited blue fluorescent emission at 400 nm when excited at 325 nm. Meanwhile, the products exhibited exceptional stability under different conditions. Most importantly, the as-prepared GST-CuNCs could serve as fluorescent nanosensors for detecting CTC in aqueous solution based on an enhancement response (“turn-on”). The fluorescence ratio of GST-CuNCs demonstrated a satisfactory linearity with the concentration of CTC ranging from 30 to 120 μM. The present fluorescent probe exhibited remarkable sensitivity toward CTC with a detection limit of 69.7 nM. In addition, the specific interaction between CTC and GST enhanced the selectivity and anti-interference capability of GST-CuNCs to prevalent ions and amino acids. Furthermore, GST also endowed CuNCs with good biocompatibility, which could potentially expand their practical applications. Benefiting from its outstanding performance, the proposed assay based on GST-CuNCs has been successfully employed for CTC detection in serum samples. To our knowledge, this is the first report that determines CTC with GST-CuNCs.
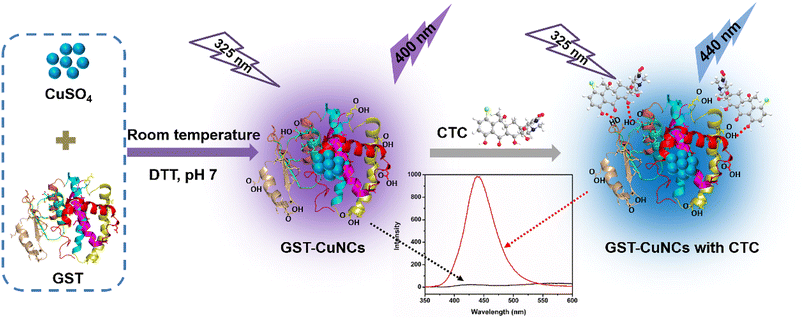 |
| | Scheme 1 Illustration of GST-CuNC formation and the “turn-on” sensing of CTC. | |
2 Experimental
2.1 Reagents
Copper sulphate (CuSO4), sodium hydroxide (NaOH), hydrochloric acid (HCl), NaCl, KCl, Na2HPO4·12H2O, KBr and KH2PO4 were bought from Beijing Chemical Factory (China). Dithiothreitol (DTT), quinine sulfate and amino acids were provided by Aladdin Bio-Chem Technology Co., Ltd. (Shanghai, China). Chlortetracycline HCl (CTC), tetracycline HCl (TC), oxytetracycline HCl (OTC) and doxycycline HCl (DC) were purchased from Macklin Reagent Co., Ltd. (Shanghai, China). The GST protein was expressed according to our previously reported method.27 All chemicals were of analytical quality without additional purification.
2.2 Synthesis of GST-CuNCs
According to a previous report,29 GST-templated CuNCs were prepared in aqueous solution. Substantially, GST (20 mg mL−1) was mixed with CuSO4 (5 × 10⁻³ mol L−1) under vigorous stirring at room temperature, and the pH value was adjusted to 12.0 by using NaOH solution. After 10 minutes, a DTT solid was introduced and the pH was adjusted to 7.0. The mixture was continuously stirred under ambient conditions for different durations between 0 and 9 h. Finally, the obtained solution was transferred to a 25 kDa dialysis bag and dialyzed overnight in phosphate buffered saline (PBS) solution to eliminate excess reactants, refolding the protein to its natural state as much as possible and stored at 4 °C.
2.3 Characterization
All fluorescence spectra were monitored using an RF-5301 PC spectrofluorometer (Shimadzu, Japan). UV-vis absorption spectra were recorded on a UV1800 spectrometer (Jinghua Instruments, Shanghai, China). A Thermo Fisher Nexsa spectrometer was employed to obtain X-ray photoelectron spectroscopy (XPS) spectra. The infrared spectrum was characterized using a Fourier transform infrared (FT-IR) spectrometer (Thermo Fisher Scientific). The relative quantum yield (QY) of GST-CuNCs was measured and calculated using the UV-vis absorption and fluorescence spectra of quinine sulfate (QY = 54%) based on the previously reported literature.30 Transmission electron microscopy (TEM) images of the products were obtained on a JEOL JEM-2100PLUS (Jeol Ltd, Japan). Time resolved fluorescence lifetime experiments were conducted using an FLS 1000 (Edinburgh Instruments, United Kingdom) combined with a fluorescence life-time and steady state spectrometer (F7100, Hitachi, Hamamatsu device).
2.4 Sensing of CTC with GST-CuNC probes
For the quantification of CTC, the stock solution of CTC (1 mM) was newly prepared with phosphate buffer solution (PBS). Then, 180 μL of as-prepared GST-CuNC solution (0.5 mg mL−1) was mixed with 20 μL of different concentrations of CTC, respectively. After 5 min of incubation, the fluorescence emission peaks were measured in the wavelength range 350–600 nm under an excitation of 325 nm.
2.5 Method comparison
To assess the agreement between the proposed assay and HPLC, CTC concentrations were analyzed using both analytical methods. The analytical procedures were carried out as below: the sample injection volume was 20 μL, the mobile phase consisted of 50% methanol/50% water with 0.01% trifluoroacetic acid, and the flow rate was 1 mL min−1. The column oven temperature was maintained at 25 °C. The UV detection wavelength was set at 370 nm. The analyte peaks in the chromatograms were integrated, and the peak areas were calculated using the Origin software. Statistical analyses were performed using Statistical Package for the Social Sciences (IBM, Inc, Armonk, NY, USA). The consistency between the two approaches was investigated using a Bland–Altman plot, while the limits of the agreement were specified as the mean deviation ±1.96 SD. A P-value below 0.05 denoted statistical significance.
2.6 Cell culture
The HeLa cells (human cervical carcinoma) were cultured in Dulbecco's Modified Eagle's medium containing fetal bovine serum (FBS, 10%) and penicillin-streptomycin (100 mg mL−1). Cells were incubated under humidified conditions with 5% carbon dioxide at 37 °C.
2.7
In vitro cytotoxicity of GST-CuNCs
The cytotoxicity of GST-CuNCs on the HeLa cells was examined by MTT assay. Typically, HeLa cells (1 × 10⁵ cells per mL) were planted in a 96-well plate and cultured overnight. Afterwards, the medium was substituted with DMEM containing varying quantities (0–0.5 mg mL−1) of GST-CuNCs, each with three duplicates. After 24 h, MTT solution (0.5% × 10 μL) was introduced and incubated for 4 h at 37 °C. Then, DMSO (100 μL) was added after removing the supernatant and the plate was shaken slightly for a while to dissolve the intracellular formazan crystals. The optical density (OD) of each well was assessed at 490 nm to achieve the colorimetric results.
2.8 Measurement of CTC in serum samples
Blood samples were collected from adult male Sprague-Dawley rats (200–250 g) and treated to obtain serum samples based on the literature description.31 First, serum was diluted 10 times using PBS. Then various amounts of CTC were added to the serums serving as the spiked samples. We used GST-CuNCs as probes to detect the serum samples 3 times. Each sample was cultivated at ambient temperature for 30 min and the fluorescence spectra were recorded on an RF-5301 PC spectrofluorometer. All rats were cultured under controlled conditions with a 12 h light–dark cycle at 25 °C and subjected to an overnight fast with ad libitum access to water. The animal protocols in the present study were performed in accordance with the Guidelines for Care and Use of Laboratory Animals of Nantong University and approved by the Animal Ethics Committee of Nantong University.
3 Results and discussion
3.1 Preparation and characterization of GST-CuNCs
The GST-CuNCs were prepared via a mild one-step method, where GST acted as a capping template due to its coordination ability and DTT acted as a reducing agent based on its strong reduction properties. The formation of GST-CuNCs was optimized by varying experimental parameters including synthetic time, the concentration of GST, the amount of DTT and pH value. As shown in Fig. S1a,† the fluorescence intensity of GST-CuNCs was enhanced when the duration of the reaction time was extended from 1 h to 9 h. Of note, the optimal reaction time was fixed at 8 h. After that, the concentration of GST was altered to further improve the fluorescence properties. It could be found that the fluorescence intensity increased with the concentration of GST increasing (Fig. S1b†). In contrast, the fluorescence intensity decreased gradually when DTT was added from 1.0 to 3.0 mg (Fig. S1c†). Finally, the pH value was investigated in the range of 9–13. Protein folding or unfolding could be initiated by altering pH values.32 The spatial conformation of GST protein was changed under strong alkaline conditions, resulting in surface amino acid residue exposure. Therefore, the products exhibited maximum fluorescence intensity when the pH values of the reaction mixture reached up to 12 (Fig. S1d†). Overall, the best-performing GST-CuNCs were obtained using 5 mM CuSO4 and 20 mg mL−1 GST at pH 12, and then 1 mg DTT was added under stirring for 8 h.
After optimization, the synthetic GST-CuNCs exhibited a bright fluorescence emission with the maximum at 400 nm when excited at 325 nm (Fig. 1a) and the collected GST-CuNC solution presented a light blue color in day light (inset Fig. 1a). The UV-vis absorption spectra of GST-CuNCs located at around 250–300 nm, which were similar to the absorption band of GST (Fig. 1b), while there was no surface plasma resonance band at 400–550 nm, indicating the absence of large copper nanoparticles. The relative QY of GST-CuNCs was appraised to be 1.36% in PBS solution using quinine sulfate as a reference (Fig. S2†). Even though this value was not higher than those of other protein-templated CuNCs as contrasted in Table S1,† the synthesis conditions were more convenient. This was the first time to successfully synthesize CuNCs using GST as a capping agent at room temperature. Furthermore, TEM was employed to demonstrate the morphology characteristics of GST-CuNCs. The GST-CuNCs possessed nearly spherical shape with good mono-dispersity (Fig. 1c). Besides, the crystal lattice fringe of the GST-CuNCs was 3.01 Å (inset of Fig. 1c), which was consistent with the (102) planes of Cu.33,34 The size distribution of GST-CuNCs was calculated based on TEM images and the average particle diameter was approximately 1.3 ± 0.1 nm (Fig. 1d). Moreover, the FT-IR spectrum of GST-CuNCs was utilized to recognize the characteristic bands of GST as a ligand (Fig. 1e). The stretching vibration absorption peaks at 3400 and 1500 cm−1 were ascribed to the COOH and NH2 groups of GST. The peaks near 2400–2200 cm−1 belonged to the S–H stretching vibration of cysteine in GST. Compared with the IR spectrum of pure GST, the functional groups were similar and the shift of the peak from 1393 to 1457 cm−1 illustrated that GST was successfully decorated on the surface of CuNCs. Finally, the oxidation state of Cu in GST-CuNCs was verified by XPS. The Cu 2p spectrum (Fig. 1f) presented two prominent peaks at 932.1 and 952.1 eV, which were assigned to the binding energies of 2p3/2 and 2p1/2 respectively, in good accordance with the Cu(0) state. As well, no obvious peak around 942 eV was observed, suggesting the absence of Cu2+ in GST-CuNCs. Nevertheless, the 2p3/2 binding energy of Cu(0) was similar to that of Cu(I), indicating that GST-CuNCs were composed of Cu0 and Cu+ according to previous reports.
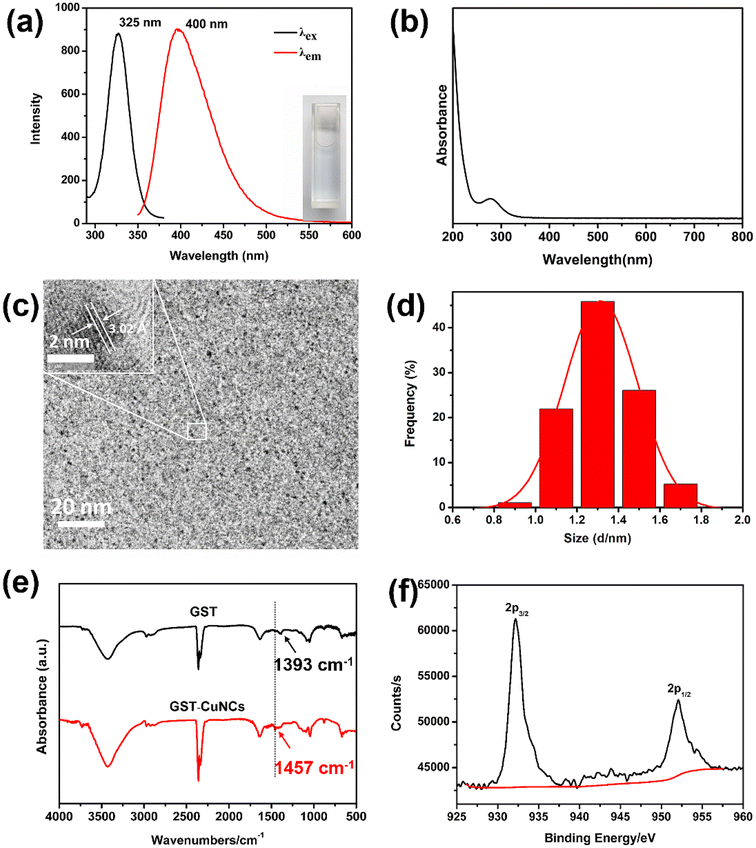 |
| | Fig. 1 (a) Fluorescence excitation (black) and emission (red) spectra of GST-CuNCs. The inset displays the photograph under day light. (b) The UV-Vis absorption spectrum of the GST-CuNCs. (c) TEM image of GST-CuNCs. (d) The particle diameter histogram by calculating the size of hundred individual particles. (e) FT-IR spectra of GST and GST-CuNCs. (f) XPS spectrum in the Cu 2p region of GST-CuNCs. | |
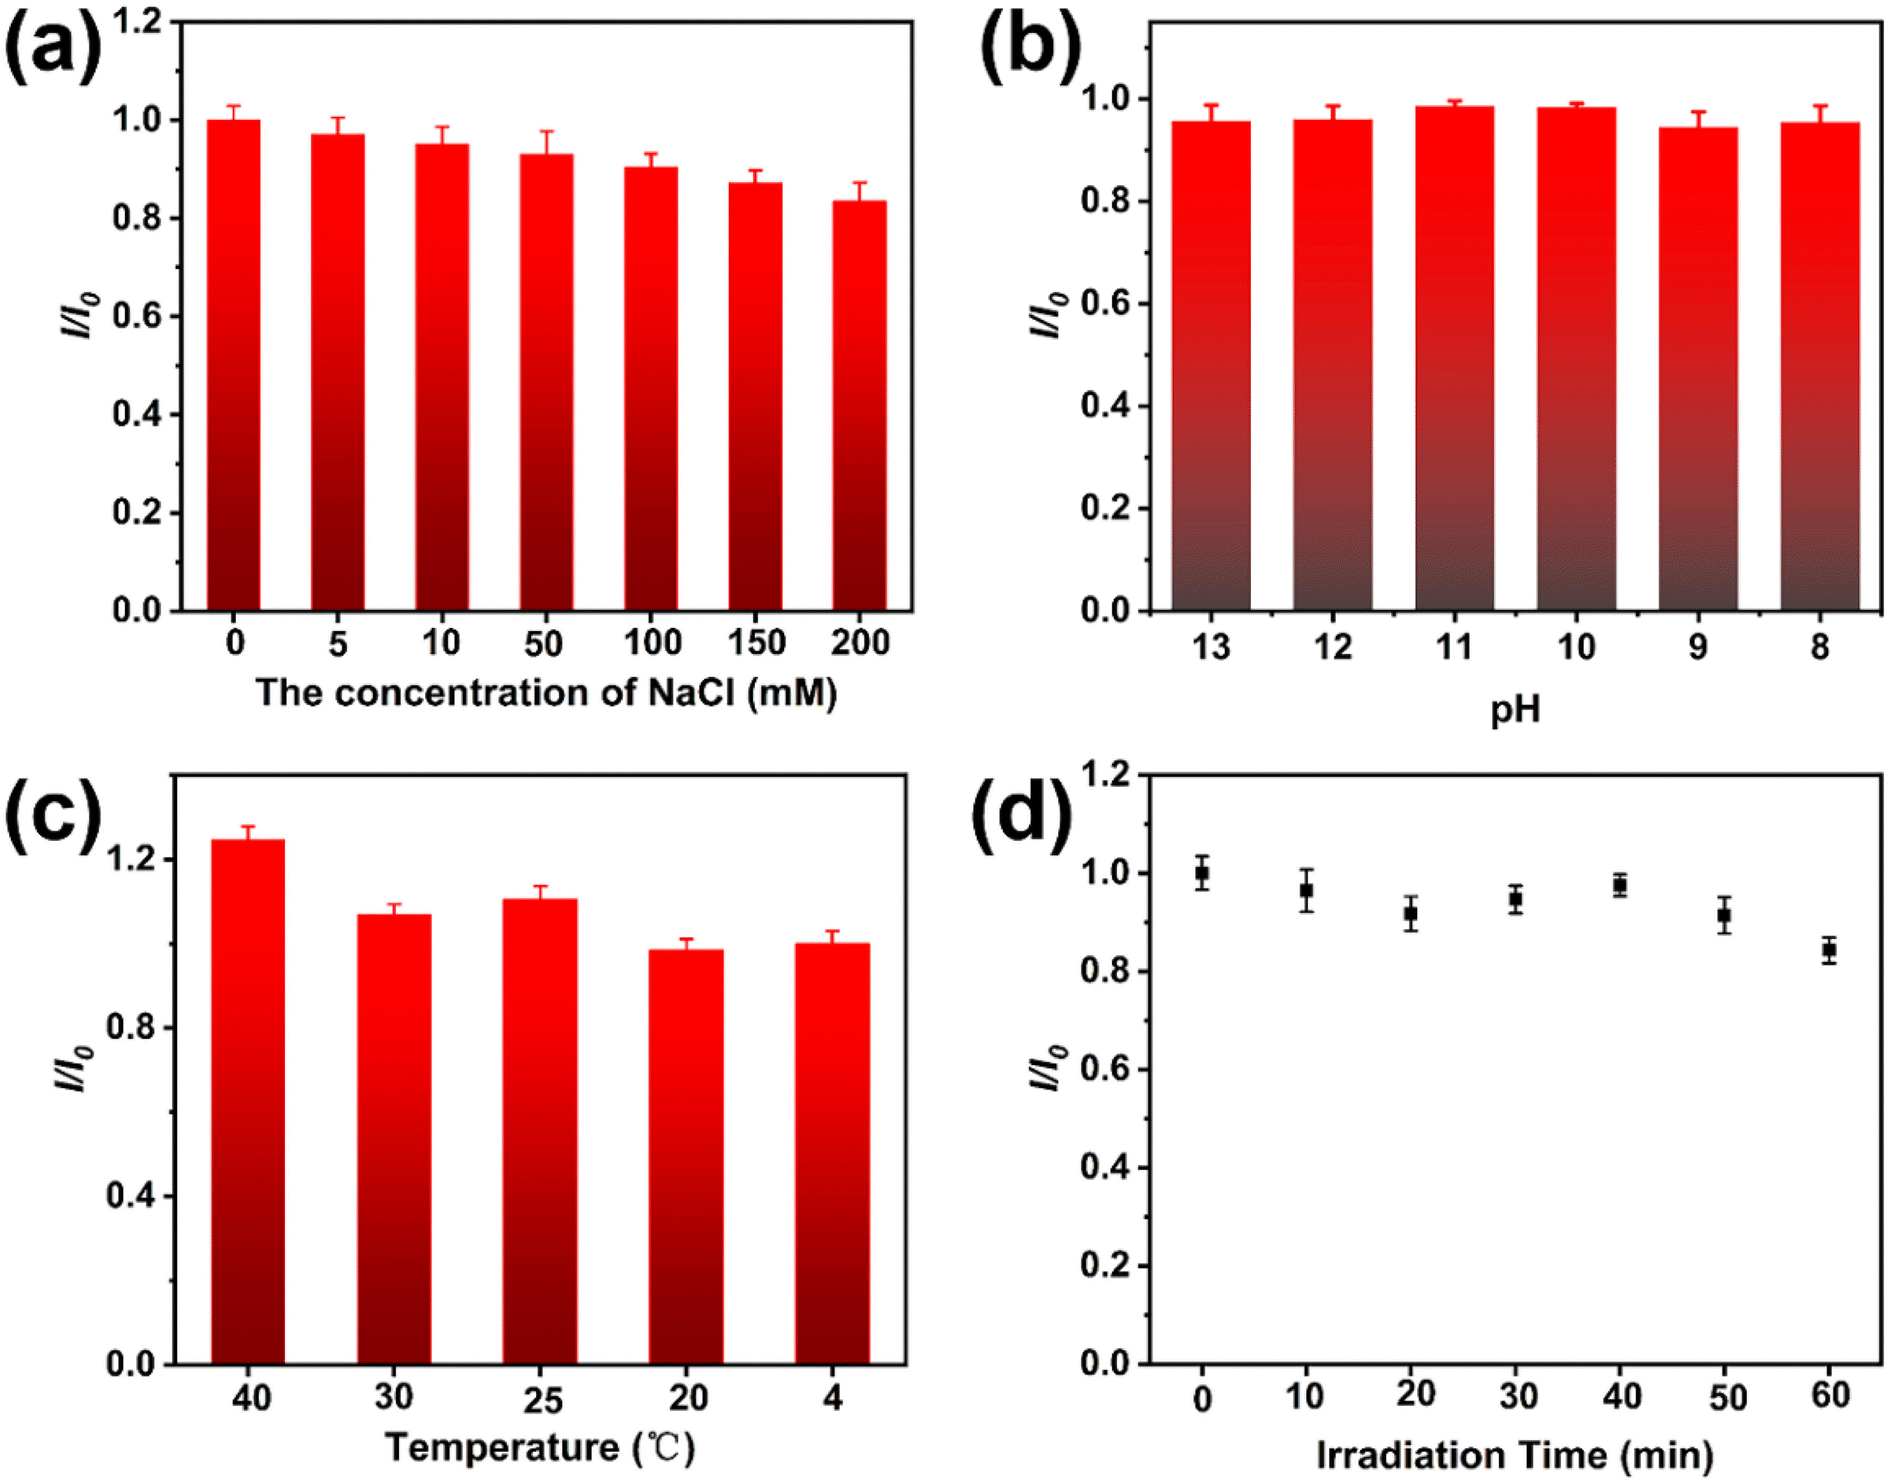
3.2 Stability of GST-CuNCs
Favorable stability of fluorescent NCs is a significant element in estimating the possibility of their practical adhibition. The stability of GST-CuNCs against salt, pH, temperature and UV irradiation was tested respectively (Fig. 2). As shown in Fig. 2a, the fluorescence emission intensity slightly decreased with the increasing concentration of NaCl in the range of 0–200 mM, illustrating that the good stability of GST-CuNCs was maintained even at high ionic strength. Moreover, the fluorescence intensity of GST-CuNCs had no obvious variation from pH 8–13 as displayed in Fig. 2b, which demonstrated that the obtained GST-CuNCs were relatively stable towards different pH values even under highly alkaline conditions. Whereas the fluorescence spectra of GST-CuNCs at lower pH values were not measured, because the GST-CuNCs aggregated and precipitated when the pH value approached the isoelectric point of the protein template. Interestingly, the fluorescence intensity of GST-CuNCs suffered from a slight increase in a broad temperature range from 4 to 40 °C (Fig. 2c), implying the excellent thermostability of GST-CuNCs. Moreover, the GST-CuNCs exhibited good photostability even though there was a mild quenching of the fluorescence intensity after 60 min of UV irradiation as shown in Fig. 2d. These high stabilities of GST-CuNCs under a variety of conditions would greatly promote their applications.
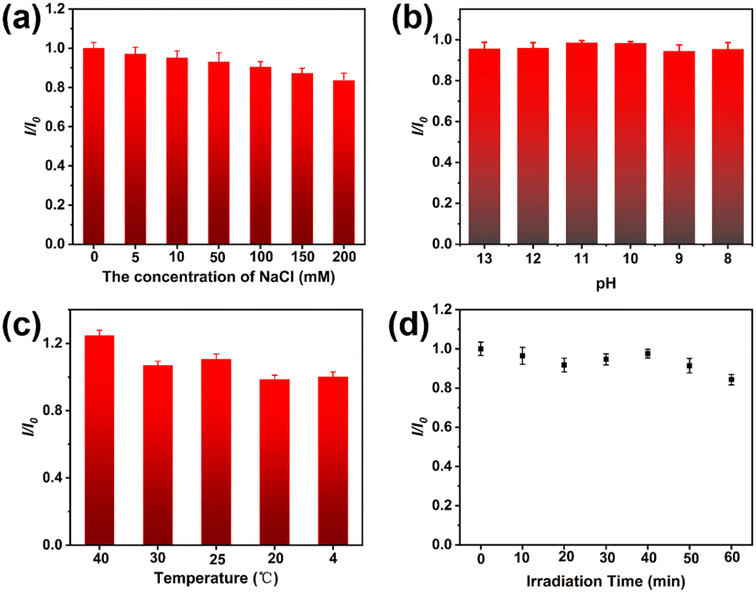 |
| | Fig. 2 Fluorescence intensity of GST-CuNCs at different (a) NaCl concentrations (0–200 mM), (b) pH (8–13), (c) temperature (4–40 °C) and (d) UV irradiation time (0–60 min). | |
3.3 “Turn-on” fluorescence response for the detection of CTC
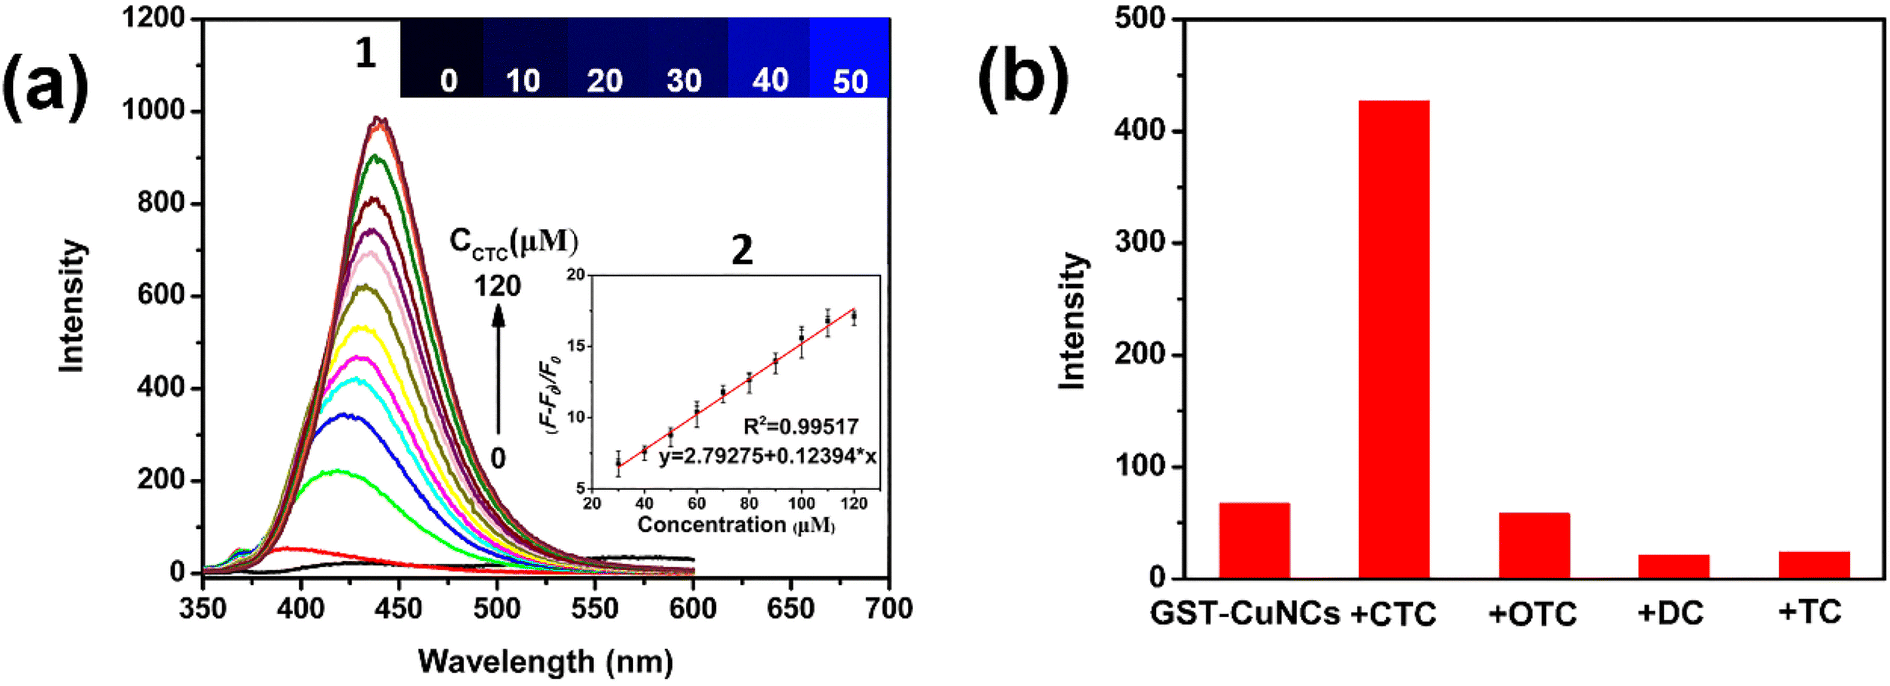
The fluorescent response of GST-CuNCs for CTC quantitative detection was investigated as shown in Fig. 3a. The intensity of the GST-CuNCs gradually enhanced with an increase in the CTC concentration under an excitation of 325 nm, which indicated a strong interaction between CTC and GST-CuNCs. Simultaneously, there was a red-shift appearance from 400 to 440 nm. The GST-CuNC solution did not display any fluorescence, while more and more bright blue fluorescence was observed with the addition of CTC (Fig. 3a, inset 1). Based on the fluorescence spectrum, a good linear response correlation between the fluorescence intensity (F – F0)/F0 and the CTC concentration was obtained within the range of 30–120 μM (Fig. 3a, inset 2). The linear equation can be described as (F – F0)/F0 = 0.12394 × CCTC + 0.12394 (R2 = 0.99517) (where F0 and F refer to the fluorescence intensity in the absence and presence of CTC, respectively). The corresponding limit of detection (LOD) was 69.7 nM (S/N = 3), which was lower than that of other reported methods as displayed in Table 1. Based on this, GST-CuNCs could serve as a promising “turn-on” fluorescence sensor for CTC detection in solution.
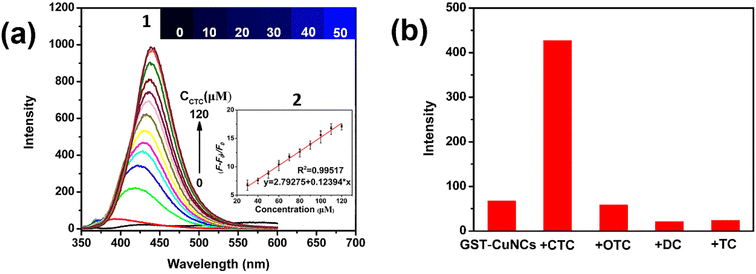 |
| | Fig. 3 (a) Fluorescence emission spectrum of GST-CuNCs with different concentrations of CTC. Inset 1: the fluorescence photograph of GST-CuNCs with different concentrations of CTC (0, 10, 20, 30, 40, and 50 μM) under a fluorescence microscope. Inset 2: the correlation between F − F0/F0 and the CTC concentration in the range of 30–120 μM, where F0 and F represent the fluorescence intensity in the absence of CTC and presence of various concentrations of CTC, respectively. (b) Fluorescence response of GST-CuNCs towards CTC and its analogues at a concentration of 120 μM. | |
Table 1 Comparison of different reported methods for CTC detection
| Methods |
Materials |
Linear range |
Detection limits |
Ref. |
| Fluorometry |
AuPtNCs |
0.5–10 μM |
0.35 μM |
35
|
| Fluorometry |
Silver nanoparticles |
0.05–3.0 mg L−1 |
0.19 μg L−1 |
36
|
| Fluorometry |
Carbon dots |
5–100 μM |
0.254 μM |
37
|
| Fluorometry |
CuNCs@TA |
0.5–200 μM |
0.084 μM |
38
|
| Fluorometry |
CuNCs@His |
0.5–200 μM |
0.876 μM |
39
|
| Electrochemistry |
RGO-MIP/GCE |
10.0–500.0 μM |
— |
40
|
| Electrochemiluminescence |
RuSiNPs |
1–100 μM |
0.16 μM |
41
|
| Capillary electrophoresis |
— |
0.03–5.0 μg mL−1 |
0.017 μg mL−1 |
42
|
|
Fluorometry
|
GST-CuNCs
|
30–120 μM
|
69.7 nM
|
This paper
|
3.4 Selectivity and anti-interference ability of the sensing platform for CTC detection
As is well known, excellent selectivity and anti-interference ability are the primary features of a splendid probe. In order to evaluate the specific detection of CTC in complex sensing systems, the response of GST-CuNCs to other possible interferences was meticulously examined. Different tetracycline analogues (Fig. S3†) were first chosen to explore the selectivity and specificity of GST-CuNCs to CTC under identical experimental conditions. The results (Fig. 3d and S4†) showed that only CTC caused conspicuously enhanced response to GST-CuNCs and no noticeable changes occurred for the other three kinds of tetracycline antibiotics, which indicated that CTC could be easily distinguished from other TCs. The disparity in fluorescence enhancement might be as follows: CTC contains a nucleophilic carbonyl group and chlorine group in the aromatic ring, which prefer to react with the residues of GST.
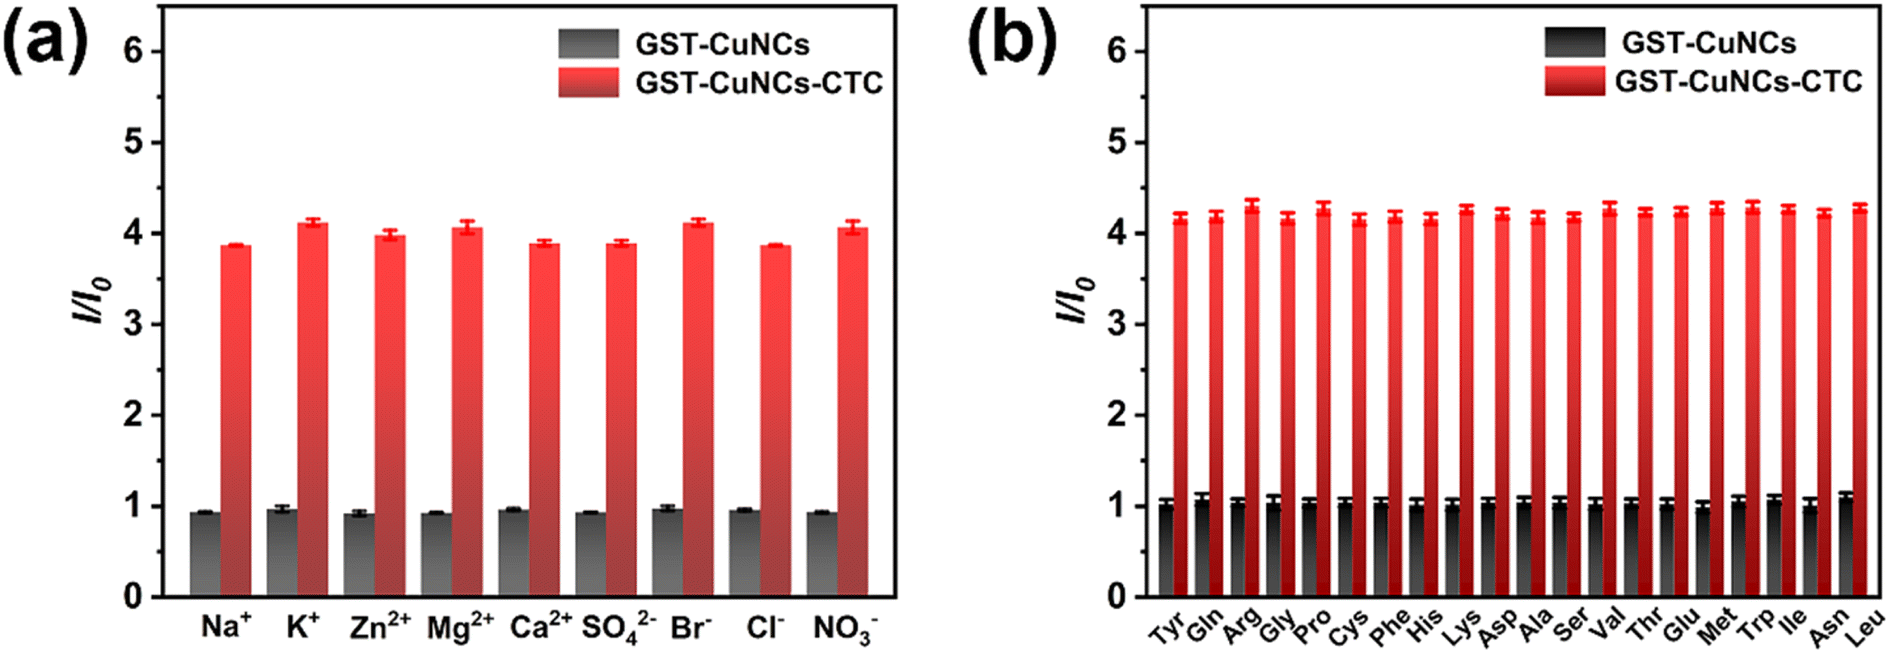
For validating the selectivity and anti-interference properties of the GST-CuNCs towards CTC, the fluorescence emission of GST-CuNCs was monitored in the presence of some potential interfering substances including Na+, Zn2+, K+, Mg2+, Br−, Cl− and various α-amino acids. Fig. 4 depicts that the fluorescence value (I/I0) enhanced obviously after adding CTC, whereas there was an inappreciable effect on ions, as was to natural α-amino acids in comparison. The above results indicated that the novel proposed “turn-on” fluorescent probe presented remarkable selectivity and anti-interference properties for quantitative detection of CTC in practical applications.
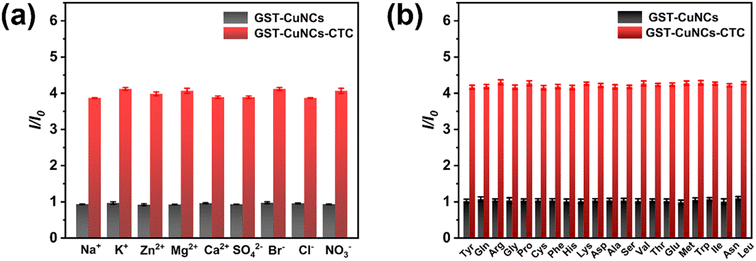 |
| | Fig. 4 The relative fluorescence intensity values [I/I0] of GST-CuNCs (1 mg mL−1) with diverse (a) ions and (b) amino acids. The concentrations of CTC and other interfering analytes were 5 μM and 50 μM. | |
3.5 Possible mechanism of GST-CuNCs for fluorescence detection of CTC
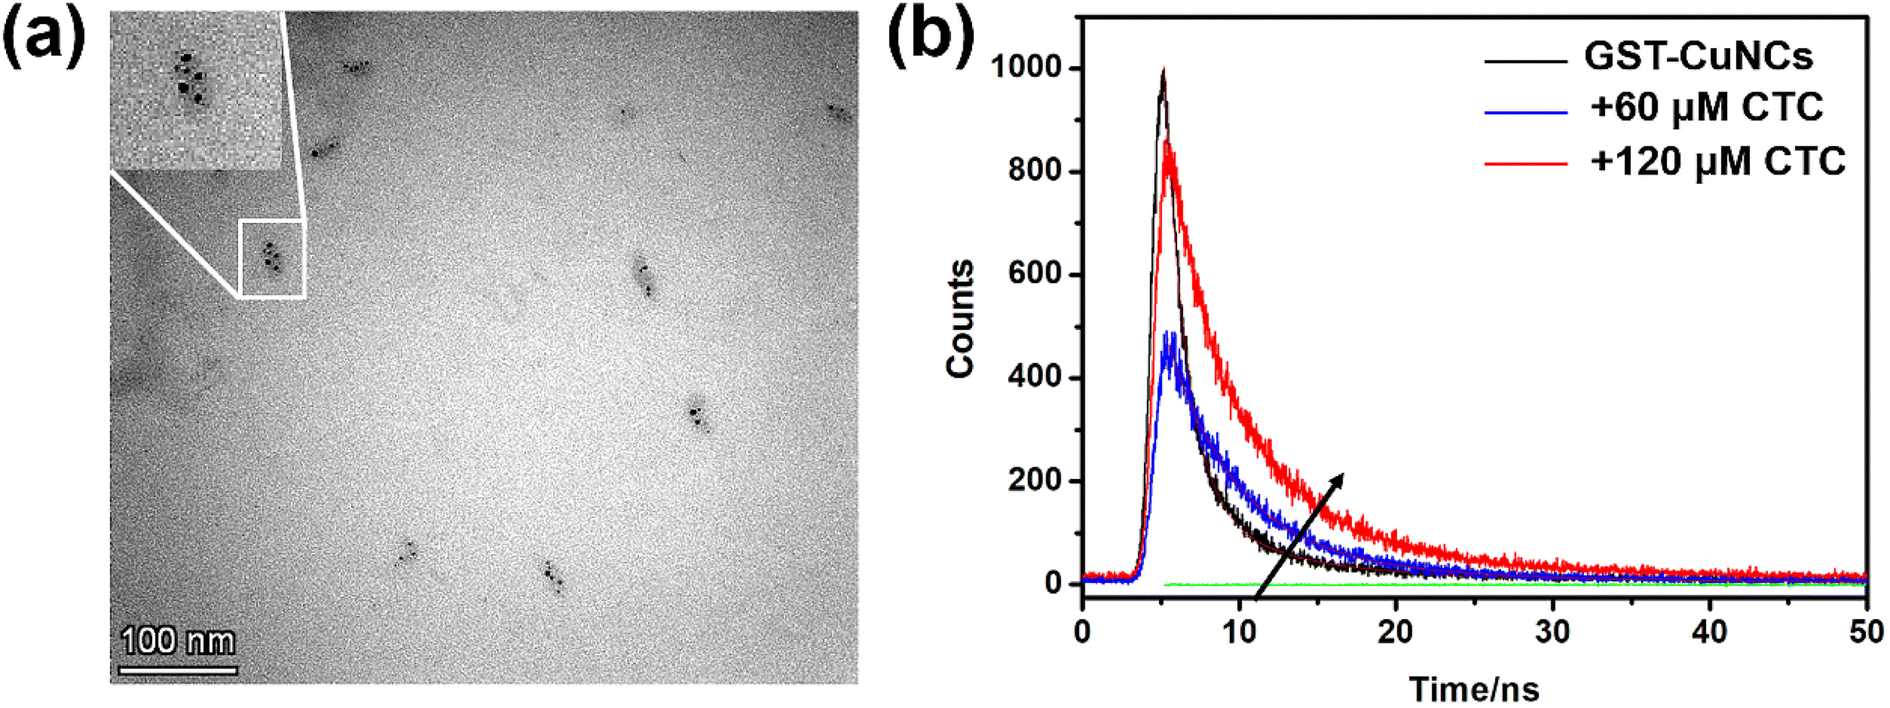
It was well known that the fluorescence enhancement of metal nanoclusters might be due to metal deposition in the core cluster,43 metal–ligand formation,44 aggregation-induced emission45–48 and so on. Therefore, the possible mechanism of the “turn-on” fluorescence response was investigated by exploring the possible interaction between GST-CuNCs and CTC. TEM was first applied to observe the morphology of GST-CuNCs in the presence of CTC. As shown in Fig. 5a, the size of GST-CuNCs–CTC was increased and appeared as an aspherical shape. Notably, several individual GST-CuNCs were displayed separately in the enlargement (insert in Fig. 5a), suggesting that the metal nuclei were aggregated by the addition of CTC. Based on this, it could be speculated that the gradual increase in fluorescence intensity may be caused by the aggregation-induced emission (AIE) effect. To further prove this speculation, UV-vis absorption spectra of GST-CuNCs with diverse quantities of CTC were measured. As shown in Fig. S5,† the UV-vis absorption band was dramatically changed in the wavelength range of 370–450 nm with the addition of CTC after subtracting the intrinsic effect of CTC, which illustrated that bigger aggregations were formed. This result could be attributed to the charge transfer transition and the hydrogen bonds between CTC and GST-CuNCs. By comparing the FT-IR spectra of GST-CuNCs in the absence and presence of CTC (Fig. S6†), it was found that the stretching vibration peak of O–H and N–H shifted from 3439 cm−1 to 3394 cm−1 and N–H flexural vibration at 1527 cm−1 disappeared, indicating that the binding sites between CTC and GST-CuNCs were –OH and –NH2. The peak at 2971 cm−1 was assigned to –CH stretching vibration and it shifted to 2920 cm−1 after adding CTC, which demonstrated that –CH also participated in the attachment of GST-CuNCs. In the meantime, the fluorescence lifetime measurements of GST-CuNCs in the absence and presence of CTC were also performed to reveal the interaction mechanism. The lifetime decay curve and the corresponding fitting results are illustrated in Fig. 5b and Table S2.† The as-prepared GST-CuNCs had two lifetimes of 1.43 ns (54.28%) and 7.06 ns (45.72%). It was worth noting that the fast relaxation rate of fluorescence lifetime of GST-CuNCs was changed to 4.38 ns (69.12%) and 13.41 ns (30.88%) after adding 120 μM CTC. This remarkable increase in lifetime served to confirm the possibility of GST-CuNCs–CTC complex formation induced by AIE. Therefore, the interaction between CTC and GST restricted intramolecular vibration and reduced non-radiation pathways, which induced the fluorescence enhancement of GST-CuNCs.
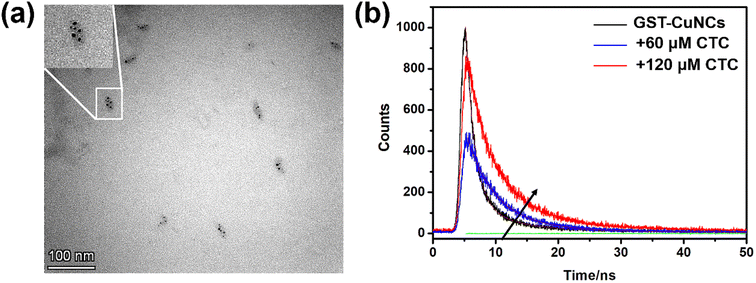 |
| | Fig. 5 (a) TEM image of the synthesized CuNCs in the presence of CTC. (b) The lifetime of GST-CuNCs in the absence and presence of CTC. | |
3.6 Method comparison
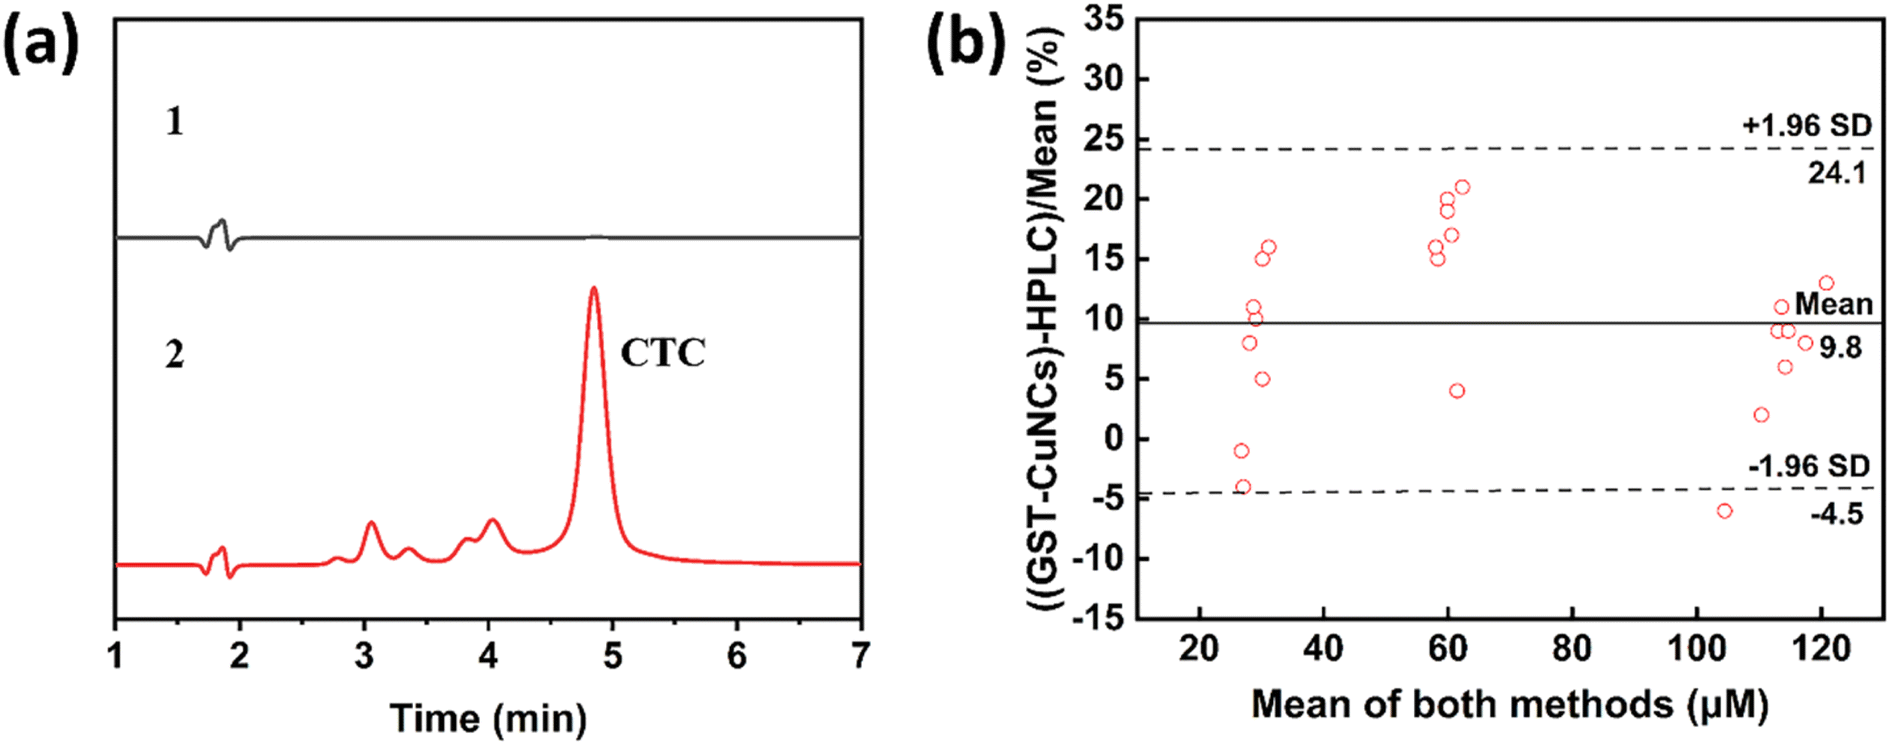
The correlation and accuracy between the two methods were evaluated by employing the Bland Altman method. Fig. 6a display the representative HPLC chromatograms of phosphate buffer solution and after being spiked with CTC. The average value came from the results of newly developed GST-CuNCs and HPLC (Fig. 6b). The measurement results using this sensor were 9.8% more than those of the HPLC method, and the 95% difference between the two methods was anticipated to be within the range of −4.5% and 24.1% (±1.96 SD). Most of the data fell within this range, with only one sample outside this range. The approach we established for testing demonstrated an admissible average difference (<10%) compared to the HPLC method, indicating a high correlation or availability of calibration between the two measured values.
 |
| | Fig. 6 (a) HPLC chromatograms, (1) phosphate buffer solution and (2) phosphate buffer solution added CTC. (b) Comparison of the CTC detection results obtained with GST-CuNCs and HPLC assay using Bland–Altman analysis. | |
3.7 Cytotoxicity of GST-CuNCs in vitro
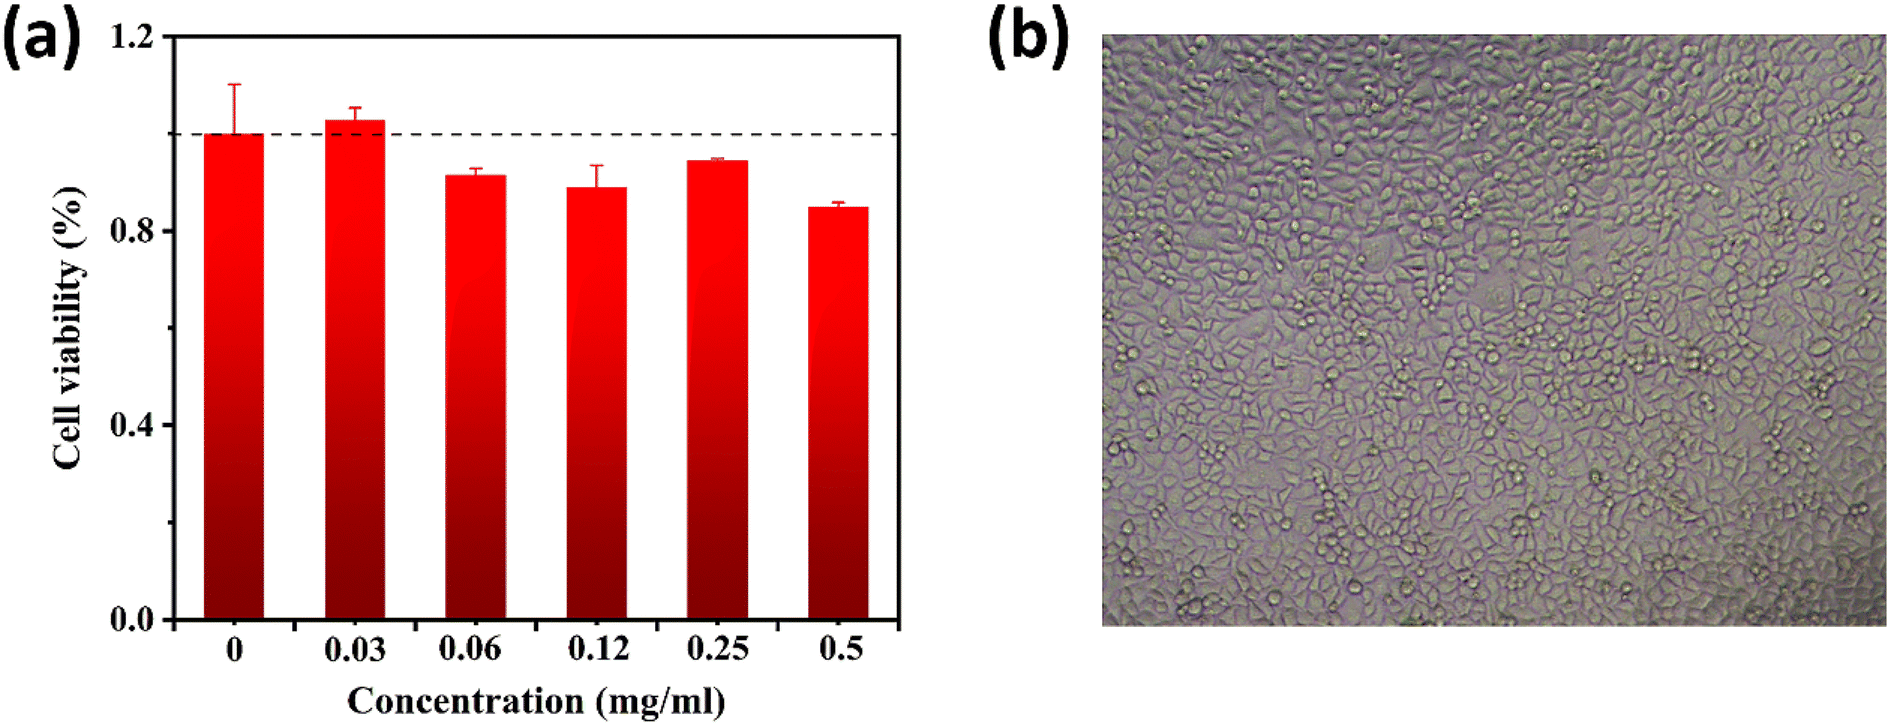
The cytotoxicity of GST-CuNCs was estimated by MTT assay. The cell viability rates remained over 90% within the tested concentration range and the cell morphology was also normal when the dosage was up to 0.5 mg mL−1 (Fig. 7). The experimental results showed that GST-CuNCs had no significant toxicity or adverse effects on HeLa cells under the experimental conditions. The excellent biocompatibility of GST-CuNCs was beneficial to apply in biological areas.
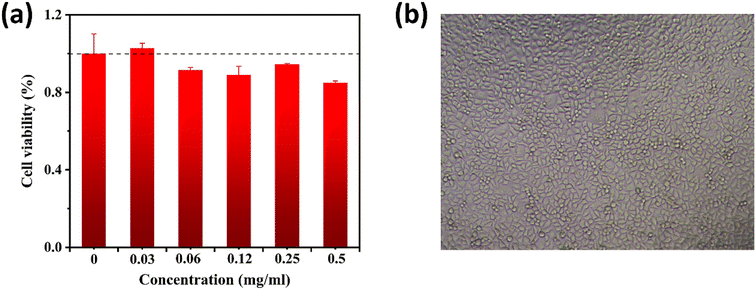 |
| | Fig. 7 The cytotoxicity of GST-CuNCs in vitro. (a) Cell viability of HeLa cells incubated with varying concentrations of GST-CuNCs based on the MTT Kit. (b) Cell morphology after incubation with GST-CuNCs for 24 h. | |
3.8 CTC detection in real samples
To further assess the practicality of the prepared GST-CuNCs as fluorescence sensors for detecting CTC in real samples, we managed to measure the CTC content in serum samples. The experimental results are presented in Table 2. According to the calibration curve, the recovery percentage of the assays ranged from 100.11–107.71%, which showed good performance and no significant interference in the serum samples. Therefore, the proposed sensing system was deemed reliable and feasible for quantitative monitoring of CTC in practical applications.
Table 2 Determination of CTC in serum samples using GST-CuNCsa
| Samples |
Added (μM) |
Recovered (μM) |
Average (μM) |
RSD (%) |
Recovery (%) |
| 1 |
2 |
3 |
|
RSD: relative standard deviation.
|
| Serum |
30 |
30.94 |
30.53 |
29.25 |
30.24 |
2.91 |
100.79 |
|
|
60 |
65.75 |
65.51 |
62.72 |
64.66 |
2.61 |
107.71 |
|
|
120 |
122.01 |
120.01 |
118.40 |
120.14 |
1.51 |
100.11 |
4 Conclusion
In summary, novel and water-soluble copper nanoclusters using GST as the template were first constructed in a facile one-pot way. The obtained GST-CuNCs exhibited fluorescence emission at 400 nm under 325 nm excitation. Surprisingly, the probe exhibited high selectivity and sensitivity in CTC detection based on the “turn-on” fluorescence response, which had been successfully adopted to detect the content of CTC in real serum samples with a satisfactory recovery value. Moreover, the nanoprobe possessed good biocompatibility and low cytotoxicity, serving as the basis for practical biological applications. In consequence, the present sensing strategy provided a simple, economical and convenient approach for their potential applications in biological and food safety monitoring fields.
Conflicts of interest
There are no conflicts to declare.
Acknowledgements
This work was supported by the projects of the National Natural Science Foundation of China (No. 22104065), the Natural Science Fund of Jiangsu Province in China (No. BK20200972), the Natural Science Foundation of the Jiangsu Higher Education Institutions of China (No. 20KJB150047 and 21KJB150024), the Jiangsu College Students' Innovation and Entrepreneurship Training Program (No. 202110304048Z and 202213993019Y), the Nantong Municipal Science and Technology Project (No. JC2019103), and the Large Instruments Open Foundation of Nantong University (No. KFJN2061 and KFJN2370). The authors would like to thank Shiyanjia Lab (https://www.shiyanjia.com) for the XPS and fluorescence lifetime characterization.
References
- K.-M. Lee, D. Yarbrough, M. M. Kozman, T. J. Herrman, J. Park, R. Wang and D. Kurouski, Food Control, 2020, 114, 107243 CrossRef CAS.
- S. C. Anderson, S. Subbiah, A. Gentles, D. Oliver, P. Stonum, T. A. Brooks and E. E. Smith, J. Chromatogr. B, 2018, 1092, 237–243 CrossRef CAS PubMed.
- M. Jeon and I. Rhee Paeng, Anal. Chim. Acta, 2008, 626, 180–185 CrossRef CAS PubMed.
- J. A. Rodriguez, J. Espinosa, K. Aguilar-Arteaga, I. S. Ibarra and J. M. Miranda, Microchim. Acta, 2010, 171, 407–413 CrossRef CAS.
- Y. Li, H. Wang, X. Liu, G. Zhao and Y. Sun, Environ. Sci. Pollut. Res. Int., 2016, 23, 13822–13831 CrossRef CAS PubMed.
- A. L. Cinquina, F. Longo, G. Anastasi, L. Giannetti and R. Cozzani, J. Chromatogr. A, 2003, 987, 227–233 CrossRef CAS PubMed.
- S. Shariati, Y. Yamini and A. Esrafili, J. Chromatogr. B, 2009, 877, 393–400 CrossRef CAS PubMed.
- N. Li, S. Han, C. Zhang, S. Lin, X. Sha and W. Hasi, Anal. Sci., 2020, 36, 935–940 CrossRef CAS PubMed.
- J. Zhou, G. C. Gerhardt, A. Baranski and R. Cassidy, J. Chromatogr. A, 1999, 839, 193–201 CrossRef CAS PubMed.
- Y. Chen, F. Zhao and B. Zeng, Talanta, 2022, 239, 123130 CrossRef CAS PubMed.
- Y. Baikeli, X. Mamat, F. He, X. Xin, Y. Li, H. A. Aisa and G. Hu, Ecotoxicol. Environ. Saf., 2020, 204, 111066 CrossRef CAS PubMed.
- Y. Chen and C. Sheng, Fuel, 2016, 184, 905–914 CrossRef CAS.
- Y.-S. Lee, C.-C. Hu and T.-C. Chiu, J. Environ. Chem. Eng., 2022, 10, 107413 CrossRef CAS.
- Y.-Q. Liang, X.-Y. Wu, J.-Y. Zeng, Y.-N. Wu, J.-P. Lai and H. Sun, Anal. Bioanal. Chem., 2022, 414, 3043–3055 CrossRef CAS PubMed.
- N. Xu, Y. Peng, M. Liu, J. Zhao, H. Yuan and H. Guo, IFAC-PapersOnLine, 2018, 51, 90–95 CrossRef.
- X. Wang and S. Zhang, Spectrochim. Acta, Part A, 2022, 281, 121588 CrossRef CAS PubMed.
- H. Chen, J. Chen, C. Yuan, L. Yu, M. Sun, D. Huang, S. Liu and S. Wang, Dyes Pigments, 2022, 208, 110887 CrossRef CAS.
- C. Zhang, X. Gao, W. Chen, M. He, Y. Yu, G. Gao and T. Sun, iScience, 2022, 25, 105022 CrossRef CAS PubMed.
- N. Xia and Z. Wu, Chem. Sci., 2020, 12, 2368–2380 RSC.
- Y. Guo, H. T. N. N. Amunyela, Y. Cheng, Y. Xie, H. Yu, W. Yao, H.-W. Li and H. Qian, Food Chem., 2021, 335, 127657 CrossRef CAS PubMed.
- S. Ding, C. Liu, D. Fu, G. Shi and A. Zhu, Anal. Chem., 2021, 93, 1779–1785 CrossRef CAS PubMed.
- Y. An, Y. Ren, M. Bick, A. Dudek, E. Hong-Wang Waworuntu, J. Tang, J. Chen and B. Chang, Biosens. Bioelectron., 2020, 154, 112078 CrossRef CAS PubMed.
- Z. Zhao and Y. Li, Colloids Surf., B, 2020, 195, 111244 CrossRef CAS PubMed.
- W.-F. Lai, W.-T. Wong and A. L. Rogach, Adv. Mater., 2020, 32, e1906872 CrossRef PubMed.
- S. Thammajinno, C. Buranachai, P. Kanatharana, P. Thavarungkul and C. Thammakhet-Buranachai, Spectrochim. Acta, Part A, 2022, 270, 120816 CrossRef CAS PubMed.
- J. Xu, H. Zhou, Y. Zhang, Y. Zhao, H. Yuan, X. He, Y. Wu and S. Zhang, J. Hazard. Mater., 2022, 428, 128158 CrossRef CAS PubMed.
- D.-Y. Fu, Y.-R. Xue, Y. Guo, Z. Qu, H.-W. Li, H. Wu and Y. Wu, Nanoscale, 2018, 10, 23141–23148 RSC.
- L. Cao, M. Zhou, J. Wang, Q. Zhu, T. Liu, S. Ding and D.-Y. Fu, ACS Appl. Nano Mater., 2022, 5, 11176–11184 CrossRef CAS.
- Z. Yan, Q. Niu, M. Mou, Y. Wu, X. Liu and S. Liao, J. Nanopart. Res., 2017, 19, 235 CrossRef.
- B. Lin, L. Fan, Z. Ying, J. Ge, X. Wang, T. Zhang, C. Dong, S. Shuang and M. S. Wong, Talanta, 2020, 208, 120279 CrossRef CAS PubMed.
- Q. Yu, J. Jiang, Z. Chen, C. Han, X. Zhang, S. Yang, P. Zhou and T. Deng, Sensor. Actuator. B Chem., 2022, 350, 130898 CrossRef CAS.
- E. P. O'Brien, B. R. Brooks and D. Thirumalai, J. Am. Chem. Soc., 2012, 134, 979–987 CrossRef PubMed.
- X. Hu, X. Mao, X. Zhang and Y. Huang, Sensor. Actuator. B Chem., 2017, 247, 312–318 CrossRef CAS.
- J.-Y. Ma, P.-C. Chen and H.-T. Chang, Nanotechnology, 2014, 25, 195502 CrossRef PubMed.
- X. Na, M. Lei, L. Hang Wei, L. Da-Yong and W. Yuqing, Mikrochim. Acta, 2018, 185, 294 CrossRef PubMed.
- W. Ping, W. Tun Hua and Z. Yong, Talanta, 2016, 146, 175–180 CrossRef PubMed.
- W. Zhang, X. Li, Q. Liu, G. Liu, G. Yue, Z. Yang, Y. Wang, H. Rao, Y. Chen, C. Lu and X. Wang, Nanotechnology, 2020, 31, 445501 CrossRef CAS PubMed.
- Y. Guo, Y. Hu, S. Chen, M. Guo, Y. Zhang, X. Han and S. Zhang, Surf. Colloid Sci., 2022, 634, 127962 CrossRef CAS.
- X.-S. Wang and S. Zhang, Spectrochim. Acta, Part A, 2022, 281, 121588 CrossRef CAS PubMed.
- Y. Liu, L. Zhu, Z. Luo and H. Tang, Sensor. Actuator. B Chem., 2013, 185, 438–444 CrossRef CAS.
- X. Chen, L. Zhao, X. Tian, S. Lian, Z. Huang and X. Chen, Talanta, 2014, 129, 26–31 CrossRef CAS PubMed.
- C. Long, B. Deng, S. Sun and S. Meng, Food Addit. Contam., 2017, 34, 24–31 CrossRef CAS PubMed.
- T. Zhou, L. Lin, M. Rong, Y. Jiang and X. Chen, Anal. Chem., 2013, 85, 9839–9844 CrossRef CAS PubMed.
- X. Mu, L. Qi, J. Qiao and H. Ma, Anal. Methods, 2014, 6, 6445–6451 RSC.
- Z. Li, S. Guo and C. Lu, Analyst, 2015, 140, 2719–2725 RSC.
- B.-Y. Han, X.-F. Hou, R.-C. Xiang, M.-B. Yu, Y. Li, T.-T. Peng and G.-H. He, Chinese J. Anal. Chem., 2017, 45, 23–27 CrossRef CAS.
- W.-X. Wang, Y. Wu and H.-W. Li, J. Colloid Interface Sci., 2017, 505, 577–584 CrossRef CAS PubMed.
- B. Li, X. Wang, X. Shen, W. Zhu, L. Xu and X. Zhou, J. Colloid Interface Sci., 2016, 467, 90–96 CrossRef CAS PubMed.
Footnote |
| † Electronic supplementary information (ESI) available: The fluorescence spectrum of GST-CuNCs synthesized under different conditions, the relative QY relevant results, the UV-vis spectrum of GST-CuNCs with various concentrations of CTC, chemical structural formulae of CTC and its analogues, comparison with other CTC detection approaches and templates, and table of lifetime and percentages. See DOI: https://doi.org/10.1039/d3na00577a |
|
| This journal is © The Royal Society of Chemistry 2024 |
Click here to see how this site uses Cookies. View our privacy policy here. 
 Open Access Article
 This Open Access Article is licensed under a Creative Commons Attribution-Non Commercial 3.0 Unported Licence
 *a and
Ding-Yi
Fu
*a and
Ding-Yi
Fu