DOI:
10.1039/D4MH00437J
(Communication)
Mater. Horiz., 2024,
11, 3613-3622
Signature of low-dimensional quasi-F centers in zirconium-rich electrides†
Received
14th April 2024
, Accepted 24th April 2024
First published on 29th April 2024
Abstract
Electrides are a class of materials consisting of non-nuclear excess electrons as quasi-F centers or Farbe centers within a positively charged lattice framework, and have significant applications in the fields of electrochemistry, spintronics, and electrode materials. Using first-principles quantum mechanical calculations, we have demonstrated exotic electronic structures of zirconium-rich electrides, Zr2X (X = O, Se, and Te), and obtained the quantitative values of charge transfer (oxidation states), and projected density of states associated with the localized quasi F-centers. The localized interstitial anionic electrons exhibit significant charge transfer values of approximately −1.88, −2.01, and −1.79 per atom in Zr2O, Zr2Se, and Zr2Te, respectively, and contribute actively in the electronic band structures and density of states at the Fermi level. From the 2D contour plot of the electron localization function (ELF), it has been predicted that the spatial distribution of the quasi-F centers stabilizes in the form of a one-dimensional pattern, with localized ELF sites interconnected with delocalized electron channels. Further, low work-function values of Zr2X, ranging from 2.7–3.4 eV, confirm the electride properties of these binary compounds, promising applications in electro-catalytic oxidations and anode materials in batteries. These unique electronic properties of anionic electrons free from nuclear binding in Zr2X have not been reported yet in the literature.
New concepts
This work, titled Signature of low-dimensional quasi-F centers in zirconium-rich electrides, presents our newly discovered electride materials amongst zirconium-rich alloys, where non-nuclear interstitial anionic electrons (IAEs), or quasi-F centers, are trapped within the positively charged lattice framework. We utilized quantum mechanical density functional theory (DFT), implemented in the standard Vienna ab initio simulation package (VASP) software program, to investigate the localization of such IAEs within the lattice void spaces. Our electronic-structure calculations confirm the existence and stability of a one-dimensional distribution of localized IAEs interconnected with delocalized electron channels, which is different from other ordinary compounds. Because of their exotic electron-rich properties, electrides have become intriguing materials for a myriad of theoretical and experimental researchers, who seek to understand their unique technological applications in superconductivity, catalytic oxidation, electron emission, reversible hydrogen storage and non-linear optics, and as anode materials in batteries. Indeed, the discovery of electrides is a challenge, and they are still an under-explored class of materials, with only a few electrides being known to date. Herein, we identified novel electride members in Zr2X (X = O, Se, and Te) via several computational insights, which have not been reported yet in the literature.
|
1 Introduction
Electrides are organic or inorganic materials characterized by a stoichiometric distribution of quasi-F centers (Farbe centers), commonly called color centers, which allow the materials to exhibit unique topological quantum states. A quasi-F center in an electride is a region where the anionic electron density is manifested as a non-nuclear interstitial particle within the positively charged lattice framework. Interstitial anionic electron (IAE) sites can be regarded as quasi-F centers, which act as pseudo-atomic structures inside the lattice crystal.1–5 These IAEs provide special properties to the materials, such as hyperpolarisabilities,6 high magnetic susceptibilities,7 highly variable conductivities,8 extremely low or ultra-low work functions,9,10 thermionic emission at cryogenic temperature,11 and very strong reducing abilities,12 based on the dimension, spatial distribution, and nature of the trapped IAEs. Given their unique structure and properties, electrides are suitable candidates for various potential applications, which include, but are not limited to, superconductivity,1 non-linear optical (NLO) response,6 spintronics,13 and electrocatalysis.3
IAEs demonstrate diversity in dimensionality (D) and belong to the classes of topological 0D (Ca3Pb),14 layered 1D (La8Sr2(SiO4)6),15 2D (Ca2N, Y2C)16 and 3D (Ca2C),17 which can further couple with magnetic dipole moments based on their degree of spin polarization. The exotic electronic and spin states of electrides vary with the shape and size of the trapping sites, nature of the open channel that connects the sites, and the spin directions of the IAEs. However, the underlying mechanism for their electromagnetic behavior is still an intriguing subject. Furthermore, one of the main drawbacks to the applicability and sufficient exploration of organic electrides is their degradation when the temperature is increased.3,18 Over the past two decades, the discovery of low-dimensional inorganic electride compounds has led to significant progress towards these directions.
The spin properties of IAEs are responsible for the magnetic stability in many electrides. The constituent elements in the cationic lattice frameworks of electrides are all paramagnetic, implying that the anionic electrons are responsible for the emergence of magnetism. From rigorous studies on diverse 2D electrides, it has been determined that the exceptional magnetic properties are associated with the localization degree of the IAEs in the 2D interlayer spaces.19 2D electrides such as [Y2C]2+·2e− and [Gd2C]2+·2e−, with strongly localized electrons at specific crystallographic sites, showed superparamagnetic or ferromagnetic behavior.20,21 Interestingly, the formation of a pure 2D quantum electron liquid (QEL) has been observed by exposing the localized IAEs on the surface of the outermost cationic layer in 2D [Gd2C]2+·2e−. The realization of this pure 2D QEL in a vacuum on the surface of the crystal confirms the expected exotic phases in the quantum regime with a stronger electron correlation.22 Also, in the 2D mixed cation [Y2−xGdxC]2+·2e− electride, an intrinsic magnetism of the interstitial electrons evolves via their direct exchange interaction within 2D space, showing an unprecedented ferrimagnetic spin-alignment.23 Further, it has been predicted that the strongly localized IAEs in potassium electride, under a high-pressure of about 20 GPa, exhibit a Stoner type instability, leading to ferromagnetism.24 Meanwhile, the indication of low work functions in electrides allows the effective transfer of anionic electrons to a material with a higher work function to enhance catalytic and electron emission properties.25,26 Recently, Chung et al. demonstrated a unique application of an electride in the synthesis of bare metal nanoparticles (NPs), such as Cu NPs, which exhibit ultrahigh oxidation resistance under ambient conditions. Additionally, growing Cu NPs on the surface of the electride [Gd2C]2+·2e− substantially reduces the work function of the Cu NPs to ∼3.2 eV, from 4.5 eV in Cu metal.27
The transition-metal (TM)-rich inorganic electrides, (TM)2X, which belong to group IV(B)–VI(A) in the periodic table, have been a matter of interest to many theoretical and experimental researchers because of their exclusive applications in building electrode materials for batteries and synthesizing ultra-durable electrocatalytic nanoparticles. This indicates the excellent chemical stability of TM-rich electrides in catalytic reactions and electronic devices. Yan et al. introduced Ti2O (space group p![[3 with combining macron]](https://www.rsc.org/images/entities/char_0033_0304.gif) m1) as an intrinsic 2D electride, labeled as MOene, which belongs to a novel family of MXenes based on transition-metal oxides. The anionic states in Ti2O MOene enable a very low diffusion barrier and large charge storage capacity, and it can be explored as an anode material of lithium- and sodium-ion batteries.28 Meanwhile, the development of a self-passivated [Hf2S]2+·2e− (space group p63/mmc) electride with persistent electrocatalytic characteristics presents a promising opportunity for a sustainable electride catalyst under reactive atmospheric conditions. The chemical stability was successfully demonstrated in the Hf-based electride, originating from the double amorphous layer structure as the key factor of the self-passivation mechanism; this allows one to tailor numerous surface electro-chemical properties in compounds composed of ubiquitous elements.29
m1) as an intrinsic 2D electride, labeled as MOene, which belongs to a novel family of MXenes based on transition-metal oxides. The anionic states in Ti2O MOene enable a very low diffusion barrier and large charge storage capacity, and it can be explored as an anode material of lithium- and sodium-ion batteries.28 Meanwhile, the development of a self-passivated [Hf2S]2+·2e− (space group p63/mmc) electride with persistent electrocatalytic characteristics presents a promising opportunity for a sustainable electride catalyst under reactive atmospheric conditions. The chemical stability was successfully demonstrated in the Hf-based electride, originating from the double amorphous layer structure as the key factor of the self-passivation mechanism; this allows one to tailor numerous surface electro-chemical properties in compounds composed of ubiquitous elements.29
While 2D electrides have shown promising opportunities in terms of IAE properties, more opportunities can be found in the discovery of new unknown 1D electrides. In this study, we carried out the theoretical exploration of novel 1D, non-magnetic electrides in zirconium (Zr)-rich mono-oxides and mono-chalcogenides and investigated their electronic structures through first-principles calculations with their known lattice symmetries. The identified electride nature of Hf2S, Ti2O, Ti2S, and Zr2S compounds from the previous theoretical and experimental studies,29–31 assisted in exploring possibilities of electride nature in Zr2X (where X = O, Se, and Te), where excess anionic electrons or quasi-F centers are distributed in 1D fashion at the interstitial cavities. The crystallographic sites of the anionic electrons have been visualized by calculating electron localization functions (ELFs).32,33 The charge occupation of these anionic electrons is quantified by means of Bader charge analysis,34 showing a distinct localization degree at different Wyckoff positions.
2 Computational method
DFT calculations were performed using the projector augmented wave (PAW) method within the generalized gradient approximation (GGA) as implemented in the Vienna ab initio simulation package (VASP) to investigate the structural and electronic properties of the novel 1D electrides, Zr2X, where X = O, Se and Te. The pseudopotential valence electrons for Zr and X were taken as 4s24p64d25s2 and 2s22p4, respectively. The calculations employed the Perdew–Burke–Ernzerhoff (PBE) exchange–correlation functional. A plane-wave energy cut-off of 525 eV was used for all the calculations. All the unit cells were fully relaxed, including the lattice vectors and atom positions, during the structural optimization using the conjugated gradient method until the total energy was converged numerically to less than 10−5 eV per unit cell and the force on each atom was less than 10−2 eV Å−1. The Brillouin zone integration for the geometrical relaxations was performed using gamma-centered k-meshes of 10 × 10 × 4, 8 × 6 × 6, and 8 × 6 × 4 for Zr2O, Zr2Se, and Zr2Te, respectively. All the calculations were spin polarized with a smearing width of 0.05 eV. Empty spheres (pseudo atoms) with an average Wigner–Seitz radius (RWS) of 1.36 Å, 1.41 Å, and 1.39 Å, calculated approximately using the volume of the Bader basin, were taken for Zr2O, Zr2Se and Zr2Te, respectively, to ascertain the localization and contribution of IAEs at the Fermi level. Here, the positions of the IAEs, annotated as empty spheres (E) with radius RWS, were determined semi-empirically in the unit cell by examining the electron localization function (ELF) regions separated from atoms and their bonds. The empty spheres were positioned in such a way that they lay exactly at the center of the localized IAE, or at the position near the vicinity of the dispersed interstitial maxima interconnected with delocalized minima. Altogether, 12, 14, and 16 empty spheres were determined within the unit cell of Zr2O, Zr2Se, and Zr2Te, respectively, whose Wyckoff positions are given in Table SI–III (ESI†). The plots for all the geometrical structures and ELFs were produced using the VESTA code.35 The Fermi surface construction was performed using the program IFermi.36
Phonon calculations were performed using the method described in the PHON program,37 in which the force-constant matrices and phonon frequencies were calculated using the small-displacement method. The unit cell size, consisting of 36 atoms in Zr2Se and Zr2Te, was sufficient to achieve phonon accuracy with no imaginary mode of vibrations. However, in Zr2O, the unit cell size was not sufficient to get phonon convergence. So, the supercell size of 2 × 2 × 2, consisting of 144 atoms, was taken to get rid of imaginary frequencies in Zr2O. During the calculation of phonon frequencies, the convergences of total energies and the maximum forces of ionic relaxation were set to be less than 10−6 eV per atom and 10−2 eV Å−1, respectively.
3 Results and discussion
3.1 Crystal structures of Zr2X
The geometrical structures of the most stable, zirconium-rich Zr2X alloys were retrieved from the Materials Project database,38 where the transition metal Zr and X (O, Se, and Te) atoms are connected via strong covalent bonding with a quasi-layered structure. The crystal structures of Zr2Se and Zr2Te have been experimentally synthesized in orthorhombic symmetry with space groups Pnnm (no. 58) and Pnma (no. 62), respectively;39,40 however, the crystal structure of Zr2O has not been determined yet via experimental synthesis. In addition, the exotic electride properties of Zr2X (X = O, Se, and Te) are still unknown in the field of materials science.
The unit cell of Zr2O used in this study belongs to space group P312 (no. 149) and is similar to the beta-vanadium nitride (β-V2N) type. It comprises 6 formula units. There are two inequivalent Zr sites. In both the Zr sites, Zr is bonded in a distorted T-shaped geometry to three O atoms. There are five inequivalent O sites. In the O sites, O is bonded to six Zr atoms to form an octahedron. The crystal structure of Zr2Se has been found to be iso-structural with Ti2S, and Zr2S. The unit cell comprises 12 formula units of Zr2Se. The crystal structure of Zr2Se is composed of nine inequivalent sites, six Zr and three Se. Similarly, the binary Zr2Te is isotypic with Sc2Te. The unit cell structure of Zr2Te differs significantly from its congeners Zr2O and Zr2Se, and comprises 12 formula units of Zr2Te. The structure is composed of nine crystallographically inequivalent atoms that include six Zr, and three Te. The calculated lattice parameters (a, b, and c), and volumes (V) of the Zr2X compounds are presented in Table 1. The geometrical structures of Zr2X are represented in Fig. 1. Our calculated values of the lattice parameters for Zr2Se and Zr2Te alloys agree well with the available experimental data.
Table 1 Calculated lattice parameters (a, b, and c) and volumes (V) of Zr2X, where X = (O, Se, and Te). The numbers in brackets alongside represent the experimentally determined values of the lattice parameters40,41
| Properties |
Zr2O |
Zr2Se |
Zr2Te |
|
a (Å) |
5.660 |
3.632 (3.602) |
3.854 (3.824) |
|
b (Å) |
5.660 |
12.717 (12.640) |
10.762 (10.656) |
|
c (Å) |
10.476 |
15.859 (15.797) |
20.053 (19.950) |
|
V (A3) |
290.00 |
732.00 |
830.45 |
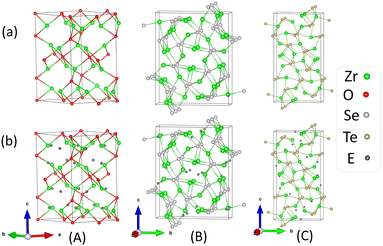 |
| | Fig. 1 Diagrams representing the relaxed geometrical structures of Zr2X, (a) without the inclusion of empty spheres, and (b) with the inclusion of empty spheres, for (A) Zr2O, (B) Zr2Se, and (C) Zr2Te. | |
3.2 Calculation of formation enthalpy, ΔH
We predicted the formation enthalpy (ΔH), in eV per atom, for Zr2X at 0.0 K and 0.0 GPa. Numerically, the ΔH of Zr2O is determined using eqn (1), whereas the ΔHs for Zr2Se and Zr2Te are determined using eqn (2).| |  | (1) |
| | 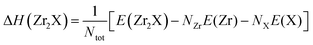 | (2) |
where E(Zr2O), and E(Zr2X) (X = Se, Te) are the calculated total equilibrium energies of Zr2O and Zr2X for their respective unit cells in bulk phases. E(Zr) and E(X) are the energies, in eV per atom, of the corresponding bulk structures of Zr and X, in which the stable hexagonal structure of Zr (space group P63/mmc, no. 194), monoclinic structure of Se (space group P21/c, no. 14), and trigonal structure of Te (space group P3121, no. 152) were adopted. Here, E(O2) represents the energy of an isolated O2 molecule in the ferromagnetic state, enclosed within a cubic box size of 20 Å. NZr, NO, and NX are the numbers of Zr, O, and X atoms, and Ntot is the total number of atoms including both Zr and O (or X) in the unit cells of Zr2O, and Zr2X. The formation enthalpies of Zr2O (space group, P312), Zr2Se (space group, Pnnm), and Zr2Te (space group, Pnma) were calculated to be −1.810 eV per atom, −0.942 eV per atom, and −0.650 eV per atom, respectively. The negative values of ΔH suggest that the formation reactions of Zr2X electrides are exothermic and they are stable at ambient pressure and temperature.
3.3 Phase stability in Zr2O
Some disputed facts have emerged regarding the theoretical prediction of the ground-state structure of Zr2O. Zhang et al. mentioned that Hashimoto's experimentally reported structure of zirconium oxide is unstable and energetically transforms to an identical P1m-Zr2O.42–44 However, it needs to be made clear that Hashimoto synthesized zirconium–oxygen (Zr–O) alloys in an oxygen-rich regime, rather than in a zirconium-rich regime, and obtained his ordered structure of Zr–O in the P312 space group. Owing to this observation, it can be realized that the Zr–O system can be stabilized in the P312 space group. In this work, we found that the zirconium-rich Zr–O system, hereby referred to as Zr2O, exhibits a stable energy configuration in the P312 space group. The calculated ΔH of the P312 structure is lower than that of the P1m structure by 0.038 eV per atom, indicating that Zr2O in the P312 space group is more stable than that in the P1m space group, contradicting the structure predicted by Zhang et al. To elucidate the ground-state geometrical structure of Zr2O, we were further interested in exploring its phase stability. The formation enthalpy of Zr2O in the P312 space group has been compared with that in other space groups. The possible different phases of Zr2O chosen are: (A) trigonal with space group P312 (no. 149) of the β-V2N type, (B) trigonal with space group P1m (no. 162) of the V2N type, (C) trigonal with space group Pm1 (no. 164) of the titanium oxide (Ti2O) type, (D) hexagonal with space group P63/mmc (no. 194) of the hafnium sulphide (Hf2S) type, and (E) cubic with space group Pnm (no. 224) of the cuprous oxide (Cu2O) type. Their relaxed geometrical structures are shown in Fig. S1 (ESI†). The calculated values of the formation enthalpy (ΔH) for the five different phases of Zr2O in eV per atom are shown in Fig. 2 and their values are annotated in Table SIV (ESI†), along with their calculated lattice parameters (a, b, and c). The calculated values of formation enthalpy indicate that Zr2O in space group P312 is the most stable and that in space group Pnm is the least stable among the five different possible configurations. Since the most stable configuration of Zr2O is in the P312 space group, we carry out our further calculations for Zr2O in this phase, unless otherwise stated.
 |
| | Fig. 2 Calculated values of formation enthalpy, ΔH, for the five different phases of Zr2O. | |
3.4 Electronic properties
The electronic properties of the 1D quasi-F center electrides under study have been explained in terms of electron localization functions (ELFs) formulated by Becke and Edgecombe,45,47 Bader charge analysis,46 total and projected density of states (DOS), conduction electron density (CED), and analysis of Fermi surfaces.
3.4.1 Electron localization functions (ELFs).
An ELF, by definition, is the probability of finding an electron in the neighborhood of another reference electron with the same spin, which quantitatively gives a measurement of the Pauli repulsion. The explicit formula for the ELF is given by eqn (3).| |  | (3) |
where  . Here,
  determines the curvature of the electron pair density for electrons of identical spins, ρ(
![[r with combining right harpoon above (vector)]](https://www.rsc.org/images/entities/i_char_0072_20d1.gif) ) the electron density at , and
) the electron density at , and  the value of
  in a homogeneous electron gas with density ρ. The ELF has values that lie between 0.0 and 1.0, where ELF = 1.0 represents perfect localization of electrons, as in bonding pairs or lone pairs, ELF = 0.5 represents a uniform electron gas of the same density, and ELF < 0.5 represents electrons that are delocalized, such as in regions between two electron shells (or strongly localized areas). In crystallographic visualization, ELFs assist in finding missing anions from the solid-state structure by analyzing the localized electron density.32,47 The 3D iso-surfaces (Fig. 3) and 2D contour plots (Fig. 4) of the ELFs for each Zr2X (X = O, Se, and Te) compound illustrate the localization of anionic electrons at different spatial positions. Zr2O is stabilized as an electride material in all the different phases under study, as shown in the 3D iso-surface plot (Fig. S2, ESI†). To get the 2D ELF map, a set of specific planes were selected to visualize the distribution of localized and delocalized IAEs in the crystal structure. We have chosen the ELF values from 0.00 (minimum ELF) and 0.70 (maximum ELF), represented by blue and red colors, respectively, in the color scale bar to get a better insight into the spatial distribution of the IAEs. The localized IAEs are denoted by the symbol E. The anionic electrons are arranged in a one-dimensional pattern for all the Zr2X compounds, with the localized IAEs interconnected with delocalized electron channels while viewing along the (110) plane in Zr2O, and along the (010) plane in Zr2Se and Zr2Te. Additionally, we also obtained the localized periodic arrangements of dumb-bell-shaped and hammer-shaped structures serving stoichiometrically as anions while viewing through the (100) plane in Zr2Se and Zr2Te, respectively, as indicated in the 2D contour plots of their ELFs, as shown in Fig. 4(B) and (C). These dumb-bell- and hammer-shaped IAEs can be visualized as quasi-3D anionic particles when the iso-surface value of the ELF is gradually lowered to a value less than 0.5, indicating the contribution from the delocalized electrons in their formation. The bonding analysis based on the ELF suggests that the large extent of the ELF around the X atoms signifies the sharing of charges between the zirconium (Zr) and chalcogenide atoms, indicating the covalent nature of the bonding between them.
 |
| | Fig. 3 Diagrams representing 3D iso-surface plots of the ELFs with an iso-surface value of 0.6, showing spatial positions of IAEs with empty spheres (black spheres) for (a) Zr2O, (b) Zr2Se, and (c) Zr2Te. | |
 |
| | Fig. 4 2D contour plots of ELF maps representing the localization of IAEs along the specified planes at E-like sites represented by black dotted loops, for (A) Zr2O, (B) Zr2Se, and (C) Zr2Te. The 2D rectangular shapes with solid black lines represent the size of the unit cell. | |
3.4.2 Bader charge analysis.
The Bader method considers the zero-flux surface of charge density to divide the molecular space into atomic volumes known as Bader basins. In electrides, the volume of the Bader basin around IAEs where the electron density is maximum, known as a non-nuclear attractor (NNA), is estimated.48 Here, the Bader charge analysis was carried out using the pre-converged total charge density with reference to the electron localization function (ELF). Usually, the Bader charge is calculated using all electrons or the total charge density of the atomic species. However, in such electride systems, the Bader charge analysis performed in combination with the ELF will give a more accurate description of the charge transfer or oxidation state (O.S.), comparable to experiment. The charge transfer or O.S. is the difference between the number of pseudo-potential valence electrons (NVE) and the Bader charge (QB) enclosed within a Bader basin of radius RWS.
Mathematically, O.S. = NVE − QB. The contributions from the Bader charge analysis in Table 2 confirm the substantial electron accumulation in the region of the quasi-F centers (E). This can be illustrated by their significant negative value of O.S. in the order of −1.88, −2.01, and −1.79 per pseudo-atom (empty sphere) for Zr2O, Zr2Se, and Zr2Te, respectively. The calculated value of O.S. for cation Zr, anion X (O, Se, and Te), and IAE, denoted by the symbol E, is also in good agreement with previous work. From the experimental and theoretical study performed by Kang and Thapa et al.,31 for IVB–VIA electride compounds enriched with transition metals, the IVB cations (Ti, Zr, and Hf) exist in the +2.0 O.S., which corroborates our value for Zr ions in Zr2X. However, for Zr2O, we found the electronegativity of the oxygen atom is slightly lower compared to the other anions (Se and Te), which indicates the distribution of ionic character between the cation and delocalized interstitial anionic electrons.
Table 2 Bader charge analysis to get the average Bader charge distribution (QB) and charge transfer or oxidation state (O.S.) for atomic species of Zr2X, where X = O, Se, and Te, with reference to the ELF
| Zr2X (X = O, Se, Te) |
Atoms |
N
VE
|
Q
B with ref. to-ELF |
O.S. |
| Zr2O |
Zr |
12 |
9.39 |
+2.61 |
| O |
6 |
4.55 |
−1.46 |
| E |
0 |
1.88 |
−1.88 |
|
|
| Zr2Se |
Zr |
12 |
9.81 |
+2.25 |
| S |
6 |
3.86 |
−2.14 |
| E |
0 |
2.01 |
−2.01 |
|
|
| Zr2Te |
Zr |
12 |
9.61 |
+2.39 |
| Te |
6 |
3.60 |
−2.40 |
| E |
0 |
1.79 |
−1.79 |
3.4.3 Electronic density of states (DOS) and band structure.
The density of states (DOS), the number of states per interval of energy available to be occupied by the electrons, has been formulated for degenerate spin up (↑) and spin down (↓) electrons, as in the non-spin polarized material, using eqn (4):| |  | (4) |
where σ, and εk are the width of the spectral peak and the energy of the molecular orbitals with orbital index k, respectively. The total and projected DOS (Fig. 5), as well as the electronic band structures (Fig. 6), have been calculated for all the Zr2X electrides, attempting to observe the contribution of the IAEs at the Fermi level (EF). Noticeably, there is a significant contribution in the DOS, higher than the host anions at EF, from the IAEs (denoted by the symbol E). Since the valence band maximum (VBM) and conduction band minimum (CBM) overlap at the Fermi level, these materials exhibit purely metallic properties. From the orbital projected DOS, one can observe the significant contributions of Zr-d and X-p orbitals at the Fermi level. There also exists a strong hybridization between the Zr-d and X-p orbitals, which is the cause of the covalent bonding between them. Because of the large contribution of the valence d orbitals of Zr atoms at EF, it critically affects the physical and chemical properties of Zr2X, influencing the charge localizations on the IAEs. The contributions of IAEs at the Fermi level are also demonstrated by the 2D contour plot of conduction electron density (CED), as shown in Fig. 7. In the CED map, the contribution from cation Zr near the Fermi level (EF), −1.0 eV < E − EF < 0.0 eV, is maximum compared to that from other atoms. There are non-uniform, but regular, distributions of localized anionic electrons near the EF. In the color bar scale of the CED map, the maximum and minimum localizations of electrons due to orbital contributions near EF are represented by red and blue colors, respectively.
 |
| | Fig. 5 Diagram representing (a) total density of states (TDOS) and atom projected DOS, (b) orbitals (s, p, d) projected DOS in Zr atom, and (c) orbitals (s, p) projected dos in X (O, Se, and Te) atoms in (A) Zr2O, (B) Zr2Se, and (C) Zr2Te. Here, the vertical dotted lines (orange color) along the energy axis represent the Fermi level. The symbol E represents the contribution in the DOS from IAEs. | |
 |
| | Fig. 6 Diagrams representing the total and atom projected electronic band structures in (A) Zr2O, (B) Zr2Se, and (C) Zr2Te. Here, the horizontal dotted lines (orange color) along the energy axis represent the Fermi level. The symbol E represents the contribution in the electronic band structure from IAEs. | |
 |
| | Fig. 7 2D contour plots of CED (−1.0 eV < E − EF < 0.0 eV) along the specified planes, showing localization of IAEs at E-like sites denoted by black dotted loops for (A) Zr2O, (B) Zr2Se, and (C) Zr2Te. The 2D rectangular shape with solid black lines represent the size of the unit cells. | |
To determine the quantum topological effects in Zr2X, we calculated the Fermi surfaces of the bulk structures of Zr2O (space group, P312), Zr2Se (space group, Pnnm), and Zr2Te (space group, Pnma) at the 3D and 2D limits for the fist Brillouin zone (BZ). A slice through the (001) plane that passes through the center of the BZ (kz = 0) was generated to get the constant energy contours in the 2D representation. According to Fermi liquid theory, the significance of the Fermi surface relies on explaining the low-energy physics for the weakly interacting Fermions. Here, the Fermi surfaces of Zr2X (X = O, Se, and Te) originate from the partially filled Zr-d orbitals with some contribution from the X-p orbitals; however, the fully filled Zr-p and s orbitals do not contribute significantly to the electronic bands near the Fermi level. The d-band character of Zr ensures the conducting properties of Zr2X and a Fermi velocity ∼4 × 10⁵ m s−1, as demonstrated in Fig. 8. We observed the varying sizes and a number of Fermi pockets, including electron pockets (EPs) and hole pockets (HPs), characterized by m* > 0 and m* < 0, along a high-symmetry path in the first Brillouin zone, where m* is effective mass of quasi-particles. The Fermi surface of Zr2O is characterized by the existence of six EPs around the zone center along the Γ–K path, and around H. In the case of Zr2Se, there exist two small concentric HPs around the Γ point, and a large size EP around S at the corner of the first BZ. Similarly, the appearance of two small HPs on either side of the zone center along Γ–Y represents the characteristic Fermi system in Zr2Te. The evolution of such Fermi pockets sheds light on the hidden low-energy physical properties, and various topological quantum states due to enhanced carrier mobilities in Zr2X.
 |
| | Fig. 8 Fermi surfaces of Zr2X in (A) 3D and (B) 2D regimes for (a) Zr2O, (b) Zr2Se, and (c) Zr2Te, constructed within the first Brillouin zone. The color scale bar represents the magnitude of Fermi velocity in the Fermi surface. | |
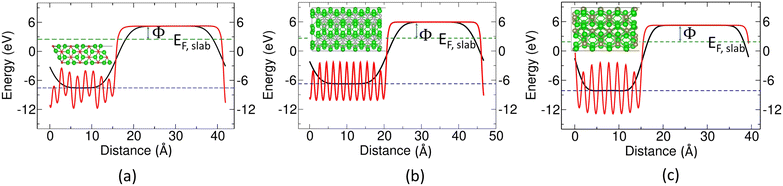
3.4.4 Computation of work function (Φ).
By definition, the work function (Φ) is the minimum energy required to remove an electron from the bulk of the material through a surface to an infinite distance. In this work, we calculated the work functions of Zr2X following the most favored cleavage surface using two different methods. The Hartree terms of the electrostatic potential are considered, to avoid a long tail in the vacuum region from exchange–correlation effects in the full Kohn–Sham potential. Eqn (5) represents method I, where both the potential in the vacuum region (Vvac) and Fermi energy (EF) are derived from the same self-consistent calculation. Since the work function is dependent on the thickness of the slab and the vacuum size along the direction normal to the cleavage surface, we have chosen a sufficiently large vacuum length and slab thickness to achieve stability in Vvac and EF. Therefore, a slab of thickness more than 8 layers in each case was selected, with a vacuum size of ∼26 Å, in order to safely avoid spurious interaction between the two adjacent slabs.A correction to eqn (5) has been proposed by Fall et al. for a finite-size slab exhibiting the quantum size effect (QSE). This technique decomposes the work function using method II into separate bulk and surface contributions. The electrostatic potentials in the vacuum (Vvac) and the interior of the slab (Vslab,interior) are computed using the same supercell model of the slab, and a separate bulk calculation is used to evaluate the Fermi level of the bulk (EF,bulk) along with the average bulk potential (Vmacrobulk). Using the interior electrostatic potential from each calculation as a reference, the bulk-corrected work function is calculated using eqn (6).41| | | Φ = ΔV + Vmacrobulk − EF,bulk | (6) |
where ΔV = Vvac − Vslab,interior, and Vmacrobulk = 0.0 eV. Eqn (6) can also be expressed as:| |  | (7) |
where  .
.
The calculated values of the Fermi levels (EF,slab and  ) to calculate the work functions (Φ) for Zr2X (where X = O, Se, and Te) along the (100) plane are annotated in Table 3. The diagrams representing the methods to calculate Φ are given in Fig. 9. The calculated values of the work functions for Zr2X are also compared with that of an atomically clean zirconium surface with space group P63/mmc. The theoretically obtained values for Zr metal are 4.173 eV (method I) and 4.249 eV (method II), which lie well within the experimental range (3.70 eV to 4.33 eV).49 The diagram representing the calculated value of Φ in Zr metal is shown in Fig. S5 (ESI†). The predicted reduced work functions of these electrides confirm the potential applicability of these electrides in electrocatalysis and electron emission.
Table 3 Calculated values of the work function (Φ) in eV along the (100) plane in Zr2X, where X = O, Se, and Te
| Zr2X |
E
F,slab (eV) |

|
Work function (Φ) |
| Method I |
Method II |
| Zr2O |
2.491 |
2.539 |
2.701 |
2.653 |
| Zr2Se |
1.751 |
2.645 |
3.319 |
3.313 |
| Zr2Te |
1.875 |
1.888 |
3.384 |
3.371 |
 |
| | Fig. 9 Diagram representing calculation of work functions along the (100) plane in (a) Zr2O, (b) Zr2Se, and (c) Zr2Te. The solid red and black lines represent the planar average and macroscopic average, respectively, over a plane perpendicular to the crystal axis. The green and blue dashed lines represent the Fermi energy of the slab (EF,slab) and the average electrostatic potential of Vslab,interior, respectively. | |
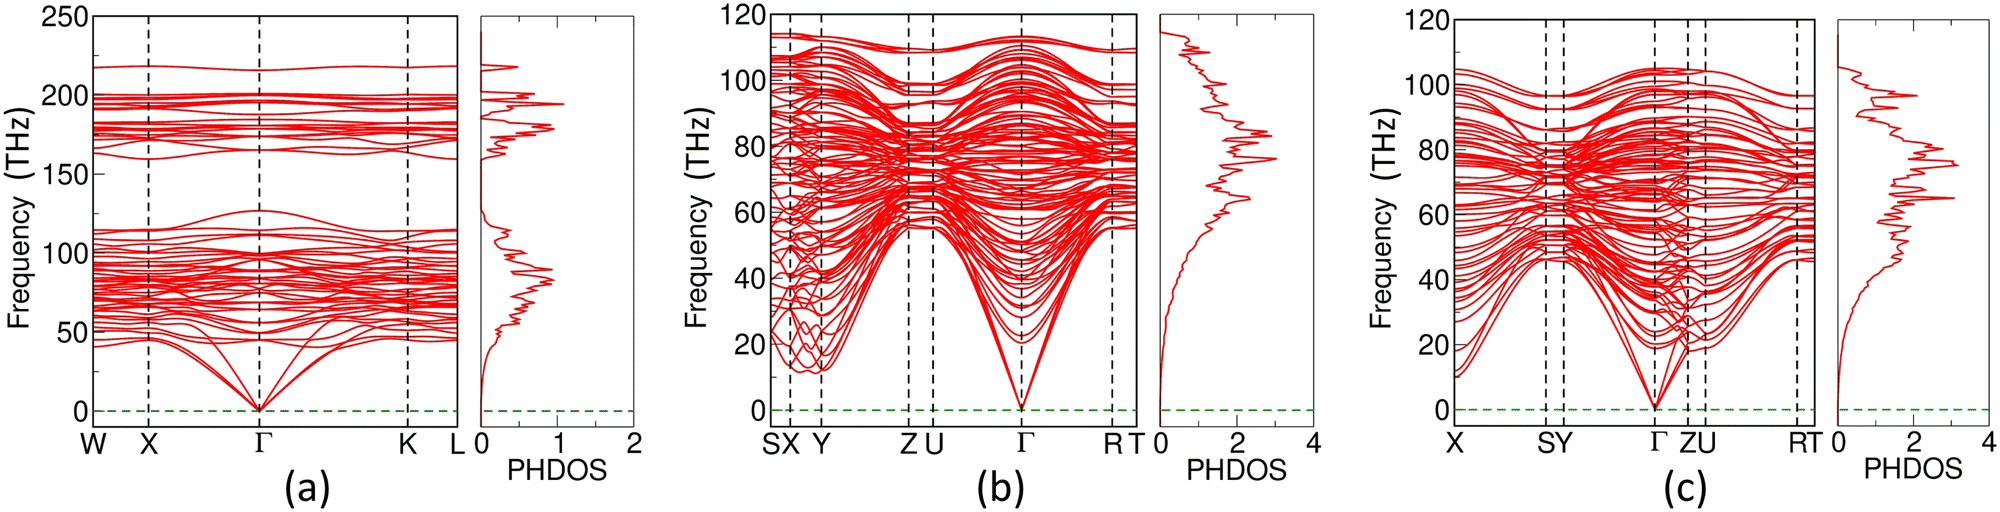
3.5 Phonon dispersion curves and phonon density of states
We computed the phonon dispersion curves (PHDCs) and phonon density of states (PHDOS) to validate the dynamical stability of Zr2X (Fig. 10). The PHDCs are plotted along the high-symmetry points of irreducible BZ boundaries. The three acoustic modes are triply degenerate at the Γ point. The computed vibrational frequencies throughout the BZ do not show any imaginary component, validating the dynamical stability of the electrides under study. There is no gap between the acoustic and optical phonons, which signifies an easy pathway for optical phonons to decay into acoustic phonons. However, the intra-band separation of 34.14 THz between 125.95 THz and 160.09 THz in the optical mode of Zr2O facilitates the delayed thermalization of hot charge carriers.50
 |
| | Fig. 10 Diagram representing phonon dispersion curves (PHDCs) and phonon density of states (PHDOS) for (a) Zr2O, (b) Zr2Se, and (c) Zr2Te. | |
4 Conclusion
Using first-principles density functional theory, we have investigated the structural and electronic properties of zirconium-rich Zr2X (X = O, Se,and Te) alloys, and predicted their electride nature. The compounds Zr2Se, and Zr2Te are experimentally synthesized in their stable crystal structures with space groups Pnnm and Pnma, respectively; however, Zr2O has not been obtained experimentally in its stable form. Our study bridges the gap in the theoretical prediction of the ground-state geometry of Zr2O, which was not clear in previous reports.15,43,51 Herein, we reported the stable geometry of Zr2O in the P312 space group and provided the synthesis route to the experimental group. Further, a few theoretical and experimental studies have been performed on these materials regarding their crystal structure, optical properties, and mechanical strength; however, their exotic electronic nature with electride properties has not been declared yet. In this paper, we demonstrated by means of high-throughput computational screening that these materials exhibit electride properties with localized quasi-F centers or interstitial anionic electrons (IAEs) in a one-dimensional fashion. We confirmed the electride nature of Zr2X via (a) electron localization functions (ELFs), which show the degree of localization of quasi-F centers or non-nuclear anionic electrons separated from bonds and atoms, (b) significant charge transfer values on the order of −1.88 (in Zr2O), −2.01 (in Zr2Se), and −1.79 (in Zr2Te), as determined from Bader charge analysis, (c) atomic-level contributions of IAEs near the Fermi level, from projected density of states and electronic band structures, and (d) the extremely low work function value of ∼2.70 eV for Zr2O, and ultra-low work functions of ∼3.32 eV and ∼3.38 eV for Zr2Se and Zr2Te, respectively. This theoretical evidence provides reliable information to demonstrate the electride properties of these materials. The existence of electron and hole pockets near the vicinity of EF at the zone center determines the topological quantum states in such materials due to enhanced charge carrier mobilities. The calculated values of formation enthalpy, and the phonon dispersion curves with the absence of imaginary modes of vibrations, confirm their thermodynamical stabilities. The peculiar electride nature of these materials makes them suitable candidates for various applications, viz. anode materials in batteries, superconductivity, and hydrogen storage. Additionally, a combined system of metal NPs and electrides has become of special interest as a potential platform for catalytic reactions, enhanced by an efficient growth of such metal NPs on the electride surface.27 Our DFT predicted results for Zr2X will serve as an intriguing topic for other experimental and theoretical researchers to identify the next generation of technological applications related to the electron transfer abilities of electrides. Further, an exploration regarding the optical activity of such electrides is highly desirable to investigate their emission properties, and the chromatic change in the lattice crystal contributed by such quasi-F centers or localized IAEs.52
Author contributions
D. T. conceptualized the project, performed DFT calculations, interpreted data, and wrote the original draft of the manuscript. S. B. S. delivered the DFT results, performed graphical visualization, and edited and wrote the manuscript. D. A., D. K., and S. K. were involved in scientific discussions, and contributed to reviewing, writing, and finalizing the manuscript.
Conflicts of interest
The authors declare no competing interest.
Acknowledgements
We would like to acknowledge the Center for Computationally Assisted Science and Technology (CCAST), North Dakota State University, for providing computational resources to carry out this study. The authors S. K. and D. K. acknowledge the National Science Foundation under grant no. 2004197 for the investigation of the charge-localization and charge-transfer properties of low-dimensional materials and interfaces.
Notes and references
- H. Hosono and M. Kitano, Chem. Rev., 2021, 121, 3121–3185 CrossRef CAS PubMed.
- S. G. Dale, A. Otero-de-la Roza and E. R. Johnson, Phys. Chem. Chem. Phys., 2014, 16, 14584–14593 RSC.
- S. Zhao, E. Kan and Z. Li, Wiley Interdiscip. Rev.: Comput. Mol. Sci., 2016, 6, 430–440 CAS.
- J. L. Dye, Science, 1990, 247, 663–668 CrossRef CAS PubMed.
- K. Lee, S. W. Kim, Y. Toda, S. Matsuishi and H. Hosono, Nature, 2013, 494, 336–340 CrossRef CAS PubMed.
- A. K. Srivastava and N. Misra, Mol. Simul., 2016, 42, 981–985 CrossRef CAS.
- D. Issa, A. Ellaboudy, R. Janakiraman and J. L. Dye, J. Phys. Chem., 1984, 88, 3847–3851 CrossRef CAS.
- J. E. Hendrickson, W. P. Pratt, R. C. Phillips and J. L. Dye, J. Phys. Chem. B, 1998, 102, 3917–3926 CrossRef CAS.
- W. Meng, X. Zhang, Y. Liu, X. Dai, H. Gao and G. Liu, J. Mater. Chem. C, 2021, 9, 15477–15487 RSC.
- C. Wang, M. Xu, K. T. Butler and L. A. Burton, Phys. Chem. Chem. Phys., 2022, 24, 8854–8858 RSC.
- R. C. Phillips, W. P. Pratt and J. L. Dye, Chem. Mater., 2000, 12, 3642–3647 CrossRef CAS.
- Y. J. Kim, S. M. Kim, E. J. Cho, H. Hosono, J. W. Yang and S. W. Kim, Chem. Sci., 2015, 6, 3577–3581 RSC.
- X. Sui, J. Wang and W. Duan, J. Phys. Chem. C, 2019, 123, 5003–5009 CrossRef CAS.
- X. Zhang, R. Guo, L. Jin, X. Dai and G. Liu, J. Mater. Chem. C, 2018, 6, 575–581 RSC.
- Y. Zhang, Z. Xiao, T. Kamiya and H. Hosono, J. Phys. Chem. Lett., 2015, 6, 4966–4971 CrossRef CAS PubMed.
- T. Inoshita, S. Takemoto, T. Tada and H. Hosono, Phys. Rev. B, 2017, 95, 165430 CrossRef.
- Y. Zhang, H. Wang, Y. Wang, L. Zhang and Y. Ma, Phys. Rev. X, 2017, 7, 011017 Search PubMed.
- S. P. Sitkiewicz, E. Ramos-Cordoba, J. M. Luis and E. Matito, J. Phys. Chem. A, 2021, 125, 4819–4835 CrossRef CAS PubMed.
- H. Y. Song, B. I. Yoo, J.-H. Choi, S.-H. Kang, J. Bang, W. Li, C. N. Nandadasa, D. Thapa, D. Yoon and M. J. Han,
et al.
, Mater. Today Phys., 2021, 20, 100473 CrossRef CAS.
- S. Y. Lee, J.-Y. Hwang, J. Park, C. N. Nandadasa, Y. Kim, J. Bang, K. Lee, K. H. Lee, Y. Zhang and Y. Ma,
et al.
, Nat. Commun., 2020, 11, 1526 CrossRef CAS PubMed.
- J. Chae, J. Lee, Y. Oh and G. Kim, Phys. Rev. B, 2021, 104, 125403 CrossRef CAS.
- S. Kim, J. Bang, C.-Y. Lim, S. Y. Lee, J. Hyun, G. Lee, Y. Lee, J. D. Denlinger, S. Huh and C. Kim,
et al.
, Nat. Mater., 2022, 21, 1269–1274 CrossRef CAS PubMed.
- S. Y. Lee, J. Bang, H. Y. Song, B. Il Yoo, Y. Kim, K. Lee, D. Thapa, S.-G. Kim and S. W. Kim, npj Quantum Mater., 2021, 6, 21 CrossRef CAS.
- C. J. Pickard and R. Needs, Phys. Rev. Lett., 2011, 107, 087201 CrossRef PubMed.
- M. M. Menamparambath, J.-H. Park, H.-S. Yoo, S. P. Patole, J.-B. Yoo, S. W. Kim and S. Baik, Nanoscale, 2014, 6, 8844–8851 RSC.
- C.-W. Chen, M.-H. Lee and S. Clark, Diamond Relat. Mater., 2004, 13, 1306–1313 CrossRef CAS.
- K. Chung, J. Bang, A. Thacharon, H. Y. Song, S. H. Kang, W.-S. Jang, N. Dhull, D. Thapa, C. M. Ajmal and B. Song,
et al.
, Nat. Nanotechnol., 2022, 17, 285–291 CrossRef CAS PubMed.
- L. Yan, T. Bo, B.-T. Wang, S. Tretiak and L. Zhou, J. Phys. Chem. Lett., 2021, 12, 494–500 CrossRef CAS PubMed.
- S. H. Kang, J. Bang, K. Chung, C. N. Nandadasa, G. Han, S. Lee, K. H. Lee, K. Lee, Y. Ma and S. H. Oh,
et al.
, Sci. Adv., 2020, 6, eaba7416 CrossRef CAS PubMed.
- X. Zhong, M. Xu, L. Yang, X. Qu, L. Yang, M. Zhang, H. Liu and Y. Ma, npj Comput. Mater., 2018, 4, 70 CrossRef CAS.
- S. H. Kang, D. Thapa, B. Regmi, S. Ren, Y.-M. Kim, S.-G. Kim and S. W. Kim, J. Am. Chem. Soc., 2022, 144, 4496–4506 CrossRef CAS PubMed.
- A. Savin, R. Nesper, S. Wengert and T. F. Fässler, Angew. Chem., Int. Ed. Engl., 1997, 36, 1808–1832 CrossRef CAS.
- R. F. Nalewajski, A. M. Köster and S. Escalante, J. Phys. Chem. A, 2005, 109, 10038–10043 CrossRef CAS PubMed.
- G. Henkelman, A. Arnaldsson and H. Jónsson, Comput. Mater. Sci., 2006, 36, 354–360 CrossRef.
- K. Momma and F. Izumi, J. Appl. Crystallogr., 2008, 41, 653–658 CrossRef CAS.
- A. M. Ganose, A. Searle, A. Jain and S. M. Griffin, J. Open Source Software, 2021, 6, 3089 CrossRef.
- D. Alfè, Comput. Phys. Commun., 2009, 180, 2622–2633 CrossRef.
- A. Jain, S. P. Ong, G. Hautier, W. Chen, W. D. Richards, S. Dacek, S. Cholia, D. Gunter, D. Skinner and G. Ceder,
et al.
, APL Mater., 2013, 1, 011002 CrossRef.
- H. Franzen and L. Norrby, Acta Crystallogr., Sect. B: Struct. Crystallogr. Cryst. Chem., 1968, 24, 601–603 CrossRef CAS.
- G. Örlygsson and B. Harbrecht, Inorg. Chem., 1999, 38, 3377–3383 CrossRef PubMed.
- C. Fall, N. Binggeli and A. Baldereschi, J. Phys.: Condens. Matter, 1999, 11, 2689 CrossRef CAS.
- J. Zhang, A. R. Oganov, X. Li, M. M. D. Esfahani and H. Dong, J. Appl. Phys., 2017, 121, 155104 CrossRef.
- J. Zhang, A. R. Oganov, X. Li, H. Dong and Q. Zeng, Phys. Chem. Chem. Phys., 2015, 17, 17301–17310 RSC.
- S. Hashimoto, H. Iwasaki, S. Ogawa, S. Yamaguchi and M. Hirabayashi, J. Appl. Crystallogr., 1974, 7, 67–73 CrossRef CAS.
- A. D. Becke, Phys. Rev. A: At., Mol., Opt. Phys., 1988, 38, 3098 CrossRef CAS PubMed.
- R. F. Bader, Chem. Rev., 1991, 91, 893–928 CrossRef CAS.
- A. D. Becke and K. E. Edgecombe, J. Chem. Phys., 1990, 92, 5397–5403 CrossRef CAS.
- Q. Zhu, T. Frolov and K. Choudhary, Matter, 2019, 1, 1293–1303 CrossRef.
- I. Buribayev, N. Nurmatov and N. Talipov, Turk. J. Phys., 1999, 23, 463–470 CAS.
-
S. Chung, S. Shrestha, X. Wen, Y. Feng, N. Gupta, H. Xia, P. Yu, J. Tang and G. Conibeer, IOP Conference Series: Materials Science and Engineering, 2014, p. 012002 Search PubMed.
- G. Jin, C. Xu, S. Hu and X. Zhou, J. Nucl. Mater., 2020, 532, 152036 CrossRef CAS.
- T. M. Inerbaev, Y. Han, T. B. Bekker and D. S. Kilin, J. Phys. Chem. C, 2023, 127, 9213–9224 CrossRef CAS.
|
| This journal is © The Royal Society of Chemistry 2024 |
Click here to see how this site uses Cookies. View our privacy policy here. 
 Open Access Article
 This Open Access Article is licensed under a Creative Commons Attribution-Non Commercial 3.0 Unported Licence
 *a,
Shambhu Bhandari
Sharma
*a,
Shambhu Bhandari
Sharma


 . Here,
  determines the curvature of the electron pair density for electrons of identical spins, ρ(
 the value of
  in a homogeneous electron gas with density ρ. The ELF has values that lie between 0.0 and 1.0, where ELF = 1.0 represents perfect localization of electrons, as in bonding pairs or lone pairs, ELF = 0.5 represents a uniform electron gas of the same density, and ELF < 0.5 represents electrons that are delocalized, such as in regions between two electron shells (or strongly localized areas). In crystallographic visualization, ELFs assist in finding missing anions from the solid-state structure by analyzing the localized electron density.32,47 The 3D iso-surfaces (Fig. 3) and 2D contour plots (Fig. 4) of the ELFs for each Zr2X (X = O, Se, and Te) compound illustrate the localization of anionic electrons at different spatial positions. Zr2O is stabilized as an electride material in all the different phases under study, as shown in the 3D iso-surface plot (Fig. S2, ESI†). To get the 2D ELF map, a set of specific planes were selected to visualize the distribution of localized and delocalized IAEs in the crystal structure. We have chosen the ELF values from 0.00 (minimum ELF) and 0.70 (maximum ELF), represented by blue and red colors, respectively, in the color scale bar to get a better insight into the spatial distribution of the IAEs. The localized IAEs are denoted by the symbol E. The anionic electrons are arranged in a one-dimensional pattern for all the Zr2X compounds, with the localized IAEs interconnected with delocalized electron channels while viewing along the (110) plane in Zr2O, and along the (010) plane in Zr2Se and Zr2Te. Additionally, we also obtained the localized periodic arrangements of dumb-bell-shaped and hammer-shaped structures serving stoichiometrically as anions while viewing through the (100) plane in Zr2Se and Zr2Te, respectively, as indicated in the 2D contour plots of their ELFs, as shown in Fig. 4(B) and (C). These dumb-bell- and hammer-shaped IAEs can be visualized as quasi-3D anionic particles when the iso-surface value of the ELF is gradually lowered to a value less than 0.5, indicating the contribution from the delocalized electrons in their formation. The bonding analysis based on the ELF suggests that the large extent of the ELF around the X atoms signifies the sharing of charges between the zirconium (Zr) and chalcogenide atoms, indicating the covalent nature of the bonding between them.


 .
.
 ) to calculate the work functions (Φ) for Zr2X (where X = O, Se, and Te) along the (100) plane are annotated in Table 3. The diagrams representing the methods to calculate Φ are given in Fig. 9. The calculated values of the work functions for Zr2X are also compared with that of an atomically clean zirconium surface with space group P63/mmc. The theoretically obtained values for Zr metal are 4.173 eV (method I) and 4.249 eV (method II), which lie well within the experimental range (3.70 eV to 4.33 eV).49 The diagram representing the calculated value of Φ in Zr metal is shown in Fig. S5 (ESI†). The predicted reduced work functions of these electrides confirm the potential applicability of these electrides in electrocatalysis and electron emission.