
 Open Access Article
 This Open Access Article is licensed under a
 Creative Commons Attribution 3.0 Unported Licence
Revisiting the phosphonium salt chemistry for P-doped carbon synthesis: toward high phosphorus contents and beyond the phosphate environment†
Rémi F.
André
 *a,
Christel
Gervais
b,
Hannes
Zschiesche
a,
Teodor
Jianu
a,
Nieves
López-Salas
ac,
Markus
Antonietti
*a and
Mateusz
Odziomek
*a
*a,
Christel
Gervais
b,
Hannes
Zschiesche
a,
Teodor
Jianu
a,
Nieves
López-Salas
ac,
Markus
Antonietti
*a and
Mateusz
Odziomek
*a
aColloid Chemistry Department, Max Planck Institute of Colloids and Interfaces (MPIKG), 14476 Potsdam, Germany. E-mail: mateusz.odziomek@mpikg.mpg.de
bSorbonne Université, CNRS, Laboratoire de Chimie de la Matière Condensée de Paris (LCMCP), 4 place Jussieu, 75005 Paris, France
cChair of Sustainable Materials Chemistry, Paderborn University, Warburger Strasse 100, 33098, Paderborn, Germany
First published on 25th April 2024
Abstract
The introduction of phosphorus and nitrogen atoms in carbo-catalysts is a common way to tune the electronic density, and thereby the reactivity, of the material, as well as to introduce surface reactive sites. Numerous environments are reported for the N atoms, but the P-doping chemistry is less explored and focuses on surface POx groups. A one-step synthesis of P/N-doped carbonaceous materials is presented here, using affordable and industrially available urea and tetrakis(hydroxymethyl)phosphonium chloride (THPC) as the N and P sources, respectively. In contrast to most of the synthetic pathways toward P-doped carbonaceous materials, the THPC precursor only displays P–C bonds along the carbon backbone. This resulted in unusual phosphorus environments for the materials obtained from direct thermal treatment of THPC–urea, presumably of type C–P–N according to 31P NMR and XPS. Alternatively, the in situ polymerization and calcination of the precursors were run in calcium chloride hydrate, used as a combined reaction medium and porogen agent. Following this salt-templating strategy led to particularly high phosphorus contents (up to 18 wt%), associated with porosities up to 600 m2 g−1. The so-formed P/N-doped porous materials were employed as metal-free catalysts for the mild oxidative dehydrogenation of N-heterocycles to N-heteroarenes at room temperature and in air.
New conceptsPhosphorus-doped carbonaceous materials have garnered interest for applications in catalysis, energy storage or water treatment. However, much of the research has relied on oxidized precursors like H3PO4, limiting the variety of accessible P-containing functional groups. In this study, inspired by a robust chemistry developed by the textile industry, we revisit the condensation, and calcination, of P(CH2OH)4+ (THPC) with urea to synthesize original P/N-doped carbonaceous materials. The peculiar features of THPC, such as the high reactivity of its hydroxymethyl groups and the sole presence of P–C bonds, result in unreported phosphorus environments in carbons, tentatively attributed to C–P–N domains. Besides, utilizing a metal chloride hydrate as the reaction medium for polymerization, echoing a salt-templating approach, offers leverage to adjust the composition and porosity of the materials. Benefiting from the exceptionally large P doping levels (18 wt%), the material was explored as a catalyst for the oxidative dehydrogenation (ODH) of N-heterocycles under mild conditions using air as an oxidant. This work not only presents a novel strategy for producing highly doped carbonaceous materials from simple precursors, but also offers insights into the active sites of metal-free catalysts for ODH reactions, particularly through comparison with other heteroatom-doped carbonaceous materials. |
1. Introduction
The intentional introduction of heteroatoms into carbon matrices allows the tuning of the material electronic structure and exposed chemical groups, directly affecting the performances of the materials for catalysis,2–5 energy storage,6,7 or environmental remediation applications.8,9 For both chemo-catalysis and electro-catalysis, the doping with phosphorus (and possibly the co-doping with nitrogen) permits the regulation of the energies of adsorption of the reagents and chemical intermediates in order to improve the activity and/or the selectivity.10–17 Surface functional groups, typically phosphate or phosphinate ones, were also reported as being the active sites for Brønsted acid-catalysed reactions (e.g. esterification, dehydration, and hydrolysis),18–22 oxidation of alcohols under mild conditions,23,24 and for increasing the selectivity of carbon-based catalysts in oxidative dehydrogenation (ODH) of alkanes to alkenes.27Phosphorus atoms are usually incorporated in carbonaceous materials via the direct calcination of a mix of C and P-containing chemicals or via the post-treatment of a prefabricated carbon with a phosphorus compound at high temperature.1 Various P sources were explored depending on the requirements of the synthesis (air sensitivity, absence/presence of water, and liquid/solid state), the targeted bonding environment (P–O vs. P–C bonds), the cost, the toxicity, and the potential release of phosphoric acid which then activates/etches the carbon (Fig. 1).23 Most of these precursors present an oxidized P environment with only P–O bonds (e.g. H3PO4, P2O5, phytic acid, and O![[double bond, length as m-dash]](https://www.rsc.org/images/entities/char_e001.gif) P(OR)3), or do not allow a straightforward condensation with the carbon precursor at low temperature (e.g. elemental phosphorus and PR3). The quest for new P-containing groups in carbonaceous materials, beyond the usual phosphate groups [PO4] (see Fig. S1, ESI† for nomenclature), and for higher P contents therefore goes through the exploration of different precursors.
P(OR)3), or do not allow a straightforward condensation with the carbon precursor at low temperature (e.g. elemental phosphorus and PR3). The quest for new P-containing groups in carbonaceous materials, beyond the usual phosphate groups [PO4] (see Fig. S1, ESI† for nomenclature), and for higher P contents therefore goes through the exploration of different precursors.
 | ||
| Fig. 1 Overview of the phosphorus sources used for the synthesis of P-doped carbonaceous materials.1 | ||
As early as 1999, Oya et al. proposed to carbonize a novolac-type phenolic resin, cross-linked by tetrakis(hydroxymethyl)-phosphonium sulphate (THPS) as the P-source, to yield carbons with a P content of 5 wt%.30 Such an approach looks promising to reach trivalent or reduced P sites as the phosphorus atoms are placed along the carbon backbone with only P–C bonds.31,32 The THP salts (THPS and the chloride equivalent, THPC) indeed condense readily with urea and amines to yield P–CH2–NH bridges, thanks to the reactivity of the hydroxymethyl groups.33 For decades, the corresponding polymers and resins, typically the “THPC–urea”, have been studied as a flame-retardant finishing on textiles, in both academia and industry.34,35 Besides, THPS and THPC are produced and commercialized on a large scale (applications in fire-retardant treatments and as microbiocides or reducing agents) and should be considered as low-cost commodities, with a price established below 2000 $ per ton for a global market size above $200 million in 2022.36 The use of THPC/THPS was not further explored after Oya's work for P-doped carbon synthesis, likely due to the limited surface areas obtained by the classical calcination approach. The emergence of salt-templating and ionothermal strategies in these past two decades to synthesize porous inorganic and carbon materials appears as a promising solution to fully exploit this THPC specific chemistry.37,38
We propose herein a one-step procedure to obtain porous P/N-doped carbons through the in situ formation of a THPC–urea resin in a metal salt hydrate, directly followed by its calcination. The as-synthesized samples display phosphorus contents among the highest reported in the literature (up to 18 wt%) while maintaining a high N content of 10 wt% and decent specific surface areas up to 600 m2 g−1. In a first part, we discuss the underlying mechanism and how the used amounts of porogen salt affect the development of micro- and mesopores. We then analyse the different stages of the synthesis by means of EELS (electron energy loss spectroscopy), XPS (X-ray photoelectron spectroscopy) and solid-state 31P NMR (nuclear magnetic resonance) spectroscopy. This last technique not only confirms different intermediates but also reveals unusual phosphorus environments for the samples produced in the absence of CaCl2, tentatively attributed to C–P–N based structures. This confirmed the interest of the initial choice of this atypical precursor to expand the library of P environments in carbonaceous materials. The so-formed material finally proved to be an efficient metal-free carbo-catalyst for the aerobic ODH of N-heterocycles to N-heteroarenes under mild conditions.
2. Results and discussion
2.1 Calcination of THPC–urea resin: from neat reaction to salt-templating synthesis
Inspired by the robust chemistry of THPC–urea finishing treatment developed by the textile industry for combustion resistance applications, we first envisioned the thermal treatment of a THPC–urea resin as a path to obtain high concentration of hetero-elements in a carbonaceous material, while limiting the mass loss upon calcination and achieving high yields.31,33,39 The chemical synthesis of the P/N-doped carbonaceous materials consisted in the mixing of the THPC, available as an 80 wt% aqueous solution, with urea in a 1![[thin space (1/6-em)]](https://www.rsc.org/images/entities/char_2009.gif) :2 stoichiometry, followed by heat treatment at 600–800 °C (Fig. 2A). The condensation was first investigated by thermogravimetric analysis (TGA) coupled with mass spectrometry (MS) to characterize the produced fragments and volatile species (Fig. 2B). A first mass loss of 21% is detected at 120 °C, accompanied by a significant release of H2O (m/z = 18) and, to a lower extent, of NH3 (m/z = 17) and CH3OH (m/z = 32) (region I: polymerization). The water originates from the initial THPC aqueous solution and from the condensation reactions between hydroxymethyl groups and urea (Fig. 3A, step 1).33 A second mass loss starts at 236 °C, up to 450 °C, accounting for a total of 50 wt% and concomitant with the release of CH4 (m/z = 16), NH3 (m/z = 17), CO (m/z = 28), formaldehyde CH2O (m/z = 30), and CO2 (m/z = 44) (region II: thermal restructuration) (step 2). Accordingly, foaming clearly occurs between 200 °C and 350 °C (Fig. 1C, left) and the resin becomes brown. The formation of methane and H2 (m/z = 2) at ca. 500 °C indicates the formation of chemical unsaturation and aromatization (step 3). Afterwards, the so-formed material is thermally stable up to 800 °C (region III) before presenting a final mass loss, accompanied by the release of CO and CO2 at 860 °C due to a severe degradation (region IV). Part of the phosphorus-containing compounds may be degraded in volatile elemental phosphorus. The P4 tetramers (m/z = 124), stable in the gas phase at high temperature, were however not detected by MS, potentially because of the decrease in temperature in the connection between the TGA and MS devices. The synthesis was therefore performed in a tubular oven, and deposition of a red solid was indeed observed downstream of the crucible at T > 600 °C, attributed to the condensation of red phosphorus (Tboiling(red P) ca. 500 °C) (Fig. S2, ESI†).
:2 stoichiometry, followed by heat treatment at 600–800 °C (Fig. 2A). The condensation was first investigated by thermogravimetric analysis (TGA) coupled with mass spectrometry (MS) to characterize the produced fragments and volatile species (Fig. 2B). A first mass loss of 21% is detected at 120 °C, accompanied by a significant release of H2O (m/z = 18) and, to a lower extent, of NH3 (m/z = 17) and CH3OH (m/z = 32) (region I: polymerization). The water originates from the initial THPC aqueous solution and from the condensation reactions between hydroxymethyl groups and urea (Fig. 3A, step 1).33 A second mass loss starts at 236 °C, up to 450 °C, accounting for a total of 50 wt% and concomitant with the release of CH4 (m/z = 16), NH3 (m/z = 17), CO (m/z = 28), formaldehyde CH2O (m/z = 30), and CO2 (m/z = 44) (region II: thermal restructuration) (step 2). Accordingly, foaming clearly occurs between 200 °C and 350 °C (Fig. 1C, left) and the resin becomes brown. The formation of methane and H2 (m/z = 2) at ca. 500 °C indicates the formation of chemical unsaturation and aromatization (step 3). Afterwards, the so-formed material is thermally stable up to 800 °C (region III) before presenting a final mass loss, accompanied by the release of CO and CO2 at 860 °C due to a severe degradation (region IV). Part of the phosphorus-containing compounds may be degraded in volatile elemental phosphorus. The P4 tetramers (m/z = 124), stable in the gas phase at high temperature, were however not detected by MS, potentially because of the decrease in temperature in the connection between the TGA and MS devices. The synthesis was therefore performed in a tubular oven, and deposition of a red solid was indeed observed downstream of the crucible at T > 600 °C, attributed to the condensation of red phosphorus (Tboiling(red P) ca. 500 °C) (Fig. S2, ESI†).
 | ||
| Fig. 2 Formation of P/N co-doped carbons from the THPC–urea condensate. (A) Reaction scheme. (B) TGA–MS curves of thermal treatment of [THPC + 2 urea] under helium (heating ramp of 2.5 °C min−1). Sample mass (black) and derivative (red), with corresponding MS curves (arbitrary units) at different m/z ratios (blue). Suggestions of fragments are given for MS. (C) Digital photographs of the materials synthesized in the presence or absence of 5 CaCl2·4H2O at various stages (scale bar is 1 cm). | ||
 | ||
| Fig. 3 (A) Mechanistic proposal for materials synthesis from THPC and urea in the absence and presence of calcium chloride. (B) Illustration of the ubiquitous use of THPC–urea precursor in the absence or in presence of a porogen agent with representative 31P solid-state NMR spectra (more details in Section 2.3). | ||
The thermal treatment at 600 °C of THPC–urea resin leads to a P/N co-doped carbonaceous material with decent yields (48% C yield, 54% P yield, all yield data available in Table S1, ESI†) but with virtually no porosity (Table 1 and Fig. S3, ESI†). Following a salt-templating strategy, the precursors were mixed with a metal chloride hydrate to achieve an intimate liquid mixture where the metal salt acts as reaction a medium and porogen.40,41 We conducted preliminary tests to determine an optimal salt system and retained CaCl2·4H2O which enabled specific surface areas significantly larger than in the absence of salt (>100 m2 g−1) while preserving high P contents (Table S2 and Fig. S4, ESI†). Interestingly, the addition of the metal salt not only generated porosity but also changed the phosphorus environments, as will be explained in Section 2.3 (Fig. 3B). THPC and urea form a totally liquid solution at 60 °C when mixed with CaCl2·4H2O, i.e. with a total water content of only 18 wt%, favouring the homogeneity of the final material (Fig. 1C). This efficient mixing was ascribed to a large number of hydrogen bonds between the H–bond donors (H2O, urea) and acceptors (Ca2+ and phosphonium cation), in a manner that echoes the formation of deep-eutectic solvents.42 This not only assures the high homogeneity of the condensation process but also the association of Ca2+ with the precursors. Upon temperature increase, the polymerization of the constituents and the evaporation of water destabilize the system and trigger the recrystallization of the calcium chloride, thus forming an entangled system resin–metal chloride akin to forming porosities at high temperature. The recorded TGA–MS curve in the presence of CaCl2·4H2O (Fig. S5, ESI†) presents a maximal mass loss rate at similar temperatures to those in the absence of salt (137 °C and 282 °C, and 434 °C), with similar released fragments. This suggests that the polymerization step likely occurs following similar paths as for the neat THPC/urea mixture (Fig. 2B), i.e. through the condensation of the urea units and hydroxymethyl ones, despite the presence of salt. The foaming of the crude at 350 °C and beyond, due to the release of gases following material fragmentation, was drastically limited (Fig. 2C).
| Sample | C yield% | P contenta (wt%) | P yield% | S BET (m2 g−1) | V T (mL g−1) |
|---|---|---|---|---|---|
| a Determined by ICP-OES with a typical error bar of 0.5 wt%. b Determined from the N2 adsorption isotherm at 77 K for 0.03 < P/P0 < 0.15 for SBET, and at P/P0 = 0.95 for total pore volume VT (pores less than 40 nm in diameter). c Samples synthesized without salt could not be effectively digested for ICP analysis; the reported P contents correspond to the ones from EDX analysis. | |||||
| TU-no salt-600 | 48 | 20c | 54 | <5 | <0.01 |
| TU-Ca6-1 | 53 | 17.2 | 65 | <5 | <0.01 |
| TU-Ca6-2 | 49 | 18.4 | 65 | <5 | <0.01 |
| TU-Ca6-5 | 51 | 18.2 | 47 | 54 | 0.11 |
| TU-Ca6-10 | 42 | 17.3 | 33 | 172 | 0.36 |
| TU-no salt-800 | 60 | 19c | 45 | 70 | 0.03 |
| TU-Ca8-1 | 59 | 18.4 | 61 | 50 | 0.03 |
| TU-Ca8-2 | 67 | 16.3 | 48 | 570 | 0.48 |
| TU-Ca8-3 | 70 | 17.3 | 50 | 606 | 0.51 |
| TU-Ca8-5 | 59 | 18 | 42 | 603 | 0.73 |
| TU-Ca8-10 | 50 | 14.7 | 28 | 536 | 0.72 |
| TU-Ca8-20 | 41 | 13.2 | 20 | 347 | 0.55 |
2.2 Influence of the CaCl2![[thin space (1/6-em)]](https://www.rsc.org/images/entities/h3_char_2009.gif) :THPC ratio on material structure
:THPC ratio on material structure
As the introduction of CaCl2 successfully generated porosity in the system, we evaluated the impact of the ratio of CaCl2vs. the carbon precursors, which can be perceived here as the dilution factor in the reaction medium, to target the minimal amount of salt required. The samples are specified as TU–ST–R where S represents the metal of the salt hydrate, T the first digit of the final temperature and R the metal:THPC molar ratio. Firstly, X-ray diffraction (XRD) measurements of the crude samples, recorded immediately after synthesis and before washing, display the characteristic pattern of calcium chloro-phosphate Ca2(PO4)Cl, although always as traces and without further growth beyond CaCl2:THPC ratio of 2:1 (Fig. S6, ESI†). A fraction of the P atoms is therefore undeniably oxidized to phosphate but the P yield only decreases from 61% to 42% for CaCl2:THPC ratios increasing from 1:1 to 5:1, and thus stays high even in a large excess of CaCl2. No hydroxyapatite Ca10(PO4)6(OH)2 was formed, and the excess of CaCl2 was instead recovered as anhydrous CaCl2 (Fig. S7, ESI†).
Upon increase of CaCl2 content, the morphology observed by scanning electron microscopy (SEM) evolved from non-rough particles (>100 μm) to smaller aggregated flake-like structures (<1 μm) (Fig. 4A). This morphology reflects the dual role of CaCl2 as a porogen agent and a reaction medium for the polymerization process, leading to polymeric, and then carbonaceous, particles. At the lowest ratios, the system corresponds to a dispersion of calcium chloride clusters in the resin material, ultimately resulting in the cracking of a bulk into chunks, rather than to a polymer embedded in a salt matrix. According to energy dispersive X-ray spectroscopy (EDX), all samples contain large amounts of heteroatoms with N, O and P contents in the 9–15 wt%, 13–26 wt% and 13–20 wt% ranges, respectively (Fig. 4B). The overall composition was confirmed by XPS for TU-Ca8-5, with similar values. The phosphorus contents were also determined by inductively coupled plasma-optical emission spectroscopy (ICP-OES), presenting here the best accuracy, and appeared consistent with EDX: from 18.4 wt% for the 1:1 ratio to 13.2 wt% for 20:1 (Table 1).43 The highest P contents reported in the literature are obtained via phosphorylation of a porous carbonaceous material with concentrated phosphoric acid and are ca. 12 wt%.1 The unusually high phosphorus contents reached here are due to the use of THPC as a simultaneous C and P-source with a high P:C molar ratio of 1:4.
 | ||
| Fig. 4 (A) SEM images of the samples calcined at 800 °C with different CaCl2:THCP ratios, indicated in the images (scale bar of 2 μm, except for TU-Ca8-0). (B) Chemical composition according to SEM-EDX, and XPS for TU-Ca8-5 (faded). The theoretical composition of the resin according to stoichiometry is indicated at r*. (C) N2 physisorption experiments performed at 77 K (adsorption and desorption). | ||
All samples calcined at 800 °C display similar XRD patterns, irrespective of the amount of CaCl2 used, with two broad peaks at 24° and 43° (Fig. S8, ESI†). The shift toward low angles, as compared with typical peaks of turbostratic structures (2θ = 26°, d = 3.35 Å), is attributed to a local geometric distortion of the interlayer packing due to the high concentration of phosphorus. Fourier transform infrared spectroscopy (FTIR) measurements display numerous absorption bands in the 1600–800 cm−1 region, typical for N and P doped carbonaceous materials and absent in non-doped carbon materials (e.g. pure graphite), even after calcination at 800 °C (Fig. S9, ESI†). This corroborates the presence of numerous N- and P-containing pendant functional groups and the absence of extensive graphitization (further discussion in the ESI†).
The porous structure of the synthesized materials was analysed by means of N2 physisorption at 77 K (Fig. 4C). In the absence or at a low concentration of CaCl2, the material has a low porosity with specific surface areas of 50–70 m2 g−1 (Table 1). Upon increasing the amount of salt, samples develop accessible micro- and mesopores, as indicated by the measured type IV sorption isotherms, with typical BET (Brunauer–Emmett–Teller) specific surface areas ranging from 300 to 600 m2 g−1 (Table 1C). The H3/H4 hysteresis loops suggest small “slit-like” mesopores or groove pores formed by flaky particles.44 While the adsorption behaviour stays similar for molar ratios of 2:1 and 5:1 for the low pressure region (P/P0 < 0.4), the volume of adsorbed N2 decreases upon further dilution with salt at 20:1, indicating lower volume of micropores. This decrease may be due to the formation of a higher proportion of isolated polymer branches upon porogen content increase. These branches are not connected to the bulk of the material, or too thin to resist calcination. As such, they totally decompose or are lost upon washing without generating microporous regions, in coherence with the decreasing of the overall microporosity. The pore size distribution reveals essentially small mesopores below 8 nm in diameter for TU-Ca8-2, and a wider distribution up to more than 20 nm for TU-Ca8-5 and TU-Ca8-20 (Fig. S10, ESI†). The porosity mainly developed upon increase of the CaCl2:THPC ratio from 1:1 (SBET = 50 m2 g−1) to 2:1 (SBET = 570 m2 g−1), without being associated with a significant drop of carbon yield (from 61% to 48%), ruling out an etching mechanism as the main one. Instead, the calcium and chloride ions, initially miscible with the precursors, crystallize to clusters and nanoparticles at higher temperatures upon water evaporation, and thereby act as a hard template to create pores, as already discussed by Fechler et al. on the salt-melt templating effect.41 Accordingly, the increase of pore volume is concomitant with the recovery of CaCl2 at the end of the reaction, on addition of Ca2(PO4)Cl. Visually, no macroscopic phase separation of the salt and the carbonaceous material is observed after the synthesis. Nonetheless, the melting point of CaCl2 (772 °C) is in between the two studied calcination temperatures, which could explain part of the porosity development: the salt melts and favours the opening of pores while leaving the small pockets it was entrapped in, thus giving access to a higher microporosity (in the case of < 2 nm CaCl2 clusters). Note the minimal molar ratio required to develop porosity (2:1) corresponds to a mass ratio between CaCl2 and the two carbon precursors (urea + THPC) of 0.7:1, significantly lower than the values generally used for salt-melt templating, up to 10:1.37
The sample TU-Ca8-5, presenting the highest porosity, was further examined by scanning transmission electron microscopy (STEM) (Fig. 5A–C). The material appears homogeneous without embedded nanoparticles of elemental phosphorus, contrary to Imamura et al.'s report of their presence upon thermal treatment of P-doped carbon at 1000 °C.30 The presence of ca. 10–100 nm wide “holes”, originating from the formation of crystals (CaCl2, Ca2(PO4)Cl) upon reaction, agrees with the porogenesis mechanism discussed earlier (Fig. 5A, orange arrow). The elemental mapping by using STEM-EDX reveals a homogeneous distribution of C, N, O and P in the carbonaceous material (Fig. 5A). At the atomic scale, high resolution annular dark-field (ADF-)STEM, where a brighter contrast refers to the heavier P atoms, nonetheless revealed a superior density of phosphorus at the edges of carbon ribbons with typical distance between two P atoms of 4 Å, i.e. separated by only 2–3 chemical bonds (Fig. 5B). Such a close vicinity of the P atoms is expected to exacerbate the reactivity of the surrounding carbon and nitrogen atoms by combining their electronic effects. Complementary to the elemental information in ADF-STEM, bright-field (BF-)STEM carries structural information, which show diffraction fringes, though not on extended domains (orange arrows) (Fig. 5C). The partly ordered structure (STEM limited here to 2D projection) is coherent with the large concentration of heteroatoms, preventing a long-range ordering. Such a structure is expected to lead to numerous defects which may be as many catalytic active sites. The P L2,3-edge shape observed by EELS coincides with the P L2,3-edge recorded in X-ray absorption spectroscopy for phosphate-like structures.45 Although the analysis of P structures by this means is not specific enough to distinguish R2(RO)PO, R(PO)2PO and (RO)3PO groups, it unambiguously confirmed an oxidized state for P with the main feature at 138 eV (Fig. 5D), instead of 130 eV for elemental phosphorus.46
 | ||
| Fig. 5 Scanning transmission electron microscopy study of sample TU-Ca8-5. (A) Bright-field STEM image and the corresponding EDX elemental maps. (B) Annular dark-field and (C) bright field STEM image of the same region. (D) EELS spectra of P L2,3-edge. | ||
2.3 Nature of the phosphorus-containing groups
31P solid state-NMR experiments were run to investigate the nature of the phosphorus environments at the different stages of the synthesis. At first, a mix [THPC + 2 urea] without CaCl2 was heated for 1 h at 200 °C, 350 °C, 600 °C or 800 °C. The 31P MAS NMR spectrum of the resin at 200 °C displays mainly one broad peak centred at 30 ppm (A) with a shoulder at 45 ppm (B), attributed to R4P+ and R3PO species, respectively (Fig. 6A and C). These attributions are in line with liquid state NMR spectra of the corresponding oligomers, tabulated at 29 ppm and 44 ppm, respectively (Table S3, ESI†).33 Besides, 31P–{1H} HETCOR (heteronuclear correlation) experiments indicate a correlation of the 31P signal at 30 ppm with a 1H peak at 4.5 ppm, typical of P–CH2–O/P–CH2–N environments (Fig. S11A, ESI†).33 At 350 °C, R4P+ and R3PO species are still present, though shifted to 23 ppm and 50 ppm, respectively, and a broad peak C centred at −10 ppm appears. The simultaneous presence of aliphatic-like (2–4 ppm) and aromatic-like (8–10 ppm) protons already attests of the formation of conjugated structures at this temperature (Fig. S11B, ESI†). Upon thermal treatment at 600 °C and 800 °C, the phosphonium and phosphine oxides species completely vanished and a peak D appeared at ca. 0 ppm, ascribed to (RO)3PO/(RO)2RPO groups (Fig. 6A and C). At the same time the peak C at −10 ppm significantly grew, dominating spectra at 600 °C, while the main one at 800 °C, denoted E and equally broad, is centred at −40 ppm. At 600 °C, 13C CP MAS NMR spectrum mainly consists in “aromatic” carbons (130 ppm) indicating an important redistribution of the C–N and C–P bonds to create C–C/CC bonds with possible integration of the phosphorus atoms directly into the aromatic system (Fig. S12, ESI†). The presence of a contribution at 14 ppm for 1H is typical of P–OH groups, supposedly at the surface of the material as the sharpness of the peak suggests a certain mobility (Fig. S13, ESI†).
 | ||
| Fig. 6 Nature of the phosphorus-containing groups. 31P MAS NMR spectra of materials synthesized in absence (A) and in the presence (B) of CaCl2 salt (molar ratio of 5:1). Asterisks denote the presence of side bands. (C) Suggested attribution of several components. (D) Representative positions of P-containing groups in liquid-state 31P NMR (except P3N5 and P4 from solid state NMR). (E) X-ray photoelectron spectra (P 2p) of the resin and the carbonaceous materials, with proposed deconvolution. | ||
In the presence of CaCl2, the spectrum is identical for the heating at 200 °C, confirming that the presence of salt does not drastically interfere with the polymerization mechanisms (Fig. 6B and C). At 350 °C, the proportion of phosphine oxides is higher, potentially due to a higher exposed surface. Upon thermal treatment at 600 °C and 800 °C, three main contributions are noted: a sharp phosphate peak D at −1 ppm, a broad one F at 5 ppm, attributed to (RO)R2PO units, and a small sharp one G at −10 ppm. This last one may correspond to inner phosphorus atoms in pyrophosphate/polyphosphates (–P(O)OH–O–)n, as observed in the case of activation of carbon fibres by H3PO4.47 Note that as the nitrogen content is high in the material, and the molar O/P ratio limited, the substitution of some of the O atoms by N ones is expected. However, 31P NMR analysis does not allow the unambiguous distinction between equivalent groups bearing P–O and P–N bonds as they are tabulated in the same regions.48 The heat treatment of carbon precursors (typically lignocellulosic sources) in the presence of phosphoric acid is the most widespread way to access P-doped carbon materials, with a maximum phosphorus content obtained following a calcination at 800 °C. Upon heating, both XPS and 31P solid-state NMR data suggest an evolution of the C–O–P linkages into C–P–O ones, and eventually elemental phosphorus due to the carbothermal reduction of phosphate groups, explaining the decrease of the overall P content. In these cases, the reported NMR peaks correspond to the components F and D at respectively ca. 10 and 0 ppm.49,50
Rationalizing 31P NMR chemical shifts in P-doped carbonaceous materials is challenging due to the lack of referenced data in the literature (most of samples display PO4 groups) and to the complex effects ruling the peak positions (e.g. electronic density surrounding the phosphorus, P valence). As a consequence, the predicted ranges for the different groups mostly overlap (Fig. 6D). Nonetheless, the chemical shifts for C and E (−10 and −40 ppm) in the 31P NMR spectra are rather uncommon for P-doped carbons in the literature. The C contribution most likely does not correspond to a polyphosphate species due to the too low temperature for its first apparition (350 °C), its broadness and the absence of a larger peak at 0 ppm for the terminal phosphate group. Both C and E features are extremely broad, even though acquired at a high field (16.4 T). This is the sign either of a large number of closed chemical environments, though not equivalent, or of a limited mobility of these chemical groups: both reasons point at phosphorus atoms buried in the core of the carbonaceous particles. They are therefore preserved from oxidation during acid washing and further storage in air. In contrast, the sharpness of the phosphate peak D suggests that the species are located at the surface. In liquid-state NMR, species with a trivalent phosphorus P(OR)x(NR2)yRz≤2 usually present a signal beyond 80 ppm and are thereby excluded to explain the nature of C and E components.48 On the other side, pentavalent phosphorus presenting –N–PR2N– bonding, for instance derived from tricyclophosphazene condensation, are reported ca. −20 ppm,51 and phosphorus nitride (P3N5) also displays a downshifted signal at −60 ppm in solid-state MAS NMR.52 Noticeably, Schmidpeter et al. reported that signals stemming from pentavalent phosphorus span from 45 ppm to −20 ppm for PO4 environments, but are extended to −40 ppm for PN4 ones.53 Overall, the unattributed features likely correspond to a phosphorus connected to nitrogen atoms through single and/or double bonds, eventually forming C–P–N domains; or to a phosphine-like environment generated by the cleavage of a phosphonium (P(CH2OH)3 is reported at −24 ppm).54 Although X-ray absorption spectroscopy is a common tool to investigate and confirm the chemical environments of specific atoms, the analysis of the K-edge of phosphorus is not expected here to bring further information than NMR considering the poor discrimination of phosphorus-containing compounds based on spectral features on one hand,45 and the very close P–O and P–N distances (analysis of the extended X-ray absorption fine structure oscillations) on the other hand.
In addition to NMR, and in order to characterize the chemical states of the elements at the surface of the material, XPS was performed on the resin obtained at 200 °C without metal salt and on the carbonaceous materials synthesized at 600 °C and 800 °C, both in the absence and in the presence of CaCl2 (Table S4, ESI† for fitting parameters and Fig. S14 (ESI†) for high resolution C 1s, N 1s, and O 1s XPS spectra). The analysis of the P 2p spectra reveals in the case of the resin (200 °C no salt in Fig. 6E), a first component at 132.4 eV, assigned to R3PO units originating from the condensation of THPC followed by the loss of a substituent and an aerobic oxidation.55 Another well-defined component is observed at lower binding energy (130.5 eV), in the region usually ascribed to reduced phosphorus, as in phosphines or elemental P. Here, this component may be assigned to phosphonium centres R4P+ considering the NMR analysis.55–57 Alternatively, it might correspond to surface localized phosphine species created upon beam irradiation on the R4P+ groups. The spectra of the calcined samples are very similar and comprise a large peak centred at ca. 133.5 eV, deconvoluted in an electron-poor component C–O–P and an electron-rich one O–C–P. These two components rather reflect a continuum of environments between phosphate ester (RO)3PO and phoshine oxide R3PO rather than precise functional groups. The non-negligible O–C–P component indicates the partial incorporation of the phosphorus atoms in the carbon matrix via C–P bonds. In addition, there is a minor contribution at 136.5 eV of fully oxidized phosphorus component [PO4], assigned to (poly)phosphate. The strong similarities of the XPS spectra of all carbonaceous materials obtained at 600 °C and 800 °C, even though the 31P NMR revealed important differences, support that the surface phosphorus atoms are mostly oxidized (C–O–P/C–P–O type) and that the previously discussed reduced [C–P–N] and PR3 species are either indiscernible by XPS or absent from the surface.
2.4 Carbo-catalyst for the oxidative dehydrogenation of N-heterocycles
One notable success of carbon materials as catalysts lies in their industrial use for oxidative dehydrogenation (ODH) of alkanes to alkenes, and of alcohols to aldehydes.58,59 The reactivity is generally attributed to carbonyl/quinone groups at their surface. Interestingly, an improved selectivity was reported after insertion of phosphorus, as phosphate groups, in the material.60 A similar ODH reaction starting from N-heterocycles generates N-heteroarenes, essential building blocks in fine chemistry. N-doped carbo-catalysts in particular proved to efficiently activate O2 as primary oxidant for the ODH of indole and quinoline derivatives.25,26,28,29,61 On the basis of these works, we evaluated the performance of the synthesized P/N co-doped carbonaceous material for the oxidation of indoline to indole, as a model reaction. As these reactions are usually run on N-heterocycles bearing other reactive groups, we targeted mild conditions in terms of temperature (<100 °C) and oxidant (air). Considering the catalytic context, a sample with a large exposed area is required, we therefore chose the TU-Ca8-5 one, presenting the optimal balance of high porosity and high P and N contents, ca. 18 and 10 wt%, respectively. Note that this sample was prepared in the presence of CaCl2, leading to phosphonic acid-like surface groups.We first evaluated the influence of the solvent at room temperature in air with a catalyst loading of 100 wt%, with respect to the indoline reagent (Table 2, entries 1–8). The polarity of the solvent did not correlate with the conversion, suggesting that the limiting step of the reaction does not involve ionic or polarized species (Fig. S15A, ESI†). The best conversion (93%) was obtained in a 1:1 volume mixture of H2O/EtOH. As this nontoxic solvent solubilized the indoline and efficiently dispersed the catalyst, it was used in the following experiments. A blank reaction without a catalyst and the use of various metal-free materials such as carbon black, graphite or carbon nitride led to a null conversion, revealing the catalytic activity is indeed due to specific heteroatom-containing surface groups (entries 9–12). The absence of a reaction in presence of phosphoric acid indicates that the sole Brønsted acid groups present at the catalyst surface, if involved in the mechanism at all, are not sufficient for the dehydrogenation (entry 13).
|
|
|||||
|---|---|---|---|---|---|
| Entry | Catalyst | Solvent | Loading (wt%) | T (°C) | Conv. (%) |
| Reaction conditions: indoline (28 μL, 30 mg, 0.25 mmol), solvent (2.5 mL), catalyst (30 mg), 1 bar, 18 h. Conversions determined by 1H NMR.a Limited solubility of the indoline in water.b Similar P content to that introduced with 30 mg of P/N carbon.c Reaction performed in O2.d Reaction conditions: indoline (112 μL, 120 mg, 1 mmol), solvent (10 mL), catalyst (12/30/60 mg).e Gram-scale experiment: indoline (1.12 mL, 1.2 g, 10 mmol), solvent (100 mL), catalyst (1200 mg), air, reflux, 18 h.f Beller work.25g Liu work.26h Dai work.28i Quan work.29 | |||||
| 1a | P/N carbon | H2O | 100 | 20 | 64 |
| 2 | P/N carbon | MeOH | 100 | 20 | 46 |
| 3 | P/N carbon | EtOH | 100 | 20 | 51 |
| 4 | P/N carbon | ACN | 100 | 20 | 58 |
| 5 | P/N carbon | EtOAc | 100 | 20 | 62 |
| 6 | P/N carbon | Dioxane | 100 | 20 | 22 |
| 7 | P/N carbon | Toluene | 100 | 20 | 75 |
| 8 | P/N carbon | H2O/EtOH | 100 | 20 | 93 |
| 9 | — | H2O/EtOH | — | 20 | 0 |
| 10 | Carbon black | H2O/EtOH | 100 | 20 | 0 |
| 11 | Graphite | H2O/EtOH | 100 | 20 | 0 |
| 12 | C3N4 | H2O/EtOH | 100 | 20 | 0 |
| 13b | H3PO4 (50 mol%) | H2O/EtOH | — | 20 | 0 |
| 14c | P/N carbon | H2O/EtOH | 25 | 20 | 44 |
| 15c | P/N carbon | H2O/EtOH | 50 | 20 | 73 |
| 16c | P/N carbon | H2O/EtOH | 100 | 20 | >98 |
| 17d | P/N carbon | H2O/EtOH | 10 | 80 | 56 |
| 18d | P/N carbon | H2O/EtOH | 25 | 80 | 91 |
| 19d | P/N carbon | H2O/EtOH | 50 | 80 | >98 |
| 20e | P/N carbon | H2O/EtOH | 100 | 80 | >98 |
| 21f | NPCH | H2O | 21 | 120 | 91 |
| 22gc | NCC-800 | H2O | 67 | 80 | >99 |
| 23h | N-HPC-800 | t-Amyl alcohol | 134 | 110 | 87 |
| 24ic | NC(242-800) | EtOH | 67 | 60 | 96 |

Replacing the air by pure O2 afforded a quantitative conversion at 100 wt% at r.t. (entries 14–16). In many cases and for less active systems, carbo-catalysis requests rather high catalyst loadings.2 In the present case, a 91% conversion was obtained in air with only 25 wt% loading upon increase of the reaction temperature to 80 °C (entries 17–19, and Fig. S15B, ESI†). A catalyst loading of 10 wt%, equivalent to 58 μmol of P per mmol of indoline, led to a conversion of 56%, which definitely proves the catalytic effect of the carbon materials (equivalent turnover number vs. P atoms TON > 9.6). The upscaling of the reaction to 10 mmol (equiv. to 1.19 g of indoline) proved to be successful (>98% conversion, entry 20) and the recovered catalyst was still active after ethanol washing and drying. The conversion decreased over the first recycling tests before stabilizing ca. 60% (Fig. S16, ESI†). It is noteworthy, the developed catalyst presents at least equivalent performances to the currently best performing metal-free N-doped carbo-catalysts (entries 21–24).25
We then investigated the substrate scope for dehydrogenation in a range of substituted indolines and tetrahydroquinolines (Fig. 7 and Fig. S18–31, ESI†). High conversions were obtained in the presence of different groups in the 5-position of the indoline (–methyl, –methoxy, –Br, and –NO2), though slightly lower in the case of the strong electron-attractor nitro group. The only substrate obtained with a low yield (6%) was isoquinoline, for which mainly the half-dehydrogenated product was obtained, a limitation also reported by Mata et al.29 A total conversion was recorded for both the quinoxaline and the acridine, in line with previous works.26,28 All of these results point toward the possible use of the developed material for aerobic ODH of N-heterocycles in N-heteroarenes under mild conditions.
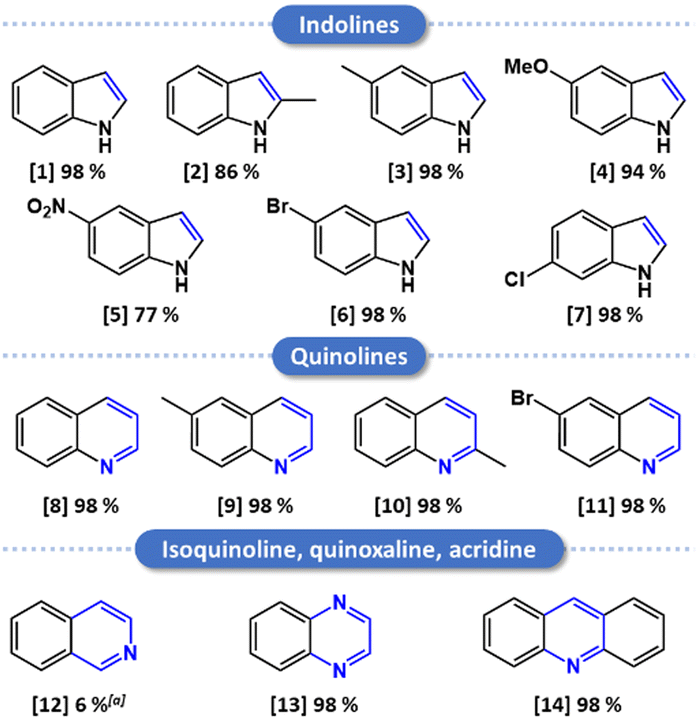 | ||
| Fig. 7 Substrate scope. Reaction conditions: substrate (0.25 mmol), H2O/EtOH (1:1) (2.5 mL), catalyst (30 mg), air, 80 °C, 18 h. Yields determined by 1H NMR. (a) Total conversion of the tetrahydroisoquinoline to 6% of isoquinoline and 94% of 3,4-dihydroisoquinoline. | ||
The mechanism of the ODH was assessed by control experiments changing the gas phase, or in the presence of radical scavengers (Table 3). Run in N2, the reaction yield falls from 73% to 12%, proving the role of O2 as the primary oxidant (entries 1 and 2). The residual conversion is non-negligible and suggests that some functional groups at the surface of the catalyst are directly responsible for the dehydrogenation. Therefore, the molecular oxygen is thought to regenerate the oxidative groups consumed upon reaction, thus closing a catalytic loop.23 The limited variation of yield in the presence of 2 equivalents of BHT (67%), TEMPO (80%) or iPrOH (61%) is within the reproducibility of the experiments, indicating the main pathway does not imply free radical species (entries 3–5). Such a result is in line with the works of Beller et al. (N/P-doped carbon)25 and Dai et al. (N-doped carbon),28 but contrasts with the one of Liu et al. (N-doped carbon).26 Finally, the absence of deep brown coloration, characteristic of the triiodide ion I3−, upon the addition of a drop of concentrated NaI, ruled out the generation of a molecular oxidant, such as H2O2, as a reaction intermediate (Fig. S17, ESI†).
| Entry | Carbo-catalyst | Additive (2 equiv.) | Gas | T (°C) | t (h) | Conv. (%) |
|---|---|---|---|---|---|---|
| Reaction conditions: indoline (28 μL, 30 mg, 0.25 mmol), H2O/EtOH (1:1) (2.5 mL), catalyst (30 mg), 1 bar gas. Conversions determined by 1H NMR. BHT = butylated hydroxytoluene, TEMPO = (2,2,6,6-tetramethylpiperidin-1-yl)oxidanyl.a The solvent was degassed beforehand by N2 bubbling. |
||||||
| 1 | P/N-doped | — | Air | 20 | 8 | 73 |
| 2a | P/N-doped | — | N2 | 20 | 8 | 12 |
| 3 | P/N-doped | BHT | Air | 20 | 8 | 67 |
| 4 | P/N-doped | TEMPO | Air | 20 | 8 | 80 |
| 5 | P/N-doped | iPrOH | Air | 20 | 8 | 61 |
| 6 | P/N-doped | — | Air | 20 | 16 | 93 |
| 7 | CB-air | — | Air | 20 | 16 | 6 |
| 8 | CB-air | — | Air | 80 | 16 | 92 |
| 9 | N-doped | — | Air | 20 | 16 | 46 |
| 10 | P-doped | — | Air | 20 | 16 | 75 |
| 11 | H3PO4-carbon | — | Air | 20 | 16 | 9 |
Recently, Patel et al. reported the ODH of benzyl alcohol to benzaldehyde catalysed by P-doped carbons and suggested a shuttle of the active site from P(III) to P(V).23 Such a mechanism, however, involves the formation of an alkoxide directly linked to the phosphorus atom, and can less easily be transposed to the ODH of N-heterocycles. Instead, the classical mechanism proposed for ODH on air-oxidized carbon materials consists in the transfer hydrogenation of a surface quinone group (two adjacent CO) to a diphenol, continuously regenerated through oxidation by O2 (Scheme 1).59,60 In our case, the number of CO groups is limited as no absorption band is detected at ca. 1600 cm−1 by FTIR, most of the oxygen atoms are most likely linked to phosphorus atoms. However, as the material exhibits P–C bonds at high concentration, we suggest a modified version of the classical transfer hydrogenation step leading to an ylide structure, susceptible to rearranging rapidly to phosphonic acid (RO)RP(O)OH (Scheme 1). The activation of O2 on another part of the material, followed by its diffusion to the so-formed unsaturated site then allows oxidation back to an aromatic structure, energetically more favourable, and generates a water molecule. The insertion of N in the aromatic structure may further favour the activation of O2 at the surface of the material and facilitates the re-oxidation process of the P-containing groups to their resting state, as suggested by the good activity of N-doped carbon materials for oxygen reduction reaction (Scheme 1).4,13 The simultaneous presence of P and N elements in the matrix therefore allows a higher number of catalytically active sites as both are supposedly active (see below), and a more efficient catalytic loop as to the P sites thanks to the activation of O2 as superoxide by the N sites in the vicinity. The progressive deactivation of the catalyst may be due to the leaching or hydrolysis in the phosphate groups of some of the depicted active P-sites.
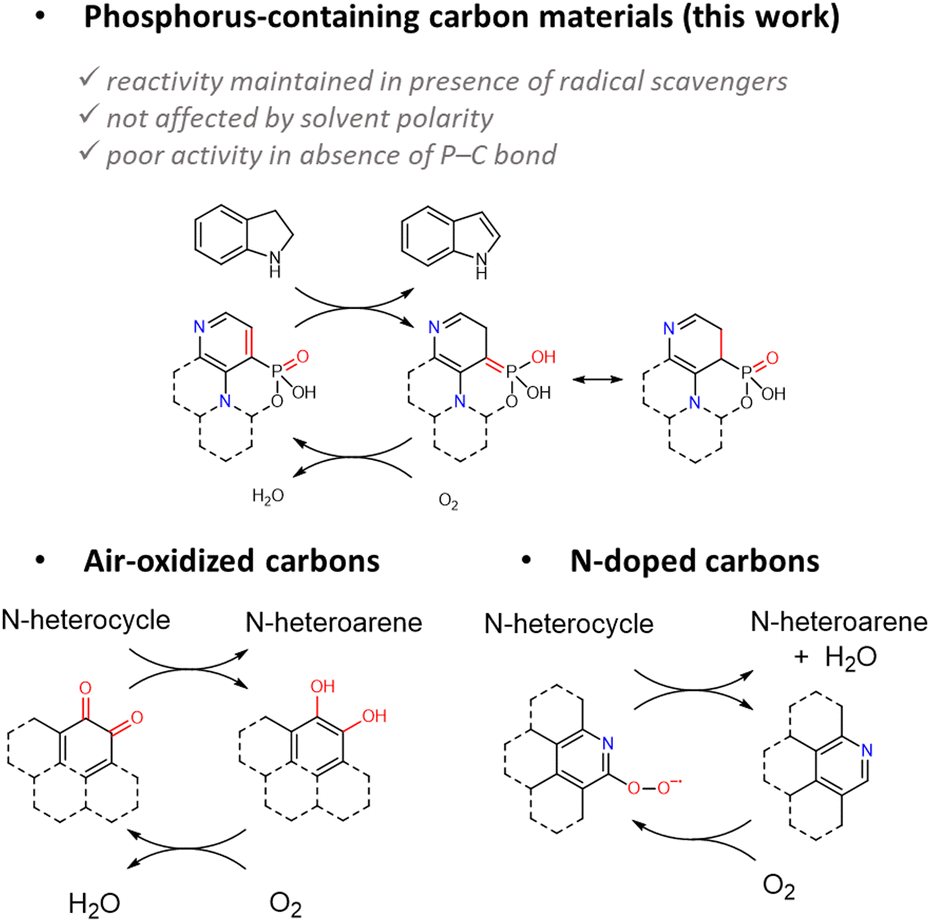 | ||
| Scheme 1 Proposed mechanism for N-heterocycle dehydrogenation using a P/N-doped carbonaceous material. | ||
The hypothesis on the mechanism was tested via different model materials (see Fig. S32–S35, ESI† for materials syntheses and characterization studies). At first, in our hands, an air-oxidized carbon black sample, a well-known carbo-catalyst for ODH,62 led to a 6% conversion at r.t. (Table 3, entries 9 and 10), pointing at the increased activity upon P-doping. Then, a highly N-doped carbonaceous sample (N content of 24 wt%) also proved to be active, but with a significantly lower conversion of 46% compared with P/N-doped materials, suggesting that most of the activity of this last one indeed originates from the phosphorus doping. Besides, a P-doped sample obtained from phytic acid calcination (similar to Patel's work23) also displayed a non-negligible activity for ODH at r.t. (Table 3, entry 7), confirming that the sole P-doping is sufficient. However, a carbon phosphorylated by reacting phosphoric acid at low temperature (180 °C) was poorly active, even though containing 3.9 wt% of P (Table 3, entry 8). Such a sample supposedly contains only P–O bonds as no reduction of the phosphate groups occurs in this temperature range. This suggests that a conjugation of P with the aromatic system is required, likely to form the PC bond of the intermediate species, in line with the absence of conversion with H3PO4 (Table 2, entry 13). Overall, the ODH of N-heterocycles catalysed by P-doped carbo-catalyst apparently proceeds via a mechanism differing both from the reported ones for surface oxidized carbons and N-doped carbons, while achieving higher conversions under equivalent conditions.
3. Conclusions and outlook
We demonstrated that the use of a tetrakis(hydroxymethyl)-phosphonium salt as a P precursor for carbonaceous materials syntheses, in combination with urea, opens the way to high phosphorus doping contents up to 18 wt%. To introduce porosity, a salt-templating strategy, based on the direct polymerization of the precursors in a calcium chloride hydrate, was successfully employed. This work thus expands the already explored condensation reactions of ionic liquids, carbohydrates and nucleobases in molten salts/salt hydrates to lower the temperature of polymerization of formaldehyde-like compounds (<120 °C). Moreover, unusual P-containing functional groups were reported for the calcined samples, beyond the commonly reported phosphate/phosphonate groups. These structures likely correspond to trivalent phosphine environments or pentavalent ones of type C–P–N. We believe that exploring such a chemistry would in particular be beneficial to tune the electronic configuration of bulk carbon materials. The samples with the highest P contents proved to be efficient carbo-catalysts for the oxidative dehydrogenation of N-heterocycles to N-heteroarenes under mild conditions, likely following a transfer hydrogenation mechanism.4. Experimental procedures
Chemicals
All chemicals were used as received without further purification. Tetrakis(hydroxymethyl)phosphonium chloride (THPC) 80 wt% in water, urea (99%), MgCl2·6H2O (99%), CaCl2·2H2O (99%), ZnCl2 (98%), HCl (37%), indoline (98%) and tetrahydroquinoline (98%) were purchased from Merck. All the other N-heterocycles were purchased from A2B Chem (>98%). Note that CaCl2·4H2O and ZnCl2·4H2O were obtained in situ by mixing CaCl2·2H2O and ZnCl2 with the corresponding amounts of water.Materials synthesis
Phosphorus-doped carbonaceous materials were prepared typically by mixing CaCl2·2H2O (3.67 g, 25 mmol, 5 equiv.), urea (600 mg, 10 mmol, 2 equiv.), water (900 μL, 50 mmol, cautious: exothermic), and finally THPC 80% (889 μL, 1.191 g, 5 mmol, 1 equiv.) in a ceramic crucible. The precursor-salt mixture was thoroughly mixed with a spatula, covered with a lid, transferred to a muffle furnace and subjected to heat treatment under constant N2 flow with a heating ramp of 1 °C min−1 (the oven was first purged for 1 h with N2). The final temperature was kept for one hour, before cooling down to room temperature. The black samples were then ground, washed three times with 400 mL of 1 M HCl (8 h, r.t.) and once with 400 mL of water before being dried at 60 °C overnight to yield a black powder (360 mg, equiv. to 59% C yield and 42% P yield).Materials characterization
ICP measurements were performed using a PerkinElmer ICP-OES Optima 8000 after digestion of the dried samples in 3 mL H2SO4 95% + 3 mL H2O2 50% for 12 h at 80 °C. Standard operating conditions were used (Plasma power 1300 W, plasma flux 12 L min−1, nebulizer gas flux 0.55 L min−1, auxiliary gas flux 0.2 L min−1, sample uptake 1.7 mL min−1, Ar purging of the optical part of the instrument). Fourier transformed infrared (FTIR) spectroscopy was performed using a Thermo Scientific Nicolet iS5 FT-IR spectrometer, using an attenuated total reflection iD5 accessory. Powder XRD measurements were performed on a Rigaku SmartLab diffractometer, using Cu Kα radiation at 1.5406 Å, with steps of 0.1° (0.03° for samples containing CaCl2) and a scanning rate of 0.5° min−1. Physisorption measurements were performed on a Quantachrome Quadrasorb SI apparatus with N2 adsorption at 77 K after degassing at 150 °C for 15 h. The specific surface area (SBET) of each material was obtained from the N2 adsorption data (P/P0 < 0.2) using the Brunauer–Emmett–Teller (BET) method. The total pore volume was calculated from the amount of nitrogen adsorbed at P/P0 = 0.95 (pores of diameter less than 40 nm). The N2 pore size distribution was obtained using a Quenched Solid Density Functional Theory (QSDFT) model with a slit/cylindrical pore shape using the N2 adsorption branch. SEM was performed on a LEO 1550 Gemini Zeiss microscope at 5 keV beam energy after sputtering of 5 nm of carbon on the top of the samples. EDX was performed using an Oxford Instruments EDX analyser. 31P MAS, 13C CP MAS, 2D HETCOR 13C–{1H} and 31P–{1H} CP MAS solid-state NMR spectra were recorded on a Bruker Avance 700 spectrometer (field = 16.4 T, ν0(1H) = 300.39 MHz, ν0(13C) = 176.08 MHz, ν0(31P) = 283.29 MHz) using a 3.2 mm Bruker MAS probe spinning at 20 kHz and on a Bruker Avance 300 spectrometer (field = 7.0 T, ν0(1H) = 700.14 MHz, ν0(13C) = 75.51 MHz, ν0(31P) = 121.56 MHz) using a 4 mm Bruker MAS probe spinning at 14 kHz. CP MAS experiments were recorded with ramped-amplitude cross-polarization in the 1H channel to transfer magnetization from 1H to 13C or 31P (recycle delay = 3 s, CP contact time = 1 ms, optimized 1H spinal-64 decoupling). Single pulse 31P MAS NMR spectra were recorded with a recycle delay of 30 s. Chemical shift values were referenced to tetramethylsilane (TMS) for 13C and H3PO4 (85 wt%) for 31P. XPS measurements were performed using a Thermo Fisher Scientific K-Alpha, and data were treated using CasaXPS software. Monochromatic X-ray radiation of 1486.6 eV (Al Kα) was used to analyse each material. The powders were pressed on a carbon tape deposited on the sample holder in order to have a homogeneous layer. Survey scans were obtained using a pass energy of 200 eV and step size of 1 eV, with a spot size of approximately 100 μm. High resolution spectra of C 1s (280–298 eV), N 1s (394–404 eV), O 1s (526–545 eV) and P 2p (125–144 eV) were recorded using a pass energy of 50 eV and a step size of 0.1 eV. The binding energy was calibrated against the 284.8 eV peak of adventitious carbon (C–C).63 Relative sensitivity factors (RSF) of 1, 1.8, 2.93 and 1.19 were used for C, N, O and P, respectively. Unless otherwise stated, a U3 Tougaard background was used and peaks were deconvoluted using mixed Gauss–Lorentz sum function line shape GL(30). STEM was performed using a double-Cs corrected JEOL JEM-ARM200F, operated at 80 kV using a probe semi convergence angle of 23 mrad, equipped with a cold-field emission gun, an energy dispersive X-ray detector and a Gatan Imaging Filter (GIF) Quantum. Samples were prepared on standard TEM Cu grids with lacey carbon support by dispersing particles in ethanol, drop-casting the solution on the grid and letting it dry under ambient conditions. ADF-STEM images were recorded within an angular collection semi-angle range from 50 mrad to 180 mrad. BF-STEM images were taken from scattering signal to a maximal collection semi-angle of 3.8 mrad. EELS data were acquired using a dispersion of 0.1 eV per channel. All data were acquired and analysed using Gatan's microscopy suite (GMS) software version 3.4.Catalytic dehydrogenation
The reactions at 80 °C were conducted in a round-bottom flask connected to a condenser and heated in an oil bath, while the reactions at r.t. were conducted in 5 mL glass vials. In a typical reaction, the catalyst (30 mg) was dispersed in the solvent (2.5 mL) by brief sonication, followed by the addition of the indoline (0.25 mmol, 28 μL). The reaction is allowed to react under stirring at the given temperature for 18 h and cooled down naturally to r.t. To avoid solvent evaporation, the vials of the reactions run at r.t. were closed with a septum and connected to an air balloon of ca. 1 L in volume to provide enough molecular oxygen (8 mmol of O2). After the reaction, an aliquot was diluted in CDCl3 and directly analysed by 1H NMR (400 MHz, 298 K). For the recycling test, the catalyst was recovered by centrifugation, washed with 100 mL of EtOH and dried at 60 °C overnight before the next cycle.Author contributions
Rémi André: conceptualization, investigation, writing – original draft. Christel Gervais: investigation (ss-NMR), writing – review & editing. Hannes Zschiesche: investigation (STEM), writing – review & editing. Teodor Jianu: investigation (STEM). Nieves López-Salas: writing – review & editing. Markus Antonietti: supervision, writing – review & editing, funding acquisition. Mateusz Odziomek: supervision, writing – review & editing.Conflicts of interest
There are no conflicts to declare.Acknowledgements
The Max Planck Society is gratefully acknowledged for financial support, as well as the Deutsche Forschungsgemeinschaft (DFG) for the “Germany's Excellence Strategy-EXC 2008-390540038-UniSysCat” funding and the French Région Ile de France – SESAME program (700 MHz NMR spectrometer) funding. N. Tarakina is acknowledged for the fruitful discussions, J. Brandt for ICP measurements, A. Völkel for TGA–MS measurements, Johannes Schmidt for XPS measurements, and B. Badamdorj and H. Runge for SEM-EDX measurements. Open Access funding provided by the Max Planck Society.References
- A. M. Puziy, O. I. Poddubnaya, B. Gawdzik and J. M. D. Tascón, Carbon, 2020, 157, 796–846 CrossRef CAS.
- M. Antonietti, N. Lopez-Salas and A. Primo, Adv. Mater., 2019, 31, e1805719 CrossRef PubMed.
- L. H. Zhang, Y. Shi, Y. Wang and N. R. Shiju, Adv. Sci., 2020, 7, 1902126 CrossRef CAS PubMed.
- C. Hu and L. Dai, Adv. Mater., 2019, 31, e1804672 CrossRef PubMed.
- X. Rao, S. Zhang and J. Zhang, Curr. Opin. Electrochem., 2023, 42, 101416 CrossRef CAS.
- J. P. Paraknowitsch and A. Thomas, Energy Environ. Sci., 2013, 6, 2839–2855 RSC.
- Y. Yang, D.-M. Tang, C. Zhang, Y. Zhang, Q. Liang, S. Chen, Q. Weng, M. Zhou, Y. Xue, J. Liu, J. Wu, Q. H. Cui, C. Lian, G. Hou, F. Yuan, Y. Bando, D. Golberg and X. Wang, Energy Environ. Sci., 2017, 10, 979–986 RSC.
- H. Wang, Y. Shao, S. Mei, Y. Lu, M. Zhang, J. K. Sun, K. Matyjaszewski, M. Antonietti and J. Yuan, Chem. Rev., 2020, 120, 9363–9419 CrossRef CAS PubMed.
- L. Zhang, X. Li and M. Antonietti, Angew. Chem., 2021, 60, 24257–24265 CrossRef CAS PubMed.
- N. Yang, X. Zheng, L. Li, J. Li and Z. Wei, J. Phys. Chem. C, 2017, 121, 19321–19328 CrossRef CAS.
- D. S. Yang, D. Bhattacharjya, S. Inamdar, J. Park and J. S. Yu, J. Am. Chem. Soc., 2012, 134, 16127–16130 CrossRef CAS PubMed.
- D. Yu, Y. Xue and L. Dai, J. Phys. Chem. Lett., 2012, 3, 2863–2870 CrossRef CAS PubMed.
- J. Zhang, Z. Zhao, Z. Xia and L. Dai, Nat. Nanotechnol., 2015, 10, 444–452 CrossRef CAS PubMed.
- T. Najam, S. S. A. Shah, W. Ding, J. Jiang, L. Jia, W. Yao, L. Li and Z. Wei, Angew. Chem., 2018, 130, 15321–15326 CrossRef.
- C. Chen, X. Sun, X. Yan, Y. Wu, H. Liu, Q. Zhu, B. B. A. Bediako and B. Han, Angew. Chem., 2020, 59, 11123–11129 CrossRef CAS PubMed.
- C. H. Choi, S. H. Park and S. I. Woo, J. Mater. Chem., 2012, 22, 12107–12115 RSC.
- L. Zhang, H. Zhang, K. Liu, J. Hou, B. Badamdorj, N. V. Tarakina, M. Wang, Q. Wang, X. Wang and M. Antonietti, Adv. Mater., 2023, 35, e2209310 CrossRef PubMed.
- R. T. Mayes, P. F. Fulvio, Z. Ma and S. Dai, Phys. Chem. Chem. Phys., 2011, 13, 2492–2494 RSC.
- L. Wang, X. Dong, H. Jiang, G. Li and M. Zhang, Catal. Commun., 2014, 56, 164–167 CrossRef CAS.
- K. M. Eblagon, A. Arenillas, A. Malaika, M. Fernando, R. Pereira and J. L. Figueiredo, Fuel, 2023, 334, 126610 CrossRef CAS.
- M. J. Valero-Romero, E. M. Calvo-Muñoz, R. Ruiz-Rosas, J. Rodríguez-Mirasol and T. Cordero, Ind. Eng. Chem. Res., 2019, 58, 4042–4053 CrossRef CAS.
- J. Bedia, J. M. Rosas, J. Márquez, J. Rodríguez-Mirasol and T. Cordero, Carbon, 2009, 47, 286–294 CrossRef CAS.
- M. A. Patel, F. Luo, M. R. Khoshi, E. Rabie, Q. Zhang, C. R. Flach, R. Mendelsohn, E. Garfunkel, M. Szostak and H. He, ACS Nano, 2016, 10, 2305–2315 CrossRef CAS PubMed.
- X. Hu, M. Fan, Y. Zhu, Q. Zhu, Q. Song and Z. Dong, Green Chem., 2019, 21, 5274–5283 RSC.
- K. Sun, H. Shan, R. Ma, P. Wang, H. Neumann, G. P. Lu and M. Beller, Chem. Sci., 2022, 13, 6865–6872 RSC.
- X. Li, Z. Yuan, Y. Liu, H. Yang, J. Nie, G. Wang and B. Liu, ChemSusChem, 2022, 15, e202200753 CrossRef CAS PubMed.
- J. Zhang, X. Liu, R. Blume, A. Zhang, R. Schlogl and D. S. Su, Science, 2008, 322, 73–77 CrossRef CAS PubMed.
- S. Shang, Y. Li, Y. Lv and W. Dai, Asian J. Org. Chem., 2022, 11 Search PubMed.
- A. Mollar-Cuni, D. Ventura-Espinosa, S. Martin, H. Garcia and J. A. Mata, ACS Catal., 2021, 11, 14688–14693 CrossRef CAS PubMed.
- R. Imamura, K. Matsui, S. Takeda, J. Ozaki and A. Oya, Carbon, 1999, 37, 261–267 CrossRef CAS.
- D. V. Moiseev and B. R. James, Phosphorus, Sulfur Silicon Relat. Elem., 2019, 195, 263–279 CrossRef.
- D. V. Moiseev and B. R. James, Phosphorus, Sulfur Silicon Relat. Elem., 2020, 195, 687–712 CrossRef CAS.
- A. Granzow, J. Am. Chem. Soc., 1977, 99, 2648–2652 CrossRef CAS.
- A. Basch, B. Zvilichovsky, B. Hirshmann and M. Lewin, J. Polym. Sci., Polym. Chem. Ed., 1979, 17, 27–37 CrossRef CAS.
- W. A. Reeves and J. D. Guthrie, Ind. Eng. Chem., 1956, 48, 64–67 CrossRef CAS.
- Global Tetrakis (Hydroxymethyl) Phosphonium Sulfate Market Research Report 2022, Market Reports World.
- X. Liu, N. Fechler and M. Antonietti, Chem. Soc. Rev., 2013, 42, 8237–8265 RSC.
- N. Díez, A. B. Fuertes and M. Sevilla, Energy Storage Mater., 2021, 38, 50–69 CrossRef.
- D. V. Moiseev and B. R. James, Inorg. Chim. Acta, 2011, 379, 23–27 CrossRef CAS.
- J. Pampel, A. Mehmood, M. Antonietti and T. P. Fellinger, Mater. Horiz., 2017, 4, 493–501 RSC.
- N. Fechler, T. P. Fellinger and M. Antonietti, Adv. Mater., 2013, 25, 75–79 CrossRef CAS PubMed.
- E. L. Smith, A. P. Abbott and K. S. Ryder, Chem. Rev., 2014, 114, 11060–11082 CrossRef CAS PubMed.
- R. F. André, J. Brandt, J. Schmidt, N. López-Salas, M. Odziomek and M. Antonietti, Carbon, 2024, 223, 118946 CrossRef.
- M. Thommes, K. Kaneko, A. V. Neimark, J. P. Olivier, F. Rodriguez-Reinoso, J. Rouquerol and K. S. W. Sing, Pure Appl. Chem., 2015, 87, 1051–1069 CrossRef CAS.
- J. Kruse, P. Leinweber, K. U. Eckhardt, F. Godlinski, Y. Hu and L. Zuin, J. Synchrotron Radiat., 2009, 16, 247–259 CrossRef CAS PubMed.
- A. Favron, E. Gaufres, F. Fossard, A. L. Phaneuf-L'Heureux, N. Y. Tang, P. L. Levesque, A. Loiseau, R. Leonelli, S. Francoeur and R. Martel, Nat. Mater., 2015, 14, 826–832 CrossRef CAS PubMed.
- R. Fu, L. Liu, W. Huang and P. Sun, J. Appl. Polym. Sci., 2003, 87, 2253–2261 CrossRef CAS.
- Handbook of Phosphorus-31 Nuclear Magnetic Resonance Data ( 1990), 2017.
- A. M. Puziy, O. I. Poddubnaya, R. P. Socha, J. Gurgul and M. Wisniewski, Carbon, 2008, 46, 2113–2123 CrossRef CAS.
- Y. Wang, S. Zuo, J. Yang and S. H. Yoon, Langmuir, 2017, 33, 3112–3122 CrossRef CAS PubMed.
- W. Zhang, J. Barrio, C. Gervais, A. Kocjan, A. Yu, X. Wang and M. Shalom, Angew. Chem., 2018, 57, 9764–9769 CrossRef CAS PubMed.
- W. Schnick, J. Lücke and F. Krumeich, Chem. Mater., 1996, 8, 281–286 CrossRef CAS.
- A. Schmidpeter and K. Schumann, Z. Naturforsch., B: Chem. Sci., 1970, 25, 1364–1370 CrossRef CAS.
- J. M. Mateo, A. de la Hoz, L. Uson, M. Arruebo, V. Sebastian and M. V. Gomez, Nanoscale Adv., 2020, 2, 3954–3962 RSC.
- G. Biagiotti, V. Lange, C. Ligi, S. Caporali, M. Muniz-Miranda, A. Flis, K. M. Pietrusiewicz, G. Ghini, A. Brandi and S. Cicchi, Beilstein J. Nanotechnol., 2017, 8, 485–493 CrossRef CAS PubMed.
- J. Chastain and R. C. KingJr, PerkinElmer Corp., 1992, 40, 221 Search PubMed.
- F. G. d A. Dias, L. S. G. Souza, A. G. Veiga, A. K. Andreopoulou, J. K. Kallitsis and M. L. M. Rocco, Surf. Interface Anal., 2023, 55, 677–682 CrossRef CAS.
- W. Qi and D. Su, ACS Catal., 2014, 4, 3212–3218 CrossRef CAS.
- J. Sheng, B. Yan, W. D. Lu, B. Qiu, X. Q. Gao, D. Wang and A. H. Lu, Chem. Soc. Rev., 2021, 50, 1438–1468 RSC.
- W. Qi, P. Yan and D. S. Su, Acc. Chem. Res., 2018, 51, 640–648 CrossRef CAS PubMed.
- H. Hu, Y. Nie, Y. Tao, W. Huang, L. Qi and R. Nie, Sci. Adv., 2022, 8, eabl9478 CrossRef CAS PubMed.
- L. Enders, D. S. Casadio, S. Aikonen, A. Lenarda, T. Wirtanen, T. Hu, S. Hietala, L. S. Ribeiro, M. F. R. Pereira and J. Helaja, Catal. Sci. Technol., 2021, 11, 5962–5972 RSC.
- T. R. Gengenbach, G. H. Major, M. R. Linford and C. D. Easton, J. Vac. Sci. Technol., A, 2021, 39, 013204 CrossRef CAS.
Footnote |
| † Electronic supplementary information (ESI) available: SEM-EDX sample composition for salt system optimization; pore size distribution analysis; XRD, FTIR, and XPS results; XPS fitting parameters; solid-state NMR spectra; conversion of indoline as a function of solvent polarity and catalyst loading; recycling test; NMR spectra of substrate scope. See DOI: https://doi.org/10.1039/d4mh00293h |
| This journal is © The Royal Society of Chemistry 2024 |