
 Open Access Article
 This Open Access Article is licensed under a
 Creative Commons Attribution 3.0 Unported Licence
Insulin-infused bimetallic nano-subclusters as a multifunctional agent for ROS scavenging, antibacterial resilience, and accelerated in vitro cell migration†
Deepinder
Sharda
a and
Diptiman
Choudhury
 *ab
*ab
aDepartment of Chemistry and Biochemistry, Thapar Institute of Engineering and Technology (TIET), Patiala-147004, Punjab, India
bCenter of Excellence in Emerging Materials (CEEMS), Thapar Institute of Engineering and Technology, Patiala, Punjab-147004, India. E-mail: diptiman@thapar.edu; Tel: +91-8196949843
First published on 8th May 2024
Abstract
This is the first report on the synthesis and wound healing application of green synthesized insulin-infused bimetallic (copper–silver) nano-subclusters (ICu–AgNSCs) with high stability, aqueous solubility, biocompatibility, and target specificity. HRTEM and SAED data confirm octahedral particles (with a diameter of 9.6 ± 2.2 nm) composed of discrete copper clusters on the periphery and a silver core that are further infused with an insulin corona (0.5 ± 0.2 nm), as confirmed by the characteristics of Cu–OH and Ag–O stretching bonds and alteration in insulin amide bonds. The ICu–AgNSCs had high insulin loading efficiency (93.90 ± 1.05%) and a high drug release rate (92.69 ± 0.90% within 40 h), making them ideal for sustained release applications. Wound healing in diabetic conditions gets delayed due to the prolonged proinflammatory phase and microbial infestation, which may lead to clinical amputation. Therefore, advanced therapeutics that promote cell growth by reducing inflammation and microbial growth are required. ICu–AgNSCs may satisfy all these criteria. Insulin and quercetin have ROS scavenging and anti-inflammatory properties. Insulin and copper have cellular growth-promoting activity; additionally, silver has antimicrobial properties. ICu–AgNSCs have been shown to accelerate diabetic cell migration in vitro, making them an ideal choice for pre-clinical and clinical applications.
1. Introduction
Wound healing is a significant challenge for the scientific community despite all the available treatments, and the global expenditure on healing wounds ranges from $28.1 to $96.8 billion.1 Healing is a complex event involving overlapping phases, which work together against the damage and restore the lost tissue or organ.2 Healing begins with hemostasis, which involves the activation of platelets, clot formation, and matrix organization. In proliferation, the accumulation of growth factors, connective tissues, and angiogenesis factors occurs at the wound site. In the inflammatory phase, the proinflammatory cytokines promote vasodilation and activate the different signaling pathways. The resynthesis of the extracellular matrix occurs in the remodeling phase to maintain the balance between dead and live cells.3,4 However, certain factors disrupt the normal physiological mechanism of wound healing, including microbial infection, trauma, ischemia, and diabetes mellitus,5,6 which can be avoided by preventing bacterial infestation, removing the dead tissue and debris, and keeping the wound moist.7 In diabetes, there is persistent release of proteases, proinflammatory cytokines, reactive oxygen species, and low secretion of anti-inflammatory cytokines.8 Diabetic wounds are more susceptible to infection due to the body's immune response impairment.6 The activity of different antioxidant enzymes, including glutathione peroxidase and superoxide dismutase, is reduced, which leads to damage by free radical generation.9 Diabetes also affects protein synthesis, re-epithelialization, cell migration, and proliferation of fibroblasts and keratinocytes by preventing the transport of nutrients to the wound site.10,11 Reactive oxygen species (ROS) generation is also a major issue as their accumulation prevents the efficient functioning of macrophages and endogenous stem cells. Also, ROS causes endothelial dysfunction and restricts angiogenesis.12 Additionally, ROS generation due to bacterial infection leads to chronic wound infection by damaging endothelial cells and blood vessels.13,14To promote healing, tremendous research is going on to develop novel formulations that are biocompatible, efficient, environment-friendly, and cost-effective. Here, the role of nanoparticles comes into play as they possess massive potential in diverse fields ranging from drug delivery to bioimaging and wound healing, with anticancer, antimicrobial, and antioxidant activities.15,16 Many nano-formulations using gold, silver, copper, zinc, and cobalt were developed to study their wound healing, antibacterial and antioxidant properties.17–19 Recently, protein-based metallic nanoparticles have gained enormous interest because of their target specificity, biodegradability, ability to alter their surface for efficient attachment of the drugs, and easily metabolizable nature.20 Protein-modified nanoformulations are developed using different proteins, including bovine serum albumin, insulin, transferrin, lactoferrin and silk fibroin.21 All these formulations possess single metal ions and, thus, obtain the properties of those constituent metal ions only. This makes them less effective and unstable, and they tend to form aggregates, gradually decreasing their potential activities. However, the need of the hour is to develop formulations with multiple activities to increase their efficacy. Bimetallic formulations are preferred over monometallic because they can enhance multiple properties depending upon their surface effect, quantum tunneling effect, and quantum size effect.22 They also possess outstanding potential in diverse biomedical applications.23,24 Based on the arrangement of the metal atoms, bimetallic particles can be classified into four major categories: alloyed, intermetallic, subclusters, and core–shell.25 Bimetallic nano-subclusters (BNSCs) are a fascinating class of nanomaterials composed of two distinct metal atoms having two separate phases and a shared interface.26 BNSCs exhibit properties that make them attractive candidates for various applications in catalysis, sensing, and biomedicine. Their ability to encapsulate and deliver therapeutic agents directly to targeted cells offers a promising approach to improving drug treatment's efficacy while minimizing side effects.27 Additionally, BNSCs can be functionalized with targeting ligands to enhance their specificity and selectivity towards specific cell types.28 In this work, we report the synthesis of novel insulin-coated silver–copper bimetallic nano-subclusters having a potential role in promoting cell migration and antioxidant and antibacterial activities.
Silver enhances the differentiation of fibroblasts into myofibroblasts, which promote proliferation and keratinocyte relocation, thus increasing wound contraction. Silver activates macrophages, modulates the inflammatory response, reduces scar formation, and exhibits antimicrobial, anti-inflammatory, and antioxidant activities.29,30 Furthermore, the oxidation of silver leads to the generation of free radicals and reactive oxygen species (ROS), both of which are capable of damaging the biomolecules, including DNA, lipids, and proteins, along with intracellular organelles including mitochondria, ribosomes, vacuoles, etc. in the microbes.31 Copper promotes wound healing by modulating the secretion of various cytokines and growth factors. It stimulates the expression of fibrinogen, collagen, and integrin, which are present in the extracellular matrix and are essential for the attachment of cells to the extracellular matrix. It also exhibits biocidal action.32,33 Copper regulates vascular endothelial growth factor (VEGF), which is essential for forming new blood vessels.34 It enhances the expression of hypoxia-induced factor-1-alpha (HIF-1α), which promotes angiogenesis and skin regeneration.35 Furthermore, quercetin has a massive role in wound healing, as it promotes fibroblast proliferation and migration, decreases the proinflammatory cytokines, reduces the immune cell infiltration, increases the collagen fiber accumulation, and improves the GSH level along with vascular endothelial growth factor, fibroblast growth factor, and alpha-smooth muscle actin levels. Quercetin itself acts as a reducing and stabilizing agent for synthesizing multiple nanoparticles.36,37 Insulin is gaining colossal interest from researchers for its ability to act as a growth factor and to transition the proinflammatory cytokines to anti-inflammatory cytokines, which are essential for inflammation, re-epithelialization, wound repair, and regeneration.38,39 It promotes protein and lipid biosynthesis, stimulates cell glucose uptake, increases cellular differentiation, and promotes cellular migration.40 After binding to the receptors, insulin activates different pathways like Akt, Erk, and NRF-2 pathways to promote wound healing.41,42 The insulin-templated nanoformulations have promising potential for bioimaging, super-resolution microscopy, and wound healing.39,43
Here, we have synthesized the bimetallic nanosubclusters to check the synergism between silver nanoparticles and insulin-loaded copper quantum clusters for healing wounds when linked together to yield formulations in the nano-range. To maintain the affected individual's quality of life, there is a need to explore potent and effective agents that not only have effective drug delivery potential but also have antimicrobial and antioxidant potency to yield better outcomes without making the process cumbersome, costly, and risky for the patient's life.
2. Materials and methods
2.1 Chemicals and the cell line
Silver nitrate (AgNO3), copper sulfate (CuSO4), formaldehyde, HCl, NaOH, and H2O2 were of analytical grade and were purchased from HiMedia, India. Recombinant human insulin was purchased from Elli Lilly, India. For cell culture, DMEM cell culture media, Fetal Bovine Serum (FBS), 100× penicillin–streptomycin, and phosphate buffered saline (PBS) having pH 7.4 were purchased from HiMedia, India. Human primary epithelial keratinocytes (HEKa cells) ATCC-PCS-200-011 were procured from Himedia, India. The cells were cultured, maintained, and treated with DMEM containing 5% FBS at 37 °C and 5% CO2. The bacterial strains used for investigating antibacterial activity include Escherichia coli (MTCC no. 448), Bacillus subtilis (MTCC no. 441), Acinetobacter calcoaceticus (MTCC no. 1948), and Staphylococcus aureus (MTCC no. 902), which were procured from IMTech, Chandigarh, India.2.2 Synthesis of bimetallic nano-subclusters
At first, the insulin-protected copper quantum clusters (ICuQCs) were prepared by following a previously reported one-pot method. The insulin solution with a final concentration of 1.82 mM was prepared, and using NaOH solution (0.1 M), its pH was adjusted to 10.5 and kept in the dark. Afterward, a salt solution (CuSO4·5H2O) of the same concentration was prepared, followed by mixing insulin and salt solution in 1![[thin space (1/6-em)]](https://www.rsc.org/images/entities/char_2009.gif) :1, which was further followed by adjustment of the pH of the final solution to a physiological pH of 7.4, using HCl (0.1 N). The resulting solution was kept in the incubator at slow stirring (240 rpm) for 24 h at 37 °C. The final solution was dialyzed using a 10 kDa cut-off dialysis membrane, stored at 4 °C. After that, silver nanoparticles (AgNPs) were prepared to have the same concentration using quercetin and by slightly modifying the previously reported method44 and incubated in the dark with the earlier formed insulin copper quantum clusters for 24 h at 37 °C to obtain the bimetallic nano-subclusters (ICu–AgNSCs) as shown in Fig. 1a. Then, the final solution was again dialyzed using a 10 kDa cut-off dialysis membrane, stored at 4 °C, and used further for characterization and biological studies.
:1, which was further followed by adjustment of the pH of the final solution to a physiological pH of 7.4, using HCl (0.1 N). The resulting solution was kept in the incubator at slow stirring (240 rpm) for 24 h at 37 °C. The final solution was dialyzed using a 10 kDa cut-off dialysis membrane, stored at 4 °C. After that, silver nanoparticles (AgNPs) were prepared to have the same concentration using quercetin and by slightly modifying the previously reported method44 and incubated in the dark with the earlier formed insulin copper quantum clusters for 24 h at 37 °C to obtain the bimetallic nano-subclusters (ICu–AgNSCs) as shown in Fig. 1a. Then, the final solution was again dialyzed using a 10 kDa cut-off dialysis membrane, stored at 4 °C, and used further for characterization and biological studies.
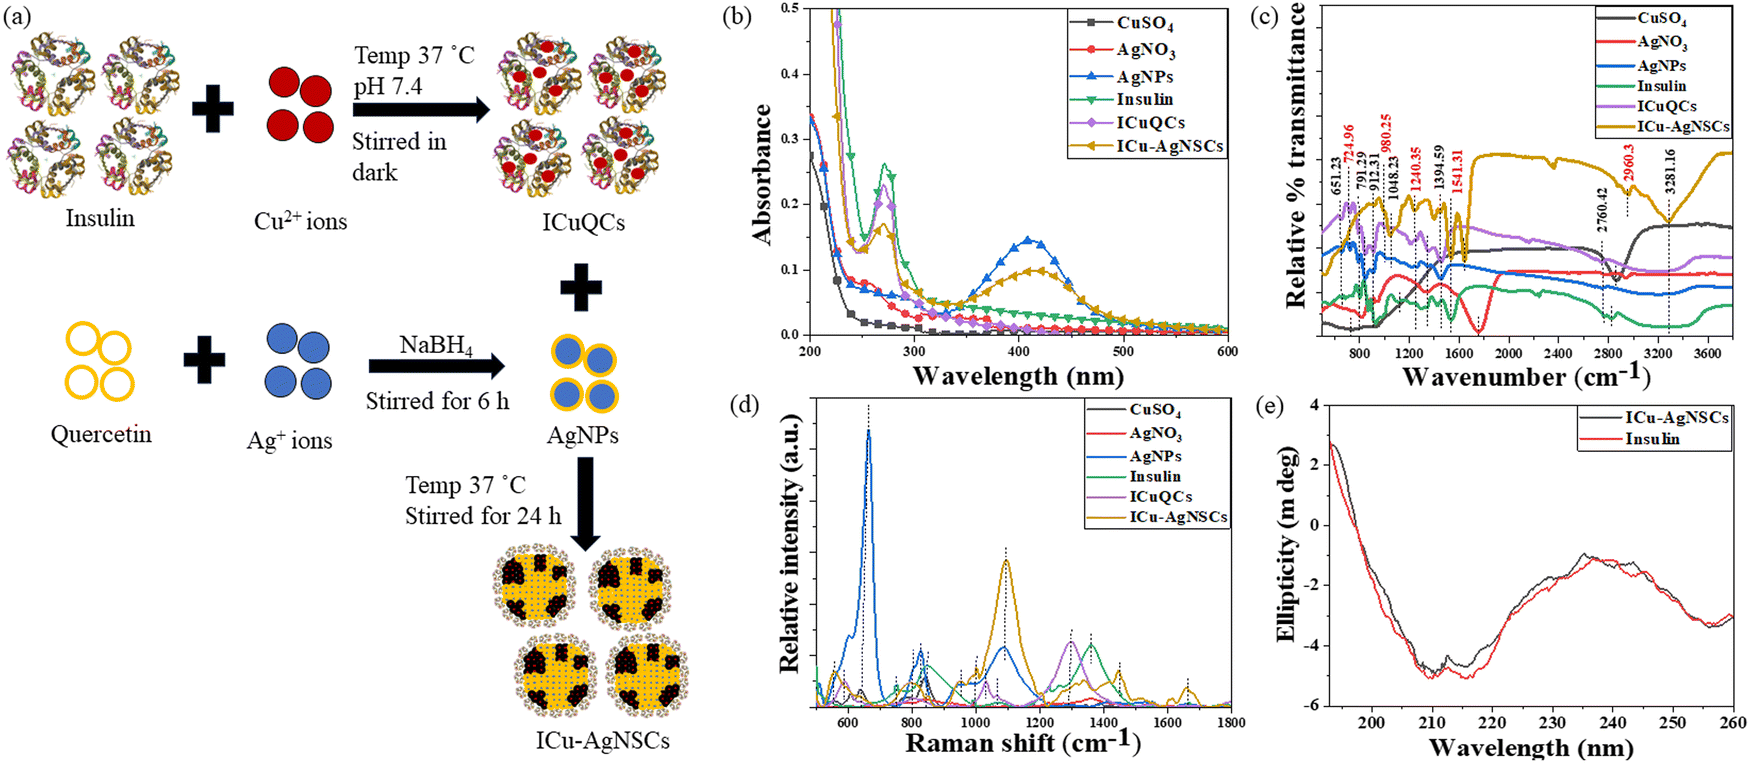 | ||
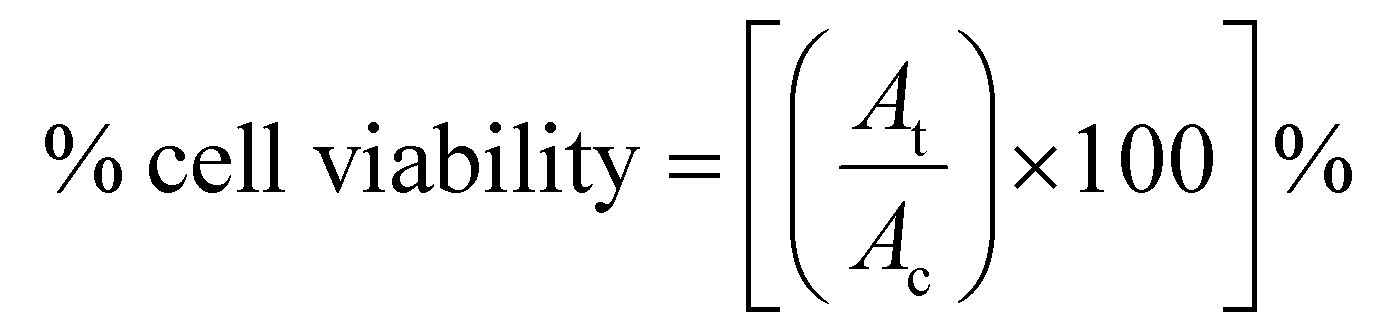
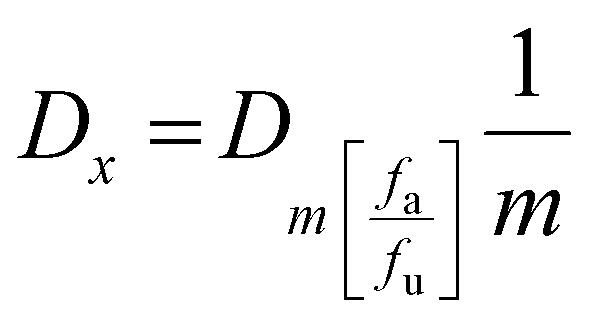
| Fig. 1 Synthesis and spectroscopic studies confirming the interactions between ICuQCs and AgNPs for synthesizing ICu–AgNSCs. (a) Schematic representation of the synthesis protocol being followed for formulating bimetallic nanosubclusters. (b) UV-visible absorption spectra showing the peak of pure insulin, ICuQCs, and ICu–AgNSCs at ∼272 nm and a peak at ∼412 nm for AgNPs and ICu–AgNSCs, confirming the interaction between the two. (c) FTIR spectra of CuSO4, AgNO3, AgNPs, insulin, ICuQCs and ICu–AgNSCs in the range of 400–4000 cm−1, indicating the formation of new bonds; Cu–OH stretching and the Ag–O bond, which were otherwise not present in pure insulin. (d) Raman spectra of CuSO4, AgNO3, AgNPs, insulin, ICuQCs and ICu–AgNSCs indicate the involvement of different functional groups of insulin in synthesizing ICu–AgNSCs. (e) Circular dichroism confirms the stability of secondary protein structure with minimal changes even after the synthesis of ICu–AgNSCs. | ||
2.3 Study of interactions using spectroscopic techniques
Initially, to monitor the interactions between the AgNPs and ICuQCs to form ICu–AgNSCs, UV-visible absorbance studies were done by using the UV-2600 spectrophotometer (Shimadzu), which was operated between 200 and 800 nm, and a 4000 μl quartz cuvette having a path length of 1 cm was used to determine the absorbance of both the salt solutions (CuSO4 and AgNO3), AgNPs, insulin, ICuQCs, and insulin linked bimetallic nano-subclusters (ICu–AgNSCs).To study the metal–protein interactions of the ICu–AgNSCs, FTIR was performed using an Agilent Cary 600 series spectrophotometer. The potassium bromide (KBr) method was used to prepare the sample pellets. The sample scanning was done from 400 cm−1 to 4000 cm−1 to monitor the changes in certain specific bonds.
Furthermore, the same samples were analyzed using surface enhanced Raman scattering (SERS) spectroscopy to study the structural changes in insulin protein. All the samples were prepared on a silicon wafer ten minutes before the measurement. The samples were scanned from 500 cm−1 to 1800 cm−1. The LabRam Hr Evolution Horiba, equipped with a detector and microscope, was used to record the Raman spectra of insulin and ICu–AgNSCs at 785 nm.
Furthermore, circular dichroism (CD), the most reliable technique, was used to monitor the stability of secondary protein structures after the interactions between protein molecules and metallic nanoparticles. The CD studies were performed at 25 °C with 1 ml of the sample in the 200–260 nm wavelength range for pure insulin and ICu–AgNSCs using phosphate buffer (pH 7.4) as a solvent with a Mos500 CD BioLogic instrument.
2.4 Study of particle size and morphology and elemental analysis
DLS analysis (dynamic light scattering) was done using a Malvern DLS-Zeta size analyzer to determine the hydrodynamic size of synthesized ICu–AgNSCs. Thereafter, to find out the morphology and size of bimetallic nanosubclusters, high-resolution transmission electron microscopy (HRTEM) (Talos F200S G2, Thermo Scientific) was used. For this, the samples were centrifuged at 240 rpm for 15 minutes, and then the pellet was thoroughly washed to remove the unbound metal salt or impurities associated with the sample. Furthermore, the sample pellet was subjected to elemental mapping to find out the distribution of metal salts in the sample and to determine the percentage of the elements present by using the Energy dispersive X-ray spectrometer (EDS) (Bruker QUANTAX 200).2.5 Drug loading and release kinetics
To monitor the drug loading in the nanosubclusters, 1 ml of the synthesized ICu–AgNSCs was centrifuged for 15 min at 6000 rpm. The supernatant and the pellet were collected to determine the amount of bind and free drug and, thus, determine the drug loading capacity of the formulations. After that, the release kinetics were investigated to determine the amount of insulin released from the nanosubclusters and, thus, determine the drug delivery efficiency. 1 ml of the synthesized nanosubclusters was taken, placed in a dialysis membrane, and kept under slow stirring conditions (250–300 rpm). The drug release was measured at specific time intervals for 40 hours under physiological conditions of pH 7.4 and a temperature of 37 °C. The absorption values (at 595 nm) were later plotted to determine the trend of drug release using BSA standard curves.2.6 In vitro studies
 | (1) |
2.8 Determination of the combination index (CI) for AgNO3 and ICuQCs
The combination index (CI) is one of the quantitative measures used to calculate the effect of different drugs in combination with one another. The drug combination index was estimated when investigating synergistic or antagonistic drug combinations to quantify the level of synergism or antagonism. If the value of the combination index is less than 1 (CI < 1), it indicates that different drugs, when administered together, work together to promote each other's activity, called the synergistic effect. When the CI value is equal to 1 (CI = 1), it indicates that none of the two drugs interfere with each other's action, hence exhibiting the additive effect, and a CI value of greater than 1 (CI >1) shows the inhibitory activity of one drug on the other drug, thus called the antagonistic effect. To calculate the combination index, the cell viability of HEKa cells was determined at different concentrations of AgNO3 and ICuQCs, and then calculations were done using the following equation (eqn (2)). | (2) |
 | (3) |
2.9 Statistical analysis
The data here are represented as mean ± SD of at least three independent experiments. The statistical data analysis was done in MS excel using one-way ANOVA. The corresponding p-values were calculated to check if the data were statistically significant or not.3. Results and discussion
3.1 Spectroscopic analysis
![[double bond, length as m-dash]](https://www.rsc.org/images/entities/char_e001.gif) S stretching, respectively, in AgNPs, insulin, ICuQCs, and ICu–AgNSCs.40 Then, peaks at 724.96 cm−1 for CuSO4 and at 718.19 cm−1 for ICuQCs and ICu–AgNSCs indicate Cu–OH stretch.48 Ag–O stretching was observed for AgNO3, AgNPs, and ICu–AgNSCs at 946.16 cm−1, 986.79 cm−1, and 980.25 cm−1 respectively.49 In addition to these, peaks at 912.31 cm−1 and 845.34 cm−1 for AgNPs, at 925.85 cm−1 for insulin, at 912.31 cm−1 and 838.57 cm−1 for ICuQCs and at 912.31 cm−1 for ICu–AgNSCs show the C–O stretching, confirming the interaction between AgNPs and ICuQCs.39 Peaks at 1113.20 cm−1 for insulin and 1048.23 cm−1 for ICu–AgNSCs show C–N stretching.40 Amide III stretching was observed for insulin and ICuQCs and ICu–AgNSCs at 1207.25 cm−1 and 1240.23 cm−1 respectively. NO3 symmetric and asymmetric stretch was observed in AgNO3 at 1320.86 cm−1, in AgNPs at 1341.17 cm−1, in insulin at 1307.31 cm−1, in ICuQCs at 1347.51 cm−1 and at 1394.59 cm−1 in ICu–AgNSCs, respectively.50 C–OH stretching was observed at 1448.32 cm−1 in AgNPs and ICuQCs, at 1420.83 cm−1 in insulin, and at 1441.24 cm−1 in ICu–AgNSCs.38 Amide II, CO stretch was observed at 1535.29 cm−1 in insulin and at 1541.31 cm−1 in ICu–AgNSCs.38 NO stretching was observed at 1755.74 cm−1 in AgNO3 and at 1642.13 cm−1 in ICu–AgNSCs.50 Nitrile stretch was marked at 2247.81 cm−1, 2160.53 cm−1, and 2351.64 cm−1 in insulin, ICuQCs, and ICu–AgNSCs respectively.40 A broad peak of –OH stretch was observed for all the formulations between 2760.42 cm−1 and 2867.03 cm−1.38 Amide B C–H stretch was observed at 2827.15 cm−1 and 2960.32 cm−1, respectively, in insulin and ICu–AgNSCs.40 The amine N–H stretch was observed in insulin, ICuQCs, and ICu–AgNSCs at 3281.16 cm−1.39 The comparative wavenumbers of each solution are given in Table 1.
S stretching, respectively, in AgNPs, insulin, ICuQCs, and ICu–AgNSCs.40 Then, peaks at 724.96 cm−1 for CuSO4 and at 718.19 cm−1 for ICuQCs and ICu–AgNSCs indicate Cu–OH stretch.48 Ag–O stretching was observed for AgNO3, AgNPs, and ICu–AgNSCs at 946.16 cm−1, 986.79 cm−1, and 980.25 cm−1 respectively.49 In addition to these, peaks at 912.31 cm−1 and 845.34 cm−1 for AgNPs, at 925.85 cm−1 for insulin, at 912.31 cm−1 and 838.57 cm−1 for ICuQCs and at 912.31 cm−1 for ICu–AgNSCs show the C–O stretching, confirming the interaction between AgNPs and ICuQCs.39 Peaks at 1113.20 cm−1 for insulin and 1048.23 cm−1 for ICu–AgNSCs show C–N stretching.40 Amide III stretching was observed for insulin and ICuQCs and ICu–AgNSCs at 1207.25 cm−1 and 1240.23 cm−1 respectively. NO3 symmetric and asymmetric stretch was observed in AgNO3 at 1320.86 cm−1, in AgNPs at 1341.17 cm−1, in insulin at 1307.31 cm−1, in ICuQCs at 1347.51 cm−1 and at 1394.59 cm−1 in ICu–AgNSCs, respectively.50 C–OH stretching was observed at 1448.32 cm−1 in AgNPs and ICuQCs, at 1420.83 cm−1 in insulin, and at 1441.24 cm−1 in ICu–AgNSCs.38 Amide II, CO stretch was observed at 1535.29 cm−1 in insulin and at 1541.31 cm−1 in ICu–AgNSCs.38 NO stretching was observed at 1755.74 cm−1 in AgNO3 and at 1642.13 cm−1 in ICu–AgNSCs.50 Nitrile stretch was marked at 2247.81 cm−1, 2160.53 cm−1, and 2351.64 cm−1 in insulin, ICuQCs, and ICu–AgNSCs respectively.40 A broad peak of –OH stretch was observed for all the formulations between 2760.42 cm−1 and 2867.03 cm−1.38 Amide B C–H stretch was observed at 2827.15 cm−1 and 2960.32 cm−1, respectively, in insulin and ICu–AgNSCs.40 The amine N–H stretch was observed in insulin, ICuQCs, and ICu–AgNSCs at 3281.16 cm−1.39 The comparative wavenumbers of each solution are given in Table 1.
| Functional group | CuSO4 | AgNO3 | AgNPs | Insulin | ICuQCs | ICu–AgNSCs | Ref. |
|---|---|---|---|---|---|---|---|
| Amine NH stretch | — | — | — | 3281.16 | 3281.16 | 3281.16 | 39 |
| Amide-B –CH stretch | — | — | — | 2827.15 | — | 2960.32 | 40 |
| –OH stretch | 2860.25 | 2760.42 | 2760.42 | 2760.42 | 2760.42 | 2867.03 | 38 |
| Nitrile stretch | — | — | — | 2247.81 | 2160.53 | 2351.64 | 40 |
| NO stretching |
— | 1755.74 | — | — | — | 1642.13 | 50 |
| Amide II CO stretch |
— | — | — | 1535.29 | — | 1541.31 | 38 |
| C–OH stretch | — | — | 1448.32 | 1420.93 | 1448.32 | 1441.24 | 38 |
| NO3 symmetric and asymmetric stretch | — | 1320.86 | 1341.17 | 1307.31 | 1347.51 | 1394.59 | 50 |
| Amide III stretching | — | — | — | 1207.25 | 1207.25 | 1240.35 | 50 |
| C–N stretch | — | — | — | 1113.20 | — | 1048.23 | 40 |
| Ag–O stretching | — | 946.16 | 986.79 | — | — | 980.25 | 49 |
| C–O stretch | — | — | 912.31 | 925.85 | 912.31 | 912.31 | 39 |
| 845.34 | 838.57 | ||||||
| NH2 stretch | — | 791.29 | 791.29 | 791.29 | 791.29 | 791.29 | 40 |
| –Cu–OH stretch | 724.96 | — | — | — | 718.19 | 718.19 | 48 |
| CS stretch |
— | — | 651.23 | 651.23 | 651.23 | 651.23 | 40 |
Similarly, Raman spectral analysis was used to study the significant conformational changes in insulin after interaction with metal ions. The S–S stretch was observed at 598.10 cm−1, 584.76 cm−1, and 554.24 cm−1, respectively, in AgNPs, ICuQCs and ICu–AgNSCs.51 The band at 662.45 cm−1 is observed for AgNO3, AgNPs, ICuQCs, and ICu–AgNSCs, indicating a C–S–C bond.52 The bands at 793.13 cm−1 for CuSO4 and ICuQCs and at 794.12 cm−1 for ICu–AgNSCs indicate the Cu–OH stretching.48 The C–H out-of-plane wagging was observed at 847.81 cm−1 in CuSO4 and insulin, at 841.74 cm−1 in AgNO3 and ICuQCs, at 828.70 cm−1 in AgNPs and 849.74 cm−1 in ICu–AgNSCs.52 The Ag–O stretching was observed at 947.26 cm−1 in AgNPs and ICu–AgNSCs and at 931.12 cm−1 in AgNO3.49 The C–O–C bond was observed at 986.23 cm−1 in insulin and ICu–AgNSCs.40 The peaks at 995.87 cm−1, 970.38 cm−1, and 1002.69 cm−1 for insulin, ICuQCs, and ICu–AgNSCs, respectively, indicate the C–C stretching.53 C–N stretching was observed in AgNPs, insulin, ICuQCs, and ICu–AgNSCs, respectively, at 1086.86 cm−1, 1071.15 cm−1, 1072.34 cm−1 and 1097.53 cm−1.54 Amide III (α-helix) was observed at 1229.43 cm−1 in insulin and ICu–AgNSCs.55 The band for Amide III random coils was observed at 1283.37 cm−1 for insulin, 1301.75 cm−1 for ICuQCs, and 1311.24 cm−1 and 1340.28 cm−1 for ICu–AgNSCs.56 The C–H bend was observed at 1364.12 cm−1 in ICu–AgNSCs.40 The peak for Amide II was observed at 1442.80 cm−1 and 1445.50 cm−1, respectively, for insulin and ICu–AgNSCs.20 The peak at 1516.32 for insulin, ICuQCs, and ICu–AgNSCs indicates the C–C stretch.40 The peaks for Amide I were observed at 1658.21 cm−1 for insulin and ICu–AgNSCs and at 1606.23 cm−1 for ICu–AgNSCs alone20 and are shown in Fig. 1d. The comparative wavenumbers of each solution are mentioned in Table 2.
| Functional group | CuSO4 | AgNO3 | AgNPs | Insulin | ICuQCs | ICu–AgNSCs | Ref. |
|---|---|---|---|---|---|---|---|
| Amide-I | — | — | — | 1658.21 | — | 1606.23 | 20 |
| 1658.21 | |||||||
| C–C stretch | — | — | — | 1516.32 | 1516.32 | 1516.32 | 40 |
| Amide-II | — | — | — | 1442.80 | — | 1445.50 | 20 |
| C–H bend | — | — | — | — | — | 1364.12 | 40 |
| Amide-III (random coils) | — | — | — | 1283.37 | 1301.75 | 1311.24 | 56 |
| 1340.28 | |||||||
| Amide III (α helix) | — | — | — | 1229.43 | — | 1229.43 | 55 |
| C–N stretching | — | — | 1086.86 | 1071.15 | 1072.34 | 1097.53 | 54 |
| C–C stretching | — | — | — | 995.87 | 970.38 | 1002.69 | 53 |
| C–O–C | — | — | — | 986.23 | — | 986.23 | 40 |
| Ag–O stretching | 931.12 | — | 947.26 | — | — | 947.26 | 49 |
| C–H out of plane wagging | 847.08 | 841.74 | 828.70 | 847.81 | 841.74 | 849.74 | 52 |
| Cu–OH stretch | 793.13 | — | — | — | 793.13 | 794.12 | 48 |
| C–S–C stretching vibrations | — | 662.45 | 662.45 | — | 662.45 | 662.45 | 52 |
| S–S stretch | — | — | 598.10 | — | 584.76 | 554.24 | 51 |
Circular dichroism was performed using the insulin protein and ICu–AgNSCs to monitor the stability of the secondary structure of protein after interaction with metal ions from silver nanoparticles and insulin copper quantum clusters. The three significant far UV signals were observed for both solutions. A positive peak was observed at ∼194 nm (representative of the β-sheet), and two negative peaks, one at ∼208 nm and the other at ∼217 nm, were observed (representative of the α-helix), indicating the secondary structure of insulin protein.57 Slight variations in all three peaks were observed for ICu–AgNSCs, that is, 5.57%, 3.75%, and 5.15%, respectively, and are shown in Fig. 1e. The % variation is much less when compared with pure insulin, confirming protein stability with no significant observable structural changes.
3.2 Structure, composition, and stoichiometry of metal insulin nanosubclusters
The hydrodynamic sizes of AgNPs, ICuQCs, and ICu–AgNSCs were measured and found to be 25 ± 5 nm, 35 ± 5 nm, and 40 ± 5 nm, respectively, as shown in Fig. S1a–c (ESI) respectively. Furthermore, the formation of nearly octahedral bimetallic nano-subclusters (ICu–AgNSCs) having a size of 9.6 ± 2.2 nm and an outer insulin layer (0.5 ± 0.2 nm) was confirmed by transmission electron microscopic images (at scales of 20 and 2 nm) as shown in Fig. 2a and b, respectively, and the SAED pattern obtained is shown in Fig. 2c. Additionally, the lattice fringes in HRTEM were spaced apart by 0.23 nm and 0.17 nm and were indexed with Ag(111) and Cu(200) respectively. It was found that copper is mainly present in the peripheral region, and silver is inside, forming distinct phases with copper. Furthermore, it was evident from the percentages obtained for Ag and Cu in the nanoparticles (7.63% and 6.17%) that silver is in higher amounts, which is further confirmed by the TEM image, where the electron-dense portion indicates copper and the rest of the part is for silver having lower electron density. Energy-dispersive X-ray spectroscopy was used for the determination of different elements, including C, O, Cu, and Ag, in the bimetallic nano-subclusters as shown in spectra given in Fig. 2d. Elemental mapping was done to verify the presence of both silver and copper in the synthesized bimetallic nano-subclusters, and it confirms the presence of carbon (Fig. 2e), oxygen (Fig. 2f), silver (Fig. 2g), copper (Fig. 2h) and a combination of all elements, as shown in Fig. 2i.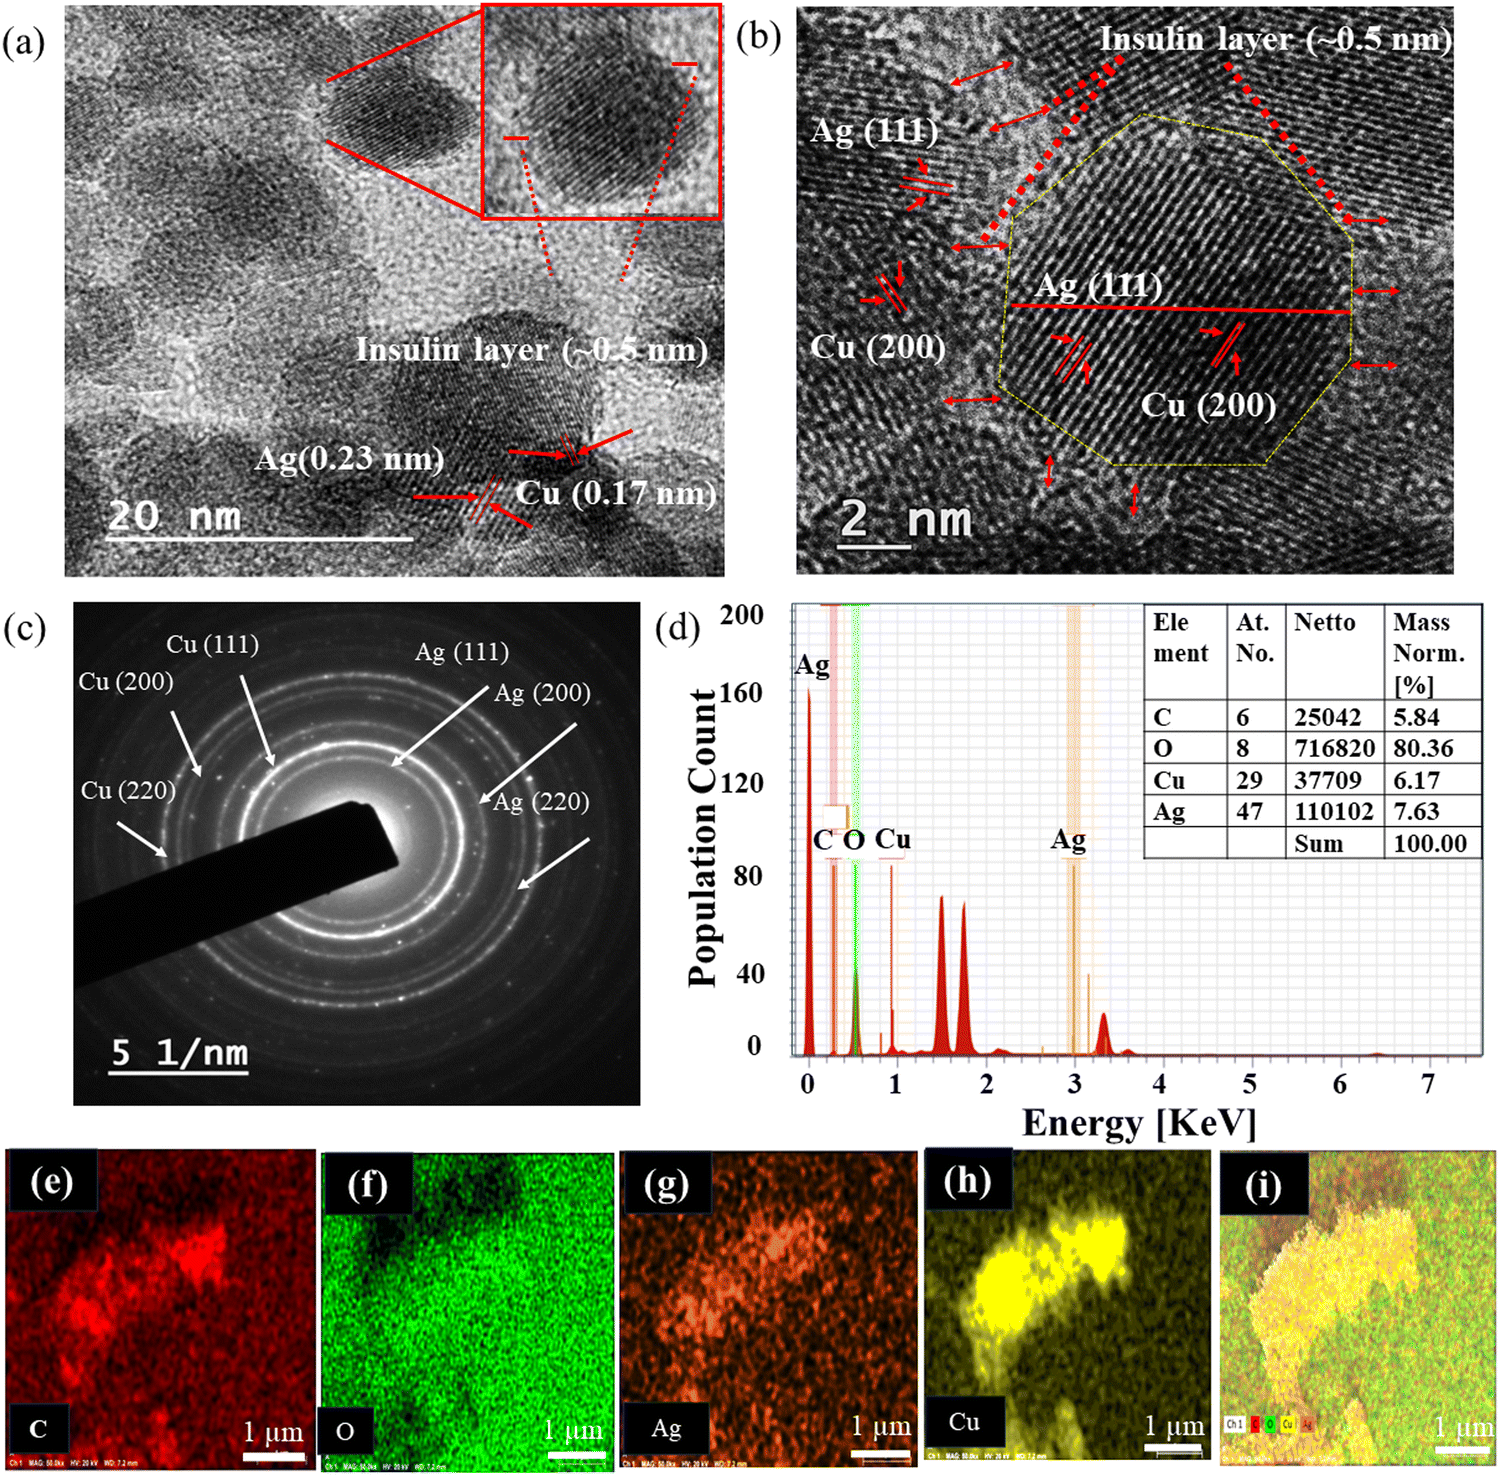 | ||
| Fig. 2 Structural, morphological, and elemental characterization of ICu–AgNSCs. TEM micrographs of ICu–AgNSCs show the nanoparticle size to be ∼9.6 ± 2.2 nm at scales of (a) 20 nm and (b) 2 nm (inset shows the insulin layer of 0.5 ± 0.2 nm around individual bimetallic clusters). (c) SAED confirms the crystalline structure of bimetallic nanosubclusters. (d) EDS spectra show the presence of both silver and copper (inset shows the relative percentage of each element). Elemental mapping showing the different elements in ICu–AgNSCs: (e) carbon, (f) oxygen, (g) silver, (h) copper, and (i) the combined image showing all elements. | ||
3.3 Drug loading and release kinetics studies
The synthesized bimetallic nanosubclusters were studied for their drug loading and release kinetics, and the encapsulation efficiency of insulin in the bimetallic nanosubclusters was determined to be 88.54 ± 0.40%. For the initial 8 h, burst drug release was observed, followed by sustained drug release after that, with most of the drug being released in 40 h. Furthermore, the percentage of drug released from ICu–AgNSCs by the end of 40 hours was found to be 93.90 ± 0.90%, making it an efficient drug delivery system, and is shown in Fig. 3a and the drug released per hour in mg ml−1 is shown in Fig. 3b.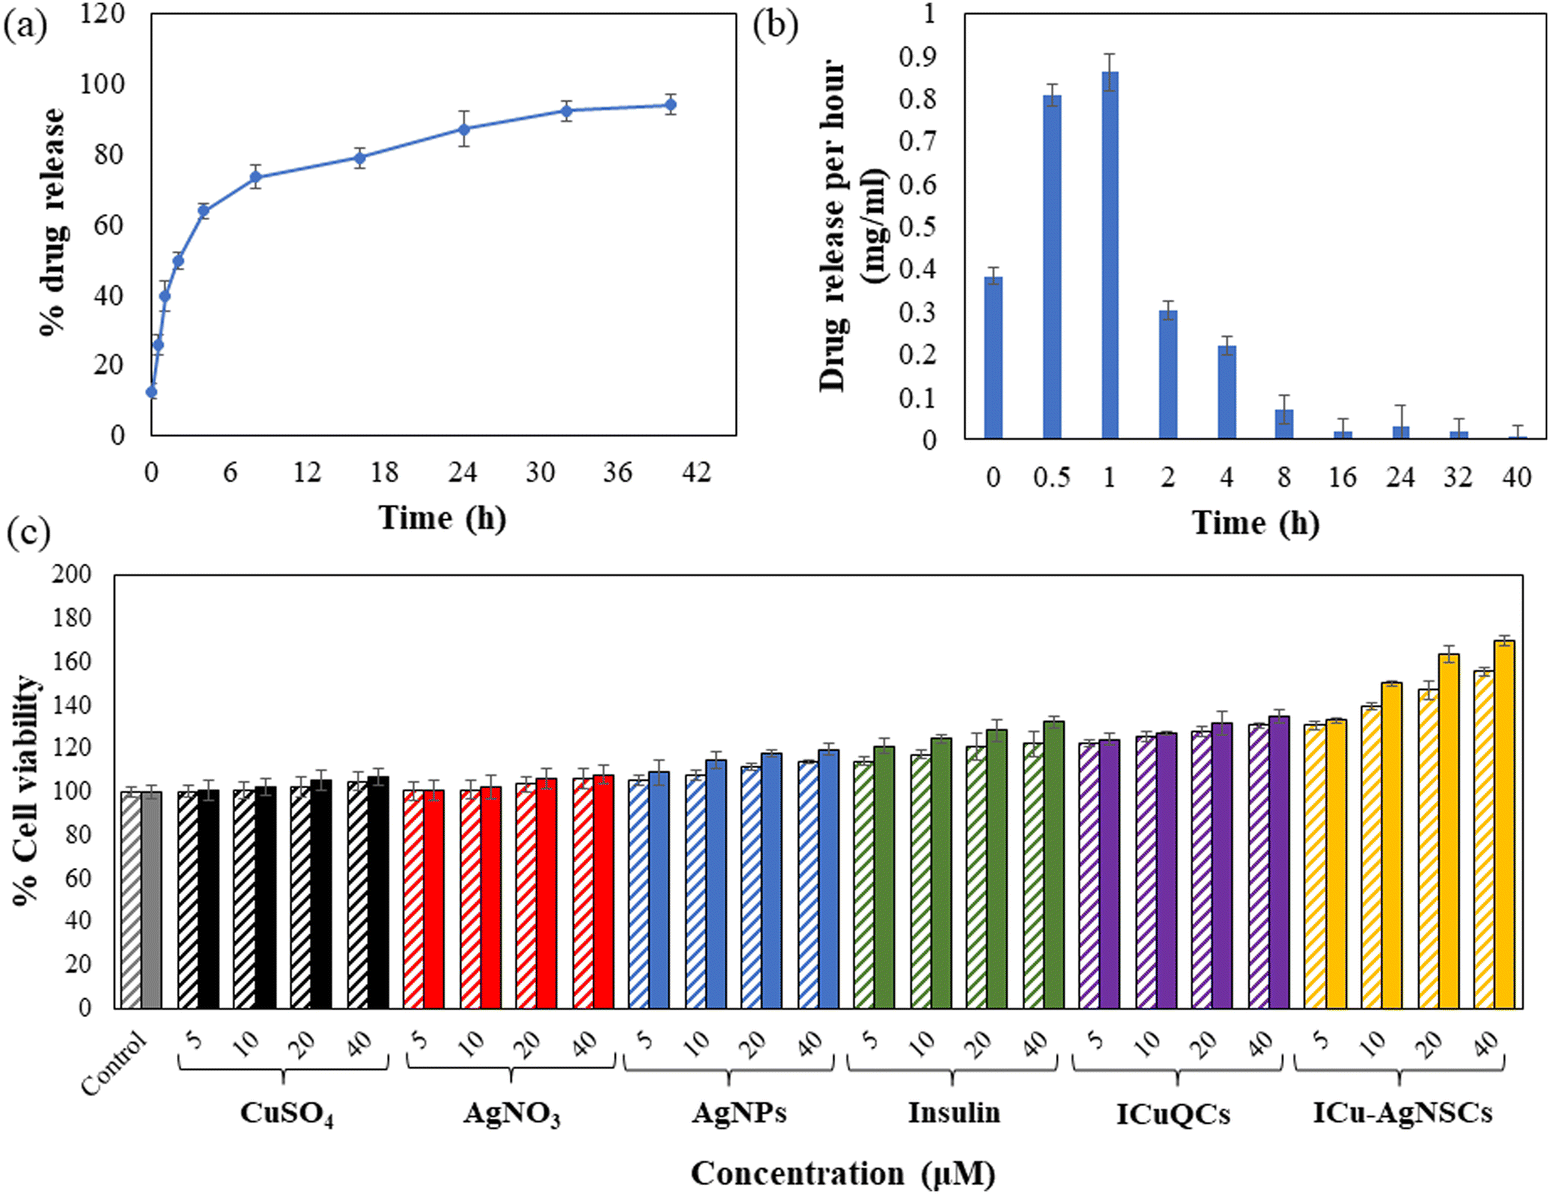 | ||
| Fig. 3 Drug release kinetics and cell viability assay. (a) The plot showing the release kinetic studies to determine the % drug released from the bimetallic nanosubclusters. (b) The drug released per hour in mg ml−1 from ICu–AgNSCs. (c) MTT assay to determine the effect of synthesized formulations on the cell viability to determine their potential role in cell growth and wound healing. The data were plotted as the mean value of three independent experiments, and the solid bars indicate normal conditions, while the patterned bars indicate diabetic conditions in the graph. | ||
3.4 In vitro cell studies
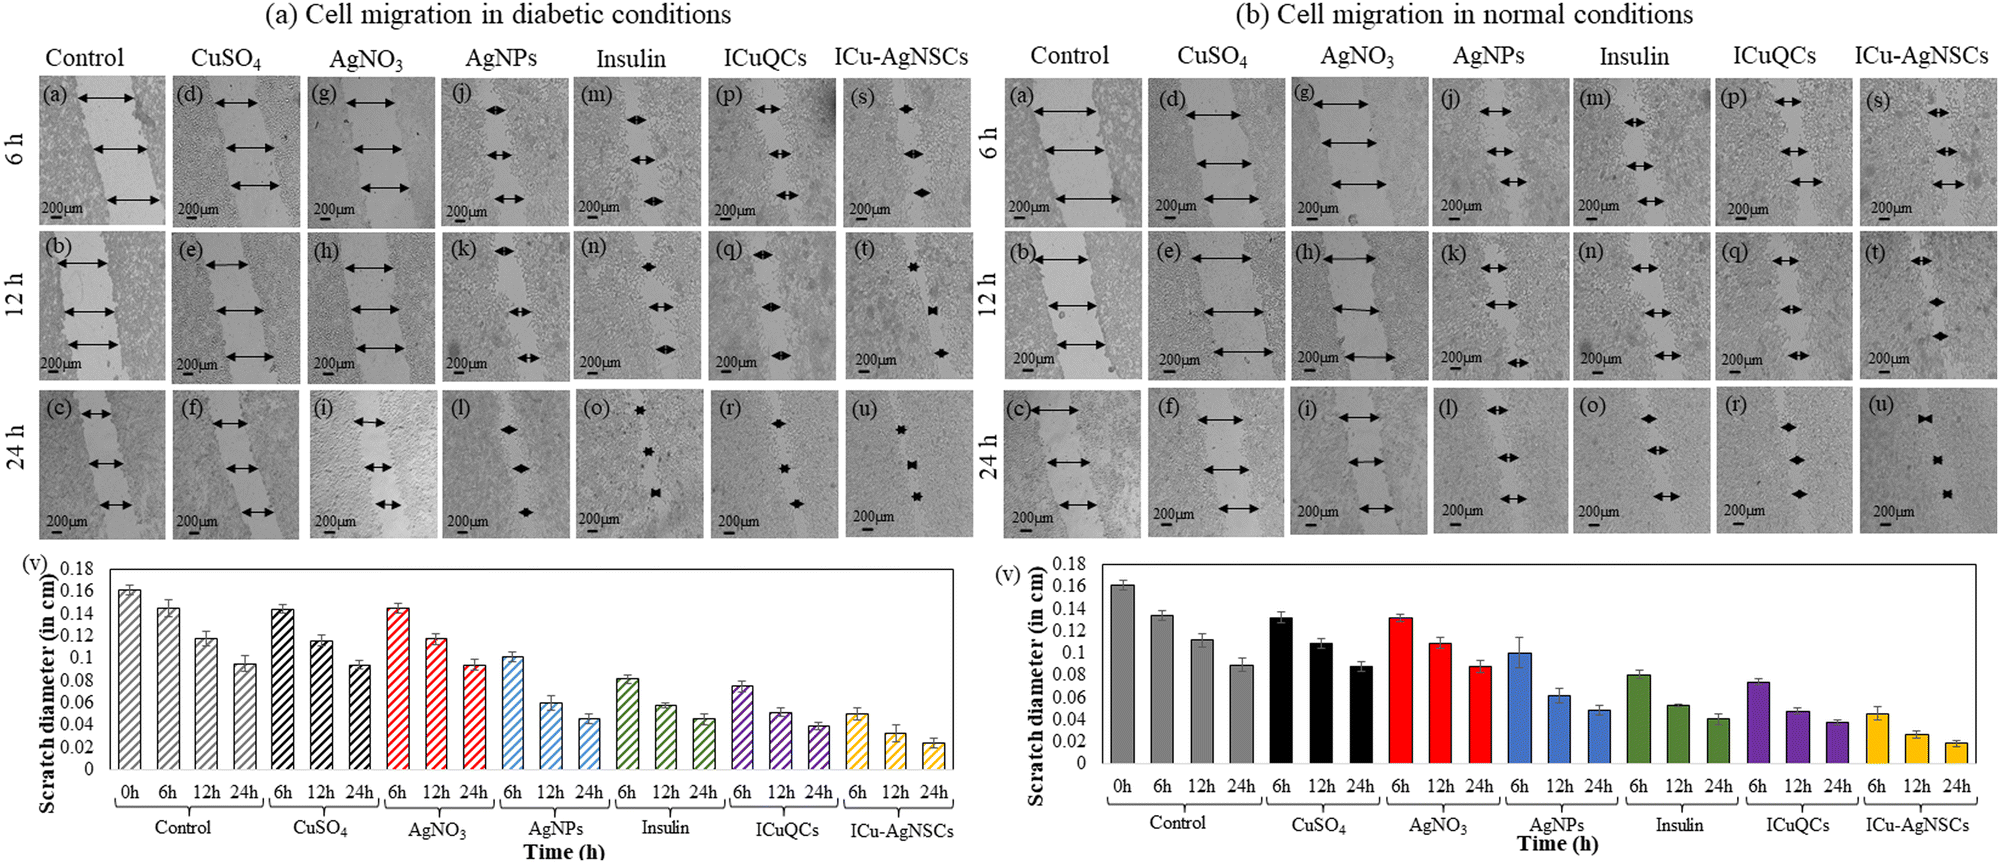 | ||
| Fig. 4 Promotion and monitoring of in vitro cell migration in the diabetic and normal cells using ICu–AgNSCs. The bimetallic nano-subclusters induced better cell migration in HEKa cells compared to salt solutions, insulin, AgNPS, and ICuQCs. The cells were incubated with a fixed concentration of all the solutions, that is, 40 μM. HEKa cells were taken as control (without any added formulations). (a) The figure shows cell migration in diabetic conditions using HEKa cells without any treatment: (a) 6 h, (b) 12 h, and (c) 24 h; the cells treated with the salt solution of copper sulfate after (d) 6 h, (e) 12 h and (f) 24 h; the HEKa cells after treatment with silver nitrate: (g) 6 h, (h) 12 h and (i) 24 h; the cells after treating them with silver nanoparticles: (j) 6 h, (k) 12 h and (l) 24 h; cells after treatment with insulin after a duration of (m) 6 h, (n) 12 h and (o) 24 h respectively; cells treated with ICuQCs after (p) 6 h, (q) 12 h and (r) 24 h and cells after treatment with ICu–AgNSCs after (s) 6 h, (t) 12 h and (u) 24 h. (v) The plot shows the relative change in cell migration in diabetic conditions after treatment with all the solutions respectively after specific time intervals. (b) The figure shows cell migration in normal conditions using HEKa cells without any treatment: (a) 6 h, (b) 12 h, and (c) 24 h; the cells treated with the salt solution of copper sulfate after (d) 6 h, (e) 12 h and (f) 24 h; the HEKa cells after treatment with silver nitrate: (g) 6 h, (h) 12 h and (i) 24 h; the cells after treating them with silver nitrate are shown in figures after (j) 6 h, (k) 12 h and (l) 24 h; cells after treatment with insulin after a duration of (m) 6 h, (n) 12 h and (o) 24 h respectively; cells treated with ICuQCs after (p) 6 h, (q) 12 h and (r) 24 h and cells after treatment with ICu–AgNSCs after (s) 6 h, (t) 12 h and (u) 24 h. (v) The plot shows the relative change in cell migration in normal conditions after treatment with all the solutions respectively after specific time intervals. | ||
The exact concentration and time intervals were followed to monitor the scratch diameter variation under normal conditions. The percentage variation in the scratch diameter in control cells is shown in Fig. 4(b)(a–c). The % changes in the scratch diameter after treatment with CuSO4 are 1.54 ± 0.46%, 2.59 ± 0.46%, and 1.38 ± 0.44% (Fig. 4(b)(d–f)) and after treatment with AgNO3 are 1.85 ± 0.32%, 2.22 ± 0.49%, and 1.85 ± 0.55% respectively (Fig. 4(b)(g–i)). For the cells treated with AgNPs, insulin, and ICuQCs, the % variations in migration with time is more as compared to those treated with the salt solutions alone and are equal to 29.91 ± 0.44%, 49.47 ± 0.64%, and 51.73 ± 0.42% for AgNPs (Fig. 4(b)(j–l)), 43.87 ± 0.35%, 52.59 ± 0.14% and 54.62 ± 0.50% for insulin alone (Fig. 4(b)(m–o)) and 48.43 ± 0.37%, 57.40 ± 0.25% and 58.33 ± 0.21% for ICuQCs (Fig. 4(b)(p–r)). The bimetallic nanosubclusters exhibit the maximum % changes in the scratch diameter, which are 66.04 ± 0.61%, 76.66 ± 0.31%, and 79.62 ± 0.31%, respectively, indicating the enormous potential of prepared nanosubclusters for enhanced cell migration in normal conditions (Fig. 4(b)(s–u)). The graph in Fig. 4(b)(v) shows the variation in the normal scratch diameter as a comparative study of all the formulations after particular time intervals. A comparative data table of change in cell migration in normal and diabetic cells is shown in Table S2 (ESI). To find the statistical significance of data, p values were calculated for scratch assay in diabetic and normal conditions, and the comparative data are shown in Table S3 (ESI).
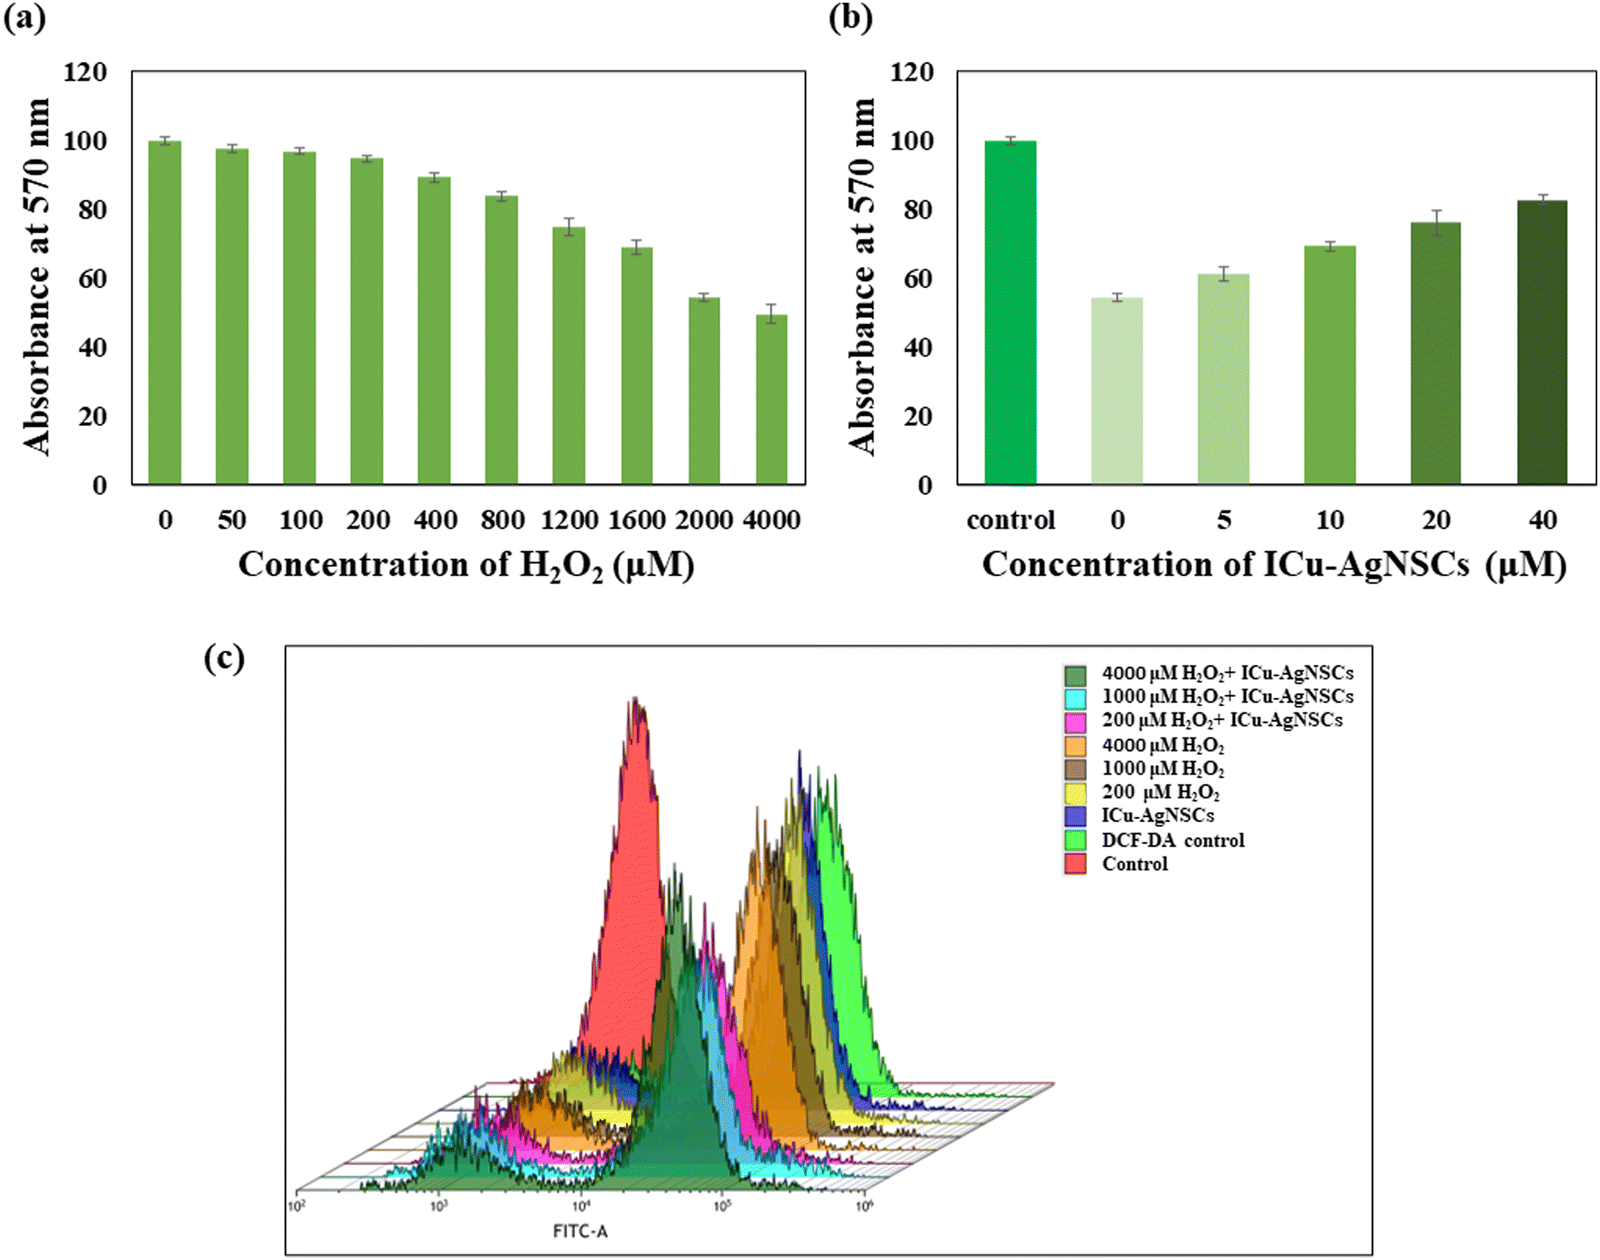 | ||
| Fig. 5 Reactive oxygen species scavenging potential of ICu–AgNSCs. (a) Effect of varying concentrations of H2O2 mediated ROS on the cell viability of HEKa cells. (b) ROS scavenging effect of varying concentrations of ICu–AgNSCs against H2O2 mediated ROS. Fluorescence microscopy to monitor the intracellular ROS scavenging by ICu–AgNSCs in HEKa cells. (c) Flow cytometry analysis of ROS scavenging in the presence of varying concentrations of bimetallic nanosubclusters. | ||
3.5 Antibacterial effect on Gram-positive and Gram-negative strains
The antibacterial activity was investigated using the broth dilution method, and the MIC and IC50 values against each bacterium were determined. The MIC value for both Gram-negative bacteria, Escherichia coli, and Acinetobacter calcoaceticus, is found out to be 16 μM and is shown in Fig. 6a and b, and for Gram-positive bacteria, including Bacillus subtilis and Staphylococcus aureus, the MIC value is 64 μM, which is shown in Fig. 6c and d. The possible reason behind this is due to the easy influx of small nanoparticles into the cell wall of Gram-negative bacteria, which consists of a unique outer membrane and a single peptidoglycan layer as compared with the Gram-positive bacteria having multiple peptidoglycan layers, which makes the entry of nanoparticles difficult into the bacterial membrane. The IC50 values for E. coli, A. calcoaceticus, B. subtilis, and S. aureus are 5.11 ± 1.52 μM, 4.85 ± 0.43 μM, 5.153 ± 1.25 μM, and 4.91 ± 1.75 μM, respectively, indicating the influential role of nanosubclusters in the antibacterial activity as shown in Fig. 6e and f.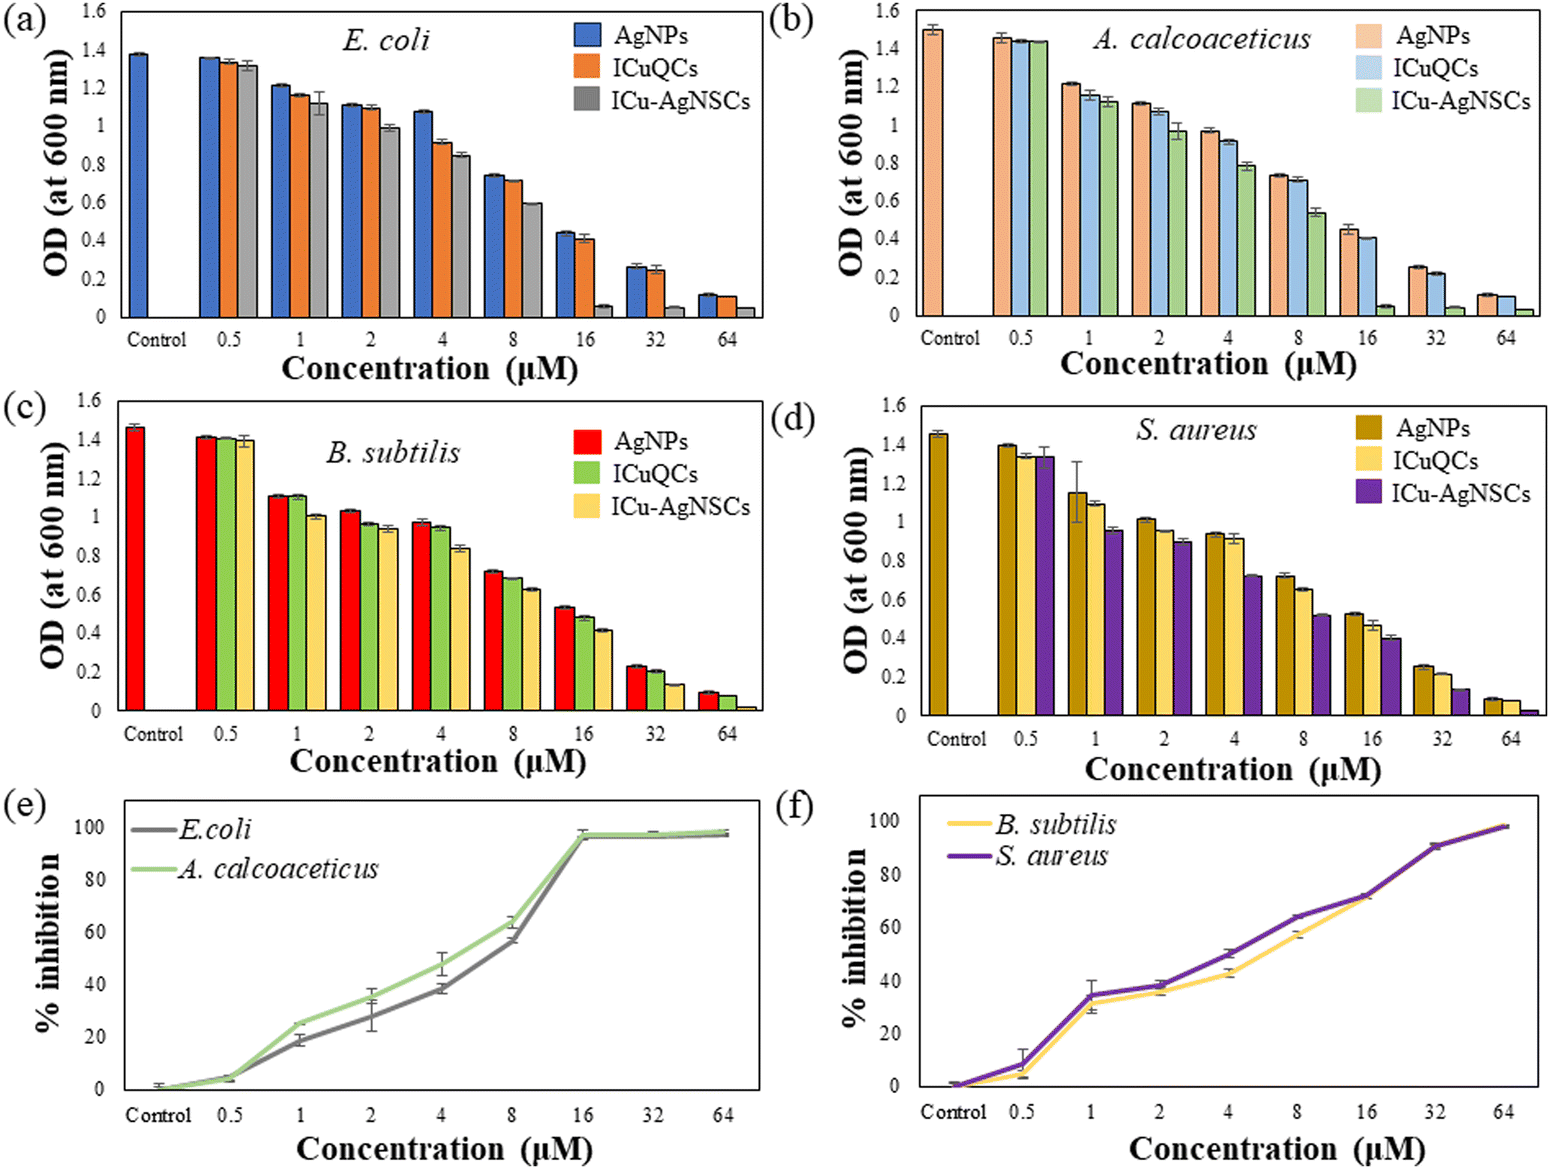 | ||
| Fig. 6 Monitoring the antibacterial activity against Gram-negative and Gram-positive bacteria using AgNPs, ICuQCs, and ICu–AgNSCs. (a) Antibacterial activity against E. coli. (b) Antibacterial activity against A. calcoaceticus. (c) Antibacterial activity against B. subtilis. (d) Antibacterial activity against S. aureus. (e) % bacterial inhibition against Gram-negative E. coli and A. calcoaceticus using ICu–AgNSCs. (f) % bacterial inhibition against Gram-positive B. subtilis and S. aureus using ICu–AgNSCs. | ||
3.6 Combination index of silver nanoparticles and insulin copper quantum clusters
To calculate the CI, Dm was calculated using m and y from Fig. S2a (ESI) for AgNPs and Fig. S2b (ESI) for ICuQCs. The calculated CI values for AgNPs and ICuQCs indicate a synergistic effect between the two, as the calculated values by varying the concentrations of these two formulations are found out to be less than one, indicating that the two formulations enhance each other's activity when combined. These results are in accordance with the ones obtained from MTT assay for cell viability and scratch assay for cell migration studies, indicating their potential role in wound healing applications. The data are shown in Table S4 (ESI†).4. Conclusion
Maintaining an efficient microenvironment across the wound site is critical to avoid microbial contamination and eliminate all possible complications that can hinder wound recovery, thus lowering healthcare costs and increasing life quality. Effective wound healing agents that are biocompatible and target-specific and have a high drug delivery rate are always required. We synthesized the bimetallic nano-subclusters by combining the silver nanoparticles and insulin copper quantum clusters to study their potential role in accelerating cell migration in normal and diabetic conditions, antioxidant role, and antimicrobial activity. Insulin is widely known for its role in promoting cellular growth by decreasing the blood glucose level, exhibiting the antioxidant effect and modulating the inflammatory responses by replacing the proinflammatory cytokines with the anti-inflammatory cytokines. Silver and copper have been explored for decades for their antimicrobial potential, which is essential for faster and contamination-free wound healing. Insulin and quercetin possess anti-inflammatory and antioxidant activities. Depending upon these features, the formulations were synthesized and checked for synergistic effects in normal and diabetic conditions.The synthesized nanosubclusters are the first of their kind, having two distinct metal ions embedded in the protein corona, and exhibited a desirable HRTEM size of about 9.6 ± 2.2 nm and demonstrated notable encapsulation efficiency and drug release profile. By efficiently conjugating the insulin copper quantum clusters and silver nanoparticles, the targeted delivery was obtained due to the enormous presence of insulin receptors across the human cells, which gives them an upper hand over general formulations. The FTIR and Raman spectra show the intermolecular interaction between metal ions and insulin and exhibit moderate structural changes in the amide regions of the protein. Also, the stability of the protein secondary structure was maintained throughout the synthesis, which was confirmed by CD spectroscopy. The MTT assay and the combination index analysis performed on the silver nanoparticles and insulin copper quantum clusters emphasized the significant synergistic effect between the two, eventually resulting in better cell migration abilities with antioxidant and antibacterial activities of synthesized subclusters. Furthermore, the synthesized bimetallic nanosubclusters exhibited accelerated cell migration properties in normal and diabetic conditions, even at very low concentrations. Apart from this, the subclusters possess antioxidant and antibacterial properties, which are essential for promoting microbial infection-free wound recovery.
Thus, the remarkable cell migration potential, antibacterial activity, and antioxidant properties of these novel bimetallic nanosubclusters make them highly potential candidates for their further use in biomedical applications and exploration of in vivo applications. It is our hope that the outcomes of this paper will promote further research on the development of bimetallic nanosubclusters, which have enormous potential for normal and diabetic wound healing and can be further explored for in vivo, pre-clinical, and clinical studies.
Conflicts of interest
The authors declare no conflicts of interest.Acknowledgements
DC is willing to thank CEEMS and the Indian Council of Medical Research (ICMR) Govt of India for funding (project no. 17X(3)/Adhoc/63/2022-ITR, 17X(3)/Adhoc/3/2022-ITR). DS is willing to thank ICMR (project no. 17X(3)/Adhoc/3/2022-ITR) for the fellowship.References
- C. K. Sen, Adv. Wound Care, 2019, 8, 39–48 CrossRef PubMed.
- I. Pastar, O. Stojadinovic, N. C. Yin, H. Ramirez, A. G. Nusbaum, A. Sawaya, S. B. Patel, L. Khalid, R. R. Isseroff and M. Tomic-Canic, Adv. Wound Care, 2014, 3, 445–464 CrossRef PubMed.
- J. E. Janis and B. Harrison, Plast. Reconstr. Surg., 2016, 138, 9S–17S CrossRef CAS PubMed.
- P. H. Wang, B. S. Huang, H. C. Horng, C. C. Yeh and Y. J. Chen, J. Chin. Med. Assoc., 2018, 81, 94–101 CrossRef PubMed.
- Y. Yang, J. Wang, S. Huang, M. Li, J. Chen, D. Pei, Z. Tang and B. Guo, Natl. Sci. Rev., 2024, nwae044 CrossRef PubMed.
- T. N. Demidova-Rice, M. R. Hamblin and I. M. Herman, Adv. Skin Wound Care, 2012, 25, 304–314 CrossRef PubMed.
- A. Sood, M. S. Granick and N. L. Tomaselli, Wound, 2014, 3, 511–529 Search PubMed.
- R. G. Frykberg and J. Banks, Adv. Wound Care, 2015, 4, 560 CrossRef PubMed.
- J. Dworzański, M. Strycharz-Dudziak, E. Kliszczewska, M. Kiełczykowska, A. Dworzańska, B. Drop and M. Polz-Dacewicz, PLoS One, 2020, 15, e0230374 CrossRef PubMed.
- A. Lima, T. Illing, S. Schliemann and P. Elsner, Am. J. Clin. Dermatol., 2017, 18, 541–553 CrossRef PubMed.
- J. H. Kim, N. Y. Yoon, D. H. Kim, M. Jung, M. Jun, H. Y. Park, C. H. Chung, K. Lee, S. Kim, C. S. Park, K. H. Liu and E. H. Choi, Exp. Dermatol., 2018, 27, 815–823 CrossRef CAS PubMed.
- H. Wu, F. Li, W. Shao, J. Gao and D. Ling, ACS Cent. Sci., 2019, 5, 477–485 CrossRef CAS PubMed.
- Y.-K. Wu, N.-C. Cheng and C.-M. Cheng, Trends Biotechnol., 2019, 37, 505–517 CrossRef CAS PubMed.
- Y. Yang, M. Li, G. Pan, J. Chen and B. Guo, Adv. Funct. Mater., 2023, 33, 2214089 CrossRef CAS.
- K. Attri, D. Sharda, B. N. Chudasama, R. Mahajan and D. Choudhury, RSC Sustainability, 2023, 1, 1109–1124 RSC.
- N. Naderi, D. Karponis, A. Mosahebi and A. M. Seifalian, Front. Biosci., 2018, 23, 1038–1059 CrossRef CAS PubMed.
- S. K. Nethi, S. Das, C. R. Patra and S. Mukherjee, Biomater. Sci., 2019, 7, 2652–2674 RSC.
- W. Qin, Y. Wu, J. Liu, X. Yuan and J. Gao, Int. J. Nanomed., 2022, 6007–6029 CrossRef PubMed.
- D. Sharda, K. Attri and D. Choudhury, Antimicrob. Dressings, 2023, 229–246 Search PubMed.
- D. Sharda and D. Choudhury, RSC Adv., 2023, 13, 20321–20335 RSC.
- D. Sharda, P. Kaur and D. Choudhury, Discovery Nano, 2023, 18, 127 CrossRef CAS PubMed.
- A. Behera, B. Mittu, S. Padhi, N. Patra and J. Singh, Multifunctional hybrid nanomaterials for sustainable agri-food and ecosystems, Elsevier, 2020, pp. 639–682 Search PubMed.
- C. Singh, A. K. Mehata, V. Priya, A. K. Malik, A. Setia, M. N. L. Suseela, Vikas, P. Gokul, Samridhi and S. K. Singh, Molecules, 2022, 27, 7059 CrossRef CAS PubMed.
- A. Sathiyaseelan, K. Saravanakumar and M.-H. Wang, Int. J. Biol. Macromol., 2022, 220, 1556–1569 CrossRef CAS PubMed.
- A. Zaleska-Medynska, M. Marchelek, M. Diak and E. Grabowska, Adv. Colloid Interface Sci., 2016, 229, 80–107 CrossRef CAS PubMed.
- H. Fan, Z. Tong, Z. Ren, K. Mishra, S. Morita, E. Edouarzin, L. Gorla, B. Averkiev, V. W. Day and D. H. Hua, J. Org. Chem., 2022, 87, 6742–6759 CrossRef CAS PubMed.
- X. Yuan, X. Dou, K. Zheng and J. Xie, Part. Part. Syst. Charact., 2015, 32, 613–629 CrossRef.
- A. Sannigrahi, S. Chowdhury, I. Nandi, D. Sanyal, S. Chall and K. Chattopadhyay, Nanoscale Adv., 2019, 1, 3660–3669 RSC.
- F. Paladini and M. Pollini, Materials, 2019, 12, 2540 CrossRef CAS PubMed.
- S. H. Lee and B.-H. Jun, Int. J. Mol. Sci., 2019, 20, 865 CrossRef CAS PubMed.
- G. Sandri, D. Miele, A. Faccendini, M. C. Bonferoni, S. Rossi, P. Grisoli, A. Taglietti, M. Ruggeri, G. Bruni and B. Vigani, Polymers, 2019, 11, 1207 CrossRef CAS PubMed.
- S. Alizadeh, B. Seyedalipour, S. Shafieyan, A. Kheime, P. Mohammadi and N. Aghdami, Biochem. Biophys. Res. Commun., 2019, 517, 684–690 CrossRef CAS PubMed.
- J. Salvo and C. Sandoval, Burns Trauma, 2022, 10, tkab047 CrossRef PubMed.
- A. P. Kornblatt, V. G. Nicoletti and A. Travaglia, J. Inorg. Biochem., 2016, 161, 1–8 CrossRef CAS PubMed.
- A. Das, V. Sudhahar, G.-F. Chen, H. W. Kim, S.-W. Youn, L. Finney, S. Vogt, J. Yang, J. Kweon and B. Surenkhuu, Sci. Rep., 2016, 6, 33783 CrossRef CAS PubMed.
- Y. Mi, L. Zhong, S. Lu, P. Hu, Y. Pan, X. Ma, B. Yan, Z. Wei and G. Yang, J. Ethnopharmacol., 2022, 290, 115066 CrossRef CAS PubMed.
- G. Yin, Z. Wang, Z. Wang and X. Wang, Exp. Dermatol., 2018, 27, 779–786 CrossRef CAS PubMed.
- P. Kaur and D. Choudhury, J. Drug Target., 2021, 29, 541–550 CrossRef CAS PubMed.
- D. Sharda, K. Attri, P. Kaur and D. Choudhury, RSC Adv., 2021, 11, 24656–24668 RSC.
- P. Kaur, A. K. Sharma, D. Nag, A. Das, S. Datta, A. Ganguli, V. Goel, S. Rajput, G. Chakrabarti, B. Basu and D. Choudhury, Nanomedicine, 2019, 15, 47–57 CrossRef CAS PubMed.
- M. Hrynyk and R. J. Neufeld, Burns, 2014, 40, 1433–1446 CrossRef PubMed.
- D. Sharda, S. Ghosh, P. Kaur, B. Basu and D. Choudhury, Discovery Nano, 2023, 18, 154 CrossRef CAS PubMed.
- P.-F. Chen, C.-L. Liu, W.-K. Lin, K.-C. Chen, P.-T. Chou and S.-W. Chu, Biomed. Opt. Express, 2015, 6, 3066 CrossRef CAS PubMed.
- F. Tasca and R. Antiochia, Nanomaterials, 2020, 10, 909 CrossRef CAS PubMed.
- T. Odatsu, S. Kuroshima, A. Shinohara, A. Valanezhad and T. Sawase, Int. J. Biol. Macromol., 2021, 190, 368–374 CrossRef CAS PubMed.
- A. K. Keshari, R. Srivastava, P. Singh, V. B. Yadav and G. Nath, J. Ayurveda Integr. Med., 2020, 11, 37–44 CrossRef PubMed.
- O. M. Ali, A. A. Bekhit, S. N. Khattab, M. W. Helmy, Y. S. Abdel-Ghany, M. Teleb and A. O. Elzoghby, Colloids Surf., B, 2020, 188, 110824 CrossRef CAS PubMed.
- S. Moniri, M. Ghoranneviss, M. R. Hantehzadeh and M. A. Asadabad, Bull. Mater. Sci., 2017, 40, 37–43 CrossRef CAS.
- G. I. N. Waterhouse, G. A. Bowmaker and J. B. Metson, Phys. Chem. Chem. Phys., 2001, 3, 3838–3845 RSC.
- M. Trivedi, A. Branton, D. Trivedi, G. Nayak, K. Bairwa and S. Jana, Chromatography Separation Techniques, 2015, 6, 1000282 Search PubMed.
- M. H. Habibi and Z. Rezvani, Spectrochim. Acta, Part A, 2014, 130, 309–312 CrossRef CAS PubMed.
- A. J. Kora and J. Arunachalam, J. Nanomater., 2012, 2012, 1–8 CrossRef.
- D. Li, Z. Zhang, X. Wang, Y. Wang, X. Gao and Y. Li, Biosens. Bioelectron., 2022, 200, 113907 CrossRef CAS PubMed.
- A. Bankapur, R. S. Krishnamurthy, E. Zachariah, C. Santhosh, B. Chougule, B. Praveen, M. Valiathan and D. Mathur, PLoS One, 2012, 7, e35075 CrossRef CAS PubMed.
- S. Luber, J. Phys. Chem. A, 2013, 117, 2760–2770 CrossRef CAS PubMed.
- M. Beg, A. Maji, A. K. Mandal, S. Das, M. N. Aktara, P. K. Jha and M. Hossain, J. Mol. Recognito., 2017, 30, e2565 CrossRef PubMed.
- M. Correia, M. T. Neves-Petersen, P. B. Jeppesen, S. Gregersen and S. B. Petersen, PLoS One, 2012, 7, e50733 CrossRef CAS PubMed.
Footnote |
| † Electronic supplementary information (ESI) available. See DOI: https://doi.org/10.1039/d4ma00278d |
| This journal is © The Royal Society of Chemistry 2024 |