
 Open Access Article
 This Open Access Article is licensed under a
 Creative Commons Attribution 3.0 Unported Licence
Versatile synthesis of sub-10 nm sized metal-doped MxCo3−xO4 nanoparticles and their electrocatalytic OER activity†
Carsten
Placke-Yan
 a,
Georg
Bendt
a,
Soma
Salamon
b,
Joachim
Landers
b,
Heiko
Wende
b,
Ulrich
Hagemann
c and
Stephan
Schulz
*ac
a,
Georg
Bendt
a,
Soma
Salamon
b,
Joachim
Landers
b,
Heiko
Wende
b,
Ulrich
Hagemann
c and
Stephan
Schulz
*ac
aInstitute for Inorganic Chemistry, Universitätsstraße 5-7, Essen D-45141, Germany. E-mail: Stephan.schulz@uni-due.de
bFaculty of Physics and Center for Nanointegration Duisburg-Essen (CENIDE), University of Duisburg-Essen, Lotharstr. 1, Duisburg D-47057, Germany
cCenter for Nanointegration Duisburg-Essen (CENIDE), University of Duisburg-Essen, Carl-Benz-Straße 199, Duisburg 47057, Germany
First published on 5th March 2024
Abstract
Metal-doped spinel MxCo3−xO4 nanoparticles are promising catalysts for the electrochemical oxygen evolution reaction (OER). We here report a robust and scalable route for the synthesis of metal-doped spinel MxCo3−xO4 nanoparticles (M = Al, V, Cr, Mn, Fe, Ni; x = 0.05, 0.1, 0.2) by thermal decomposition of cobalt(II) acetylacetonate and the respective metal acetylacetonate or nitrate. The resulting spherical nanoparticles show uniform sizes between 8 and 10 nm and homogeneous dopant distribution as shown by powder X-ray diffraction (PXRD), transmission electron microscopy (TEM), energy dispersive X-ray spectroscopy (EDX), infrared spectroscopy (IR) and X-ray photoelectron spectroscopy (XPS). The Fe-doped samples were further investigated by 57Fe-Mössbauer spectroscopy. The effect of the metal doping on the electrocatalytic OER activity of the nanoparticles was examined by linear sweep voltammetry (LSV). The OER activity was found to either increase (V, Cr, Fe, Ni) or decrease (Al, Mn) with increasing dopant concentration. An influence on the cobalt redox behavior during catalyst conditioning via cyclic voltammetry (CV) was observed as a result of metal doping.
Introduction
Green hydrogen is emerging as one of the most important resources to accomplish the transformation of the chemical industry to CO2 neutrality. While it is already considered as one of the most ideal non-fossil energy vectors due to its high gravimetric energy density and lack of carbon content,1–3 green hydrogen will also play an important role as feedstock in the chemical industry in the near future.4 For instance, the European Government (EU) forces the introduction of hydrogen in new sectors such as the steel industry and both rail and maritime transport and plans to install a minimum of 40 GW electrolyzers by 2030.5,6 Currently only 4% of the hydrogen comes from water splitting, while 96% is gained from fossil ressources,6,7 which is responsible for a CO2 emission of roughly 830 Mt per year.8To increase the share of green hydrogen in the industry, improved catalysts with enhanced activities in both hydrogen evolution reaction (HER) and oxygen evolution reaction (OER) in the water splitting reaction must be developed. Due to the sluggish kinetics of the four-electron process in the OER, the overpotential here is much higher than for the HER, shifting the focus on increasing the activity in OER to get a more efficient water splitting process. RuO2 and IrO2 are still benchmark OER catalysts, but both noble metal oxides are scarce, pricey and their long-time stability is rather low as they are easily oxidized and/or dissolved in alkaline media.9,10 Therefore, alternative, highly active OER catalysts have to be developed.
The development of catalytically active non-noble metal oxides in recent years has shifted the focus in OER catalyst research.1 Among many metal oxides, spinel-type cobalt oxide Co3O4 as well as its metal doped/substituted derivatives MxCo3−xO4 are very promising OER catalysts. They often show low overpotential1,11,12 and long-term stabilities,13i.e., Co3O4 fibers were applied for 120 h at 10 mA cm−1 in 1 M KOH,11 Ni0.8Fe0.2Co2O4 nanoparticles for 52 h at 20 mA cm−1 in 1 M KOH14 and Co3O4 nanoparticles decorated on carbon cloth for 30 h at 10 mA cm−1 in 0.1 M KOH,15 respectively. In addition, the strong effect of the nanoparticle size16–19 and surface faceting17,20–23 on the OER activity of anisotropically grown Co3O4 nanoparticles has been demonstrated. For instance, the strong effect of the size of Co3O4 nanoparticles on their OER activity was proven by using LSV ensemble measurements,17 while more recent studies with sophisticated single nanoparticle measurements revealed the role of specific surface faceting on the intrinsic catalytic activity of single nanoparticles.19,24–27
Apart from size and morphology effects, the catalytic activity of Co3O4 nanoparticles can further be modified by the incorporation of additional divalent and trivalent metal atoms (metal substitution) as has been shown for several substitution series.28–30 We recently reported on the synthesis and OER activity of binary CoxFe3−xO4 (0 < x < 1.75)31 and ternary CoxNi1−xFe2O4 (0 < x < 1)32 and CoV2−xFexO4 (0 < x < 2)33 spinel-type nanoparticles, for which a distinct effect on the OER activity was observed, depending both on the distinct metal and the metal concentration. Theoretical studies suggest that atomic doping produces lattice strain, which affects the electronic structure of the material surface,34 thereby increasing the electrochemical performance of MxCo3−xO4 nanoparticles in OER catalysis. In addition, metal doping leads to an optimization of the binding energy of intermediates adsorption during the OER, especially of *O, *OH and *OOH, respectively.35–40
Unfortunately, despite the large number of studies that have focused on the effect of specific catalyst compositions on their OER activity, a general understanding on how the composition of the catalysts influences their activity, is still missing. This stems most likely from the fact that the change of the nanoparticles’ composition is often accompanied by a change of the particle size, crystallinity and phase purity.31 Therefore, there is a strong demand for the development of a robust synthetic procedure that allows for the general and scalable synthesis of metal-doped nanoparticles without changing their size and/or morphology. A second problem of studying the effect of metal doping is the limited comparability of results obtained by different working groups. Many efforts were made to summarize and compare the influence of metal doping on the OER activity of metal oxides,28,41,42 however, different synthetic approaches, different particles sizes and differences in the electrochemical characterization procedure (e.g. substrate, catalyst loading, electrolyte concentration) largely influence the catalytic activity results, which makes it almost impossible to identify clear trends with respect to the influence of the specific dopant on the OER activity.
We herein report a general synthetic procedure that addresses these scientific challenges and offers a robust and scalable route for the synthesis of sub-10 nm sized spherical MxCo3−xO4 nanoparticles doped by a wide variety of divalent (M = Mn, Ni) and trivalent redox-active (M = V, Cr, Fe) as well as redox-inactive metals (M = Al). The degree of doping level is flexibly varied up to x = 0.2 and, most importantly, the dopant is homogeneously incorporated into the spinel lattice. Moreover, the structural effect of metal doping on the spinel crystal structure is only minimal since both the size and morphology of the doped nanoparticles are highly comparable. Thus, any change in the catalytic activity can be directly attributed to the presence of dopant in the particles, while the influence of size, morphology or synthetic procedure can be neglected.
Results and discussion
Synthetic procedures
Metal-doped cobalt spinel nanoparticles S:M005c, S:M01c and S:M02c were synthesized with three doping levels (M0.05Co2.95O4, M0.1Co2.9O4 and M0.2Co2.8O4 (M = Al, V, Cr, Mn, Fe, Ni) as shown in Scheme 1b by modifying the previously reported synthesis of spherical Co3O4 nanoparticles.17 Moreover, pure pristine-type Co3O4 nanoparticles (S:0c) without any additional metal dopants were synthesized as reference material. Thermal decomposition of cobalt(II) acetylacetonate and stoichiometric amounts of the respective metal acetylacetonate or nitrate in oleyl amine (OLAM, Scheme 1a) yielded the corresponding rock-salt MxCo1−xO nanoparticles (S:0, S:M005, S:M01, S:M02) according to PXRD studies, as is exemplarily shown for the samples S:0, S:Al005, S:Al01 and S:Al02 (Fig. S1, ESI†). Calcination of the nanoparticles at 300 °C gave the desired metal-doped MxCo3−xO4 spinel nanoparticles. | ||
| Scheme 1 (a) Synthesis of metal-doped spinel nanoparticles by thermal decomposition of Co(acac)2 and the respective metal salt and subsequent calcination of the as prepared rock-salt metal-doped nanoparticles. (b) Naming scheme of the metal-doped nanoparticles before and after calcination (M = Al, V, Cr, Mn, Fe, Ni). | ||
Material characterization
The phase transformation of the rock-salt precursor nanoparticles to spinel nanoparticles was confirmed by XPS (Fig. S3 (ESI†), exemplarily shown for S:0 and S:0c) and FT-IR spectroscopy (Fig. S4 and S5 (ESI†), exemplarily shown for S:0c, S:Al005c, S:Al01c and S:Al02c and their precursors S:0, S:Al005, S:Al01 and S:Al02). The XPS survey scans (Fig. S3, ESI†) show a very low carbon contamination, while the insets containing the Co 2p high resolution scans clearly show the transition from CoO to the spinel Co3O4 upon calcination.17 The FT-IR spectra of the precursor nanoparticles show comparable absorption bands due to residual surface contaminations, i.e., oleylamine, acetylacetonate and their respective decomposition products (Fig. S4, ESI†), which almost disappeared after calcination at 300 °C in air. All calcinated samples show two characteristic absorption bands at about 660 cm−1 and 565 cm−1, which can be assigned to the Co2+–O stretching vibration mode of the tetrahedral site and the O–Co3+–O vibration at the octahedral site of Co3O4, respectively.43 All absorption bands with wavenumbers larger than 700 cm−1, which could be assigned to organic residues on the particle surface, are no longer present after calcination (Fig. S5, ESI†), indicating a thermal decomposition of organic residues during calcination.Transmission electron microscopy (TEM) measurements of the resulting nanoparticles (Fig. 1a–c for S:0c, S:Al01c and S:V01c, Fig. S6–S12 (ESI†) for all other metal-doped nanoparticles) show the spherical shape and confirmed their sub-10 nm size. Statistical evaluation of the particle size shows a narrow size distribution (Fig. 1d–f and Fig. S6–S12, ESI†). The average particle size and its standard deviation of all synthesized samples are shown in Fig. 1g, proving that the applied method allows for the synthesis of MxCo3−xO4 nanoparticles with uniformly distributed metal dopants (x = 0.05, 0.1, 0.2). The resulting metal-doped nanoparticles are structurally highly comparable with respect to their phase purity, size and morphology.
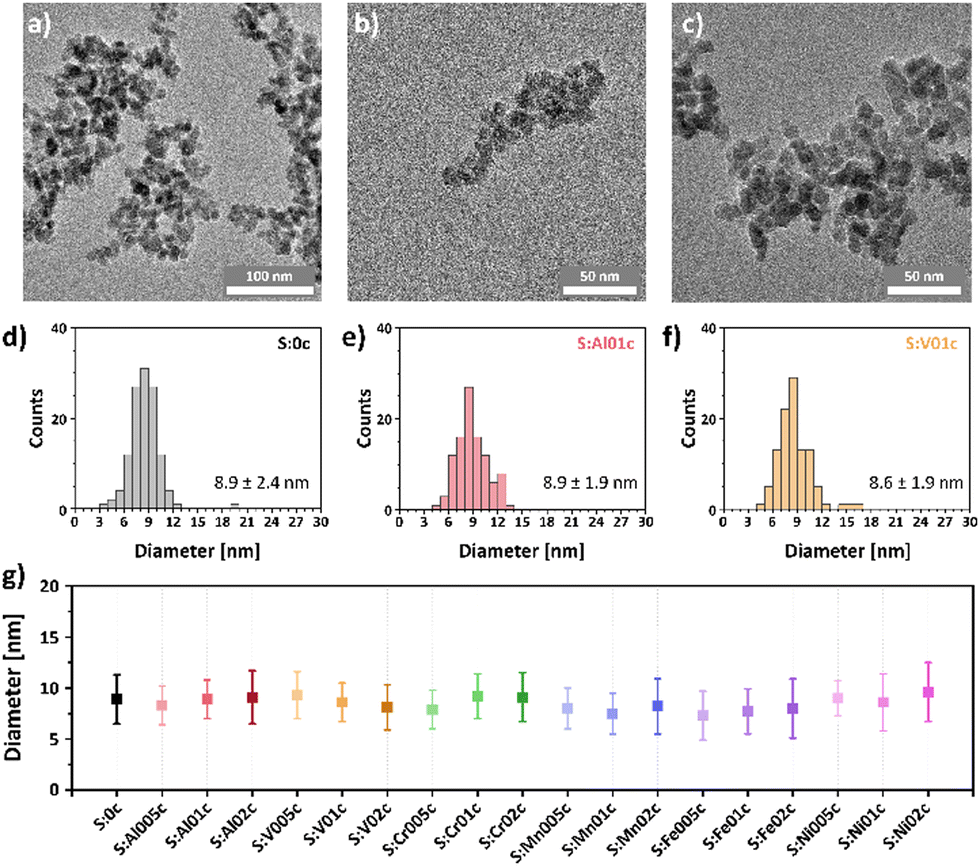 | ||
| Fig. 1 TEM images of (a) pristine Co3O4 (S:0c), (b) Al0.1Co2.9O4 (S:Al01c) and (c) V0.1Co2.9O4 (S:V01c) nanoparticles and nanoparticle sizes and size distributions of (d) S:0c, (e) S:Al01c and (f) S:V01c. (g) Comparison of the experimentally determined sizes with their standard deviations. Additional TEM images and size distributions are given in the ESI† (Fig. S6–S12). | ||
The composition of the samples was confirmed by energy-dispersive X-ray spectroscopy (EDX). SEM-EDX bulk measurements (Table S3, ESI†) proved that the resulting dopant concentrations are in good agreement with the theoretical values. To confirm the homogeneous dopant distribution in the nanoparticles, TEM-EDX mappings were recorded for single nanoparticles with the highest dopant content (S:M02c). The results show that the metal dopant is equally distributed within the single nanoparticles, proving a homogeneous incorporation into the spinel lattice (Fig. 2 for S:Al02c (a) and S:V02c (b); Fig. S13–S18 (ESI†) for all S:M02c samples). We assume that the dopants are also homogeneously distributed within the samples with lower dopant content (S:M005c, S:M01c).
 | ||
| Fig. 2 TEM-EDX mapping of (a) S:Al02c and (b) S:V02c. TEM-EDX mappings of other samples S:M02c are given in the ESI† (Fig. S13–S18). | ||
In addition, Mössbauer spectra were recorded on the Fe-containing samples (S:Fe02c, S:Fe01c and S:Fe005c) in order to precisely discern the Fe-valence states. The results revealed a high-spin Fe3+ state, with no relevant contribution from Fe2+ or any other Fe-containing phases (Fig. S19, ESI†).
To confirm the crystalline structure of the nanoparticles, powder X-ray diffraction (PXRD) studies were conducted. The diffractograms for the S:M02c nanoparticles and the reference S:0c spinel-type nanoparticles (PDF 01-076-1802) are shown in Fig. 3, while the diffractograms of all other samples are given in the ESI† (Fig. S2). All metal-doped MxCo3−xO4 nanoparticles show the typical diffraction peaks typical of the face-centered Co3O4 spinel-type structure. The comparable peak broadening indicates similar crystallite sizes in the sub-10 nm range. No characteristic diffraction peaks for any crystalline secondary phases were observed. The incorporation of transition metal atoms into the Co-spinel-type structure typically changes the lattice parameters, leading to an angle-dependent shift of the diffraction peaks in the powder diffractograms. However, no obvious shift was observed in these samples, most likely due to the low doping concentration, showing that the doping does not significantly influence the overall crystal structure of the nanoparticles. As a result, the influence of the crystal structure on the catalytic activity of the metal-doped MxCo3−xO4 nanoparticles can be neglected.
 | ||
| Fig. 3 PXRD patterns of pristine Co3O4 nanoparticles (S:0c) and metal-doped MxCo3−xO4 nanoparticles (S:M02c). Reference for Co3O4, PDF 01-076-1802. PXRD patterns of all samples are given in the ESI† (Fig. S2). | ||
Evaluation of the OER activity
OER measurements were conducted using a glassy carbon rotating disc electrode (RDE) as the working electrode in a standard three electrode setup with a Pt-sheet counter electrode and an Ag/AgCl reference electrode in 1 M KOH at room temperature. The RDE was prepared by dropcasting as-prepared Nafion® embedded nanoparticle ink with a catalyst loading of 100 μg cm−2 based on the geometrical surface area of 0.196 cm2. Current densities were calculated on the same surface area. The electrodes were initially conditioned by running cyclic voltammetry (CV) scans with a scan rate of 100 mV s−1 in a range between 1 and 2 V vs. RHE until the CV showed no more change and gave reproducible CVs. Subsequently, the OER activity was determined by conducting a linear sweep voltammetry (LSV) measurement (5 mV s−1; 1 to 2 V vs. RHE). The benchmark parameter to evaluate the catalytic OER activity is the overpotential η10 that is required to deliver a geometrical current density of 10 mA cm−2.41 LSV curves, Tafel plots and electrochemical impedance spectroscopy (EIS) of pristine Co3O4 as well as the Al- and V-doped sample series are depicted in Fig. 4a–c. A summary of the overpotential η10 and the Tafel slope of all samples are shown in Fig. 4d and e, respectively, while LSV curves, Tafel plots and EIS data of all samples are presented in Fig. S20 (ESI†). | ||
| Fig. 4 Electrochemical characterization of pristine-type Co3O4 and the Al- and V-doped sample series S:Al005c–S:Al02c and S:V005c–S:V02c. (a) Linear Sweep Voltammogram in 1 M KOH electrolyte with a scan rate of 5 mV s−1, (b) Tafel plots, and (c) electrochemical impedance spectroscopy (EIS) Nyquist plots at an overpotential of η = 550 mV. Comparison of overpotentials η10 (d) and Tafel slopes (e) for different metal-doped MxCo3−xO4 to pristine Co3O4 nanoparticles (S:0c). LSV curves, Tafel plots and EIS data of all samples are summarized in Fig. S20 (ESI†). | ||
The Co3O4 nanoparticles show an OER overpotential of 471 mV, which is in good agreement with previous findings for 11 nm sized pristine-type Co3O4 nanoparticles prepared in oleylamine.17 The metal-doped MxCo3−xO4 nanoparticles show a clear influence of even small amounts of the distinct metal dopant on their resulting OER activity (Fig. 4d). While a decrease in activity is observed for Al- and Mn-doped samples, a steadily increasing OER activity with increasing dopant concentration is observed for the V-, Cr-, Fe- and Ni-doped nanoparticles, reaching minimum overpotentials η10 = 441 mV (S:V02c), 438 mV (S:Cr02c), 445 mV (S:Fe02c), and 461 mV (S:Ni02c), respectively, for the highest studied dopant concentration.
The increase in OER activity has previously been reported for the incorporation of V,44–46 Cr,47 Fe,31,48 and Ni49–51 into the crystal lattice of Co3O4 nanoparticles. Wei et al.44 attributed the increased catalytic activity of V-substituted VxCo3−xO4 to the creation of surface defects that would lead to an increased electronic conductivity and an increase in the number of active sites. This was supported by DFT calculations, showing a lowering of the barrier of the rate determining step after V-doping.44 Although their results may be influenced by the substantial decrease of the particle size and change in crystallinity caused by V substitution of 20 at%, our findings generally agree with their results, showing that even small amounts of V-doping can lead to an increase in OER activity.
The observed increase in the OER activity of the Cr-doped series (S:Cr005c, S:Cr01c and S:Cr02c) is also in line with previous findings, which showed that the substitution of Co atoms by Cr atoms in the Co3O4 spinel-type structures leads to an increase in the OER activity, reaching an optimum for Cr0.75Co2.25O4.47 The change in activity was attributed to both a change of the reaction intermediate energetics, caused by tensile strain due to the incorporation of larger Cr atoms into the Co3O4 lattice structure and to a change in the electronic structure, since Co becomes more electrophilic due to the incorporation of electron withdrawing Cr, thus facilitating the nucleophilic addition of water.47
The findings observed for the Fe-doped samples agree with results from our previous studies31 and with results from Budiyanto et al., which demonstrated the beneficial effect of Fe-doping even for very small doping levels.48 The incorporation of Fe caused a distortion of the octahedral sites, leading to a change in electronic structure and an increased fraction of Co in tetrahedral sites,48 which was shown to be beneficial for the formation of μ-OOH moieties.52 Apparently, the optimum Fe content was found to depend on the nature of the nanoparticles, since for these particles the optimum is found for samples with a Co![[thin space (1/6-em)]](https://www.rsc.org/images/entities/char_2009.gif) :Fe ratio lower than 7:1,48 while we previously reported a maximum in activity for Fe0.75Co2.25O4 containing a Co:Fe ratio of 3:1.31 The herein reported Fe-doped nanoparticles contain Co:Fe ratios of 59:1 (S:Fe005c), 29:1 (S:Fe01c), and 14:1 (S:Fe02c), respectively, and show a steady decrease of the overpotential with increasing Fe content.
:Fe ratio lower than 7:1,48 while we previously reported a maximum in activity for Fe0.75Co2.25O4 containing a Co:Fe ratio of 3:1.31 The herein reported Fe-doped nanoparticles contain Co:Fe ratios of 59:1 (S:Fe005c), 29:1 (S:Fe01c), and 14:1 (S:Fe02c), respectively, and show a steady decrease of the overpotential with increasing Fe content.
In remarkable contrast to the findings observed for the V, Cr, Fe and Ni doped nanoparticles, the incorporation of Al and Mn leads to a steady decrease in OER activity with increasing doping level, reaching a maximum of η10 = 502 mV and 490 mV for S:Al02c and S:Mn02c, respectively. With respect to the incorporation of Mn, opposing trends have been reported in the literature. Rios et al. showed a decrease in catalytic activity with increasing Mn content,53 and Hirai et al. attributed the increase in OER activity for high y-values of Mn3−yCoyO4 (0 ≤ y ≤ 1) to a decrease of the Jahn–Teller-distortion, induced by the introduction of Jahn–Teller-active Mn3+ cations into the Co3O4 spinel structure.54 On the other hand, Lankauf et al. observed an increased OER activity for MnxCo3−xO4 with 0 < x ≤ 1, which was explained by an increased number of active sites and a reduced charge-transfer resistance.55 The Mn-doped sample series prepared in this study, which is highly comparable with respect to their size, morphology and dopant distribution characteristics, clearly showed a decrease in OER activity and an increase in charge-transfer resistance with increasing Mn-content (Fig. S20, ESI†).
In order to study the nature of the active sites of CoIICo2IIIO4 spinels, we also replaced the redox active Co3+ cations by redox inactive Al3+ cations. The steady decrease in OER activity within this sample series (S:Al005c, S:Al01c, S:Al02c) with increasing Al3+ concentration suggests a direct involvement of Co3+ in the catalytic reaction. Wang et al. reported the deactivation of Co3O4 upon substitution with redox inactive Zn2+ and Al3+ cations.56 Since Zn-substitution resulted in a stronger decrease in OER activity, they suggest a domination of Co2+ over Co3+ in OER. Recent calculations by Liu et al.57 suggest that Co3+(Oh) is the best geometrical configuration for OER, followed by Co2+(Oh) and Co2+(Td). Furthermore, the interplay between Co3+(Oh) and Co2+(Td) could promote OER activity in Co3O4,57 being a possible explanation for both our observations as well as the deactivation observed by Wang et al.56
The Tafel slopes (iR-corrected) for all nanoparticles are very similar in a range between 46 mV dec−1 and 54 mV dec−1 (Fig. 4e). Only the Al-doped nanoparticles show a slightly increased Tafel slope of around 60 mV dec−1 and S:Mn005c a slightly reduced Tafel slope of 43 mV dec−1. The Tafel slope provides information on the reaction kinetics, especially the rate-determining step of the catalytic cycle. Based on the Butler–Volmer equation, calculations show that different rate-determining steps in the multi-electron transfer reaction would lead to different distinct Tafel slopes.58 If the first electron transfer step is rate-determining step, a Tafel slope would be 120 mV dec−1. In case that a chemical reaction following the first electron transfer is the rate-determining, a Tafel slope would drop to 60 mV dec−1.58 Generally, the lower the Tafel slope, the later the rate-determining in the multi-electron transfer reaction (30 mV dec−1 for the third electron transfer). Also, a catalyst with a low Tafel slope usually indicates a desired electrocatalyst.58 Based on these fundamentals, all samples show a Tafel slope that mostly indicates a chemical reaction following the first electron transfer dominating the reaction kinetics.
The EIS Nyquist plots of the doped nanoparticles show similar semicircles. The radius of these semicircles reflects the charge transfer resistance. Samples with high OER activity show smaller semicircles and thus smaller charge-transfer resistance (Fig. 4c and Fig. S20, ESI†). While V, Cr, Fe and Ni-doping led to decreased charge-transfer resistances, the doping with Al and Mn resulted in higher resistances. These coupled trends indicate a relationship between the charge-transfer resistance of the sample and its OER activity. Only for the Mn-doped samples the charge transfer resistance does not completely follow the trend of OER activity. According to these findings, the change in activity is not necessarily dominated by the conductivity of the Mn-doped samples but could also have other origins.
Since the surface redox chemistry and surface transformations of the pre-catalyst play a significant role in the operational activity, the effect of doping on the oxidation pre-peak at about 1.5 V during the catalyst conditioning step was further investigated. A closer inspection of the consecutive conditioning cycles revealed differences of the oxidation pre-peak evolution among different catalysts (Fig. 5).
 | ||
| Fig. 5 Oxidation pre-peak charge density evolution observed during electrode conditioning via cyclic voltammetry (CV) with a scan rate of 100 mV s−1. Depiction of CV-cycles 2, 5, 10, 15 and 20 for samples S:0c (a) and S:V02c (b). Comparative analysis of changes in integrated peak charge density over the conditioning cycles for samples S:M02c (c) and S:V005c, S:V01c and S:V02c (d) in comparison to S:0c. The change in peak charge density is calculated by subtracting the peak charge density of cycle 2 from cycles 5, 10, 15, and 20. | ||
The analyzed peak is typically attributed to a Co3+/Co4+ transition59–61 or to a Co3+/Co3+δ transition, as reported the group of Roldán Cuenya, thus suggesting a change of the chemical state and electronic structure of surface-near oxygen atoms.18,62,63
A close inspection of the evolution of the oxidation feature during conditioning resulted in the identification of distinct trends. In the case of the undoped sample S:0c (Fig. 5a), no discernible change in peak position and intensity was observed. Conversely, for the V-doped Co3O4 sample, the oxidation feature intensity increases with consecutive CV cycling (Fig. 5b). To semi-quantify this effect, the oxidation peak charge density was calculated for the different doped catalysts S:M02c over cycling (Fig. 5c). For undoped S:0c, only a marginal change of the peak charge density was observed, whereas for the doped samples, a change was monitored upon doping, depending on the dopant nature. For example, the V-doping of Co3O4 induces a noticeable increase in peak charge density during conditioning. This effect scales up with increasing doping grade (Fig. 5d).
As a general trend, catalysts with an increasing OER activity with increasing dopant level (S:V02c, S:Cr02c, S:Fe02c, S:Ni02c; Fig. 5c) show a more substantial increase in peak charge density with cycling compared to undoped Co3O4. Conversely, catalysts with reduced OER activity show either a negligible change (S:Al02c) or a reduction in peak charge density during conditioning (A:Mn02c).
These observations suggest an effect of doping on the surface transformation of the pre-catalyst into the OER active surface (mostly CoO(OH)).64 Thus the promoted OER activity can be attributed to a few reasons: Dopants such as V facilitate the Co3+/4+ redox process, a synergistic effect between Co and specific dopants during OER, stabilized active Co species or other electronic effects. Further dedicated spectroscopic measurements are planned to investigate this surface transformation effect in more detail.
Experimental
Materials
Al(III) acetylacetonate [Al(acac)3; 99%], Co(II) acetylacetonate [Co(acac)2; 97%], iron(III) acetylacetonate [Fe(acac)3; 97%], Mg(II) acetylacetonate dihydrate [MgII(acac)2⋅2H2O; 98%] and Oleylamine [OLAM; ≥98%] were purchased from Sigma-Aldrich, while Cr(III) nitrate nonahydrate [Cr(NO3)3⋅9H2O; 99%] and Ni(II) acetylacetonate [Ni(acac)2; 95%] were purchased from abcr.General synthesis for MxCo3−xO4 nanoparticles
Metal-doped spinel-type MxCo3−xO4 nanoparticles were synthesized by a variation of a previously reported method.17 The respective salt mixture (see Table S2, ESI†) and 6 g of oleylamine (22.4 mmol, 3 eq.) were stirred in an open reaction vessel at 120 °C for 15 min to achieve a homogenous solution and to remove any volatile contaminations. The mixture was then heated in the closed reaction vessel to 250 °C over the course of 45 min, stirred at 250 °C for 1 h and then cooled to room temperature. The resulting rock-salt precursor nanoparticles were precipitated from the reaction mixture by the addition of EtOH. The nanoparticles were isolated by centrifugation (3000 rpm, 10 Min) and purified by redispersion in DCM and precipitation with EtOH (two times), followed by washing steps with acetone and subsequent drying at ambient temperature. The precursor particles were then heated to 300 °C with a heating rate of 4.5 °C min−1, and the temperature of 300 °C was maintained for 15 min, resulting in a quantitative conversion into the corresponding spinel-type nanoparticles.Material characterizations
The recorded potentials were converted to the reversible hydrogen electrode (RHE) using the following equation:
| ERHE = EAg/AgCl + 0.207 V + 0.826 V | (1) |
Before LSV measurements, the working electrode was conditioned by running cyclic voltammetry (CV) with a scan rate of 100 mV s−1 in a potential range between 1 and 2 V vs. RHE until the CV showed no obvious change and gave reproducible voltammograms. Subsequently, the OER activity was determined by conducting a linear sweep voltammetry (LSV) measurement (5 mV s−1; 1 to 2 V vs. RHE). To evaluate the OER activity, the overpotential η10 that is required to deliver a geometrical current density of 10 mA cm−2 was calculated.41
Peak charge densities of the oxidation pre-peak were calculated by integration of the peak in the respective CV cycle. The change in peak charge density was determined by subtracting the value observed in the second cycle (QCV-2)from that of the given cycle (QCV-x) as follows.
| ΔQ = QCV-x − QCV-2 | (2) |
Conclusions
We report a facile and robust synthetic method for metal-doped spinel-type MxCo3−xO4 nanoparticles that addresses a central scientific challenge in the synthesis of OER catalysts: the lack of catalyst comparability due to significant influences of particle size, shape, and composition on catalytic activity. The method allows the incorporation of a broad variety of divalent and trivalent metals (M = Al, V, Cr, Mn, Fe, Ni) with high flexibility on the doping grade (x = 0.05, 0.1, 0.2) as is demonstrated with the synthesis of spherical sub-10 nm sized MxCo3−xO4 nanoparticles, ensuring that any alteration in catalytic activity can be directly attributed to the presence of the dopant in the particles.Evaluation of the electrocatalytic activity showed that the OER activity can be heavily altered even for small doping amounts. Al- and Mn-doping led to a steady decrease in OER activity with increasing dopant concentration. The opposite trend was observed for the V, Cr, Fe and Ni doping series, which showed a steadily increase in OER activity with increasing doping grade. A minimum in the overpotential was observed for the Cr-doped sample (S:Cr02c) with an overpotential as low as 438 mV.
Investigation of catalyst conditioning process through multiple CV cycles shows an influence of metal doping on the Co redox behavior and thus the surface transformation under catalytic conditions, consequently impacting the activity of the catalyst.
Author contributions
C. P.-Y. performed the synthesis and characterization (PXRD, EDX, CV, TEM, IR) of the nanoparticles. Analysis of Mössbauer spectroscopy measurements was performed by S. S. and J. L. XPS measurements were conducted and evaluated by U. H. The work was supervised by H. W. and St. S. The manuscript was written by all authors.Conflicts of interest
There are no conflicts to declare.Acknowledgements
Financial support by the Deutsche Forschungsgemeinschaft (DFG; German Research Foundation, project no. 388390466 within the Collaborative Research Center/Transregio CRC/TRR 247 “Heterogeneous Oxidation Catalysis in the Liquid Phase”), the International Max Planck Research School IMPRS-RECHARGE (C. P.) and the Open Access Publication Fund of the University of Duisburg-Essen is gratefully acknowledged. We thank T. B. Nguyen and Dr. M. Heidelmann from the Interdisciplinary Center for Analytics on the Nanoscale of the University of Duisburg-Essen (DFG RI sources reference: RI 00313), a DFG-funded core facility (project no. 233512597 and no. 324659309), for TEM studies. We thank Dr. Hatem Amin for helpful discussions on the interpretation of electrochemical data.Notes and references
- H. Xu, J. Yuan, G. He and H. Chen, Coord. Chem. Rev., 2023, 475, 214869 CrossRef CAS.
- S. Gupta, R. Fernandes, R. Patel, M. Spreitzer and N. Patel, Appl. Catal., A, 2023, 661, 119254 CrossRef CAS.
- K. Ayers, N. Danilovic, R. Ouimet, M. Carmo, B. Pivovar and M. Bornstein, Annu. Rev. Chem. Biomol. Eng., 2019, 10, 219 CrossRef CAS PubMed.
- S. Griffiths, B. K. Sovacool, J. Kim, M. Bazilian and J. M. Uratani, Energy Res. Soc. Sci., 2021, 80, 102208 CrossRef.
- Fuel Cells and Hydrogen 2 Joint Undertaking, Hydrogen roadmap Europe: a sustainable pathway for the European energy transition, 2016 (accessed January 2024) https://data.europa.eu/doi/10.2843/341510.
- G. Lagioia, M. P. Spinelli and V. Amicarelli, Int. J. Hydrogen Energy, 2023, 48, 1304 CrossRef CAS.
- R. Pinsky, P. Sabharwall, J. Hartvigsen and J. O’Brien, Prog. Nucl. Energy, 2020, 123, 103317 CrossRef CAS.
- IEA, The Future of Hydrogen, Paris, 2019, https://www.iea.org/reports/the-future-of-hydrogen (accessed January 2024) Search PubMed.
- R. Kötz, H. J. Lewerenz and S. Stucki, J. Electrochem. Soc., 1983, 130, 825 CrossRef.
- R. Kötz, H. Neff and S. Stucki, J. Electrochem. Soc., 1984, 131, 72 CrossRef.
- A. Aljabour, ChemistrySelect, 2020, 5, 7482 CrossRef CAS.
- J. Li, X. Yu, R. Sun, H. Li, X. Zhu, Y. Ma and L. Ma, Carbon Trends, 2023, 12, 100285 CrossRef CAS.
- F. Zeng, C. Mebrahtu, L. Liao, A. K. Beine and R. Palkovits, J. Energy Chem., 2022, 69, 301 CrossRef CAS.
- Y. Sun, J. Wu, Y. Xie, X. Wang, K. Ma, Z. Tian, Z. Zhang, Q. Liao, W. Zheng, Z. Kang and Y. Zhang, Adv. Funct. Mater., 2022, 32, 2207116 CrossRef CAS.
- H. P. Phan La, K. T. Thi Tran, L. B. Hoang Nguyen, M. Van Tran and V. Van Pham, Int. J. Hydrogen Energy, 2024, 52, 482 CrossRef CAS.
- B. Seo, Y. J. Sa, J. Woo, K. Kwon, J. Park, T. J. Shin, H. Y. Jeong and S. H. Joo, ACS Catal., 2016, 6, 4347 CrossRef CAS.
- S. Saddeler, U. Hagemann and S. Schulz, Inorg. Chem., 2020, 59, 10013 CrossRef CAS PubMed.
- F. T. Haase, A. Bergmann, T. E. Jones, J. Timoshenko, A. Herzog, H. S. Jeon, C. Rettenmaier and B. Roldan Cuenya, Nat. Energy, 2022, 7, 765 CrossRef CAS.
- T. Quast, H. B. Aiyappa, S. Saddeler, P. Wilde, Y. T. Chen, S. Schulz and W. Schuhmann, Angew. Chem., Int. Ed., 2021, 60, 3576 ( Angew. Chem. , 2021 , 133 , 3619 ) CrossRef CAS PubMed.
- J. Bae, D. Shin, H. Jeong, C. Choe, Y. Choi, J. W. Han and H. Lee, ACS Catal., 2021, 11, 11066 CrossRef CAS.
- L. H. Zhang, H. Y. Chuai, H. Liu, Q. Fan, S. Y. Kuang, S. Zhang and X. B. Ma, J. Electrochem., 2022, 28, 2108481 Search PubMed.
- M. G. Lee, J. W. Yang, H. R. Kwon and H. W. Jang, CrystEngComm, 2022, 24, 5838 RSC.
- S. Varhade, E. B. Tetteh, S. Saddeler, S. Schumacher, H. B. Aiyappa, G. Bendt, S. Schulz, C. Andronescu and W. Schuhmann, Chem. – Eur. J., 2023, 29, e202203474 CrossRef CAS PubMed.
- A. El Arrassi, Z. Liu, M. V. Evers, N. Blanc, G. Bendt, S. Saddeler, D. Tetzlaff, D. Pohl, C. Damm, S. Schulz and K. Tschulik, J. Am. Chem. Soc., 2019, 141, 9197 CrossRef CAS PubMed.
- Z. Liu, M. Corva, H. M. A. Amin, N. Blanc, J. Linnemann and K. Tschulik, Int. J. Mol. Sci., 2021, 22, 13137 CrossRef CAS PubMed.
- T. Quast, S. Varhade, S. Saddeler, Y. T. Chen, C. Andronescu, S. Schulz and W. Schuhmann, Angew. Chem., Int. Ed., 2021, 60, 23444 ( Angew. Chem. , 2021 , 133 , 23634 ) CrossRef CAS PubMed.
- T. Tarnev, H. B. Aiyappa, A. Botz, T. Erichsen, A. Ernst, C. Andronescu and W. Schuhmann, Angew. Chem., Int. Ed., 2019, 58, 14265 ( Angew. Chem. , 2019 , 131 , 14403 ) CrossRef CAS PubMed.
- S. R. Ede and Z. Luo, J. Mater. Chem. A, 2021, 9, 20131 RSC.
- J. O. Olowoyo and R. J. Kriek, Small, 2022, 18, 2203125 CrossRef CAS PubMed.
- J. Jiang, X. L. Zhou, H. G. Lv, H. Q. Yu and Y. Yu, Adv. Funct. Mater., 2023, 33, 2212160 CrossRef CAS.
- S. Saddeler, G. Bendt, S. Salamon, F. T. Haase, J. Landers, J. Timoshenko, C. Rettenmaier, H. S. Jeon, A. Bergmann, H. Wende, B. Roldan Cuenya and S. Schulz, J. Mater. Chem. A, 2021, 9, 25381 RSC.
- K. Chakrapani, G. Bendt, H. Hajiyani, I. Schwarzrock, T. Lunkenbein, S. Salamon, J. Landers, H. Wende, R. Schlögl, R. Pentcheva, M. Behrens and S. Schulz, ChemCatChem, 2017, 9, 2988 CrossRef CAS.
- K. Chakrapani, G. Bendt, H. Hajiyani, T. Lunkenbein, M. T. Greiner, L. Masliuk, S. Salamon, J. Landers, R. Schlögl, H. Wende, R. Pentcheva, S. Schulz and M. Behrens, ACS Catal., 2018, 8, 1259 CrossRef CAS.
- Q. Deng, R. Huang, L.-H. Shao, A. V. Mumyatov, P. A. Troshin, C. An, S. Wu, L. Gao, B. Yang and N. Hu, Phys. Chem. Chem. Phys., 2023, 25, 12565 RSC.
- J. Rossmeisl, Z. W. Qu, H. Zhu, G. J. Kroes and J. K. Nørskov, J. Electroanal. Chem., 2007, 607, 83 CrossRef CAS.
- M. T. M. Koper, J. Electroanal. Chem., 2011, 660, 254 CrossRef CAS.
- M. Bajdich, M. García-Mota, A. Vojvodic, J. K. Nørskov and A. T. Bell, J. Am. Chem. Soc., 2013, 135, 13521 CrossRef CAS PubMed.
- C. G. Morales-Guio, L. Liardet and X. Hu, J. Am. Chem. Soc., 2016, 138, 8946 CrossRef CAS PubMed.
- L. Liardet and X. Hu, ACS Catal., 2018, 8, 644 CrossRef CAS PubMed.
- Y. Liu, Y. Ying, L. Fei, Y. Liu, Q. Hu, G. Zhang, S. Y. Pang, W. Lu, C. L. Mak, X. Luo, L. Zhou, M. Wei and H. Huang, J. Am. Chem. Soc., 2019, 141, 8136 CrossRef CAS PubMed.
- C. C. L. McCrory, S. Jung, J. C. Peters and T. F. Jaramillo, J. Am. Chem. Soc., 2013, 135, 16977 CrossRef CAS PubMed.
- M. Yu, E. Budiyanto and H. Tüysüz, Angew. Chem., Int. Ed., 2022, 61, e202103824 ( Angew. Chem. , 2022 , 134 , e202103824 ) CrossRef CAS PubMed.
- K. Prema Latha and C. Prema, and S. Meenakshi Sundar, J. Nanosci. Tech., 2018, 4, 475 Search PubMed.
- R. Wei, X. Bu, W. Gao, R. A. B. Villaos, G. Macam, Z. Q. Huang, C. Lan, F. C. Chuang, Y. Qu and J. C. Ho, ACS Appl. Mater. Interfaces, 2019, 11, 33012 CrossRef CAS PubMed.
- J. Han, X. Liu, H. Wan, D. Wu, G. Chen, J. Li, Y. Cao and R. Ma, ACS Sustainable Chem. Eng., 2020, 8, 5534 CrossRef CAS.
- M. S. Amer, P. Arunachalam, M. A. Ghanem, M. Al-Shalwi, A. Ahmad, A. I. Alharthi and A. M. Al-Mayouf, Int. J. Energy Res., 2021, 45, 9422 CrossRef CAS.
- C. C. Lin and C. C. L. McCrory, ACS Catal., 2017, 7, 443 CrossRef CAS.
- E. Budiyanto, M. Yu, M. Chen, S. DeBeer, O. Rüdiger and H. Tüysüz, ACS Appl. Energy Mater., 2020, 3, 8583 CrossRef CAS.
- I. Nikolov, R. Darkaoui, E. Zhecheva, R. Stoyanova, N. Dimitrov and T. Vitanov, J. Electroanal. Chem., 1997, 429, 157 CrossRef CAS.
- N.-I. Kim, Y. J. Sa, S.-H. Cho, I. So, K. Kwon, S. H. Joo and J.-Y. Park, J. Electrochem. Soc., 2016, 163, F3020 CrossRef CAS.
- Y. Li, P. Hasin and Y. Wu, Adv. Mater., 2010, 22, 1926 CrossRef CAS PubMed.
- S. H. Hsu, S. F. Hung, H. Y. Wang, F. X. Xiao, L. Zhang, H. Yang, H. M. Chen, J. M. Lee and B. Liu, Small Methods, 2018, 2, 1800001 CrossRef.
- E. Rios, P. Chartier and J. L. Gautier, Solid State Sci., 1999, 1, 267 CrossRef CAS.
- S. Hirai, S. Yagi, A. Seno, M. Fujioka, T. Ohno and T. Matsuda, RSC Adv., 2016, 6, 2019 RSC.
- K. Lankauf, K. Cysewska, J. Karczewski, A. Mielewczyk-Gryń, K. Górnicka, G. Cempura, M. Chen, P. Jasiński and S. Molin, Int. J. Hydrogen Energy, 2020, 45, 14867 CrossRef CAS.
- H. Y. Wang, S. F. Hung, H. Y. Chen, T. S. Chan, H. M. Chen and B. Liu, J. Am. Chem. Soc., 2016, 138, 36 CrossRef CAS PubMed.
- Z. Liu, G. Wang, X. Zhu, Y. Wang, Y. Zou, S. Zang and S. Wang, Angew. Chem., Int. Ed., 2020, 59, 4736 ( Angew. Chem. , 2020 , 132 , 4766 ) CrossRef CAS PubMed.
- N.-T. Suen, S.-F. Hung, Q. Quan, N. Zhang, Y.-J. Xu and H. M. Chen, Chem. Soc. Rev., 2017, 46, 337 RSC.
- M. Risch, F. Ringleb, M. Kohlhoff, P. Bogdanoff, P. Chernev, I. Zaharieva and H. Dau, Energy Environ. Sci., 2015, 8, 661 RSC.
- W. Song, Z. Ren, S. Y. Chen, Y. Meng, S. Biswas, P. Nandi, H. A. Elsen, P. X. Gao and S. L. Suib, ACS Appl. Mater. Interfaces, 2016, 8, 20802 CrossRef CAS PubMed.
- J. Huang, H. Sheng, R. D. Ross, J. Han, X. Wang, B. Song and S. Jin, Nat. Commun., 2021, 12, 3036 CrossRef CAS PubMed.
- E. M. Davis, A. Bergmann, C. Zhan, H. Kuhlenbeck and B. Roldan Cuenya, Nat. Commun., 2023, 14, 4791 CrossRef CAS PubMed.
- F. T. Haase, E. Ortega, S. Saddeler, F. P. Schmidt, D. Cruz, F. Scholten, M. Rüscher, A. Martini, H. S. Jeon, A. Herzog, U. Hejral, E. M. Davis, J. Timoshenko, A. Knop-Gericke, T. Lunkenbein, S. Schulz, A. Bergmann and B. Roldan Cuenya, Energy Environ. Sci., 2024, 17, 2046 RSC.
- F. Reikowski, F. Maroun, I. Pacheco, T. Wiegmann, P. Allongue, J. Stettner and O. M. Magnussen, ACS Catal., 2019, 9, 3811 CrossRef CAS.
- GitLab Uni DuE - Pi, https://git.uni-due.de/hm243ho/pi (accessed December 2023).
Footnote |
| † Electronic supplementary information (ESI) available: Additional analytical data including PXRD, TEM, EDX, Mössbauer and IR spectroscopy. See DOI: https://doi.org/10.1039/d4ma00088a |
| This journal is © The Royal Society of Chemistry 2024 |