
 Open Access Article
 This Open Access Article is licensed under a Creative Commons Attribution-Non Commercial 3.0 Unported Licence
Beyond acid treatment of PEDOT:PSS: decoding mechanisms of electrical conductivity enhancement†
Hatef
Yousefian
a,
Seyed Alireza
Hashemi
a,
Amin
Babaei-Ghazvini
 b,
Bishnu
Acharya
b,
Ahmadreza
Ghaffarkhah
*a and
Mohammad
Arjmand
*a
b,
Bishnu
Acharya
b,
Ahmadreza
Ghaffarkhah
*a and
Mohammad
Arjmand
*a
aNanomaterials and Polymer Nanocomposites Laboratory, School of Engineering, University of British Columbia, Kelowna, BC V1V 1V7, Canada. E-mail: ah.ghaffarkhah@ubc.ca; mohammad.arjmand@ubc.ca
bDepartment of Chemical and Biological Engineering, University of Saskatchewan, 57 Campus Drive, Saskatoon, SK S7N 5A9, Canada
First published on 27th March 2024
Abstract
Despite widespread recognition of acid treatment as a crucial method for enhancing electrical conductivity and expanding the applications of poly(3,4-ethylenedioxythiophene):poly(styrene sulfonate) (PEDOT:PSS), the mechanisms behind this improvement are yet under debate. In this study, we delved into the impact of various acids, including H2SO4, H3PO4, HCl, and HCOOH, on the electrical conductivity and structural alterations of PEDOT:PSS thick films (∼5 μm). Our findings demonstrate a robust correlation between high electrical conductivity and well-developed crystallinity. The high degree of crystallinity originates from a densely packed and well-ordered structure, which is remarkably influenced by the inter-lamellar stacking distance and the alignment of PEDOT lamella along the edge-on direction. Notably, through the combination of acid treatment and hot-pressing techniques, we achieved a remarkable enhancement in the electrical conductivity of PEDOT:PSS thick films, setting a new record of 3360 S cm−1. These films also exhibit remarkable properties, including high bending flexibility and tensile strength (42 MPa). As a result, the resultant strong, flexible, and highly conductive films can be used for high-end electromagnetic interference (EMI) shielding applications where it presented a high EMI shielding effectiveness and specific EMI shielding effectiveness of 51.79 dB and 75057.97 dB cm2 g−1 at a thickness of 4.66 μm, respectively.
1. Introduction
Poly(3,4-ethylenedioxythiophene):poly(styrene sulfonate) (PEDOT:PSS) is a rather new addition to the realm of intrinsically conducting polymers, but it has gained attention due to its outstanding film-forming properties, thermal stability, and tunable electrical conductivity.1–3 These characteristics render PEDOT:PSS a versatile material that can be used in a wide range of applications, including light-emitting diodes, solar cells, field-effect transistors, and electromagnetic interference (EMI) shielding.4–8 To date, a significant volume of research has been spearheaded towards improving the electrical conductivity of PEDOT:PSS through various treatments using organic solvents, ionic liquids, surfactants, salts, zwitterions, and acids.2,9,10 Among these methods, acid treatments have been found to be particularly effective in improving the electrical conductivity of PEDOT:PSS-based structures.11,12 However, the underlying mechanisms behind enhancing the electrical conductivity of PEDOT:PSS through acid treatment are not yet fully understood. Therefore, further research is needed to comprehend the underlying mechanisms and unlock the true potential of PEDOT:PSS.Untreated PEDOT:PSS has a relatively low electrical conductivity, with the highest value reported being 1 S cm−1. This can be attributed to the morphology and chemical structure of PEDOT:PSS, which includes electrically insulating PSS layers that restrict charge transport between conjugated PEDOT chains by increasing the π–π stacking distance.13,14 Additionally, long PSS chains force the shorter PEDOT chains to take on a coil structure, leading to poor inter-grain connections between PEDOT lamella.15 In the acid post-treatment method, acid splits into a cation and an anion and then attacks the positively charged PEDOT and the negatively charged PSS. PEDOT and PSS are separated after the ionic interactions, and then PSS is selectively removed from the system.16,17 By removing the PSS, the π–π stacking distance is decreased, and PEDOT grains start to reorganize from a coil conformation to a fibrillar conformation, in which a dense PEDOT network is aligned along the edge-on-direction.18 Therefore, the mobility of charge carriers is facilitated by reducing the π–π stacking distance and enhancing the interconnection between PEDOT grains.12
Despite extensive research on the effects of various acids on the electrical properties of PEDOT:PSS, the underlying mechanisms of the inter-grain structure and electrical conductivity enhancement remain unclear. Besides, different studies have proposed conflicting explanations for the acid treatment effects. For example, some studies have found that acid treatment primarily increases the grain size and crystallinity of PEDOT-rich domains, significantly increasing electrical conductivity.19–22 In contrast, other studies have claimed that the primary effect is a reduction in the π–π stacking distance between PEDOT lamella.12,23,24 The discrepancy between these findings warrants the need for further research to fully understand the mechanism behind the electrical conductivity enhancement of PEDOT:PSS through acid treatment.
More importantly, evaluating the mechanisms of acid-treated PEDOT:PSS structures is mainly limited to ultrathin and transparent films with a thickness of <100 nm.24 However, the structural changes of PEDOT:PSS are more complex in free-standing thick films, i.e., thicknesses greater than 5 μm, due to the restriction of internal rearrangement caused by the high thickness.25 Of note, thick films of PEDOT:PSS feature high flexibility, mechanical stability, and scalability, rendering them suitable candidates for applications such as EMI shielding, flexible electronics, and beyond.26 Therefore, a holistic approach is required to evaluate the factors affecting the electrical conductivity, chemical characteristics, and micro/macrostructure of PEDOT:PSS thick films after acid treatment.
Herein, we explored the enhancement of electrical conductivity and structural changes of PEDOT:PSS thick films after exposure to different acids, including H2SO4, H3PO4, HCl, and HCOOH. To unfold the underlying mechanisms, Fourier transform infrared (FTIR) spectroscopy, micro-Raman spectroscopy, field emission scanning electron microscopy (FESEM) coupled with surface roughness analysis, and X-ray photoelectron spectroscopy (XPS) were performed to detect the origin of intrachain and interchain conductivity changes within each PEDOT lamella. Additionally, the crystalline structure of the acid-treated PEDOT:PSS was examined using X-ray diffraction (XRD) analysis and grazing-incidence wide-angle X-ray scattering (GIWAXS). Furthermore, the mechanical properties of the PEDOT:PSS thick films, both before and after acid treatments, were investigated using a uniaxial tensile testing machine. Our findings unveiled that achieving high electrical conductivity relies on forming a highly crystalline and fibrillar structure, wherein PEDOT lamella are positioned in the closest inter-lamellar stacking distance along the edge-on direction. It was observed that shortening the PEDOT π–π stacking distance cannot directly influence the electrical conductivity enhancement. Instead, PEDOT π–π stacking can facilitate the formation of an aligned PEDOT-rich domain with a high degree of crystallinity by providing a compact PEDOT crystallite structure in an appropriate orientation. Furthermore, by combining acid treatment with hot-pressing, we significantly enhanced the conductivity of PEDOT:PSS films to 3360 S cm−1 by controlling both the crystallinity of PEDOT and the d-spacing between PEDOT lamella. As a proof of concept, these highly conductive PEDOT:PSS films were used for EMI shielding applications, where they exhibited a superior EMI shielding effectiveness and specific EMI shielding effectiveness of 51.79 dB and 75057.97 dB cm2 g−1 at a thickness of 4.66 μm, respectively, along with notable mechanical robustness (tensile strength of 42 MPa) and cyclic stability.
2. Experimental
2.1. Materials
PEDOT:PSS aqueous solution (Clevios, PH1000) with a mass ratio of 1![[thin space (1/6-em)]](https://www.rsc.org/images/entities/char_2009.gif) :2.5 was purchased from Heraeus. Sulfuric acid (H2SO4, 98%), phosphoric acid (H3PO4, 98%), formic acid (HCOOH, 98%), and hydrochloric acid (HCl, 37%) were obtained from Sigma-Aldrich. All the chemicals were used without further purification.
:2.5 was purchased from Heraeus. Sulfuric acid (H2SO4, 98%), phosphoric acid (H3PO4, 98%), formic acid (HCOOH, 98%), and hydrochloric acid (HCl, 37%) were obtained from Sigma-Aldrich. All the chemicals were used without further purification.
2.2. Fabrication process
PEDOT:PSS films were fabricated using the drop-casting method. Briefly, 7 mL of PEDOT:PSS aqueous solution was precisely dropped into a plastic Petri-dish with a diameter of 5 cm. The Petri-dish containing the solution was then placed inside a vacuum oven and dried at a temperature of 60 °C for 12 h. The dried film was then peeled off from the Petri-dish and annealed at a temperature of 130 °C for 15 min to improve the film's properties. To further enhance the performance of the PEDOT:PSS films, the pristine films with the same thickness were immersed in 50 mL of highly concentrated acids, including H2SO4, H3PO4, HCl, and HCOOH, for 24 h at room temperature. The films were then thoroughly rinsed with deionized (DI) water to eliminate any remaining acid or PSS. The acid-treated samples were then annealed at various temperatures of 100, 120, 130, 140, and 160 °C for 30 min to examine the effect of annealing temperature on the properties of the films.In addition to annealing, we also investigated the effect of hot-pressing on the electrical conductivity of the acid-treated PEDOT:PSS films. Accordingly, after washing the acid-treated samples with DI water, the obtained PEDOT:PSS films were sandwiched between two Teflon sheets and then hot pressed at 130 °C for 30 min. The applied pressure was varied between 10, 20, 30, 50, and 70 MPa, and the characteristics of the obtained films were investigated.
2.3. General characterization
The generated PEDOT:PSS films were assayed with different techniques to explore their characteristics. Accordingly, the film's thickness was measured via FESEM analysis using a Tescan Mira 3 XMU microscope equipped with a field emission gun, while the surface texture of the films was characterized based on surface FESEM images and reconstructed in the MATLAB software as a 3D profile of the surface.27 The electrical conductivity of the prepared samples was measured using a Loresta GP resistivity meter (MCP-T700 model, Mitsubishi Chemical Co.) connected with a four-pin probe. Electrical conductivity was measured on three samples with at least ten repetitions for each acid treatment. The chemical structure of the films was investigated via FTIR analysis (Nicolet iS50, Thermo Fisher Scientific Inc., USA) within the spectrum range of 500 to 4000 cm−1. A confocal Raman microscope (Bruker, Senterra II) was employed to obtain the Raman pattern from 0 to 3500 cm−1 using a 532 nm Ar+ laser. XPS measurements were taken using an AXIS Supra (Kratos Analytical) instrument with a 500 mm Rowland circle monochromated Al Kα (1486.6 eV) X-ray source. An X-ray powder diffractometer (Bruker Eiger2 R 500K, Cu Kα, λ = 1.5406 Å) collected the XRD pattern based on the conventional theta/2theta geometry at 40 kV and 15 mA. The survey spectra were recorded from 3° to 40° with a step increment of 0.1°. Grazing-incidence wide-angle X-ray scattering (GIWAXS) measurements were performed at the Brockhouse X-ray Diffraction Sector low energy wiggler (BXDS-WLE) beamline of the Canadian Light Source, with a photon energy of 15.1 keV (λ = 0.81931 Å). A Rayonix MX300 CCD detector (73.242 μm × 73.242 μm pixel size) placed 344.57 mm from the sample was used to collect 2D scattering patterns at an angle of incidence of θ = 0.5°. The lanthanum boride (lanthanum hexaboride, LaB6) standard was used to calibrate the data, which was analyzed and plotted with the GSAS-II software.28 According to the ASTM D882, the mechanical behavior of PEDOT:PSS films was measured using a uniaxial tensile machine (ZwickRoell tensile testing machine). EMI shielding characteristics of the fabricated films were assessed within the X-band frequency range (8.2–12.4 GHz) using a vector network analyzer (VNA) (P9374A Keysight) equipped with a WR90 waveguide. More information on measurement guidelines and the equations pertinent to the EMI shielding parameters is presented in the ESI.†3. Results and discussion
In this study, the structural changes in the acid-treated PEDOT:PSS thick films towards the enhancement of electrical conductivity were deciphered via three steps, including (1) creating free-standing PEDOT:PSS films and exposing them to different acids, (2) treating the developed films in step 1 with either high-temperature annealing or high-pressure/high-temperature hot-pressing, and (3) analyzing the structural changes in PEDOT:PSS and linking them to improved conductivity.3.1 Acid-treated PEDOT:PSS films: a journey from underlying mechanisms to electrical conductivity enhancement
Various acid post-treatments were devised to decipher the principal factors enhancing the electrical conductivity of the PEDOT:PSS films, followed by detailed structural characterization. Fig. S1 (ESI†) demonstrates the impact of various acids on the electrical conductivity as a function of annealing temperature. As depicted, upon annealing the H2SO4-treated film at 130 °C, the electrical conductivity of the film enhanced to a maximum of 1885 S cm−1. Meanwhile, a further increase of the annealing temperature to 160 °C declined the electrical conductivity to 1101 S cm−1, showcasing an optimum annealing temperature for the H2SO4 post-treated PEDOT:PSS films. On the other hand, H3PO4-treated PEDOT:PSS films demonstrated an ascending trend with annealing temperature, increasing the electrical conductivity from 494 S cm−1 to 891 S cm−1 with an increase in the temperature from 100 to 160 °C. In HCl and HCOOH-treated samples, the maximum electrical conductivities of 860 and 1025 S cm−1 were achieved at annealing temperatures of 130 and 160 °C, respectively. However, HCl and HCOOH treatments do not show a clear relationship between annealing temperature and electrical conductivity, where we observed a roller-coaster trend in the electrical conductivity with the increasing annealing temperature. The results obtained clearly demonstrate that the annealing temperature is pivotal in enhancing the electrical conductivity by eliminating excess water from the PEDOT:PSS film. This process results in the shrinkage of the hydrophilic and insulating PSS regions, consequently increasing electrical conductivity. However, the optimal annealing temperature required to enhance electrical conductivity varies, depending on the type of acid used. For instance, the most favorable annealing temperature for treatment with H2SO4 and HCl is 130 °C, while for H3PO4 and HCOOH, the optimum temperature is 160 °C.Based on the results presented in Fig. 1(a)–(f), a relationship can be observed between the thickness of the fabricated films and their electrical conductivity at the optimal annealing temperatures, where the thickness of treated films decreased differently depending on the type of acids. For instance, acid post-treatment with highly concentrated H2SO4 showcases the lowest thickness (6.60 μm) associated with the highest electrical conductivity, i.e., 1885 S cm−1. In contrast, the HCl-treated film presents the lowest shrinkage (28.57 μm) compared to the other treated samples, accompanied by the least enhancement in electrical conductivity recorded at 860 S cm−1. Such a difference in thickness shrinkage is attributed to acids’ capability to selectively remove the PSS building blocks, thereby facilitating the charge transport between PEDOT chains.
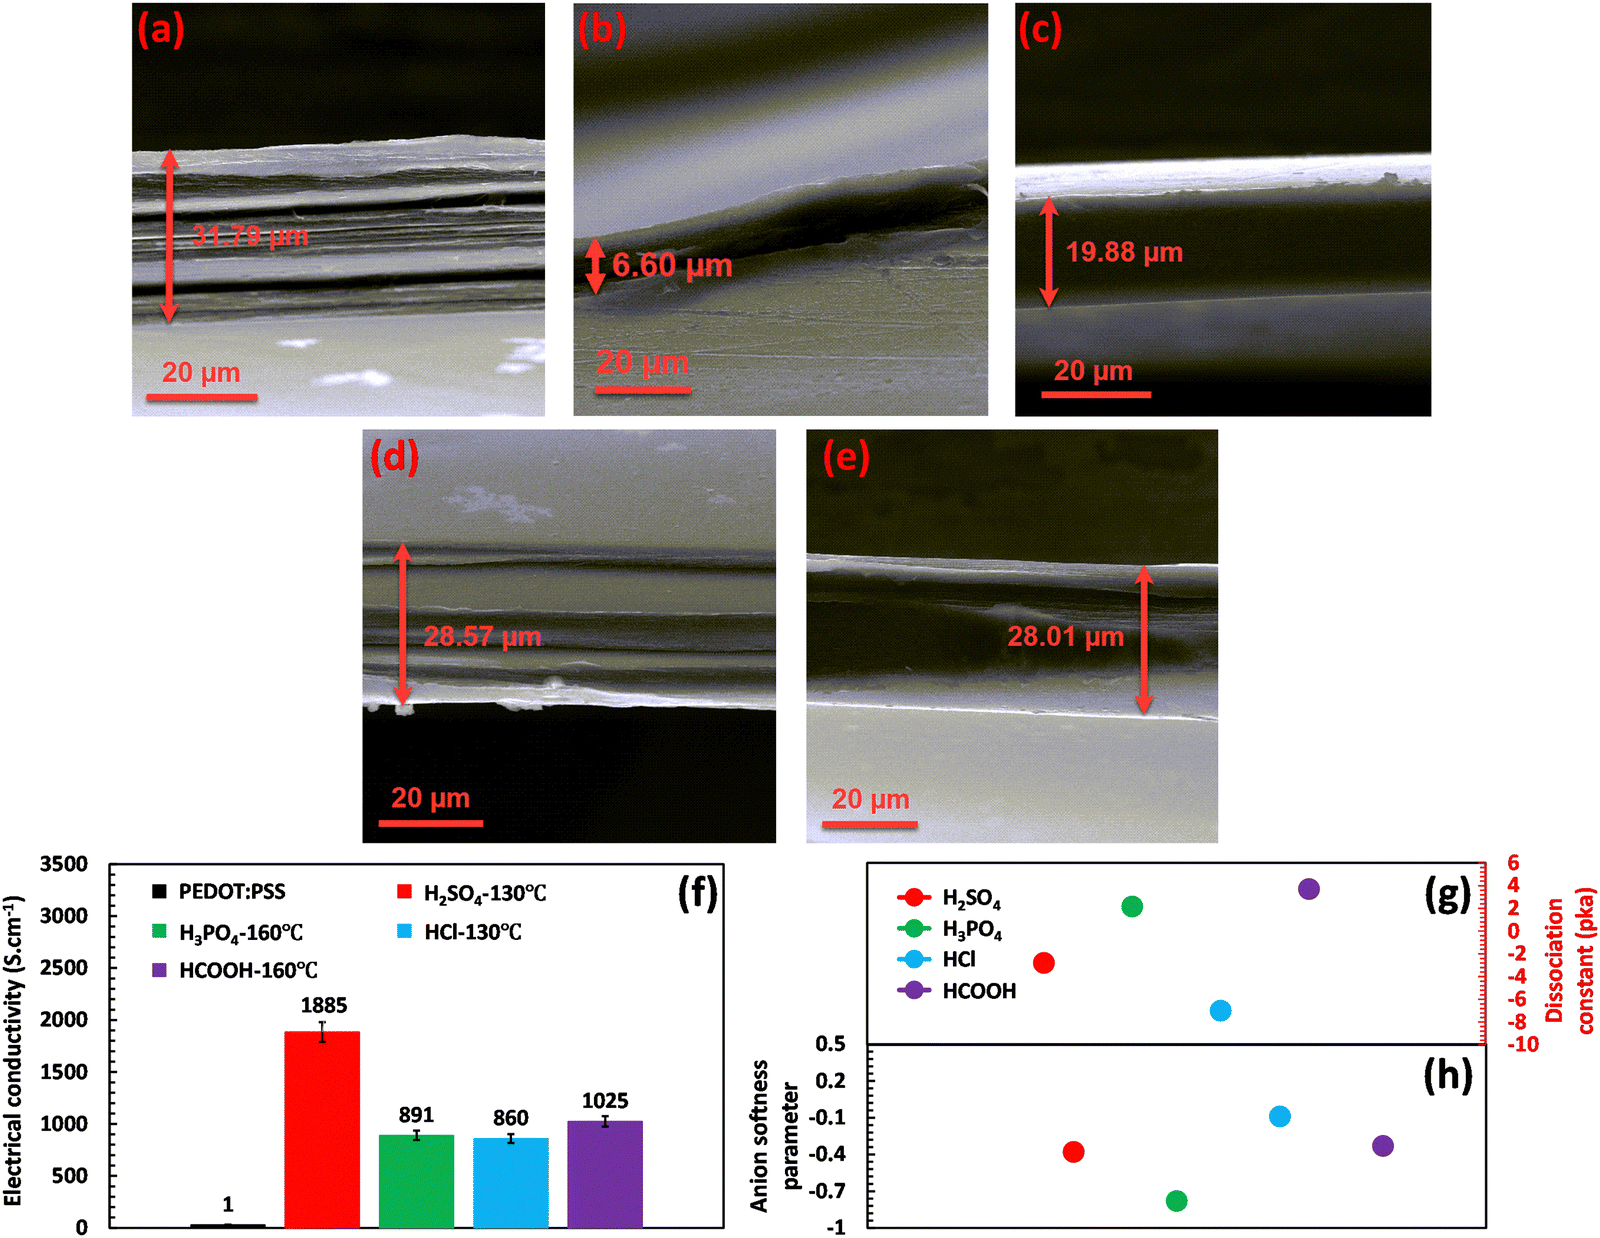 | ||
| Fig. 1 Cross-sectional FESEM images of (a) untreated, (b) H2SO4, (c) H3PO4, (d) HCl, and (e) HCOOH-treated PEDOT:PSS films. The two-sided arrows show the thickness of the films. (f) The electrical conductivity of PEDOT:PSS treated by different acids at the optimum annealing temperatures. (g) The dissociation constant (pKa) and (h) anion's softness parameter of the used acids. | ||
In the process of acid treatment, the acid undergoes dissociation into cations and anions, which then penetrate the PEDOT:PSS film, initiating phase separation and PSS removal. The efficiency of acids in releasing cations and anions is indicated by a lower or more negative pKa value.29,30 However, as shown in Fig. 1(g), the pKa value of the used acids does not always directly correlate with the extent of electrical conductivity enhancement. For example, although HCl exhibits a much lower pKa value (−7) than HCOOH (−3.7), it cannot improve the electrical conductivity as much as HCOOH. This phenomenon indicates the presence of other significant factors in enhancing the electrical conductivity of the acid-treated films (refer to Fig. 1(f) and (g)).
Achieving higher electrical conductivity upon acid treatment relies not only on identifying the release rate of cations and anions through pKa, but also on the capability of the generated ions to bond with PEDOT:PSS chains and initiate the separation of PSS and PEDOT building blocks. Generally, dissociated cations and anions form ionic bonds with the charged groups of PEDOT:PSS chains to initiate the separation process. The softness parameter of the ions can determine the strength of the ionic bond. In general, ions with low softness parameters are considered hard or less reactive, while ions with high softness parameters are considered soft or more reactive. Following the HSAB theory, hard molecules or ions with low softness tend to preferentially interact with other hard species ionically.31,32 When it comes to acid treatment of PEDOT:PSS, the focus is primarily on the anion's softness parameter since the generated cations, which are H+ ions, remain the same across all the used acids.11,12 A low or more negative softness parameter of anions reflects a stronger ionic bonding between anions and PEDOT chains and thus a soar in electrical conductivity.30,33
Therefore, high-performing acid treatment requires low or more negative values of both pKa and softness parameters. Low pKa ensures the sufficient release rate of cations and anions into the system, whereas the low softness parameter guarantees the formation of robust ionic bonds between PEDOT:PSS chains and dissociated ions.30 For instance, H2SO4 exhibits an acceptable pKa of −2.80 and a suitable softness parameter of −0.38 for its dissociated anion (SO42−), resulting in a significant increase in electrical conductivity up to 1885 S cm−1 (Fig. 1(f)–(h)). On the other hand, HCl showcases an insignificant effect on electrical conductivity compared with other acid post-treatments owing to its high softness parameter of −0.09.
The chemical structure and conformational changes of PEDOT:PSS after acid post-treatment of the free-standing films were monitored via FTIR and micro-Raman spectroscopy. The FTIR spectra of the post-treated PEDOT:PSS films were insignificantly affected by variations in annealing temperatures, as demonstrated in Fig. S2 (ESI†). Consequently, to investigate the chemical and structural changes caused by the elimination of PSS through phase separation, the focus was shifted to the FTIR spectra of films treated at the optimal annealing temperatures, as depicted in Fig. 2(a). The well-defined peaks within the 800–1005 cm−1 range are associated with the stretching vibration of C–S bonds (853, 937, and 1005 cm−1) belonging to the thiophene ring of PEDOT. The other fingerprint peaks of PEDOT arise from the backbone carbonaceous groups of C–C and C![[double bond, length as m-dash]](https://www.rsc.org/images/entities/char_e001.gif) C that appeared at 1261 and 1543 cm−1, respectively.12 Besides, the S-phenyl groups of PSS are represented at 1060 cm−1, whereas the symmetric and asymmetric stretching vibrations of SO32− groups of PSS appeared at 1125 and 1158 cm−1, respectively.12,34–37
C that appeared at 1261 and 1543 cm−1, respectively.12 Besides, the S-phenyl groups of PSS are represented at 1060 cm−1, whereas the symmetric and asymmetric stretching vibrations of SO32− groups of PSS appeared at 1125 and 1158 cm−1, respectively.12,34–37
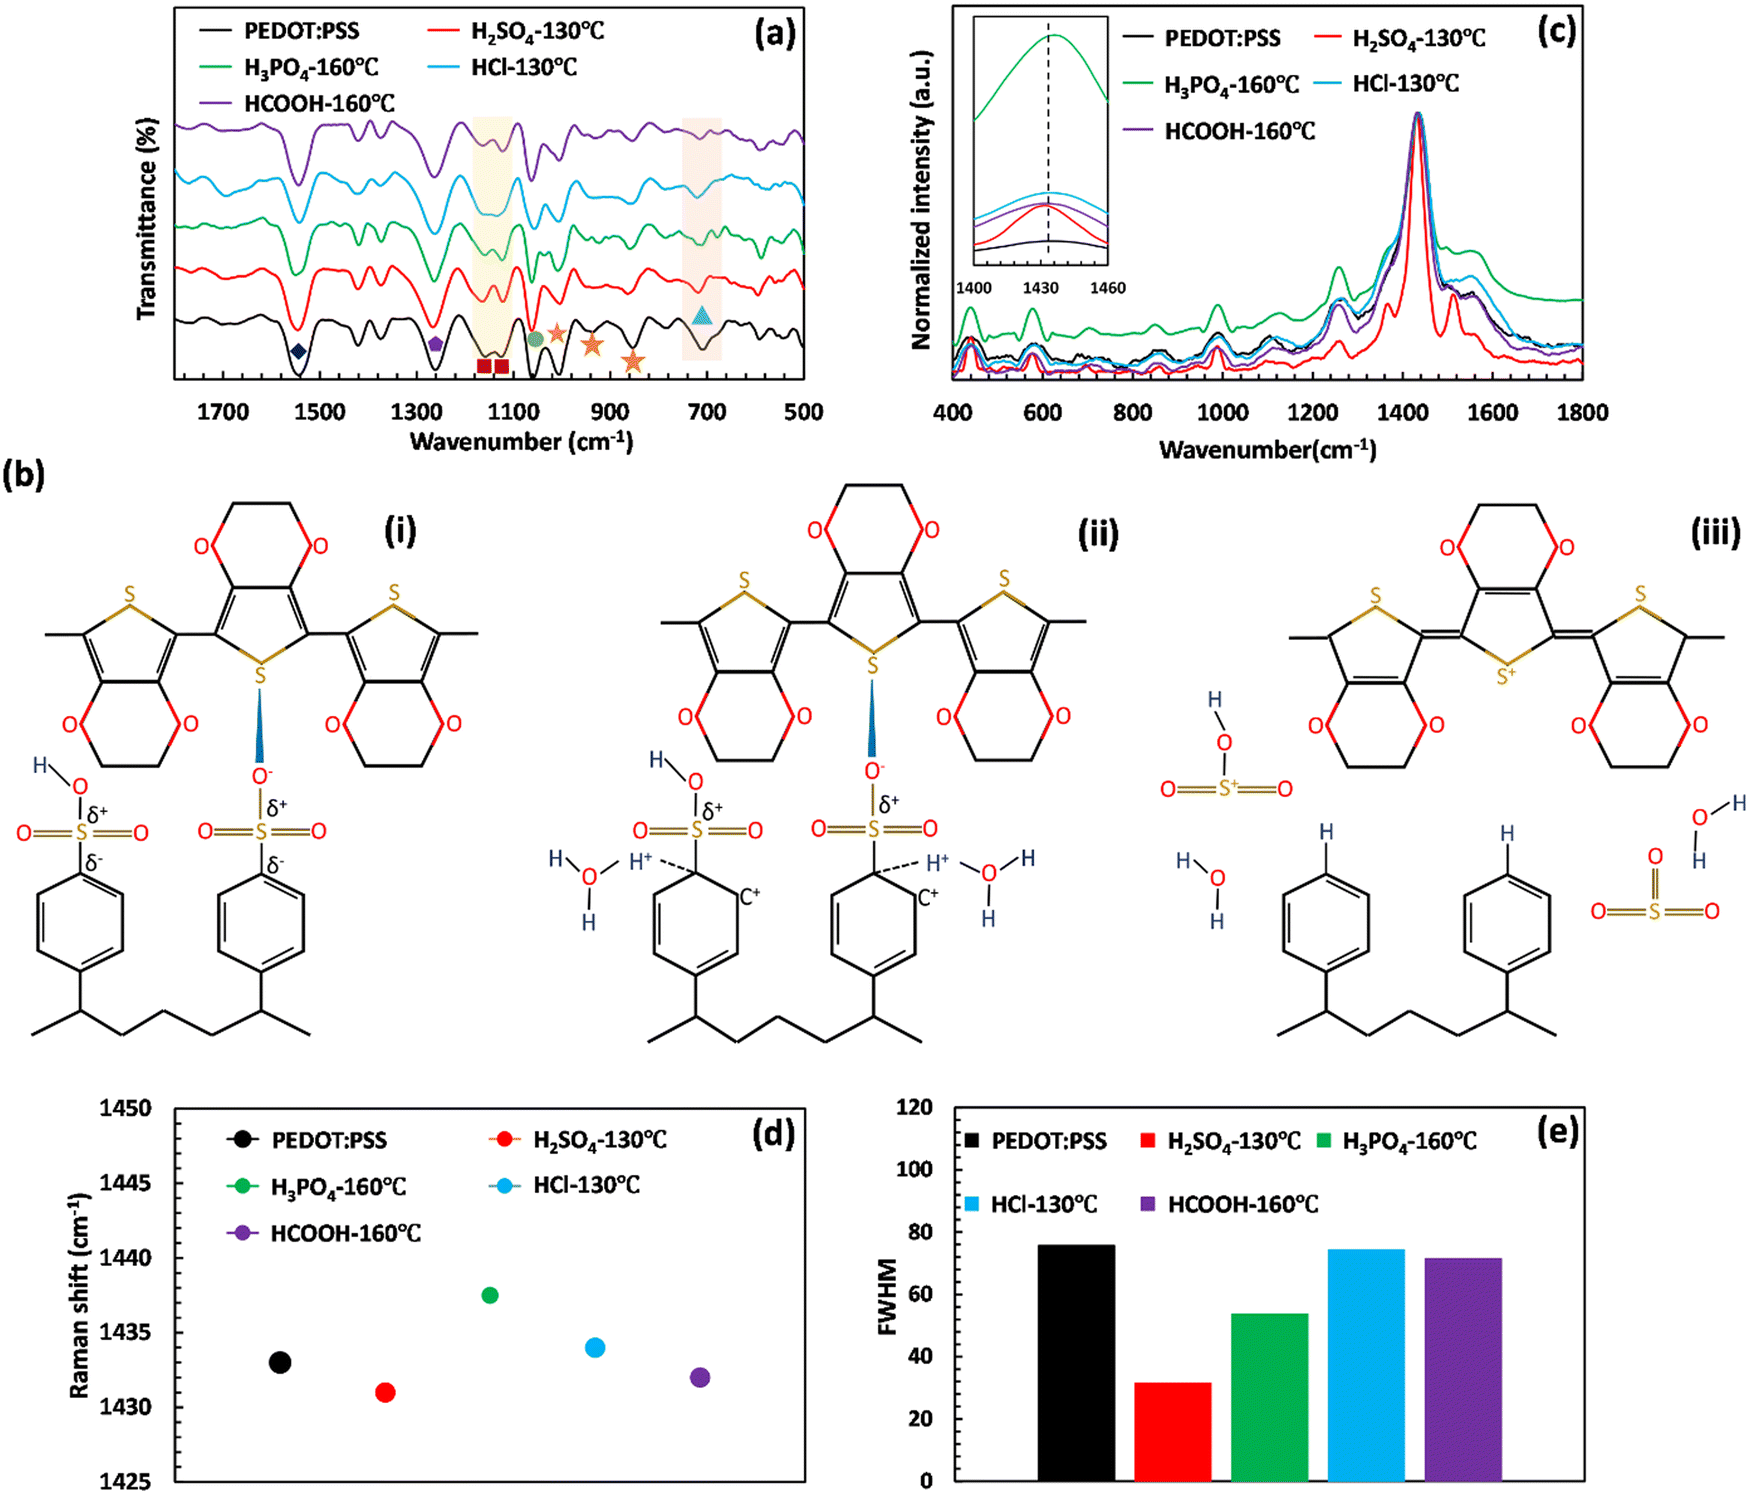 | ||
| Fig. 2 (a) FTIR spectra, (b) schematic of PSS desulfonation and PEDOT:PSS conformational change, and (c) Raman spectra of the prepared films before and after acid post-treatment. (d) Raman peak shift and (e) FWHM of the symmetric CαCα peak of PEDOT:PSS after different acid post-treatments. The symbols in Fig. 2(a) represent the assigned peaks of FTIR analysis. The orange star, dark blue diamond, and purple hexagon are attributed to the C–S and CS bonds of PEDOT, respectively. The C–S bond, S-phenyl group, and symmetric/asymmetric stretching vibrations of SO3− groups of PSS are shown by the blue triangle, green circle, and red square, respectively. It should be note that these FTIR and Raman characterization studies were performed at the optimum annealing temperature. The remaining characterization studies at different annealing temperatures are shown in Fig. S2 and S3 in the ESI.† | ||
The acid post-treatment primarily impacts the fingerprint peaks of PSS chains, with a minimal influence on the assigned peaks of PEDOT. Specifically, the stretching vibration of C–S bonds, which originate from the thiophene rings of PEDOT, remains mostly unchanged by the acid post-treatment (see Fig. 2(a) and Tables S1–S4, ESI†). However, the treatment results in a decrease in the intensity of the peaks related to the symmetric and asymmetric stretching vibrations of SO32− groups of PSS (1125 and 1158 cm−1), indicating the desulfonation of the PSS structure in PEDOT:PSS films.
To infer the changes in peak intensity assigned to the PSS structure, we illustrated the desulfonation process of PSS upon H2SO4 post-treatment in Fig. 2(b). The structure of PSS contains sulfonic acid (–SO3H) and sulfonate ion (–SO3−) groups that are not conjugated to the benzene ring. As a result, the electron density at the meta-position of the benzene ring on the carbon atom increases significantly, producing partially positive and negative charges on the sulfur and carbon atoms of the C–S bond, respectively (Fig. 2(b)-(i)). Upon introducing sulfuric acid, it dissociates and releases its hydronium ion, which then attacks the partially negatively charged carbon of the PSS C–S bond. This is evident by the reduced intensity of the C–S group of PSS (709 cm−1).37–39 The attacked carbon necessitates an additional electron to compensate for the new bond, which it obtains from the neighboring carbon in the ring, resulting in carbon cation formation (see Fig. 2(b)-(ii)). To maintain its aromaticity, the benzene ring rearranges by releasing the weakened sulfonate group, followed by electron delocalization throughout the ring (see Fig. 2(b)-(iii)). When released, the sulfonium ion (SO3H+) can react with any present water molecules to produce sulfuric acid, leading to the desulfonation of polystyrene, which explains the reduced symmetric and asymmetric stretching vibrations of SO3− groups upon H2SO4 post-treatment.12
Raman spectroscopy is another helpful technique for assessing the chemical structure and conformational changes of polymers. As illustrated in Fig. 2(c), the Raman spectra of PEDOT:PSS films have six main peaks attributed to the deformation of –OCH2 (585 and 985 cm−1), deformation of PSS part (1103 cm−1), inter aromatic ring vibration of Cα–Cα (1261 cm−1), symmetric vibration of CαCα (1433 cm−1), and asymmetric vibration of CαCα (1542 cm−1).39–42 By comparing the Raman spectra of the acid-treated PEDOT:PSS films, it can be seen that the films experienced red or blue shifts at the Raman band of 1433 cm−1 based on the type of acid (Fig. 2(c) and (d)). The red shift is caused by conformational changes in the PEDOT resonant structure, which shifts from benzoid to quinoid. Conversely, the blue shift is due to the creation of positive charges within the thiophene ring of PEDOT.43,44 In this case, the thiophene ring of PEDOT exists in three forms: benzoid, intermediate, and quinoid. The benzoid structure is a distorted PEDOT backbone in the presence of localized carriers, while the quinoid structure has a planar conformation with an extended PEDOT backbone. Therefore, treatment methods aim to convert the benzoid structure of the PEDOT into the quinoid structure, accompanied by an increase in the oxidation level of the PEDOT. The higher oxidation level indicates a change in the conjugated backbone of the PEDOT chain from the neutral state to polaron and bipolaron, resulting in a substantial enhancement in electrical conductivity through the creation of extra charged holes within the system.2,30,40,45,46 Hence, in addition to low or negative values of pKa and softness parameters, a strong acid should have a high ability to improve the oxidation level of PEDOT:PSS.40
As evidenced in Fig. 2(d), the central band of the untreated film at 1433 cm−1 shifts to 1431 and 1432 cm−1 after post-treatment with H2SO4 and HCOOH, respectively, leading to the conformational change of the PEDOT backbone from benzoid to quinoid. The decrease of the corresponding full width at half maximum (FWHM) value can also be counted as a further piece of evidence for the significant conformational change of the PEDOT backbone, where it reaches a minimum amount of 31.58 in the film treated with H2SO4 (Fig. 2(e)).47 This significant conformational alteration is also underscored by the appearance of a new band at 1524 cm−1 in the H2SO4-treated film, indicating the rearrangement of PEDOT chains and the replacement of PSS− units by bisulfate ions (HSO4−) during the phase separation process.42 This significant conformational change masked the Raman shift due to the change in oxidation levels. In contrast, treatment with H3PO4 and HCl leads to the blue shift in the symmetric vibration of CαCα, in which the Raman band at 1433 cm−1 shifts to higher wavenumbers of 1437.50 cm−1 and 1434 cm−1, respectively. This effect is related to the degree of backbone deformation during oxidation to polarons and bipolarons. The obtained results propose H2SO4, HCOOH, and H3PO4 as the strongest acids in improving the oxidation level of PEDOT:PSS, as the symmetric CαCα peak position undergoes the most red and blue shifts.
Furthermore, the annealing temperature can induce significant changes in the oxidation level of PEDOT:PSS. This is particularly noticeable in films treated with H2SO4, where the minimum red shift, observed at a temperature of 100 °C, is measured at 0.5 cm−1. This shift escalates to a maximum value of 2 cm−1 at 130 °C, before decreasing to its minimum at 160 °C. Most notably, at 130 °C, a substantial conversion of the benzoid conformation to the quinoid conformation occurs, which is associated with the generation of an increased number of polaron and bipolaron species along the PEDOT backbone, as illustrated in Fig. S3a and b (ESI†).
According to Fig. S3c and d in the ESI,† the annealing temperature impacts the treatment with H3PO4 differently, where the symmetric CαCα peak position shifts to a higher frequency (blue shifts) to 1438 cm−1 as the annealing temperature increases to 130 °C, thereafter stabilizing. This indicates that increasing the annealing temperature aids the PEDOT chains in adjusting their interchain interactions and altering their conformation. Conversely, in the treatments with HCl and HCOOH, the symmetric CαCα peak position varies with increasing temperature, showing no clear pattern that would suggest a direct correlation between changes in annealing temperature and the conformational adjustments of the PEDOT backbone, as evidenced in Fig. S3e–h of the ESI.† Overall, the annealing temperature significantly influences the electrical conductivity of PEDOT:PSS through modifications in its oxidation state. Specifically, the optimum electrical conductivity is achieved at distinct temperatures (130 °C for H2SO4 and 160 °C for H3PO4 treatments), coinciding with the highest oxidation levels in the PEDOT:PSS films. Recognizing the influence of annealing temperature on electrical conductivity allows for the targeted characterization on samples exhibiting the most enhanced conductivity.
The XPS analysis was performed to explore the mechanism of PSS removal and intermolecular interaction. Fig. 3(a) and (b) showcase the S2p and O1s scans of PEDOT:PSS after acid post-treatment. In the S2p spectra region, two prominent features can be observed, corresponding to the PEDOT and PSS rings. The XPS band between 166 and 172 eV presents a broad peak associated with the sulfur atom of PSS, and the doublet peaks between 162 and 166 eV correspond to the sulfur atom in PEDOT.48,49 As illustrated in Fig. 3(a), the intensity of the broad PSS peak significantly decreases upon acid treatment, indicating a phase separation and a PSS removal process. To quantify the relative composition of PEDOT and PSS, the areas under the PEDOT and PSS peaks were calculated through Gaussian deconvolution (Fig. S4, ESI†).11 The area ratio between PEDOT and PSS increases depending on the strength of the acids (Fig. 3(c)). In the case of H2SO4 treatment, the PEDOT to PSS ratio increases by 160% and reaches a maximum value of 1.31, where a large amount of PSS is removed due to the low pKa (−2.80) and low softness parameter (−0.38). This effect is consistent with the drastic reduction in the thickness of the treated film. Similarly, HCOOH treatment increases the PEDOT to PSS ratio from 0.50 to 1.03, indicating a substantial removal of PSS layers. This explains why the electrical conductivity of HCOOH was ranked second among the acids used, with a conductivity of 1025 S cm−1. However, unlike treatment with H2SO4, the thickness of the film treated with HCOOH did not significantly change (see Fig. 1(b) and (e)). This phenomenon could be due to the high pKa value (3.7) of HCOOH, leading to the surface removal of PSS layers.50 Finally, the low PEDOT to PSS ratio of the film treated with HCl is due to the high softness parameter (−0.09), which prevents HCl from removing PSS.
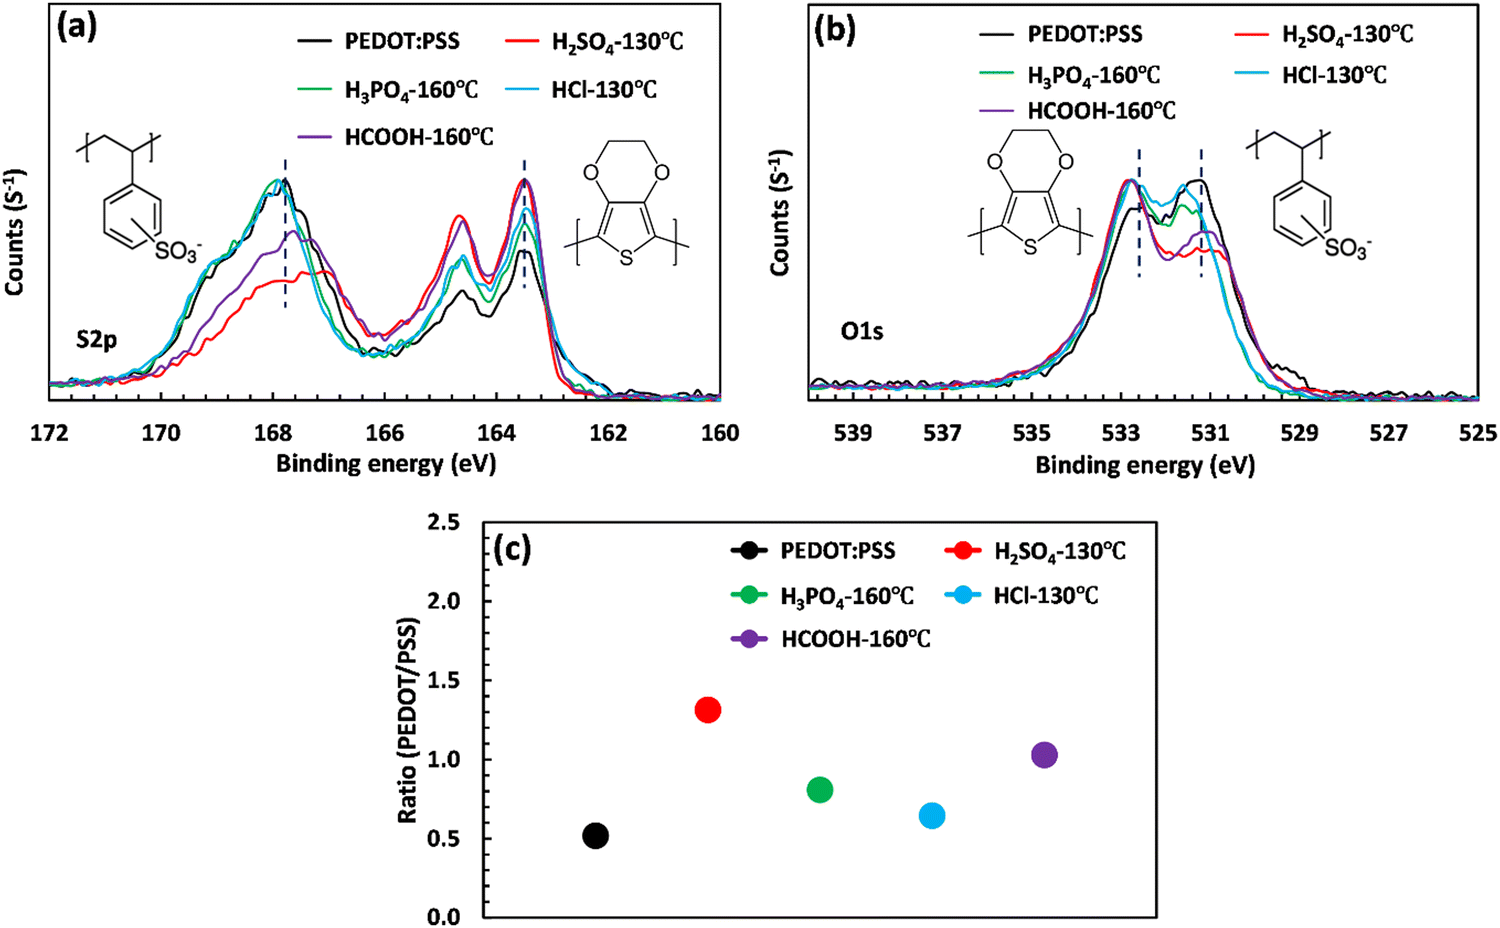 | ||
| Fig. 3 (a) S2p and (b) O1s scan of the XPS spectra of PEDOT:PSS upon acid post-treatment. (c) PEDOT/PSS ratio calculated from the area under the S2p scan. | ||
XPS can also be used to evaluate the oxidation state of atomic species by analyzing changes in binding energy. In this case, acid treatment leads to a shift in the S2p and O1s binding energy of PEDOT:PSS. As shown in Table S5 (ESI†), the S2p(3/2) peak for PEDOT is located at 163.43 eV and shifts to higher binding energies of 163.50 and 163.45 eV after treatment with H2SO4 and HCOOH, respectively. This blue shift indicates an increase in the oxidation level of the thiophene–sulfur in PEDOT. According to micro-Raman spectroscopy, this improvement in the oxidation level is accompanied by the formation of polarons and bipolarons, enhancing the thick film's electrical conductivity.41,51 On the other hand, the binding energy of sulfur atoms in PSS undergoes a significant reduction of approximately 0.80 and 0.44 eV upon treatment with H2SO4 and HCOOH, respectively. As a result, the PSS chains acquire a less negative charge, which promotes phase separation and facilitates the removal of PSS.52 This phenomenon can also be observed in the O1s scan (Fig. 3(b)). Prior to treatment, the oxygen atom in PEDOT and PSS is detected at binding energies of 532.5 and 531 eV, respectively (Fig. S5, ESI†). However, upon acid treatment with H2SO4 and HCOOH, the oxygen signal for PSS shifts to 531.20 eV (as shown in Table S5, ESI†), indicating the formation of a bond between SO3− and hydronium ions. This bond weakens the coulombic interaction between PEDOT and PSS and hence facilitates the removal of PSS.39
The crystalline structure of PEDOT:PSS after acid post-treatment was investigated using X-ray diffractometry. Fig. 4(a) shows the XRD pattern of pristine PEDOT:PSS, displaying three characteristic peaks at 2θ = 7.3° (12.09 Å), 18.1° (4.90 Å), and 25.9° (3.44 Å).19,53,54 The peak at 2θ of 7.3° indicates the alternate inter-lamellar stacking distance of PEDOT to PEDOT (d100),55,56 while the last two angle reflections at 2θ = 18.1° and 25.9° are attributed to the π–π stacking distance of the PSS benzene ring (d001) and the PEDOT thiophene ring (d010), respectively (Fig. 4(a)).57,58 Herein, we propose a semi-crystalline schematic to visualize the XRD-derived lattice spacing of PEDOT:PSS in the 3D-space (Scheme 1). After acid treatment, the inter-grain structure of PEDOT:PSS undergoes significant changes, which are observed in the X-ray diffractograms. For the film treated with H2SO4, the characteristic peak d100 shifts to a lower angle of 6.4° with a significant increase in intensity, indicating a dramatic growth of crystallinity upon the alignment of a PEDOT-rich domain.41,55 Conversely, the low intensity of d100 upon acid treatments with H3PO4 and HCl indicates their weakness in improving the crystallinity of PEDOT:PSS.
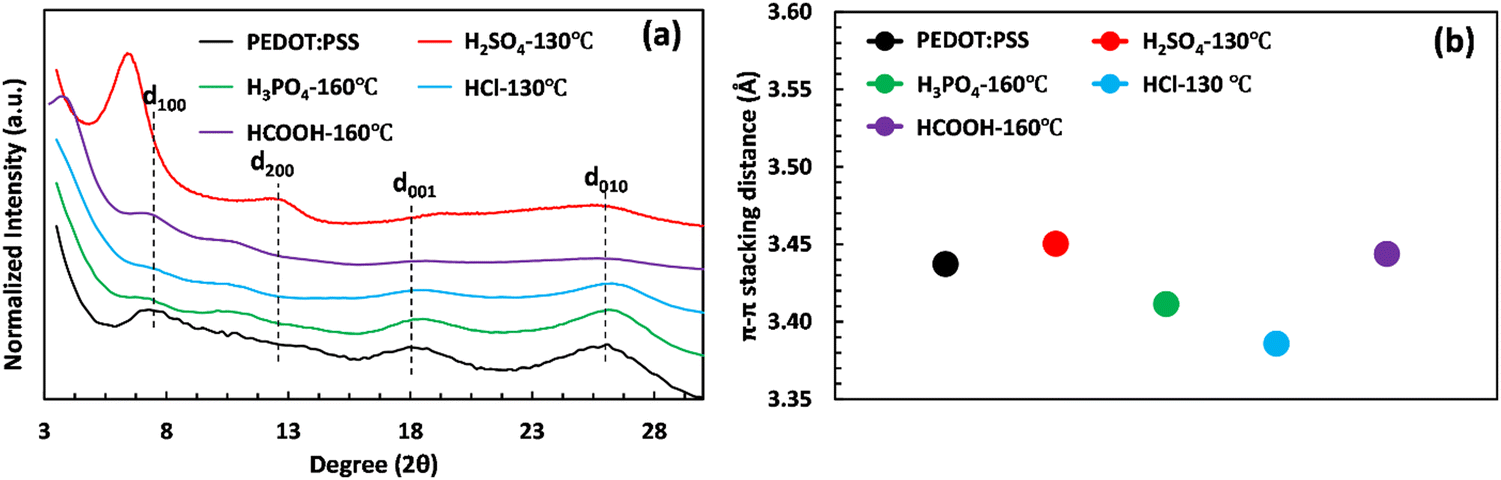 | ||
| Fig. 4 The crystalline behavior of PEDOT:PSS before and after acid treatment at the optimum annealing temperatures. (a) X-ray diffractogram and (b) π–π stacking distance of the PEDOT thiophene ring (d010). | ||
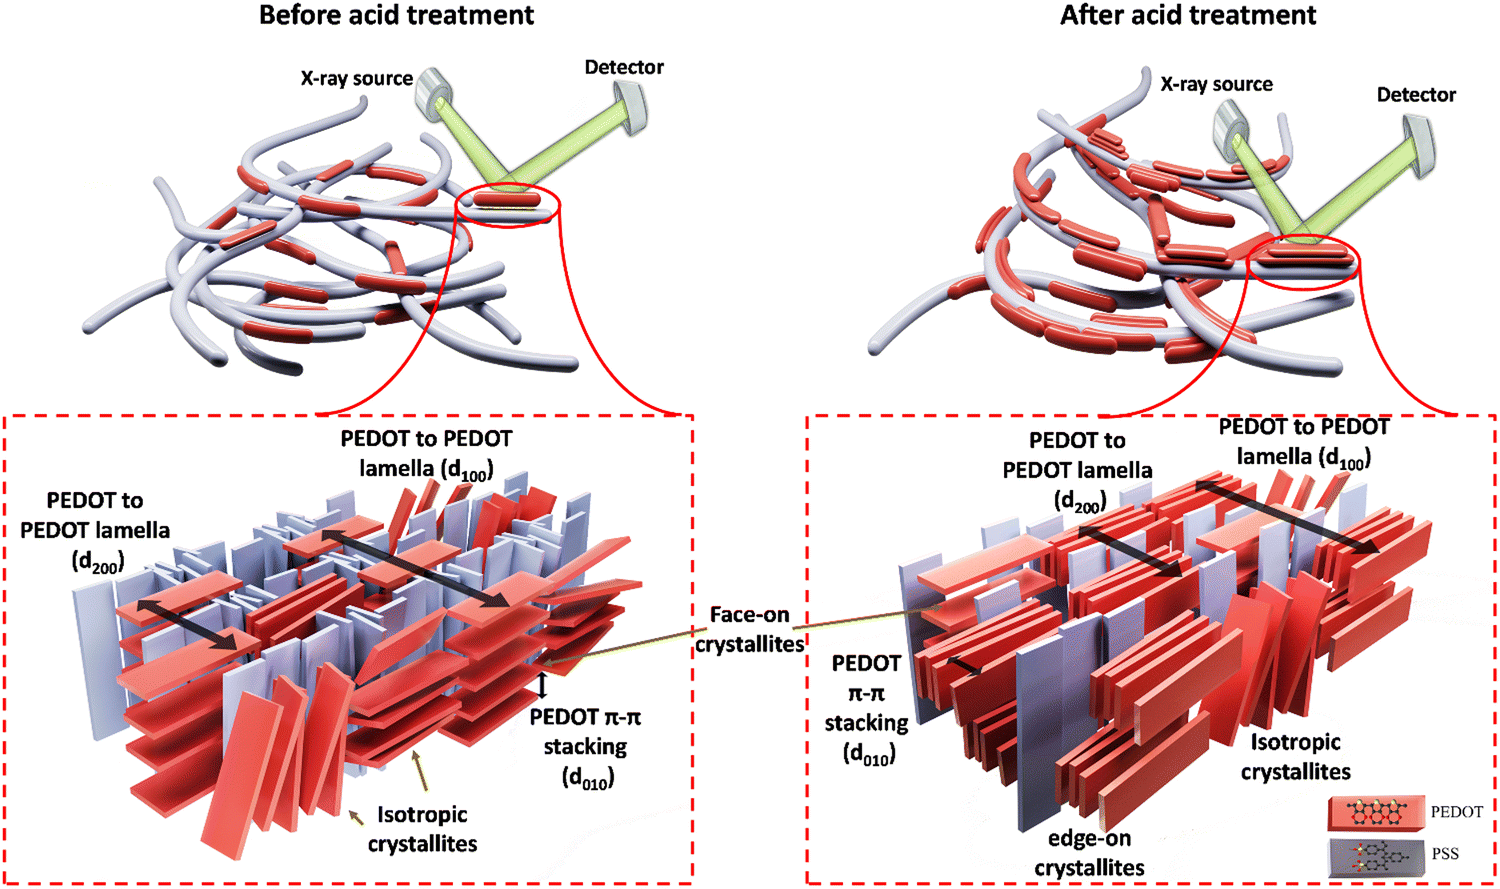 | ||
| Scheme 1 Schematic for structural changes of PEDOT:PSS before and after acid treatment. These structural changes include the variations in the alternate lamellar stacking distance (d100) and inter-lamellar stacking distance (d200), π–π stacking distance (d010), and orientation of PEDOT lamella. The orientation of PEDOT lamella could be classified as face-on, edge-on, or isotropic. | ||
The growth in crystallinity is also reflected by the appearance of the second-order-reflection peak d200 (called inter-lamellar stacking distance) in the acid-treated films, showing the space between side-by-side PEDOT lamella (Fig. 4(a) and Scheme 1).59 As shown in Fig. 4(a), the film treated with H2SO4 exhibits the most intense d200 at 12.4°, where the inter-lamellar stacking distance reaches a minimum value of 7.13 Å. However, the inter-lamellar stacking distance of the other used acids is significantly larger (8.04 to 8.57 Å), as indicated in Table S6 (ESI†). These results suggest that H2SO4 treatment brings PEDOT grains closer together compared to the other acids, resulting in a shorter inter-lamella charge hopping distance. Overall, the combination of the shorter inter-lamellar stacking distance (d200) and enhanced crystallinity (d100) in the H2SO4-treated films provides a highly interconnected fibrillar structure, reducing the energy required for charge carriers to hop over adjacent grains.
Our findings also highlight the importance of the inter-lamellar stacking distance (d200) and PEDOT:PSS crystallinity (d100) in enhancing the electrical conductivity of PEDOT:PSS films. In contrast, the significance of the PEDOT π–π stacking distance (d010) appears to be less critical. In fact, the H2SO4-treated PEDOT:PSS sample exhibits a higher π–π stacking distance (d010) than untreated films and those treated with other acids, as demonstrated in Fig. 4(b) and Table S6 (ESI†). This increase might be attributed to conformational changes in PEDOT chains, transitioning from benzoid to quinoid, resulting in a planar structure with a higher π–π stacking distance.41 These results contradict recent studies that suggest a shortened π–π stacking distance is crucial for high electrical conductivity.12,23 Nevertheless, our measured electrical conductivity indicates that the H2SO4-treated film, with a large PEDOT π–π stacking distance, achieves maximum electrical conductivity due to its short inter-lamellar stacking distance and high degree of crystallinity.
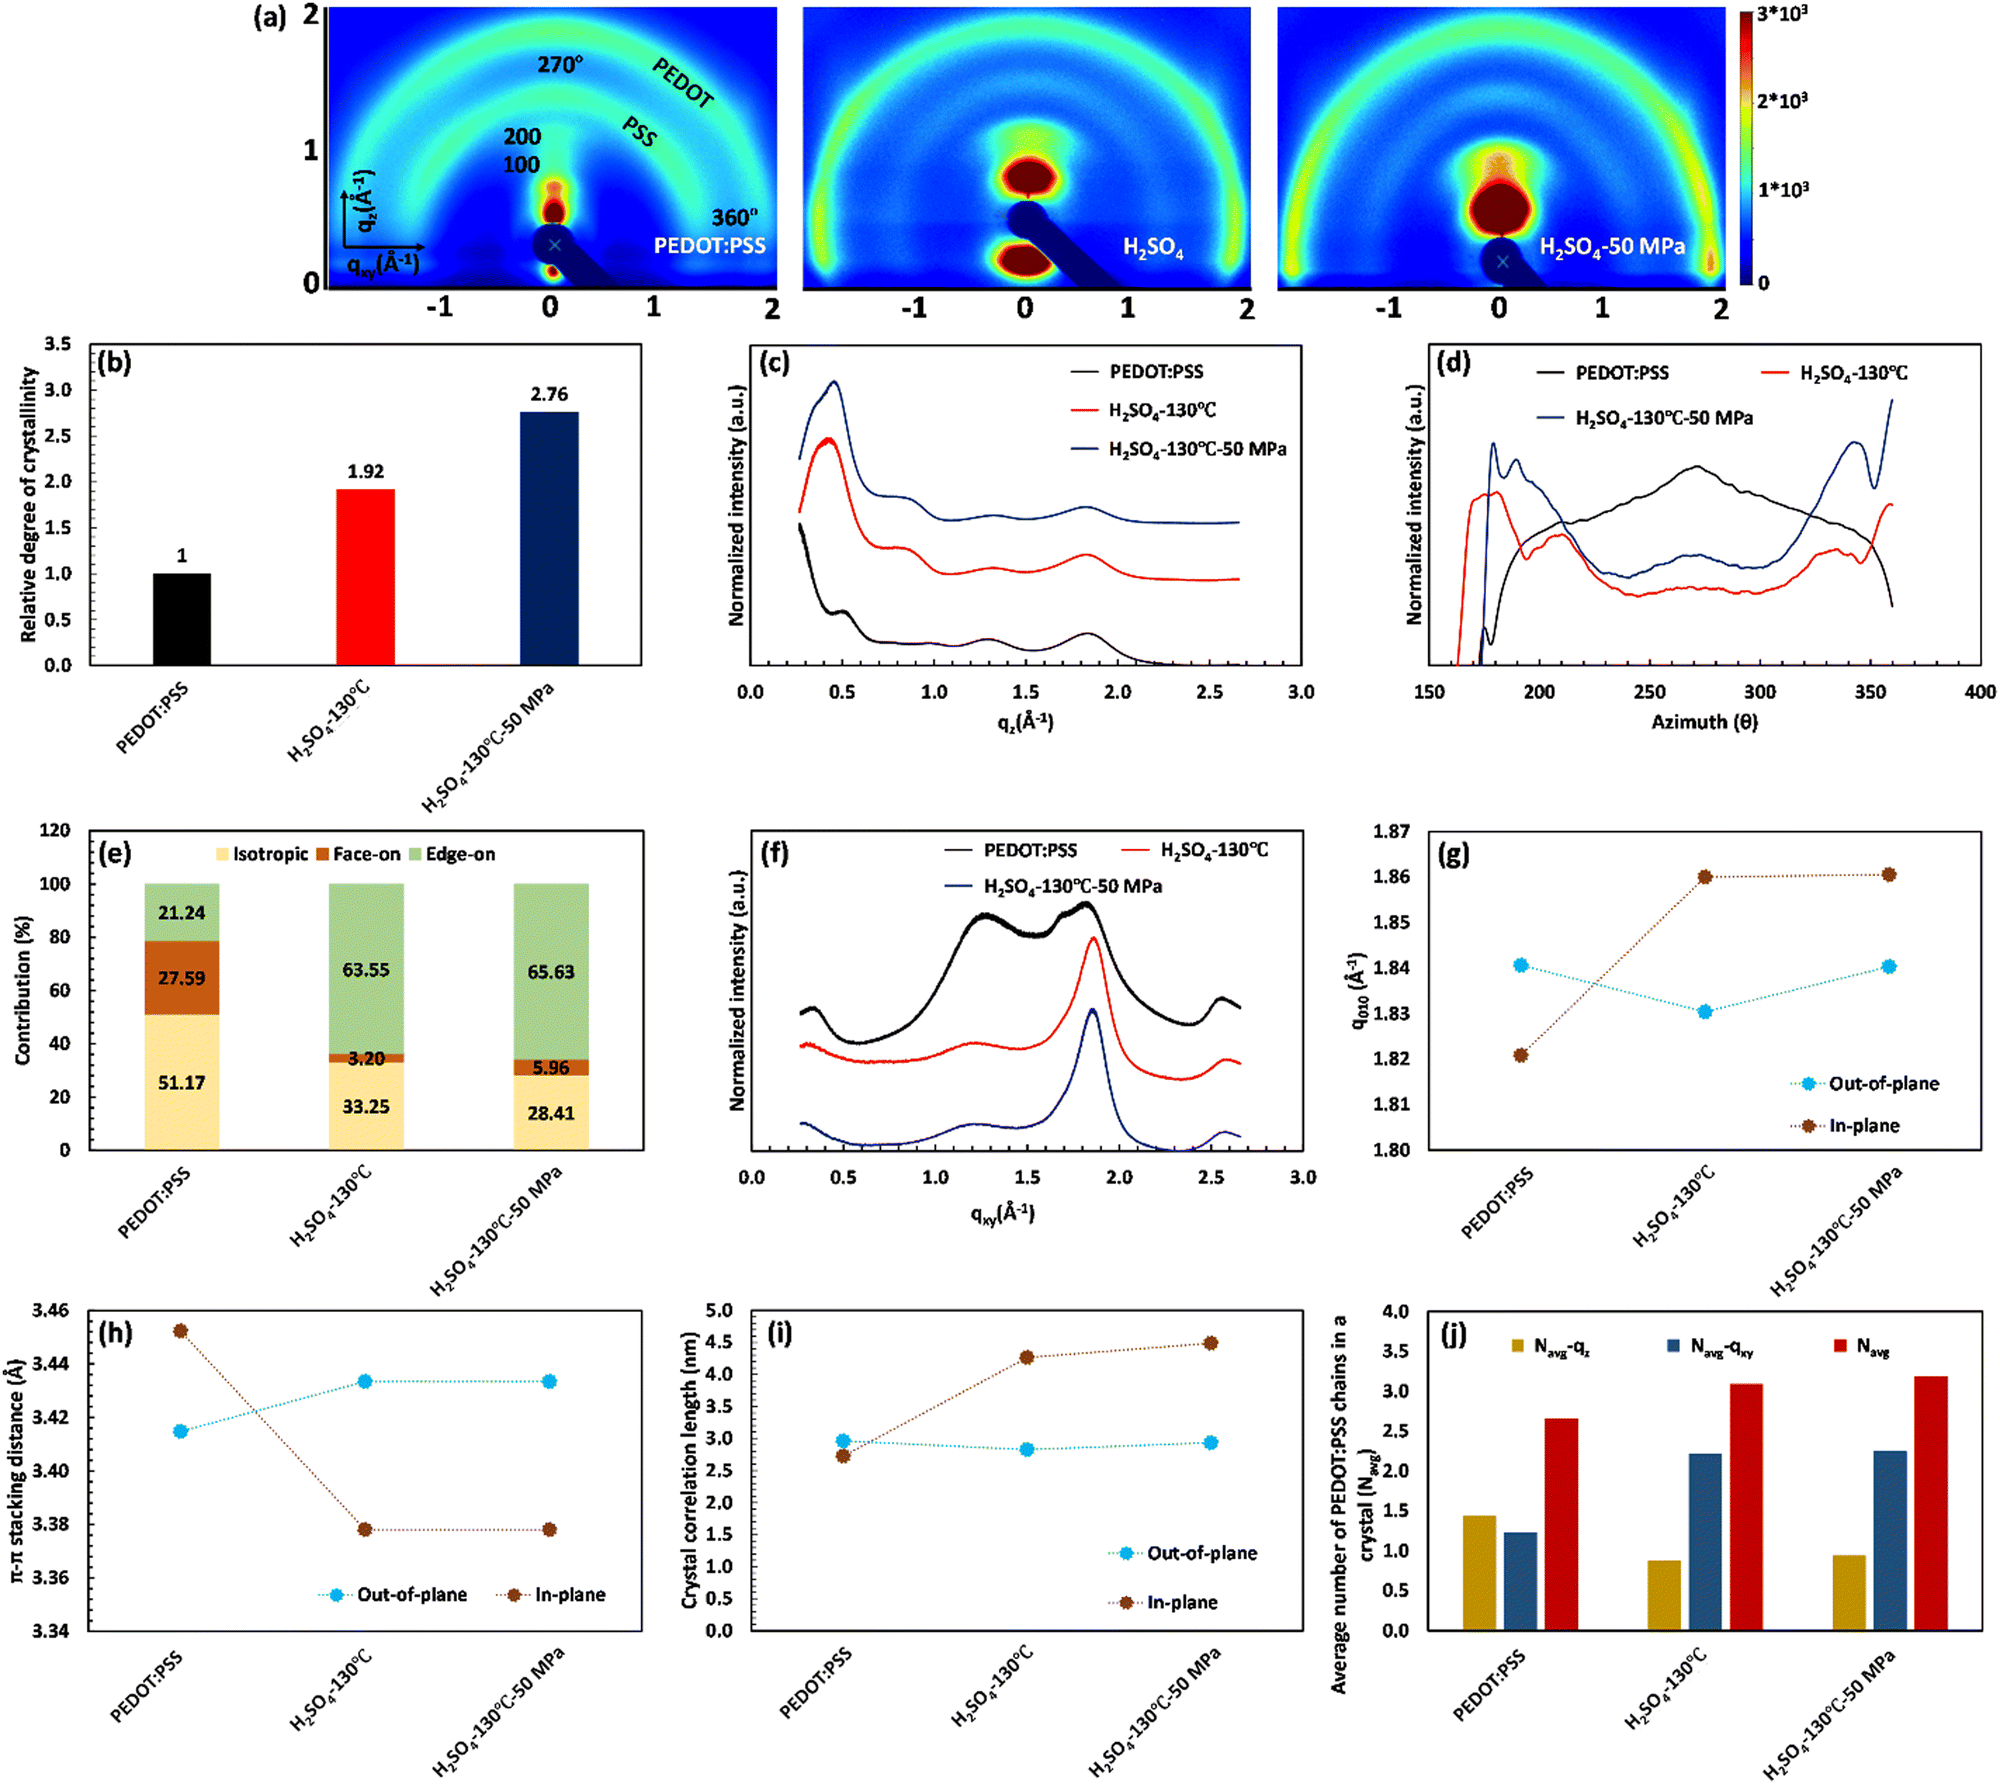
The XRD characterization demonstrates the remarkable importance of PEDOT:PSS crystallinity and inter-lamellar stacking in the significant jump of electrical conductivity. To gain a detailed understanding of the structural changes in PEDOT:PSS after acid treatment, we conducted 2D GIWAXS analysis. Fig. 5(a) presents the results of 2D GIWAXS, clearly depicting the scattering features of the pristine PEDOT:PSS film. The outer ring, located at approximately 1.8 Å−1, represents the π–π stacking of PEDOT molecules (d010), while the inner ring, at around 1.3 Å−1, corresponds to the randomly distributed PSS chains (d001). In the qz direction, a distinct Bragg peak is observed at q ≈ 0.5 Å−1, which can be attributed to lamellar stacking of alternating PEDOT and PSS chains (the 100 reflections).55,60
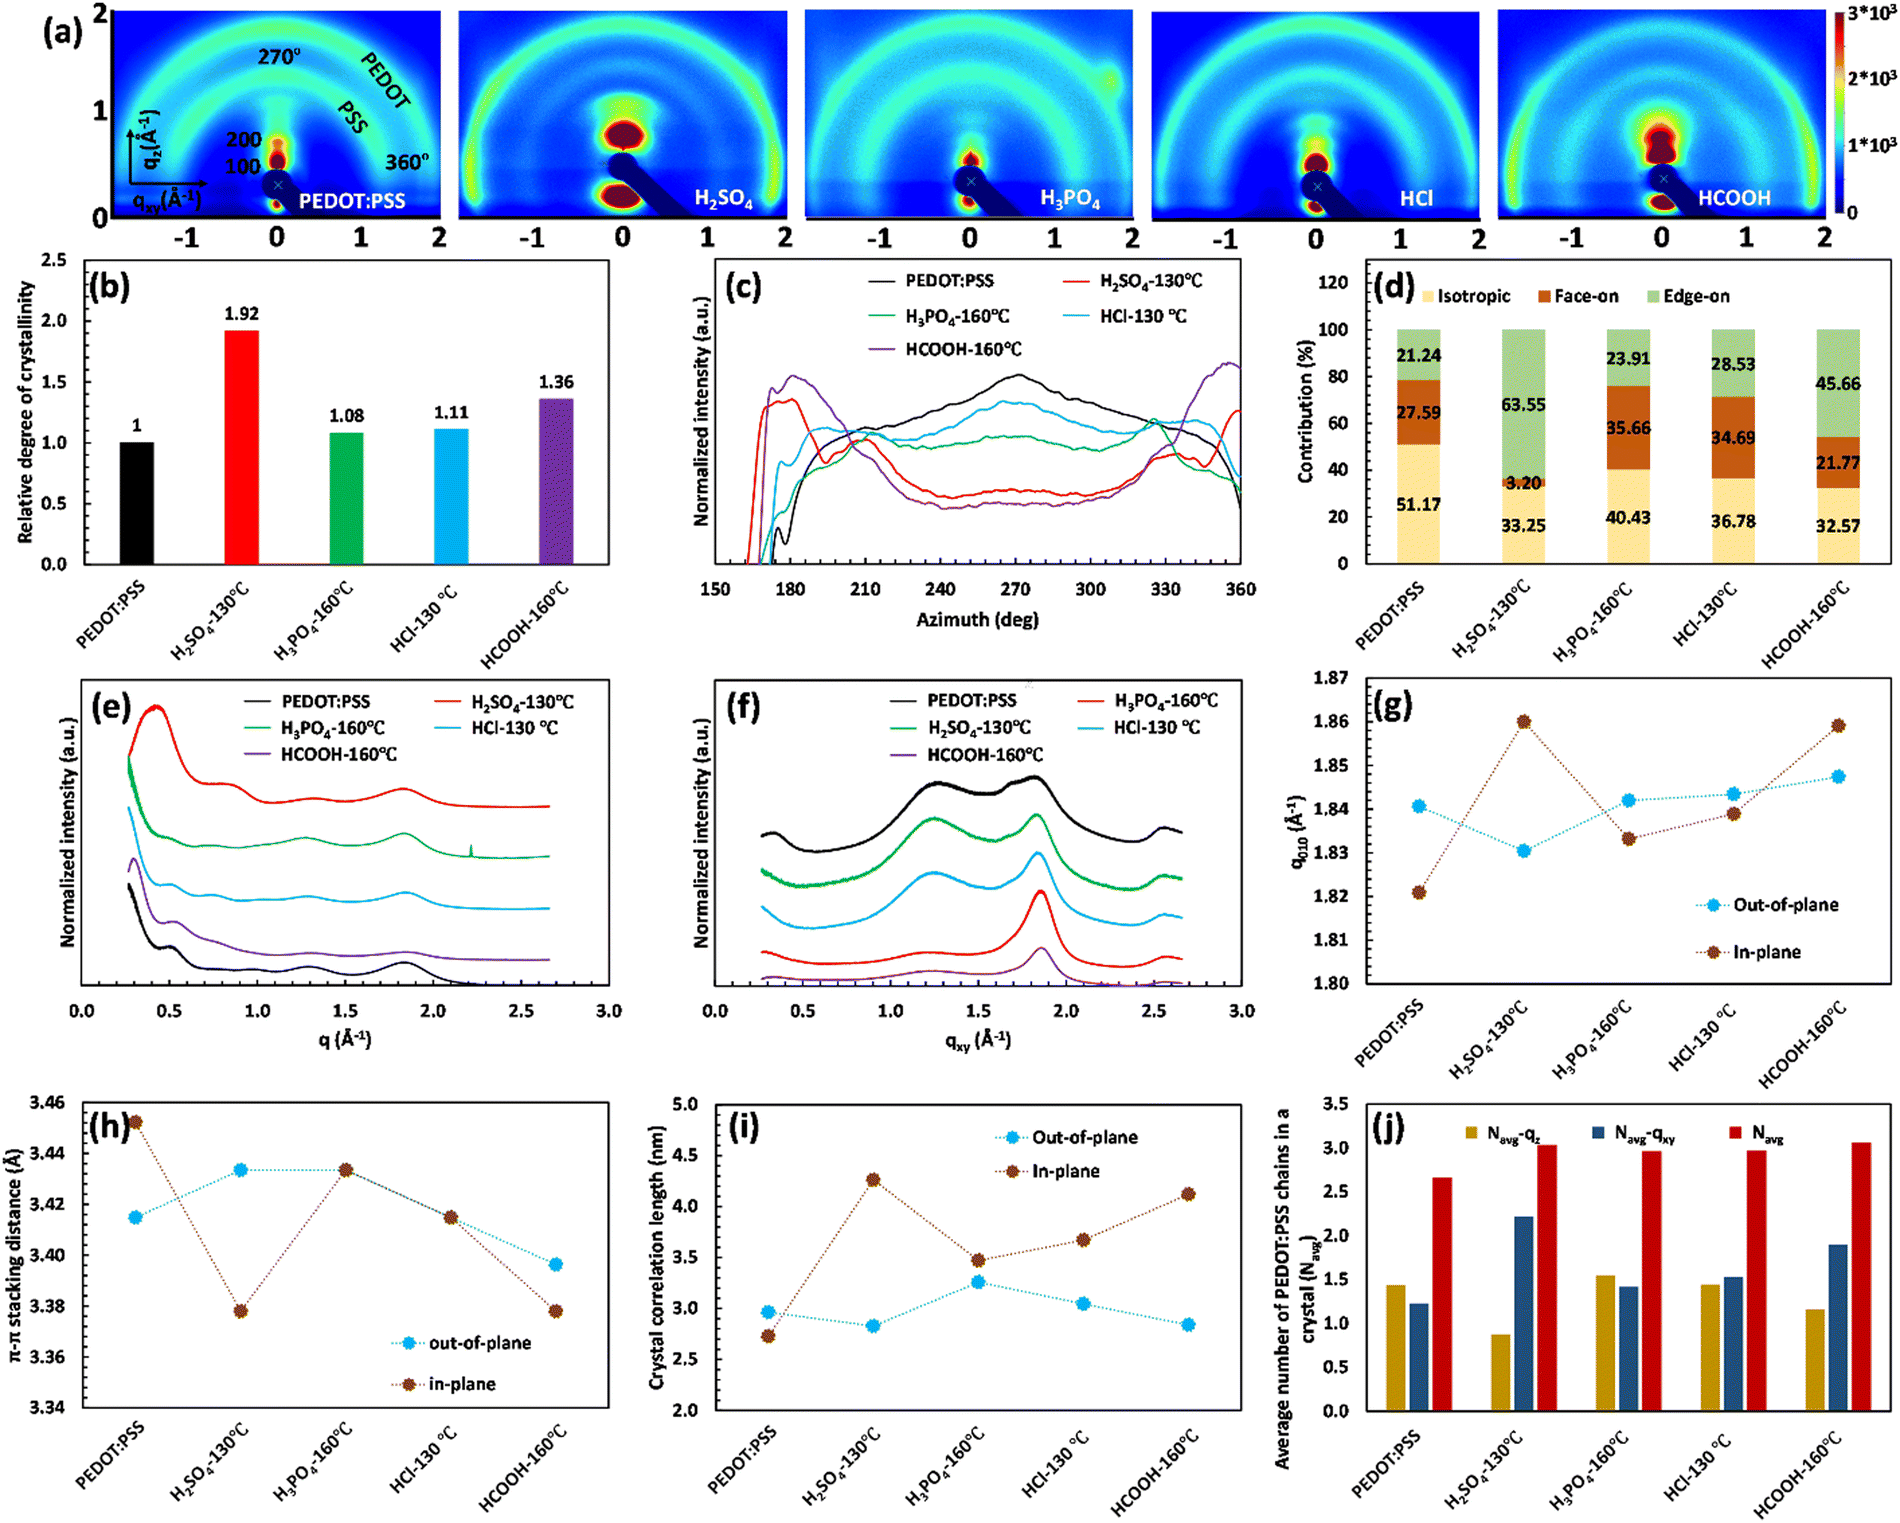 | ||
| Fig. 5 (a) 2D GIWAXS patterns of untreated and treated PEDOT:PSS films. (b) The relative degree of crystallinity of untreated and treated PEDOT:PSS samples. (c) Profile of the PEDOT π–π stacking signal as a function of azimuthal angle. (d) Fraction of the face-on and edge-on content of PEDOT:PSS films before and after acid treatment. (e) and (f) 1D GIWAXS profile along the out-of-plane (qz) and in-plane (qxy) directions, respectively. (g) and (h) d010 peak positions (q value) and its related d-spacing, respectively. (i) and (j) Crystal correlation size and average number of stacked PEDOT, respectively. | ||
Upon acid treatment, significant changes in the crystalline structure of the pristine sample are observed, as reflected in the scattering pattern (Fig. 5(a)). The Bragg peak d100 exhibits a surprisingly high intensity in the H2SO4 and HCOOH-treated samples, indicating a well-developed order of crystallinity, while the treated samples with H3PO4 and HCl show nearly the same level of crystallinity as the pure PEDOT:PSS. It is worth noting that the integrated intensity of the d100 Bragg peak between the azimuthal angles of 270° and 360° can quantify the relative degree of crystallinity (rDoC) as the fraction of crystalline to amorphous regions:61
 | (1) |
Fig. 5(b) clearly demonstrates the substantial increase in the rDoC value for the samples treated with H2SO4 and HCOOH, reaching 1.92 and 1.36, respectively. This confirms the crucial connection between a highly crystalline structure and enhanced electrical conductivity. In contrast, the pristine sample and those treated with H3PO4 and HCl exhibit a rDoC value close to 1. This suggests that the high pKa value of H3PO4 and the high anion softness parameter of HCl hinder their effectiveness in removing the excessive PSS and improving the film crystallinity.
Additionally, the 2D GIWAXS patterns provide evidence for the reduction of intense amorphous PSS signals following acid treatment, further supporting the correlation between PSS removal and increased electrical conductivity. Notably, in the sample treated with H2SO4, the thick ring of non-oriented PSS nearly disappeared, confirming the significant reduction in the film thickness due to the considerable PSS removal. Meanwhile, the amorphous PSS ring remains almost unchanged in the treated samples with H3PO4 and HCl. More importantly, the acid treatment induces a drastic change in the orientation of PEDOT π–π stacking (see Fig. 5(a)). In the pristine sample and those treated with H3PO4 and HCl, the profile of PEDOT π–π stacking exhibits a relatively uniform intensity across the range of 270° to 360°, indicating the uniform distribution of the non-oriented PEDOT chains. However, in the case of H2SO4 and HCOOH treatment, the preferred orientation of PEDOT π–π stacking shifts to the edge-on direction, which is favorable for fast charge transport and high electrical conductivity (see Scheme 1). This fact is evidenced by the significantly higher scattering intensity of PEDOT molecules in the horizontal directions (azimuthal angles 180° to 210° and 330° to 360° in Fig. 5(a)).62
To gain more detailed information about the PEDOT packing orientation of each sample, the PEDOT π–π stacking profile is plotted against the azimuthal angle (Fig. 5(c)). Integrating the PEDOT π–π stacking profile area within the range of 180° to 210° and 240° to 270° provides the relative content of face-on and edge-on crystallites, respectively.63 According to Fig. 5(d), the fraction of face-on and edge-on crystallites is 27.59% and 21.24%, respectively, in the pristine film. Similarly, the treated films with H3PO4 and HCl provide an isotropic distribution of PEDOT chains along the face-on and edge-on directions. However, in the case of H2SO4 and HCOOH treatments, 63.55% and 45.66% of PEDOT chains, respectively, align along the edge-on direction, representing a significant increase in charge carrier capacity.
For further consideration of lamellar stacking and π–π stacking behavior of the treated films, the line cuts along the vertical quasi out-of-plane (qz, 355°–360°) and the horizontal in-plane (qxy, 265°–270°) direction are plotted in Fig. 5(e) and (f), respectively. In Fig. 5(e), the lamellar stacking behavior of PEDOT:PSS is observed in the out-of-plane direction (qz), which undergoes significant changes in peak intensity and q-spacing after acid treatment. The 1D GIWAX profiles of all treated samples exhibit a distinct Bragg peak d100, accompanied by the second-order lamellar stacking d200. This observation highlights the remarkable improvement in the crystalline structure of these samples.19 However, treatment with H2SO4 resulted in an significant increase in the Bragg peak d100 intensity, concomitant with a notable redshift from qz = 0.5 Å−1 (12.57 Å) to qz = 0.43 Å−1 (14.61 Å). This peak shift indicates that the H2SO4-treated sample favors a specific alternating lamellar stacking distance, achieving maximum crystallinity. In this case, the second order of lamellar stacking can reach a minimum value of 7.39 Å compared to all samples (Table S7, ESI†). Therefore, the H2SO4 treatment provides the most compact lateral stacking structure, potentially enhancing charge transport in the 100 directions between different PEDOT-rich domains (Table S7, ESI†).
At the same time, the out-of-plane and in-plane profiles visualize the peak shift of d010 along the qz and qyx directions after different acid treatments (Fig. 5(e)–(g)). The corresponding d-spacing is simultaneously calculated from the d010 peak position (q-value) and plotted in Fig. 5(h). Compared to the untreated film, the PEDOT π–π stacking distance for the HCl-treated sample remains constant (≈3.41 Å) in both the directions of face-on and edge-on, while this value increases to 3.43 Å for the treated film with H3PO4 in both directions. In the case of H2SO4 treatment, d-spacing between PEDOT molecules varied differently along the face-on and edge-on directions. In the face-on direction, the π–π stacking distance reaches 3.43 Å, whereas it decreases to a minimum value of 3.38 Å in the edge-on direction (Tables S7 and S8, ESI†). These observations do not align with the literature, suggesting that a reduced PEDOT π–π stacking distance directly enhances electrical conductivity. PEDOT π–π stacking (d010) can only increase the electrical conductivity if it facilitates the formation of an aligned PEDOT-rich domain with a high degree of crystallinity (d100). Such a phenomenon comes from a compact PEDOT crystallite structure in the appropriate orientation.
A compact PEDOT crystallite structure includes a well-ordered group of PEDOT chains with enhanced interchain interaction that can be quantified using the crystal correlation length (CCL) and the average number of packed PEDOT molecules in the nanocrystal (Nave). The CCL represents the crystallite size of PEDOT molecules calculated from the FWHM of the PEDOT π–π stacking peak ( ) along both the face-on and edge-on directions (Fig. 5(i)).63 Simultaneously, Nave comes from the CCL and π–π stacking distance (Fig. 5(j), and more detailed information is given in the ESI†).23 In the pristine film, CCL is 2.96 and 2.73 nm in the qz and qyx directions, respectively, and the average number of packed PEDOT molecules in both directions is 1.43 and 1.25, respectively. Similarly, the H3PO4 and HCl-treated films present almost the same CCL and Nave values in both the out-of-plane and in-plane directions. By considering the relative degree of crystallinity and the relative content of face-on and edge-on crystallites, these two treatment methods fail to provide a rich domain of stacked PEDOT molecules for efficient charge transport. In contrast, in the H2SO4-treated film, the high value of Nave–qxy (2.22) confirms that 63.55% of PEDOT chains provide a super-aligned structure with an approximate size of 4.26 nm along the edge-on direction. Hence, the high electrical conductivity of the H2SO4-treated film originates from the highly crystalline and fibrillar structure of PEDOT lamella located in the closest inter-lamellar stacking distance along the edge-on direction.
The surface morphology of free-standing PEDOT:PSS films was assessed before and after acid treatments using FESEM images and surface roughness analysis to provide further evidence of phase separation and structural changes (as shown in Fig. 6(a)–(e) and Fig. S6, ESI†). As depicted in Fig. 6(a), the surface of pristine PEDOT:PSS appeared relatively uniform and smooth, with an average surface roughness (Ra) of less than 18 nm. However, the post-treatment with H2SO4 caused a significant increase in Ra to over 100 nm, indicating the formation of a fibrillar structure due to PSS removal (as depicted in Fig. 6(b) and (f)). In this case, a complete phase separation process results in removing insulating PSS layers and forming an elongated structure with a highly interconnected network. This creates a robust conduction pathway that enables efficient charge transport and enhances the conductivity of free-standing films. For the other acid-treated samples, HCOOH, H3PO4, and HCl, the Ra values were approximately 65, 38, and 28 nm, respectively (Fig. 6(f)), indicating a lesser degree of phase separation compared to the H2SO4-treated sample. The results from surface roughness analysis and GIWAX characterization demonstrate a clear correlation between the degree of crystallinity and the change in the average surface roughness. Specifically, an increase in the intensity of the d100 peak corresponds to higher surface roughness and more pronounced phase separation.
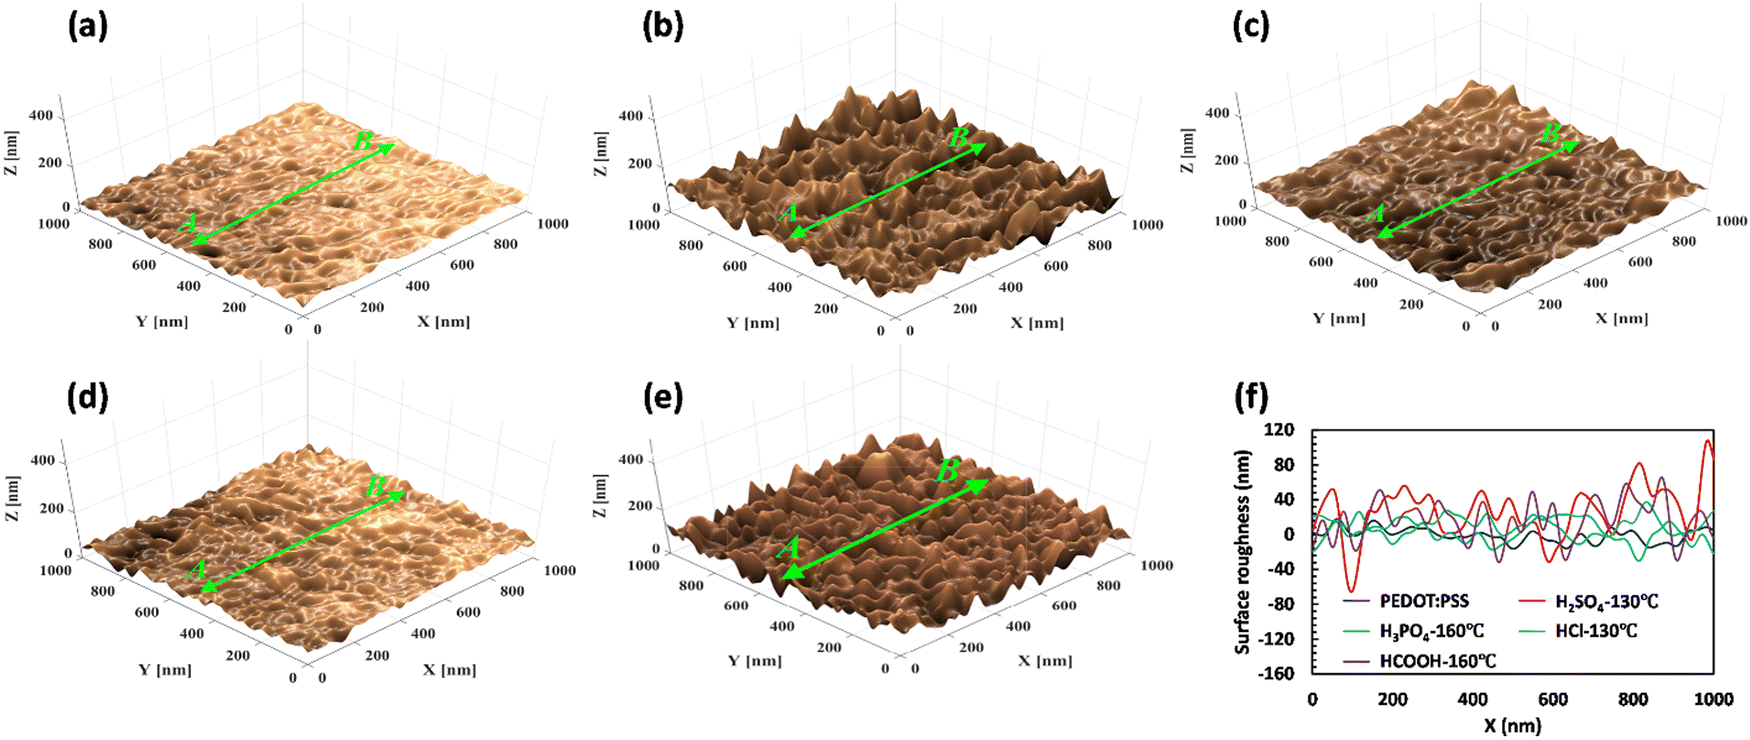 | ||
| Fig. 6 Surface topography of the (a) pristine, (b) H2SO4, (c) H3PO4, (d) HCl, and (e) HCOOH-treated PEDOT:PSS films. (f) Roughness profile of PEDOT:PSS films before and after acid treatment along the AB line at the optimum annealing temperature. | ||
3.2. Coupling acid treatment and hot-pressing
This section investigates the impact of hot-pressing on the electrical conductivity of the free-standing acid-treated PEDOT:PSS films. For this aim, the H2SO4 post-treated film with a record high electrical conductivity of 1885 S cm−1 at 130 °C (temperature with the highest electrical conductivity) is selected for further analysis. The results, presented in Fig. 7(a)–(g), showcase the thickness and conductivity of H2SO4-treated films under different pressures (10, 20, 30, 50, and 70 MPa) at 130 °C. As evidenced, the hot-pressing process significantly enhanced the electrical conductivity of free-standing films, reaching a maximum of 3360 S cm−1 at a pressure of 50 MPa. This phenomenon was accompanied by a decrease in film thickness from 6.60 to 4.66 μm. However, further increasing the compressive pressure did not yield a proportional increase in electrical conductivity. As illustrated in Fig. 7(g), despite reducing the film thickness to 4.30 μm at 70 MPa, the electrical conductivity of H2SO4-treated films declined to 2128.45 S cm−1 (compared with 50 MPa). These observations imply that an excessive increase in compressive pressure could potentially damage the PEDOT:PSS structure, leading to decreased electrical conductivity.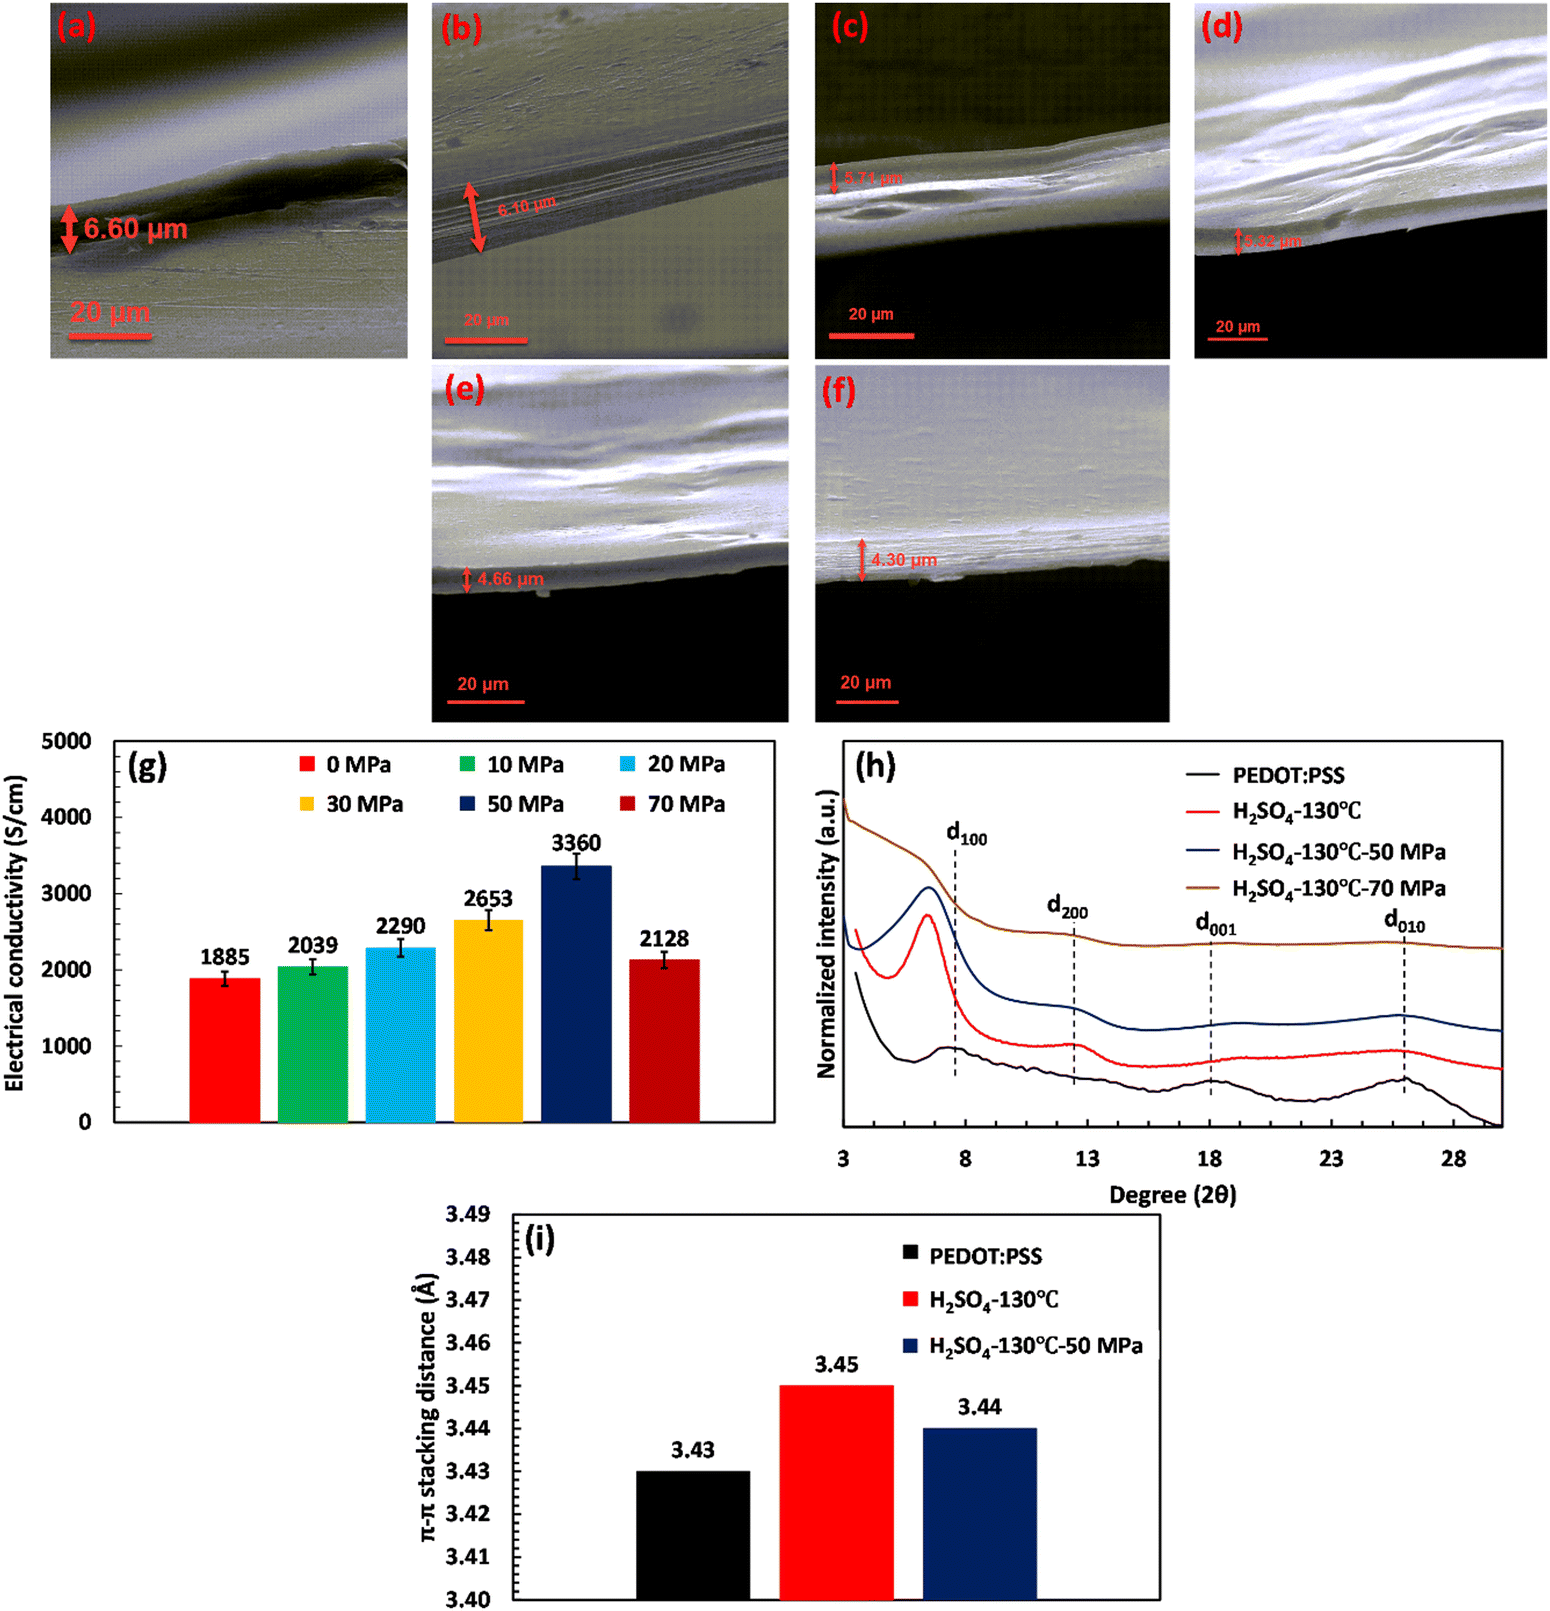 | ||
| Fig. 7 Cross-sectional FESEM images of the H2SO4 treated samples: (a) before and after hot-pressing at (b) 10, (c) 20, (d) 30, (e) 50, and (f) 70 MPa. (g) Electrical conductivity of PEDOT:PSS treated with H2SO4 after the hot-pressing process. A comparison between the crystalline structure of the H2SO4-treated and hot-pressed samples: (h) XRD patterns and (i) π–π stacking distance of the PEDOT thiophene ring (d010). | ||
The X-ray diffraction analysis depicts the impact of the hot-pressing process on the crystalline behavior of PEDOT:PSS. As shown in Fig. 7(h), applying a compressive pressure of 70 MPa notably broadens the Bragg peaks of d100 and d200, signifying the structural collapse of PEDOT:PSS. This collapse involves the disruption of the well-ordered arrangement of stacked PEDOT lamella, leading to a restriction in charge transport between different PEDOT-rich domains in the d100 direction. In contrast, under a compressive pressure of 50 MPa, the crystalline structure of PEDOT:PSS underwent enhancement. The alternating lamellar stacking distance of PEDOT to PEDOT (d100) and the inter-lamellar stacking distance (d200) decrease by 0.52 Å and 0.11 Å, respectively, as depicted in Fig. 7(h). Thus, the optimal compressive pressure of 50 MPa results in a compact structure of PEDOT lamella, significantly improving conductivity by shortening inter-lamellar charge hopping. Furthermore, the slight variation in the π–π stacking (d010) distance upon hot-pressing underscores the crucial role of crystallinity and inter-lamellar stacking in enhancing electrical conductivity (see Fig. 7(i)).
The GIWAXS characterization also demonstrates the key role of crystallinity and inter-lamellar stacking in electrical conductivity improvement after hot-pressing. In the 2D pattern of GIWAXS, the degree of crystallinity is the only factor considerably improved after increasing the applied pressure (Fig. 8(a)). According to Fig. 8(b), the relative degree of crystallinity increased from 1.92 to 2.76, due to the peak shift in the first and second-order Bragg diffraction (the 100 and 200 reflections, respectively) of PEDOT nanocrystals. In the out-of-plane profile, the blue shifts in the Bragg peaks of d100 and d200 are reported as q ≈ 0.3 Å−1 and q ≈ 0.2 Å−1, respectively, indicating a 1.95 Å and 0.18 Å reduction in the first and second order of inter-lamellar stacking, respectively (Fig. 8(c)). Fig. 8(d) and (e) also reveal that the hot-pressing process is accompanied by a tiny increment in the edge-on content (≈3%) of PEDOT grains that would be helpful in the enhancement of film alignment and crystallinity. Notably, the hot-pressing process did not change the PEDOT π–π stacking distance in both directions of qz and qyx (Fig. 8(f)–(h)). However, it results in a 0.34 nm increase in the PEDOT crystallite size along the edge-on direction by reducing the FWHM of the PEDOT π–π stacking peak (Fig. 8(i)). Increasing the PEDOT crystallite size and edge-on content leads to a slight increase in the average number of packed PEDOT molecules (≈0.1) in the qz direction (Fig. 8(j)). Therefore, the significant enhancement in crystallinity and electrical conductivity of the hot-pressed film comes from a remarkable decrease in the inter-lamellar stacking distance and a tiny improvement in the crystallite size and alignment of PEDOT molecules. Ultimately, this conveys that a highly conductive structure is achieved when a super-aligned PEDOT chain network provides a highly crystalline structure with the shortened inter-lamellar stacking distance along the edge-on direction.
 | ||
| Fig. 8 (a) 2D GIWAXS pattern and (b) The relative degree of crystallinity of H2SO4-treated PEDOT:PSS samples before and after the hot-pressing process. (c) 1D GIWAXS profile along the out-of-plane (qz). (d) Profile of the PEDOT π–π stacking signal as a function of azimuthal angle. (e) The fraction of the face-on and edge-on content of PEDOT:PSS films before and after hot-pressing. (f) 1D GIWAXS profile along the in-plane (qxy) directions. (g) and (h) d010 peak position (q value) and its related d-spacing, respectively. (i) and (j) Crystal correlation size and average number of stacked PEDOT, respectively. | ||
3.3. Application of acid-treated PEDOT:PSS films in EMI shielding
The EMI shielding characteristics of the optimized micrometer thick H2SO4-treated PEDOT:PSS film before and after hot-pressing are evaluated to express their safeguarding property against hazardous EM waves. Fig. 9(a) and (b) and Fig. S7–S9 (ESI†) depict the shielding characteristic of H2SO4-treated PEDOT:PSS films. As illustrated in part (a), owing to the excellent electrical conductivity of micrometer thick PEDOT:PSS films (1885–3359 S cm−1), they showcased reflection dominant characteristics with R coefficients ranging from 0.96 to 0.98. The driving force of such reflection dominant characteristics is the high electrical conductivity of shields, which leads to a significant decrease in impedance, resulting in impedance mismatching between the conductive polymeric shield and free space (377 Ω).8 A considerable difference between the impedance of the shield and free space prevents the propagation of the EM waves into the shield, causing a scattered field as reflection owing to the enforced oscillation of free charge carriers on the shield's surface.5,64–66 This mechanism chiefly depends on the electrical conductivity of the shield.66,67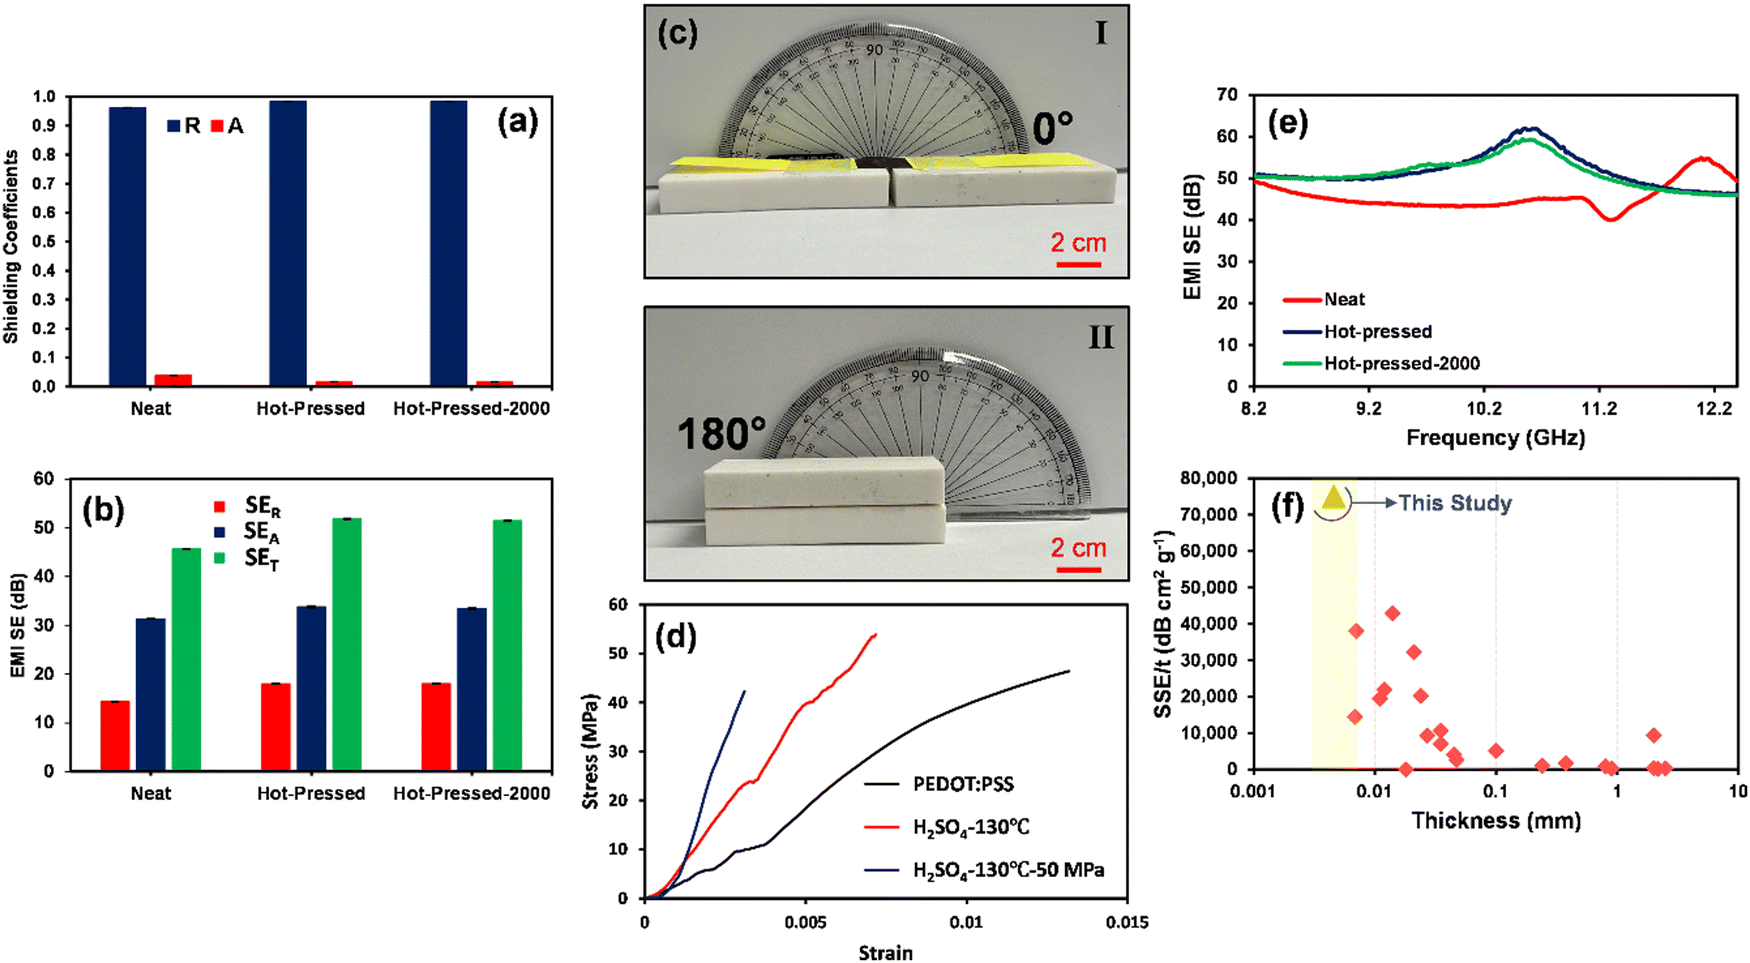 | ||
| Fig. 9 The shielding parameters of the neat and hot-pressed H2SO4-treated PEDOT:PSS micrometer thick films before and after 2000 bending cycles (hot-pressed-2000), including (a) shielding coefficients and (b) EMI shielding parameters. (c) The cyclic bending test of the micrometer thick PEDOT:PSS film at (I) 0° and (II) 180°. (d) Stress–strain behavior of the PEDOT:PSS film after H2SO4 treatment and hot-pressing process under the tensile loading. (e) The SET, SEA, and SER of samples over the X-band frequency range (8.2–12.4 GHz). (f) SSE/t of H2SO4-treated hot-pressed PEDOT:PSS micrometer thick films compared with previous practices. | ||
Fig. 9(b) shows that the 6.60 μm thick H2SO4-treated PEDOT:PSS film before hot-pressing had a SET value of 45.63 dB, whereas the same film showed a SET value of 51.79 dB at a reduced thickness of 4.66 μm after hot-pressing, due to the increased electrical conductivity of the final product. It is noteworthy that even after 2000 bending cycles (as depicted in Fig. 9(c) and (e) and Fig. S7–S9, ESI†), the shield maintained its SET with minimal changes (51.44 dB), demonstrating the robustness and integrity of the free-standing micrometer PEDOT:PSS films. This high bending strength represents the high deformability and high strength of the treated film against the second and third modes of crack propagation, which results in the high tensile strength as reported in the tensile strength test (σt = 42 MPa, Fig. 9(d)). These robust mechanical properties of PEDOT:PSS films after H2SO4 acid treatment and hot-pressing are also shown in the ESI,† Movie 1. In contrast, the uniaxial tensile strength test exhibits the brittle failure behavior of the pristine PEDOT:PSS film due to its inherent structure. This brittleness increases after treatment with H2SO4 since a considerable portion of long PSS chains was removed from the system. Moreover, the hot-pressing process can encourage this brittleness by inducing defects in film structure, which results in stress concentration.
Surprisingly, the free-standing 4.6 μm thick H2SO4-treated PEDOT:PSS film demonstrated a remarkable specific shielding effectiveness (SSE/t) of 75,057.97 dB cm2 g−1. Such a high SSE/t unveils the superior shielding performance of the micrometer-thick PEDOT:PSS films that hold a new record compared with previous practices and are even found to be superior to reflection dominant neat Ti3C2Tx films (Fig. 9(f) and Table S10, ESI†).
4. Conclusions
In summary, this study aimed to comprehensively evaluate the mechanism of acid treatment in improving the electrical conductivity of PEDOT:PSS. Four acids, i.e., H2SO4, H3PO4, HCl, and HCOOH, were used, and the results showed that the H2SO4 treatment had the greatest effect, increasing the electrical conductivity to a maximum value of 1885 S cm−1. Additionally, a hot-pressing method increased the electrical conductivity to 3360 S cm−1. All the evidence suggests that acid treatment improves the electrical conductivity of PEDOT:PSS by creating a fibrillar structure and removing a significant amount of PSS chains, leading to a modified crystalline structure of PEDOT:PSS. The enhanced crystalline structure (d100) is primarily attributed to forming a rich domain of super-aligned PEDOT lamella positioned in the closest in the inter-lamellar stacking distance (d200) along the edge-on direction. Additionally, reducing the PEDOT π–π stacking distance (d010) can also contribute to the enhancement of crystallinity by forming a highly dense and well-ordered groups of PEDOT chains with enhanced interchain interaction. Furthermore, the acid-treated PEDOT:PSS films showcased excellent EMI shielding effectiveness and superior specific EMI shielding effectiveness, reaching 51.79 dB and 75.057.97 dB cm2 g−1 at a thickness of 4.66 μm in the case of H2SO4 treatment coupled with hot-pressing. Additionally, these exceptional characteristics remain stable even after undergoing 2000 bending cycles, underscoring the high flexibility and tensile strength (42 MPa) of the treated films. As a result, the acid-treated PEDOT:PSS films demonstrate robust mechanical properties, rendering them suitable for a wide range of commercial and military applications requiring EMI shielding.Conflicts of interest
There are no conflicts to declare.Acknowledgements
The authors acknowledge the Syilx Okanagan Nation for the use of their traditional, ancestral, and unceded territory, the land on which the research was conducted. The authors acknowledge the support of the Natural Sciences and Engineering Research Council of Canada (NSERC) [funding reference number ALLRP 555586-20]. Dr Arjmand appreciates the financial support provided by the University of British Columbia (UBC), the Canada Research Chairs Program (CRC-2018-00234), and Zentek Ltd. The Canadian Light Source (CLS), which is supported by the Canada Foundation for Innovation, NSERC, the University of Saskatchewan, the Government of Saskatchewan, Western Economic Diversification Canada, the National Research Council Canada, and the Canadian Institutes of Health Research, is acknowledged. CLS technical support from Dr. Adam Leontowich is gratefully acknowledged (BXDS beamline) for GIWAXS experiment. The Saskatchewan Structural Sciences Center (SSSC) is acknowledged for providing facilities to analyze the XPS characteristics of the samples.References
- Y. Wen and J. Xu, J. Polym. Sci., Part A: Polym. Chem., 2017, 55, 1121–1150 CrossRef CAS.
- S. Tu, T. Tian, A. L. Oechsle, S. Yin, X. Jiang, W. Cao, N. Li, M. A. Scheel, L. K. Reb and S. Hou, Chem. Eng. J., 2022, 429, 132295 CrossRef CAS.
- M. N. Gueye, A. Carella, J. Faure-Vincent, R. Demadrille and J.-P. Simonato, Prog. Mater. Sci., 2020, 108, 100616 CrossRef CAS.
- A. Ghaffarkhah, M. Kamkar, Z. A. Dijvejin, H. Riazi, S. Ghaderi, K. Golovin, M. Soroush and M. Arjmand, Carbon, 2022, 191, 277–289 CrossRef CAS.
- M. Kamkar, A. Ghaffarkhah, E. Hosseini, M. Amini, S. Ghaderi and M. Arjmand, New J. Chem., 2021, 45, 21488–21507 RSC.
- Y.-C. Chin, M. Daboczi, C. Henderson, J. Luke and J.-S. Kim, ACS Energy Lett., 2022, 7, 560–568 CrossRef CAS.
- H. Huang, Y. Zhao, T. Cong, C. Li, N. Wen, X. Zuo, Y. Guo, H. Zhang, Z. Fan and L. Pan, Adv. Funct. Mater., 2022, 2110777 CrossRef CAS.
- S. A. Hashemi, A. Ghaffarkhah, E. Hosseini, S. Bahrani, P. Najmi, N. Omidifar, S. M. Mousavi, M. Amini, M. Ghaedi and S. Ramakrishna, Matter, 2022, 5, 3807–3868 CrossRef CAS.
- X. Wu, M. Stephen, T. C. Hidalgo, T. Salim, J. Surgailis, A. Surendran, X. Su, T. Li, S. Inal and W. L. Leong, Adv. Funct. Mater., 2022, 32, 2108510 CrossRef CAS.
- W. Zhang, J. Weng, Y. Xie, X. Li, D. Ren and R. Li, J. Text. Inst., 2023, 114, 101–109 CrossRef CAS.
- L. Bießmann, N. Saxena, N. Hohn, M. A. Hossain, J. G. Veinot and P. Müller-Buschbaum, Adv. Electron. Mater., 2019, 5, 1800654 CrossRef.
- E. Hosseini, V. O. Kollath and K. Karan, J. Mater. Chem. C, 2020, 8, 3982–3990 RSC.
- K. Itoh, Y. Kato, Y. Honma, H. Masunaga, A. Fujiwara, S. Iguchi and T. Sasaki, J. Phys. Chem. C, 2019, 123, 13467–13471 CrossRef CAS.
- S. Khasim, A. Pasha, M. Lakshmi, P. Chellasamy, M. Kadarkarai, A. Darwish, T. A. Hamdalla, S. Al-Ghamdi and S. Alfadhli, Opt. Mater., 2022, 125, 112109 CrossRef CAS.
- C. Greco, A. Melnyk, K. Kremer, D. Andrienko and K. C. Daoulas, Macromolecules, 2019, 52, 968–981 CrossRef CAS PubMed.
- Z. Zhu, C. Liu, F. Jiang, J. Xu and E. Liu, Synth. Met., 2017, 225, 31–40 CrossRef CAS.
- Y. H. Kim, C. Sachse, M. L. Machala, C. May, L. Müller-Meskamp and K. Leo, Adv. Funct. Mater., 2011, 21, 1076–1081 CrossRef CAS.
- M. Vosgueritchian, D. J. Lipomi and Z. Bao, Adv. Funct. Mater., 2012, 22, 421–428 CrossRef CAS.
- N. Kim, S. Kee, S. H. Lee, B. H. Lee, Y. H. Kahng, Y.-R. Jo, B.-J. Kim and K. Lee, Adv. Mater., 2014, 26, 2268–2272 CrossRef CAS PubMed.
- W. Liu, Z. Lei, R. Yang, W. Xing, P. Tao, W. Shang, B. Fu, C. Song and T. Deng, ACS Appl. Mater. Interfaces, 2022, 14, 10605–10615 CrossRef CAS PubMed.
- C. Yeon, S. J. Yun, J. Kim and J. W. Lim, Adv. Electron. Mater., 2015, 1, 1500121 CrossRef.
- C. M. Palumbiny, F. Liu, T. P. Russell, A. Hexemer, C. Wang and P. Müller-Buschbaum, Adv. Mater., 2015, 27, 3391–3397 CrossRef CAS PubMed.
- J. Dong and G. Portale, Adv. Mater. Interfaces, 2020, 7, 2000641 CrossRef CAS.
- E. Hosseini, M. Arjmand, U. Sundararaj and K. Karan, ACS Appl. Mater. Interfaces, 2020, 12, 28596–28606 CrossRef CAS PubMed.
- D. A. Mengistie, C.-H. Chen, K. M. Boopathi, F. W. Pranoto, L.-J. Li and C.-W. Chu, ACS Appl. Mater. Interfaces, 2015, 7, 94–100 CrossRef CAS PubMed.
- S. Xu, M. Hong, X.-L. Shi, Y. Wang, L. Ge, Y. Bai, L. Wang, M. Dargusch, J. Zou and Z.-G. Chen, Chem. Mater., 2019, 31, 5238–5244 CrossRef CAS.
- V. F. Rad, A. Babaei-Ghazvini, R. Jamali, I. Shahabi-Ghahfarrokhi and A.-R. Moradi, Appl. Opt., 2021, 60, 4706–4715 CrossRef.
- B. H. Toby and R. B. Von Dreele, J. Appl. Crystallogr., 2013, 46, 544–549 CrossRef CAS.
- H. Shi, C. Liu, Q. Jiang and J. Xu, Adv. Electron. Mater., 2015, 1, 1500017 CrossRef.
- L. Zhang, K. Yang, R. Chen, Y. Zhou, S. Chen, Y. Zheng, M. Li, C. Xu, X. Tang and Z. Zang, Adv. Electron. Mater., 2020, 6, 1900648 CrossRef CAS.
- C. Choi, A. De Izarra, I. Han, W. Jeon, Y. Lansac and Y. H. Jang, J. Phys. Chem. B, 2022, 126, 1615–1624 CrossRef CAS PubMed.
- Y. Marcus, Thermochim. Acta, 1986, 104, 389–394 CrossRef CAS.
- Y. Xia and J. Ouyang, Macromolecules, 2009, 42, 4141–4147 CrossRef CAS.
- E. G. Langford, K. D. Shaughnessy, T. C. Devore, D. Lawrence and C. Constantin, MRS Adv., 2016, 1, 465–469 CrossRef CAS.
- Y.-Y. Lee, G. M. Choi, S.-M. Lim, J.-Y. Cho, I.-S. Choi, K. T. Nam and Y.-C. Joo, Sci. Rep., 2016, 6, 1–9 CrossRef.
- Y. Liu, D. Sun, S. Askari, J. Patel, M. Macias-Montero, S. Mitra, R. Zhang, W.-F. Lin, D. Mariotti and P. Maguire, Sci. Rep., 2015, 5, 1–11 Search PubMed.
- S. Mukherjee, R. Singh, S. Gopinathan, S. Murugan, S. Gawali, B. Saha, J. Biswas, S. Lodha and A. Kumar, ACS Appl. Mater. Interfaces, 2014, 6, 17792–17803 CrossRef CAS.
- J. Ram, R. Singh, F. Singh, V. Kumar, V. Chauhan, R. Gupta, U. Kumar, B. Yadav and R. Kumar, J. Mater. Sci.: Mater. Electron., 2019, 30, 13593–13603 CrossRef CAS.
- F. Wu, P. Li, K. Sun, Y. Zhou, W. Chen, J. Fu, M. Li, S. Lu, D. Wei and X. Tang, Adv. Electron. Mater., 2017, 3, 1700047 CrossRef.
- M. T. Z. Myint, M. Hada, H. Inoue, T. Marui, T. Nishikawa, Y. Nishina, S. Ichimura, M. Umeno, A. K. K. Kyaw and Y. Hayashi, RSC Adv., 2018, 8, 36563–36570 RSC.
- T. A. Yemata, Y. Zheng, A. K. K. Kyaw, X. Wang, J. Song, W. S. Chin and J. Xu, Mater. Adv., 2020, 1, 3233–3242 RSC.
- D. Jucius, A. Lazauskas, V. Grigaliūnas, R. Gudaitis, A. Guobienė, I. Prosyčevas, B. Abakevičienė and M. Andrulevičius, Mater. Res., 2019, 22, e20190134 CrossRef.
- S. H. Lee, H. Park, S. Kim, W. Son, I. W. Cheong and J. H. Kim, J. Mater. Chem. A, 2014, 2, 7288–7294 RSC.
- T.-R. Chou, S.-H. Chen, Y.-T. Chiang, T.-T. Chang, C.-W. Lin and C.-Y. Chao, Org. Electron., 2017, 48, 223–229 CrossRef CAS.
- Y. Shi, Y. Zhou, Z. Che, J. Shang, Q. Wang, F. Liu and Y. Zhou, Mater. Lett., 2022, 308, 131106 CrossRef CAS.
- J. E. McCarthy, C. A. Hanley, L. J. Brennan, V. G. Lambertini and Y. K. Gun'ko, J. Mater. Chem. C, 2014, 2, 764–770 RSC.
- J. Ouyang, Q. Xu, C.-W. Chu, Y. Yang, G. Li and J. Shinar, Polymer, 2004, 45, 8443–8450 CrossRef CAS.
- S. Jönsson, J. Birgerson, X. Crispin, G. Greczynski, W. Osikowicz, A. D. Van Der Gon, W. R. Salaneck and M. Fahlman, Synth. Met., 2003, 139, 1–10 CrossRef.
- U. Lang, E. Müller, N. Naujoks and J. Dual, Adv. Funct. Mater., 2009, 19, 1215–1220 CrossRef CAS.
- D. A. Mengistie, M. A. Ibrahem, P.-C. Wang and C.-W. Chu, ACS Appl. Mater. Interfaces, 2014, 6, 2292–2299 CrossRef CAS.
- Z. Fan, P. Li, D. Du and J. Ouyang, Adv. Energy Mater., 2017, 7, 1602116 CrossRef.
- N. Saxena, J. Keilhofer, A. K. Maurya, G. Fortunato, J. Overbeck and P. Müller-Buschbaum, ACS Appl. Energy Mater., 2018, 1, 336–342 CrossRef CAS.
- B. D. Cullity, Elements of X-ray Diffraction, Addison-Wesley Publishing, 1956 Search PubMed.
- N. Kim, S. Lienemann, I. Petsagkourakis, D. Alemu Mengistie, S. Kee, T. Ederth, V. Gueskine, P. Leclère, R. Lazzaroni and X. Crispin, Nat. Commun., 2020, 11, 1424 CrossRef CAS PubMed.
- N. Kim, B. H. Lee, D. Choi, G. Kim, H. Kim, J.-R. Kim, J. Lee, Y. H. Kahng and K. Lee, Phys. Rev. Lett., 2012, 109, 106405 CrossRef PubMed.
- A. Elschner, S. Kirchmeyer, W. Lovenich, U. Merker and K. Reuter, PEDOT: principles and applications of an intrinsically conductive polymer, CRC press, 2010 Search PubMed.
- K. Aasmundtveit, E. Samuelsen, O. Inganäs, L. Pettersson, T. Johansson and S. Ferrer, Synth. Met., 2000, 113, 93–97 CrossRef CAS.
- K. Aasmundtveit, E. Samuelsen, L. Pettersson, O. Inganäs, T. Johansson and R. Feidenhans, Synth. Met., 1999, 101, 561–564 CrossRef CAS.
- R. Noriega, J. Rivnay, K. Vandewal, F. P. Koch, N. Stingelin, P. Smith, M. F. Toney and A. Salleo, Nat. Mater., 2013, 12, 1038–1044 CrossRef CAS PubMed.
- Q. Wei, M. Mukaida, Y. Naitoh and T. Ishida, Adv. Mater., 2013, 25, 2831–2836 CrossRef CAS PubMed.
- J. Rivnay, S. C. Mannsfeld, C. E. Miller, A. Salleo and M. F. Toney, Chem. Rev., 2012, 112, 5488–5519 CrossRef CAS.
- S.-M. Kim, C.-H. Kim, Y. Kim, N. Kim, W.-J. Lee, E.-H. Lee, D. Kim, S. Park, K. Lee and J. Rivnay, Nat. Commun., 2018, 9, 3858 CrossRef.
- E. Dauzon, A. E. Mansour, M. R. Niazi, R. Munir, D.-M. Smilgies, X. Sallenave, C. Plesse, F. Goubard and A. Amassian, ACS Appl. Mater. Interfaces, 2019, 11, 17570–17582 CrossRef CAS PubMed.
- A. Ghaffarkhah, M. Kamkar, H. Riazi, E. Hosseini, Z. A. Dijvejin, K. Golovin, M. Soroush and M. Arjmand, New J. Chem., 2021, 45, 20787–20799 RSC.
- M. Amini, M. Kamkar, F. Rahmani, A. Ghaffarkhah, F. Ahmadijokani and M. Arjmand, ACS Appl. Electron. Mater., 2021, 3, 5514–5527 CrossRef CAS.
- Advanced Materials for Electromagnetic Shielding: Fundamentals, Properties, and Applications, ed. M. Jaroszewski, S. Thomas and A. V. Rane, Wiley, 2018 Search PubMed.
- M. Kamkar, A. Ghaffarkhah, R. Ajdary, Y. Lu, F. Ahmadijokani, S. E. Mhatre, E. Erfanian, U. Sundararaj, M. Arjmand and O. J. Rojas, Small, 2022, 18, 2200220 CrossRef CAS PubMed.
Footnote |
| † Electronic supplementary information (ESI) available. See DOI: https://doi.org/10.1039/d4ma00078a |
| This journal is © The Royal Society of Chemistry 2024 |