DOI:
10.1039/D3MA01149F
(Paper)
Mater. Adv., 2024,
5, 2974-2990
Determination of vitamins K1, K2, B6, and D3 using reduced graphene oxide fabricated using a bismuth nanoparticle embedded polypyrrole nanocomposite based optical sensor
Received
20th December 2023
, Accepted 17th February 2024
First published on 20th February 2024
Abstract
This research reports a simple and selective detection of vitamins K1, K2, B6, and D3 in human blood (serum/plasma) using reduced graphene oxide fabricated using the bismuth nanoparticle embedded polypyrrole nanocomposite (rGO/pPy/Bi NC) as an optical sensing material. The nanocomposite was thoroughly characterized for its functional properties using FTIR and for its morphology using SEM, AFM and TEM. The phase purity of the nanocomposite was studied using XRD diffractometry. SEM, TEM, and AFM studies confirmed the presence of nanoparticles on the polypyrrole covered sheets of rGO. The average crystallite size of GO and rGO/pPY/Bi NC was calculated using three methods using XRD analysis data. The selectivity of rGO/pPy/Bi NC is based on quenching of the optical band produced by the nanocomposite when it comes in contact with the respective vitamin in the corresponding medium. The limits of detection of vitamins K1, K2, B6, and D3 using rGO/pPY/Bi NC were found to be 0.075 ng mL−1, 0.1 ng mL−1, 0.12 ng mL−1, and 0.15 ng mL−1, respectively. However, the limits of quantification were found to be 0.29 ng mL−1, 0.3 ng mL−1, 0.38 ng mL−1, and 0.48 ng mL−1 for vitamins K1, K2, B6, and D3, respectively. The detection of vitamins in human blood (serum/plasma) with rGO/pPY/Bi NC is attributed to the novelty, simplicity, and cost-effectiveness of the sensing material. The pH sensitive rGO/pPy/Bi NC is capable of sensing four different vitamins due to the synergistic effect of rGO, Bi NPs and polypyrrole.
1. Introduction
Vitamins are vital for facilitating and supporting various metabolic processes within the human body.1 The human body cannot produce adequate vitamins; therefore, various vitamin rich foods are recommended to compensate for their deficiency.2,3 The word vitamin is originated from English words “vital” and “amine”. It was introduced by the biochemist Casimir Funk in 1912 during his research on organic food agents in which he demonstrated their crucial role in sustaining life and preventing nutritional diseases.4 Vitamins are broadly categorized as water soluble vitamins and fat soluble vitamins.5,6 Vitamin K1 (phylloquinone; VK1), vitamin K2 (menaquinone; VK2), and vitamin D3 (cholecalciferol; VD3) are fat soluble vitamins. Vitamin B6 (VB6) and vitamin C (ascorbic acid; VC) are water soluble vitamins. The main sources of VK1 are green vegetables and plants, including cabbage, lettuce, and spinach, while the sources of VK2 include fermented soybeans, cheese, egg yolk, liver, and meat.5 Vitamin K (VK) has an important role in blood clotting and bone health.7 VK deficiency can lead to a decrease in the clotting factor protein and prothrombin protein, which in turn leads to uncontrolled bleeding and hemorrhage.8 The food sources of VD3 include fish, cod liver oil, curtained mushrooms, and fortified foods.9 VD3 plays an effective role in the human body by reducing the chance of rickets in children, osteoporosis and osteomalacia in adults, autoimmune diseases, skin cancer, infections, and diseases related to the heart.10,11 In the recent outbreak of COVID-19, immunity has gained significant importance. Various studies have connected vitamin D insufficiency with several respiratory disorders, including COVID-19.12 The sources of VB6 include legumes (peas, lentils), fruits (potatoes, bananas), fish (salmon), nuts (pistachios), chicken breast, and organ meats (beef liver).2 The deficiency of VB6 causes inflammation of the skin, decreases the production of hemoglobin, which causes anemia, and also causes neurological symptoms including confusion, numbness, tingling, and depression.13 The daily adequate intake (AI) of vitamins is recommended by the Food and Nutrition Board of the Institute of Medicine in the United States for maintaining a healthy metabolic system. The recommended AI for VK1 for males is 120 μg per day, and for females, 90 μg per day.14 Similarly, the recommended AI for VD3 is 20 μg per day, and for VB6, the recommended AI for males is 1.5 mg per day, and for females 1.7 mg per day.
The deficiency or excess of these vitamins leads to several health problems. Therefore, it is important to develop the cost effective determination methods for the monitoring of these vitamins in blood. Here, it is noteworthy that current procedures for determination of these vitamins, especially vitamin D, are quite expensive and typically out of the reach of the average person. So, there is an urgent need to develop an optical sensing material that can precisely and smartly determine these vitamins using a UV-vis spectrophotometer.
There are several techniques commonly used for determining vitamin concentration accurately. A few available techniques for quantifying the concentration of vitamins are liquid chromatography (LC), enzyme-linked immuno-sorbent assay (ELSA), fluorescence spectroscopy, voltammetry, resonance Rayleigh scattering,15 and fiber optic sensing techniques. Among them, high performance liquid chromatography (HPLC) is one of the most widely used techniques for quantifying vitamins.16 The numerous HPLC based determination methods for vitamins have been already reported due to their most dominant accuracy.17 However, the main disadvantages of HPLC for such detection are the cost of the chromatography column and the use of a large amount of organic solvents, which make the technique more expensive. Therefore, sensor technologists are keen to develop cost effective sensing methods for vitamins. Among sensing methodologies, electrochemical and optical sensors are most appreciated due to their cost effectiveness, simplicity, robustness and sensitivity.4 Both electrochemical and optical sensing techniques are considered to be highly precise and reliable.18 Various voltammetry and optical methods with improved performance are reported for detection of vitamins in food and biological samples using different nanomaterials. For example, carbon dots and chitosan were used for detection of vitamin D,19 pencil graphite electrodes, silver nanoparticles, and liquid amalgam film have been used for detection of vitamin K1,4 and label free detection was also employed to detect vitamin K because it is a redox active molecule like other quinones.20 Various methods are reported for quantification of vitamin B6 such as those based on the MIP modified carbon fiber paper electrode, nickel zeolite, and nano ZnFe2O4.21 In previously reported methods the electrochemical detection is commonly used for vitamins. However, limited reports are available regarding optical sensing of vitamins.
In this study, we developed a graphene based optical sensor (reduced graphene oxide/polypyrrole decorated bismuth nanocomposite) for the selective detection of vitamins K1, K2, B6, and D3. Graphene, a two dimensional carbon-based material, has been widely used as a supporting substrate for various nanoparticles, including silver (Ag), gold (Au), copper oxide (CuO), iron oxide (Fe3O4), zinc oxide (ZnO), and titanium oxide (TiO2).22,23 Graphene is considered to be a simple material.24 However, the composites of graphene exhibit remarkable characteristics due to their unique structures, outstanding optical properties, exceptional mechanical strength, and electronic and thermal properties, along with a substantial surface area measuring 2630 m2 g−1.25 Graphene oxide (GO) is the best platform for nanoparticles because of the presence of oxygen-containing functional groups on its surface.24,25 Additionally, in the preparation of polymer nanocomposites, the functional groups on the surface of GO form chemical bonds and interact with the polymeric matrix, promoting the strong interfacial interaction between GO and the polymer.
Nanomaterials such as nano-multilayers, nano-thin films, and nanoparticles play a significant role in material sciences.26,27 Bismuth is one of the elements that are frequently employed as nanomaterials for various applications. Bismuth is a metalloid with fascinating unique electronic properties that make it versatile from typical LSPR producing metals nanoparticles; some of these properties are anisotropic Fermi level, high carrier mobility (allowing for efficient charge transport within the material), high magneto resistance effect, low effective mass, and relatively small number of charge carriers per unit volume.4 The spatial arrangement of bismuth atoms is responsible for all these characteristics.28 Due to these properties of GO, polypyrrole, and bismuth NPs, a novel sensing material with a special arrangement of these precursors has been developed that has not been reported yet.
In the present study, the rGO/pPY/Bi nanocomposite was fabricated, characterized, and tested in different electrolytic media for the selective determination of vitamins K1, K2, D3, and B6. Effective determination of all four vitamins is optimized at different pH values. Quantitative determination of vitamin K1, K2, D3, and B6 in human blood serum/plasma was effectively performed using the plasmonic properties of the rGO/pPY/Bi nanocomposite as a chemical sensor.
2. Experimental section
2.1. Chemicals and materials
Graphite flakes and sulfuric acid (98%) were bought from Alfa Aesar, China. Sodium nitrate and hydrogen peroxide (35%) were purchased from Sigma-Aldrich, USA. Potassium permanganate was purchased from Merck, China. Bismuth nitrate pentahydrate, mercaptosuccinic acid, and sodium hydroxide were also purchased from Merck, China. Pyrrole and FeCl2 were purchased from Alfa Aesar, China.
2.2. Instrumentation
The FTIR spectra of rGO/pPy/Bi NC were recorded using a Nicolet 5700 +FTIR equipped with a KCl transmission cell. Surface morphology was characterized using a scanning electron microscope (SEM; JSM-6380, JEOL, Japan), an atomic force microscope (AFM; model 550, Agilent, Santa Clara, CA, USA), and a transmission electron microscope (TEM; JEM-2100FX, JEOL, Japan). XRD analysis was done by using a TOE theta–theta diffractometer with WinXPoe X’Pert High Score software, Germany, equipped with Cu Kα monochromatic radiation (wavelength 1.54 Å) in the 2θ range of 0 to 80°. UV-vis analysis was done by using a PerkinElmer Lambda 365 UV-vis spectrophotometer.
2.3. Synthesis of GO
A modified Hummers' method was used for exfoliating the graphite flakes.29 Precisely, a flask containing 2 g of graphite powder and 1 g of sodium nitrate (NaNO3) was kept in an ice bath. Sulfuric acid (35 mL; H2SO4) was carefully poured into the mixture dropwise with continuous stirring. After 2 hours of continued stirring, 6 g of potassium permanganate (KMnO4) was gradually added, and the flask was kept at ambient temperature for 24 hours. Then a sufficient amount (approximately 500 mL) of D.I. water was added. The completion of the reaction was checked by adding 5 mL of hydrogen peroxide (H2O2). The synthesized product was washed thoroughly with 5% of HCl and D.I. water to remove impurities.
2.4. Synthesis procedure of the reduced graphene oxide/polypyrrole nanocomposite decorated with bismuth nanoparticles (rGO/pPY/Bi NC)
The synthesis of rGO/pPY/Bi NC was carried out under aqueous conditions. Precisely, 0.5 M solution of bismuth nitrate (Bi(NO3)2) was prepared in 5 mL of distilled water (with 0.009 mole nitric acid), and 0.6 g of mercaptosuccinic acid was dissolved in 15 mL of distilled water at ambient temperature and both solutions were mixed. To this mixture, 35 mL of basic dispersion of GO was added under continuous stirring at 90 °C.30 A well stirred solution of 0.02 g of FeCl2 dissolved in 10 mL of D.I. water, 100 μL of pyrrole and 300 μL of hydrogen peroxide (H2O2) were added to the above mixture to allow polymerization of pyrrole and reduction of bismuth nitrate and GO, simultaneously. The polymerization was carried out for 12 h at room temperature.31 The resulting nanocomposite was washed by centrifugation and used as a sensing material. Fig. 1 shows the schematic representation of the fabrication process.
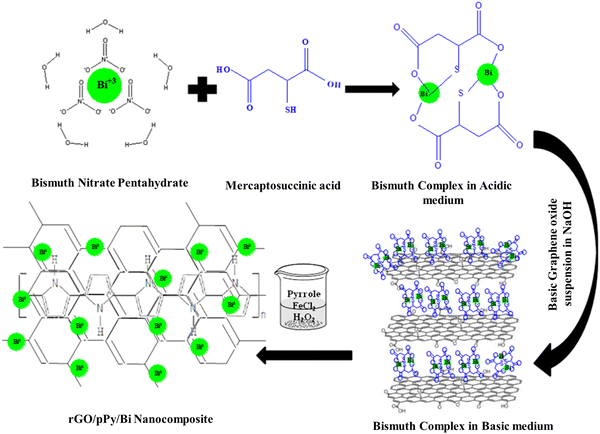 |
| | Fig. 1 Synthesis of rGO/pPY/Bi NC. | |
2.5. Procedure for determination of vitamins (K1, K2, D3 and B6) using rGO/pPy/Bi NC as an optical sensor
The detection procedure for the determination of VK1, VK2, VD3, and VB6 was carried out by adding 50 μL of well dispersed rGO/pPy/Bi NC to the respective electrolytic solutions. Precisely, for the determination of VK1, 25 μL of HCl having pH 3 was added; for the determination of VK2, 25 μL of NaOH having pH 12 was added; for the determination of VD3, 25 μL of tris–HCl buffer having pH 7.5 was added; and for the determination of VB6, 25 μL of NaOH having pH 8 was added. The volume was made up to 5 mL using D.I. water. Finally, the well dispersed mixture was analyzed using a UV-visible spectrometer.
2.6. Procedure for preparation of blood samples (serum/plasma) for determination of vitamins (K1, K2, D3 and B6)
The samples of blood (5 mL) were collected from healthy volunteers in vein punctured tubes of red and purple color for serum and plasma, respectively. Serum was collected from red tubes directly; however, plasma was obtained by centrifuging the blood at 3000 rpm and 4 °C. The resultant serum or plasma was analyzed further using the proposed sensor, rGO/pPY/Bi nanocomposite. Precisely, VK1 was analyzed in HCl of pH 3, VK2 was analyzed in NaOH of pH 12, VB6 was analyzed in NaOH of pH 8, and VD3 was analyzed using tris–HCl buffer of pH 7.5. At the time of analysis, the samples of serum and plasma were diluted twofold in the respective acid, base, and buffer media for the determination of vitamins K1, K2, B6, and D3.
3. Results and discussion
3.1. Fabrication of the rGO/pPy/Bi nanocomposite
Graphene oxide has garnered significant attention from the scientific community due to its unique honeycomb crystal structure and exceptional properties.32 The structure of graphene oxide is composed of a monolayer of carbon atoms arranged in hexagonal crystals, just like graphene, along with oxygen containing functional groups such as hydroxyls (–OH), carbonyls (–CO), epoxides (–COC), and carboxyls (–COO). The presence of these functional groups makes graphene oxide hydrophilic because the van der Waals forces between the layers of graphene oxide facilitate its dispersion in aqueous solutions. These properties make GO more accessible for providing a supporting platform to the various nanoparticles.33 Moreover, these functional groups on the surface of GO promote stronger chemical interaction and bonding with the polymeric matrix in polymer based nanocomposites.34 Metal based nanomaterials have gained significant interest due to their size and shape dependent optical, magnetic, catalytic, and electrical properties. Bismuth, a semimetal, is a p-block element that shows unique behavior as its crystallite size decreases. Bismuth nanoparticles exhibit catalytic activity, photocatalytic activity, and optical activity because of their anisotropic Fermi level, high carrier mobility (allowing for efficient charge transport within the material), high magneto resistance effect, low effective mass, and relatively small number of charge carriers per unit volume.35 From both theoretical and experimental observations, it has been found that bismuth can exhibit tunable optical surface plasmon resonances (SPRs or LSPRs) across the broad spectrum region.36 The enhanced light absorption and scattering, as well as the flexibility to utilize bismuth as either an electron donor or an electron acceptor depending on the needs, make Bi nanostructures work as smart optical sensors.37 Pyrrole is considered to be a conductive polymer with electrical and optical properties.38 It is used to modify graphene oxide to enhance the properties of the composite. Moreover, it can also provide an additional support to nanoparticles by facilitating charge transfer.
Therefore, this study was planned to fabricate a composite of reduced graphene oxide coated with a conducting nanolayer of polypyrrole having Bi NPs embedded in it. For this purpose, we used mercaptosuccinic acid to prevent the formation of Bi2O3. Mercaptosuccinic acid interacted with bismuth to form a complex. To this complex, the basic dispersion (maintained by adding NaOH) of GO was added. The addition of NaOH accelerates the formation of metal nanoparticles. For this purpose, basic GO was utilized so that it could work as an accelerator as well as a platform for the deposition of polypyrrole and Bi NPs simultaneously. Finally, pyrrole was added to the above mixture, followed by the addition of H2O2 and FeCl2 for the reduction of the bismuth complex into Bi NPs, reduction of GO into reduced GO, and redox polymerization of pyrrole to produce polypyrrole simultaneously. Here, it is worth mentioning that Bi(NO3)2 produces white precipitates of Bi(OH)3 when directly mixed with NaOH; these precipitates dehydrate to form Bi2O3 that cannot be reduced easily to Bi NPs. However, the addition of an organic precursor that can form a complex with metal ions prevents this situation. Therefore, in this study, mercaptosuccinic acid was used.30 Further, graphene oxide is used as a supporting material for pyrrole and bismuth nanoparticles to create a multifunctional composite. GO also helps in stabilizing the bismuth nanoparticles in the dispersion of the composite and prevents their aggregation. Pyrrole is used to modify graphene oxide and enhance its properties in terms of absorption of the analyte; it also helps in immobilizing the bismuth nanoparticles on the surface of rGO. Bismuth nanoparticles produce a unique optical phenomenon upon interaction with the respective vitamin in its respective electrolyte. This is because the oscillation of free electrons in bismuth nanoparticles is sensitive to the wavelength of incident light, as in the case of other metal nanoparticles.
3.2. Characterization
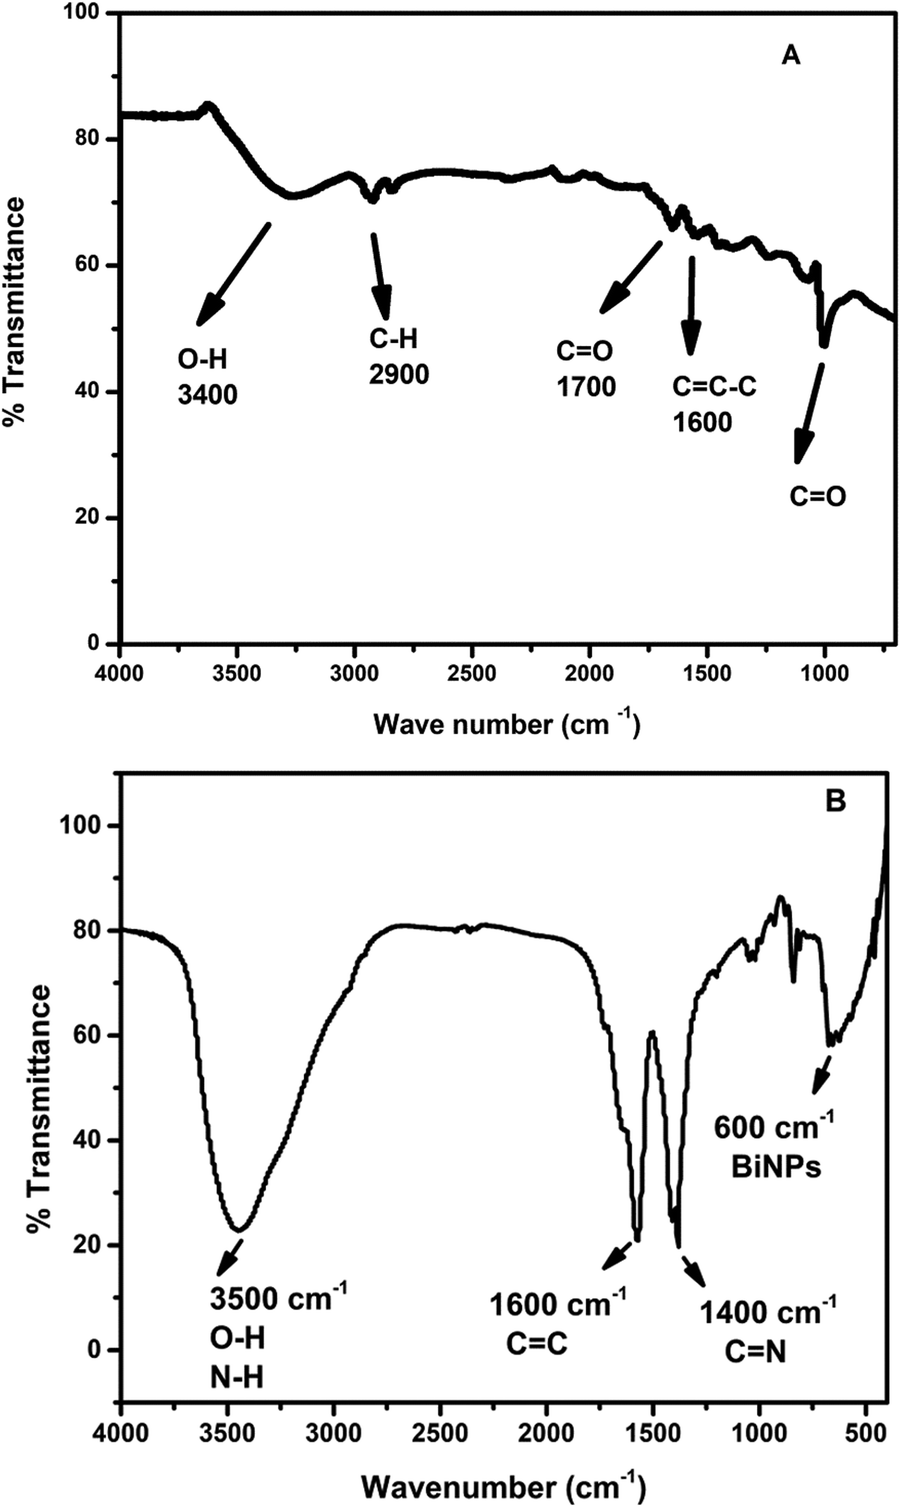
In order to confirm the successful synthesis of GO and reduced graphene oxide/polypyrrole decorated bismuth nanocomposite (rGO/pPY/Bi NC), FTIR spectroscopy was carried out. Fig. 2(A) shows various stretching vibrations because of oxygen containing functional groups, such as hydroxyl (O–H), carbonyl (C![[double bond, length as m-dash]](https://www.rsc.org/images/entities/char_e001.gif) O), and epoxy (C–O–C) group stretching vibrations at 3400 cm−1, 1700 cm−1,and 1120 cm−1, respectively. These stretching vibrations of oxygen containing functional groups confirmed that graphite has been successfully oxidized by Hummers' method.39,40 The broad and intense stretching vibration peak observed at 3500 cm−1 in Fig. 2(B) confirms the presence of O–H functionality29 along with N–H stretching41 of rGO and pyrrole, respectively. Further, the peaks observed at 1600 cm−1, 1400 cm−1, and 600 cm−1, are due to the CC stretching vibrations from polypyrrole,42 CN stretching vibrations from polypyrrole,41 and bismuth nanoparticles, respectively (Fig. 2B). The presence of all these vibrational peaks and the absence of the carbonyl peak confirmed that graphene oxide is reduced and polypyrrole and bismuth nanoparticles are decorated successfully on the surface of reduced graphene oxide.
O), and epoxy (C–O–C) group stretching vibrations at 3400 cm−1, 1700 cm−1,and 1120 cm−1, respectively. These stretching vibrations of oxygen containing functional groups confirmed that graphite has been successfully oxidized by Hummers' method.39,40 The broad and intense stretching vibration peak observed at 3500 cm−1 in Fig. 2(B) confirms the presence of O–H functionality29 along with N–H stretching41 of rGO and pyrrole, respectively. Further, the peaks observed at 1600 cm−1, 1400 cm−1, and 600 cm−1, are due to the CC stretching vibrations from polypyrrole,42 CN stretching vibrations from polypyrrole,41 and bismuth nanoparticles, respectively (Fig. 2B). The presence of all these vibrational peaks and the absence of the carbonyl peak confirmed that graphene oxide is reduced and polypyrrole and bismuth nanoparticles are decorated successfully on the surface of reduced graphene oxide.
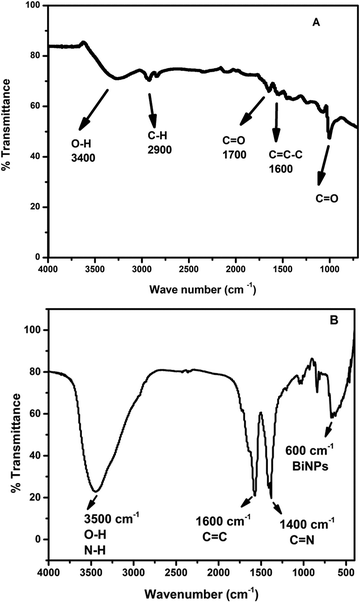 |
| | Fig. 2 FTIR spectra of (A) GO and (B) rGO/pPy/Bi NC. | |
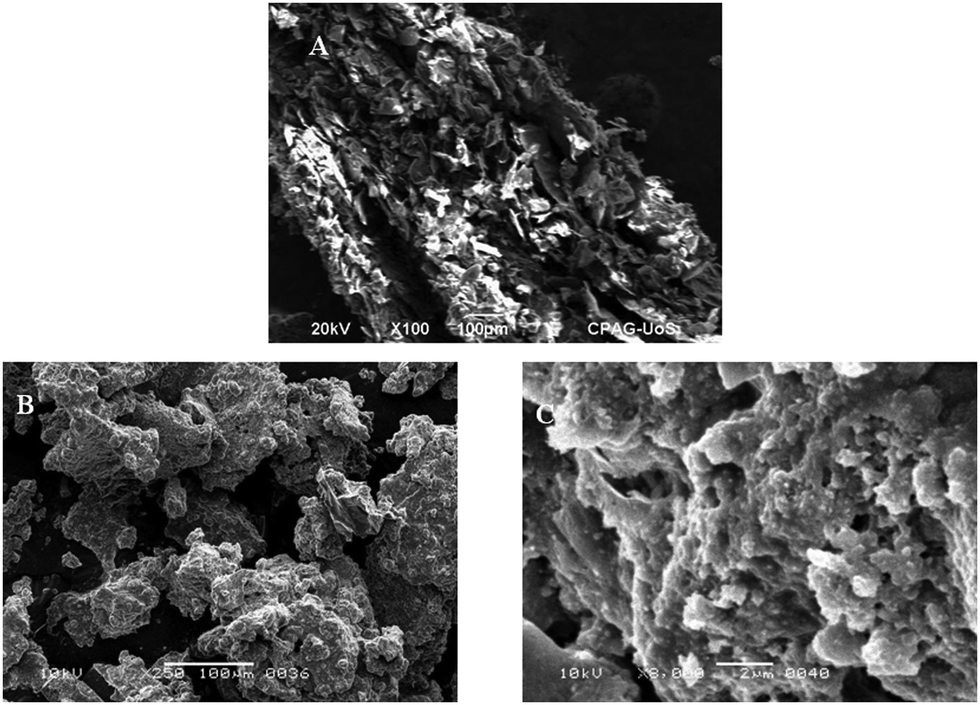
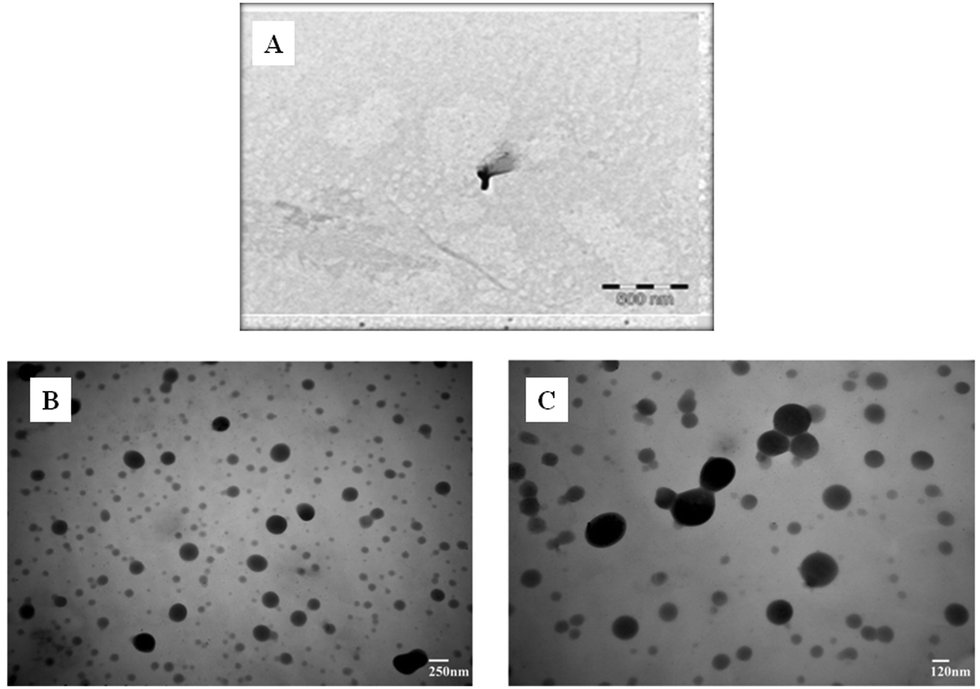
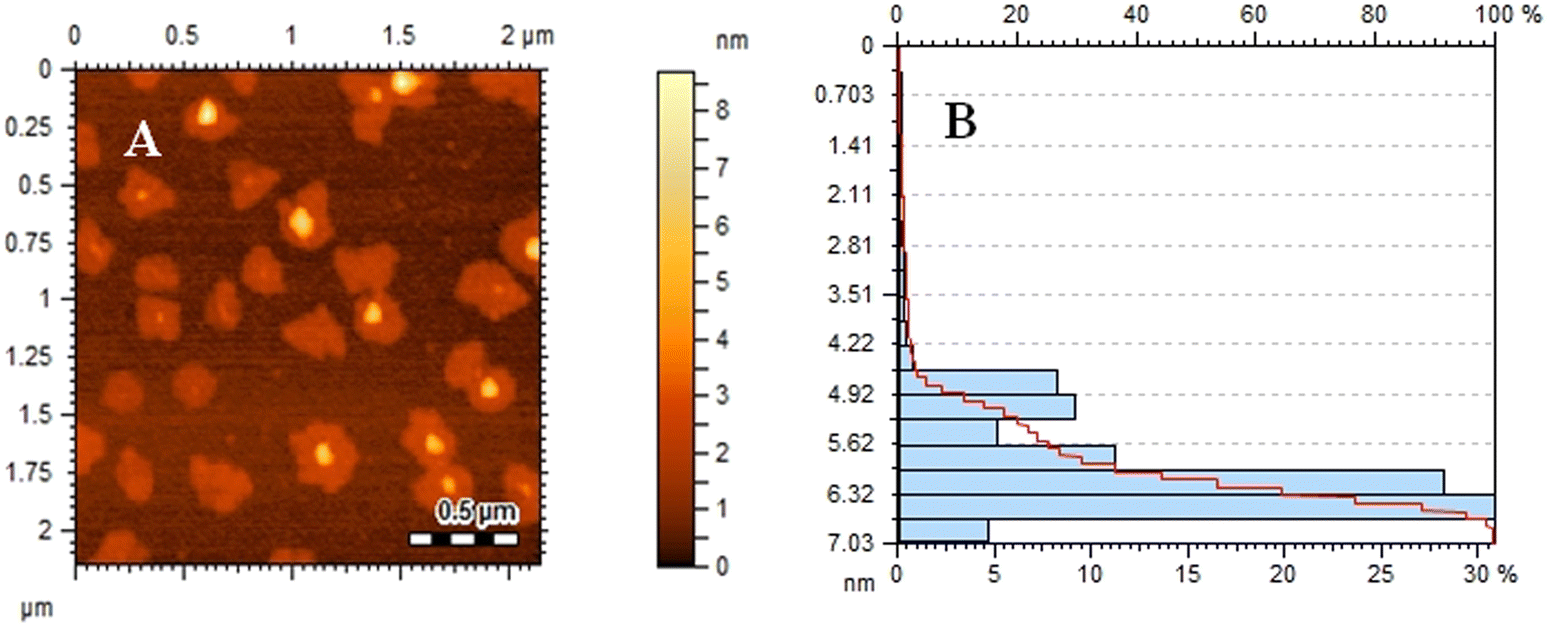
The surface morphology of the composite (rGO/pPy/Bi NC) and GO was studied using SEM, TEM, and AFM. Fig. 3(A) shows that well exfoliated graphene oxide is produced. Fig. 3(B) and (C) are the SEM images of rGO/pPy/Bi NC at different magnification scales. The images show that polymerization has successfully occurred and on the surface of polypyrrole light gray or whitish particles can be seen which confirms the presence of bismuth nanoparticles in the composite.43 In the TEM micrograph of GO (Fig. 4(A), a layered and wrinkled structure of GO can be seen, which confirms its sheet like morphology. However, the TEM micrographs of rGO/pPY/Bi NC (Fig. 4B and C) show black and translucent parts,44,45 which confirms the uniform distribution of bismuth nanoparticles along with the polymer on the surface of rGO.46,47 Moreover, the surface topography of the sensing material was confirmed by the AFM technique. Fig. 5(A) shows a surface topography image of rGO/pPY/Bi NC, and Fig. 5(B) shows the corresponding size distribution plot of rGO/pPY/Bi NC. The AFM image clearly shows that many spherical particles are decorated onto the surface of the nanocomposite.48 These results confirmed the successful fabrication of rGO/pPy/Bi NC.49 The size distribution plot shows that the average size of Bi NPs is 6.32 nm which falls within the size range of 4.22 to 7.03 nm. All these three (SEM, TEM, and AFM) surface morphology studies of rGO/pPY/Bi NC are in good agreement with each other and confirmed the successful synthesis of rGO/pPY/Bi NC.
 |
| | Fig. 3 SEM images of (A) GO and (B and C) rGO/pPy/Bi NC. | |
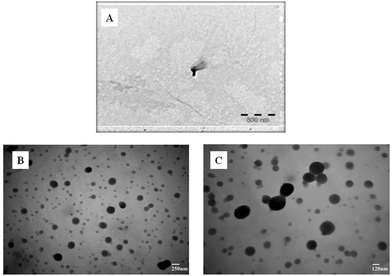 |
| | Fig. 4 TEM images of (A) GO and (B and C) rGO/pPy/Bi NC. | |
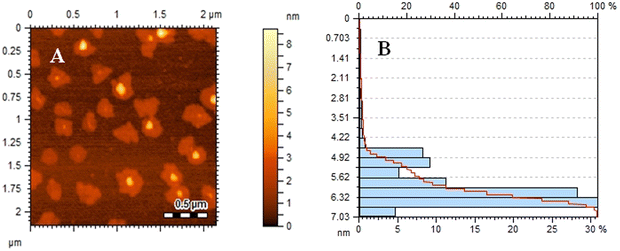 |
| | Fig. 5 (A) AFM image of rGO/pPy/Bi NC and (B) size distribution plot of rGO/pPY/Bi NC. | |
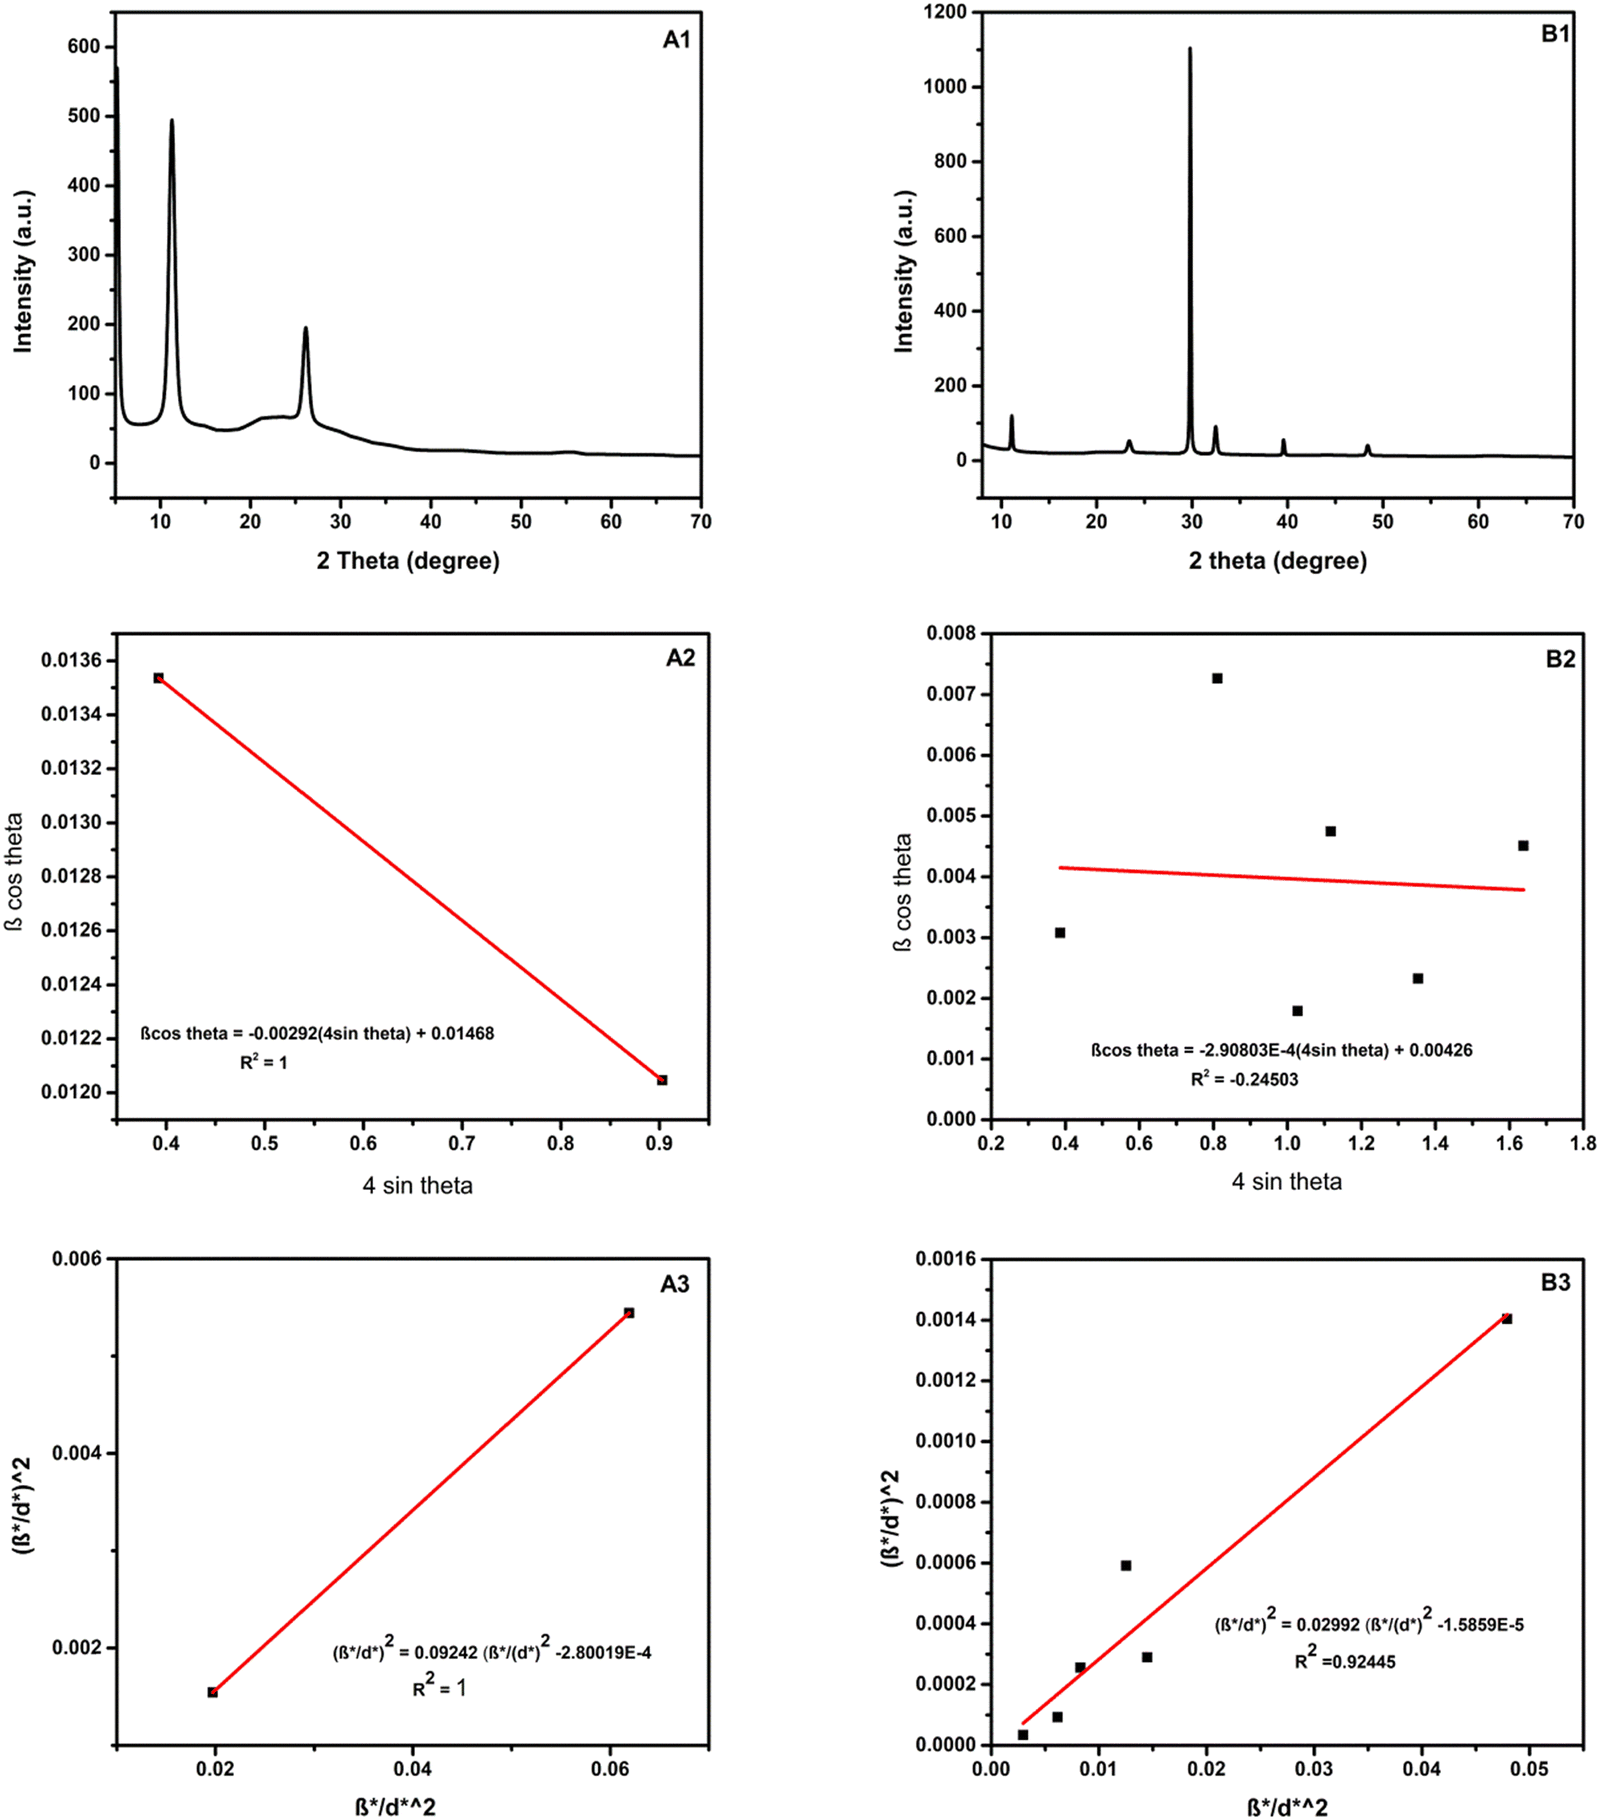
The crystalline phase of GO and rGO/pPY/Bi NC was characterized by studying their XRD patterns. Fig. 6(A) shows the diffraction peaks at 2θ 11.2° and 26.1° with d spacing of 0.79 nm and 0.34 nm, respectively. D spacing was calculated by Bragg's law (eqn (1)). The peak at 11.2° revealed that graphite was successfully oxidized. However, the peak at 2θ 26.1° is attributed to the presence of some non-oxidized graphene sheets.50 The XRD pattern of rGO/pPy/Bi NC (Fig. 6B) shows the diffraction peaks at 2θ 11.0°, 23.3°, 29.7°, 32.4°, 39.5°, and 48.3° with d spacing of 0.79 nm, 0.38 nm, 0.29 nm, 0.27 nm, 0.23 nm, and 0.19 nm, respectively. The XRD patterns of rGO/pPy/Bi NC (2θ 29.7°, 32.4°, 39.5°, and 48.3°) matched very well with the reported XRD patterns of bismuth nanoparticles.26,51 The intense peak at 2θ 32.4° reveals the rhombohedral phase of bismuth NPs (JCPDS Card No. 85-1331); however, in rGO/pPy/Bi NC, it is shifted from 27 to 29. This can be due to size confinement and strain induced effects.52 Moreover, the shift in the peak may be due to the presence of pPy and GO in the composite along with Bi NPs.53 Further, the diffraction peaks at 2θ 11.0° and 23.3°54 confirmed the presence of GO and polypyrrole, respectively.
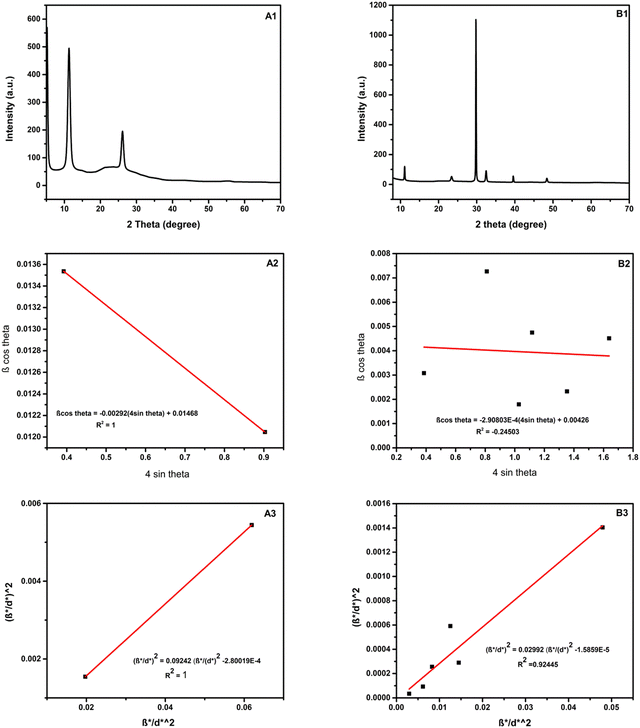 |
| | Fig. 6 XRD patterns of (A1) GO and (B1) rGO/pPy/Bi NC, the Williamson–Hall plot of (A2) GO and (B2) rGO/pPY/Bi NC, and the Halder–Wagner plot of (A3) GO and (B3) rGO/pPY/Bi NC. | |
The Debye–Scherrer equation is used in crystallography for the determination of crystallite size of the material.55 The equation also helps in calculating the crystallite size of GO based nanocomposites.56 The crystallite sizes of GO and rGO/pPy/Bi NC were calculated using the Debye–Scherrer equation (eqn (2)):
| | nλ = 2sin![[thin space (1/6-em)]](https://www.rsc.org/images/entities/char_2009.gif) θ θ | (1) |
| | | D = Kλ/βcosθ | (2) |
In eqn (2), D, K, λ, β, and θ denote crystallite size in nm, particle shape factor (0.9), wavelength of CuKα1 radiation (0.154 nm), calibrated half intensity width of the selected diffraction peak in degrees, and the Bragg angle, respectively. By using this equation, the crystallite size of GO and rGO/pPY/Bi NC was calculated as 10.5 nm and 40.1 nm, respectively. The increased sheet height of GO/pPY/Bi NC resulted from the formation of polypyrrole nanolayers embedded with Bi nanoparticles between the layers of rGO. Further confirmation of crystallite sizes was obtained using the Williamson–Hall equation (eqn (3)):
| |  | (3) |
In the above equation, β is the FWHM of the diffraction peak, θ is the angle of the diffraction peak, λ is the wavelength, k is the shape factor (0.9), D is the crystallite size, and ε is the effective lattice strain. In this method, the linear plot was constructed between βcosθ and 4sinθ, which can be seen in Fig. 6A2 and Fig. 6B2 for GO and rGO/pPy/Bi NC, respectively. The crystallite size (D) was calculated using the intercept.57 According to this method, the crystallite sizes of GO and rGO/pPY/Bi NC were found to be 9.4 nm and 32.5 nm, respectively. The difference in the crystallite sizes obtained from Scherrer's equation and the Williamson–Hall method is because the peak broadening in Scherrer's equation is related to only the size of the crystal. However, in the Williamson–Hall method, the peak broadening is related to the size of the crystal and effective lattice strain. A greater variation in size was observed in the composite in both calculated methods. It can be due to the difference in average particle size distribution.58 The plot (B2) of the Williamson–Hall method shows high scattering points, indicating that the obtained results can be inaccurate. Therefore, further confirmation of crystallite sizes was provided by the Halder-Wagner equation (eqn (4)):59,60
| |  | (4) |
In the above equation, β* and d* can be written as
| |  | (5) |
| |  | (6) |
In this method, the linear plot was plotted between (β*/d*)2 and (β*/d*2), as seen in Fig. 6A3 and B3. This method provided a straight line with a regression coefficient of R2 = 0.92445 for the rGO/pPy/Bi NC. The crystallite sizes were calculated using the slope. According to this method, the crystallite sizes of GO and rGO/pPY/Bi NC were found to be 10.8 nm and 33.4 nm, respectively. The crystallite sizes of GO and rGO/pPY/Bi NC obtained from all three methods are summarized in Table 1. As our developed material is not fully crystalline, the results achieved by Williamson–Hall and Halder–Wagner equations are supported more.61 However, the Williamson–Hall plot is scattered; therefore the crystallite size achieved by the Halder–Wagner equation is considered the most. It concluded that the crystallite size of GO and rGO/pPY/Bi NC is 10.8 nm and 33.4 nm, respectively. The difference in the size of rGO/pPY/Bi NC based on AFM and XRD is due to the difference in sample preparation and the difference in analysis.
Table 1 Estimation of the crystallite sizes of GO and rGO/pPY/Bi NC by three different methods
| Method |
GO (D) (nm) |
rGO/pPY/Bi NC (D) (nm) |
| Debye–Scherrer |
10.5 |
40.1 |
| Williamson–Hall |
9.4 |
32.5 |
| Halder–Wagner |
10.8 |
33.4 |
3.3. Determination of vitamin K1, K2, B6, and D3 using rGO/pPy/Bi NC as an optical sensor
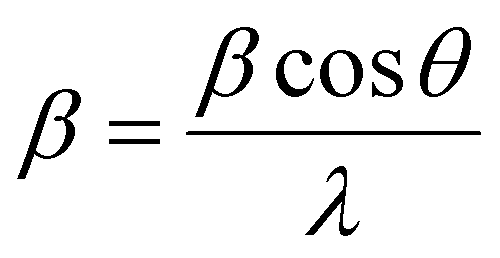
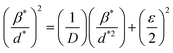
The selectivity of rGO/pPy/Bi NC as an optical sensing material was studied for numerous vitamins such as VD2, VD3, VB1, VB2, VB6, VA, VE, VC, VK1, VK2, and VK3 using a UV-Vis spectrophotometer. Precisely, a standard solution of various vitamins in equal volumes (1 ng mL−1) and rGO/pPy/Bi NC, along with the respective acid, base, or buffer, was taken in a separate volumetric flask, dispersed well, and subjected to UV-Vis analysis. Each vitamin was analyzed in different electrolytic media, such as NaOH (pH 8 and pH 12), HCl (pH 3), and tris–HCl buffer (pH 7.5). The vitamins D2, B1, B2, A, E, C, and K3 showed an absorption peak in rGO/pPY/Bi NC at 310 nm at 1.7 au. On the other hand, vitamin K1 exhibited quenching with a decrease in the peak height in HCl solution of pH 3 with rGO/pPY/Bi NC (Fig. 7A), vitamin K2 exhibited quenching in NaOH of pH 12 with rGO/pPY/Bi NC (Fig. 7B), vitamin B6 exhibited quenching in NaOH of pH 8 with rGO/pPY/Bi NC (Fig. 7C), and vitamin D3 exhibited quenching in tris buffer solution of pH 7.5 with rGO/pPY/Bi NC (Fig. 7D). Thus, the rGO/pPy/Bi NC can be used as a highly selective sensing probe for VK1, VK2, VB6, and VD3 due to its quenching phenomenon for these vitamins in different electrolytes.
 |
| | Fig. 7 UV-visible screening of (A) vitamin K1 (HCl; pH 3), (B) vitamin K2 (NaOH; pH 12), (C) vitamin B6 (NaOH; pH 8) and (D) vitamin D3 (tris–HCl buffer; pH 7.5). | |
3.4. Optical sensing mechanism for detection of vitamin K1, K2, B6, and D3 using rGO/pPy Bi NC
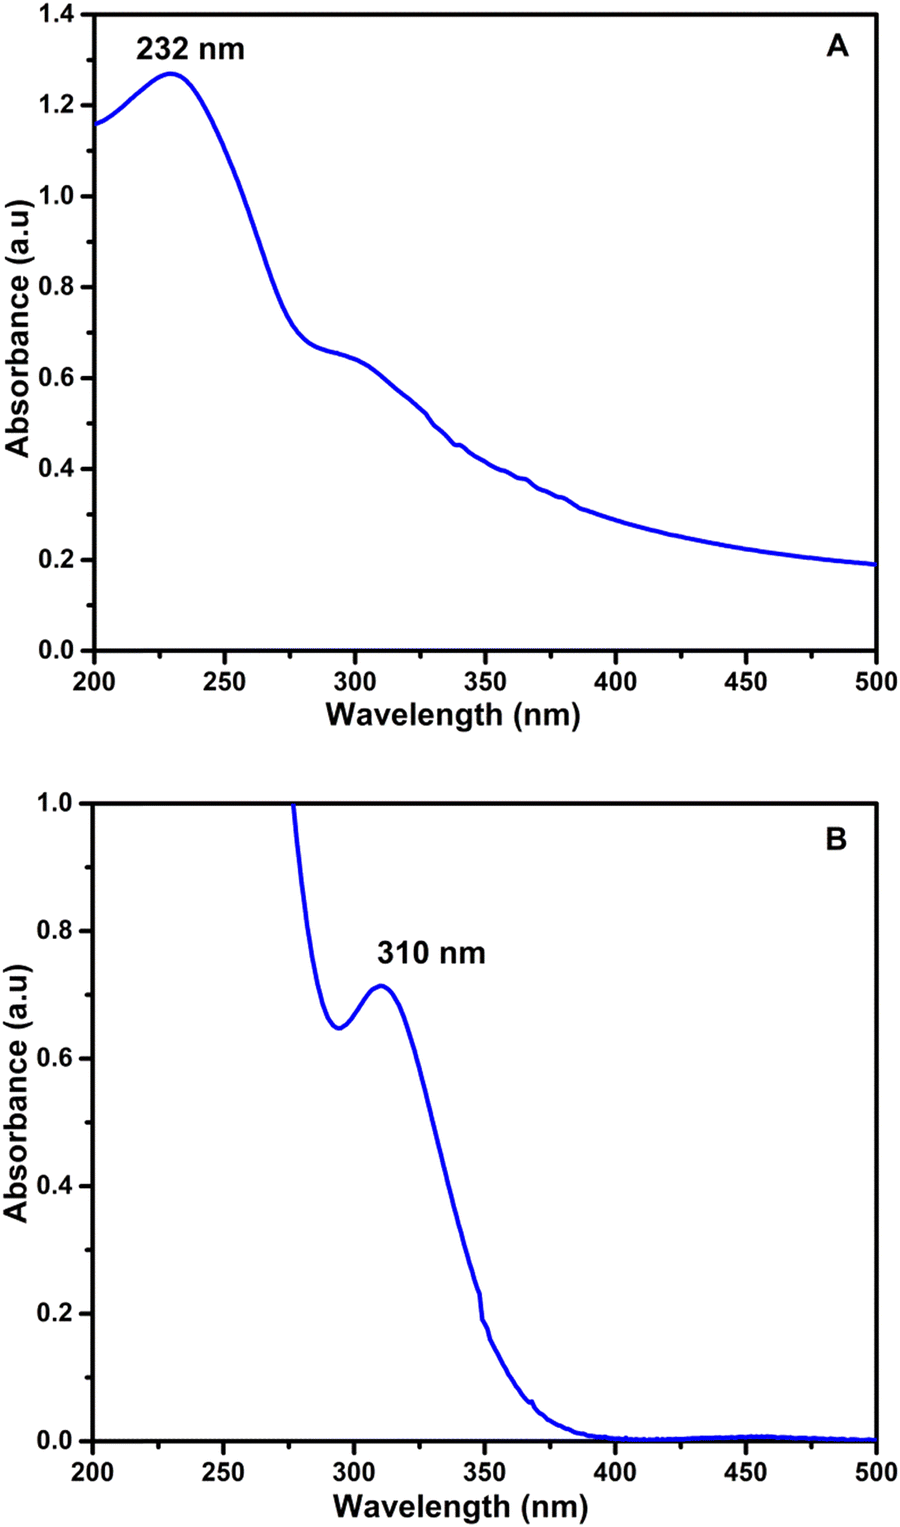
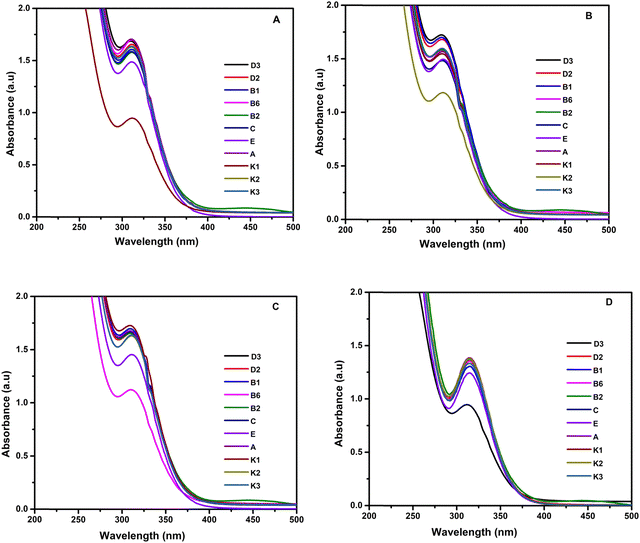
The characteristic absorption band of pure GO is observed at 232 nm, which can be seen in Fig. 8(A). Most of the literature reports that Bi nanoparticles show a band in between 270 and 280 nm.30,62 However, the rGO/pPy/Bi NC showed a band at 310 nm (Fig. 8B). The shift in the band of rGO/pPy Bi NC confirms the successful fabrication of the nanocomposite. This shift in the band can be due to the interaction of bismuth nanoparticles with the surface functional groups of rGO and polypyrrole, which in turn changes their electronic properties and optical absorption. Moreover, we can also say that the synergistic effect of all three components created a unique optically active environment. The addition of VK1, VK2, VB6, and VD3 to the rGO/pPy/Bi NC in the presence of the respective acid, base, or buffer shows the quenching of the optical band rather than a red or blue shift. The obtained results suggested that in the case of VK1, the quenching occurred because naphthoquinone with an alkyl chain in VK1 (phylloquinone) served as an efficient electron donor for the conduction band electron from bismuth decorated on the surface of rGO/pPy/Bi NC in the presence of acid (HCl pH 3).63 Because naphthoquinone with an alkyl chain is considered to be redox active,20 it can easily undergo an electron transfer reaction. Bismuth has unique properties; it can work as both an electron acceptor and an electron donor, depending on the surrounding environment. The presence of acid promotes and facilitates the protonation of the functional groups on the surface, making it more conducting. The electron transfer from VK1 to bismuth nanoparticles decorated on the surface of composites can cause the quenching of the optical signal by reducing their plasmonic properties or by interfering with collective electron oscillation. Similarly, in the case of VK2 (menaquinone), quenching was exhibited due to the presence of naphthoquinone with conjugated hydrocarbons. Therefore, in the presence of base NaOH at pH 12, its electron donor capability was enhanced for the conduction band electron of bismuth nanoparticles decorated on the surface of rGO/polypyrrole. It can be explained based on the presence of a strong base that deprotonates the functional group on the surface of the composite and makes it electron-rich; also the presence of a strong base makes menaquinone (VK2) more electron-rich and facilitates electron transfer to bismuth nanoparticles, and as a result, quenching occurred. Although a strong base makes the composite surface more electron-rich, it doesn’t hinder electron transfer; rather, it promotes interaction between electron-rich menaquinone and electron-accepting bismuth nanoparticles. In the case of VB6 (pyridoxine), quenching occurred in NaOH of pH 8, because VB6 works as an effective quencher for the rGO/pPy/Bi nanocomposite; this suggested that the pyridine functionality in the VB6 structure served as an efficient electron donor for the conduction band electron from the nanocomposite.64 This can be described based on pyridoxine (VB6) which contains the pyridine ring in its structure and has a nitrogen atom with a lone pair of electrons, which makes it electron-rich65 and capable of donating electrons to bismuth nanoparticles and reduces the peak absorption. The nanocomposite consists of rGO, pPY, and Bi nanoparticles. Each component is responsible for the overall behavior of the composite. In the presence of a base (pH 8), the functional groups on the surface of the composite are deprotonated; however, they didn’t hinder the bismuth nanoparticles from accepting electrons from pyridoxine. In the case of VD3 (cholecalciferol), the hydroxyl group present in the sterol rings66 causes the quenching of bismuth decorated on the surface of rGO/polypyrrole in tris–HCl buffer of 7.5.67 This is because the hydroxyl group (OH) present in cholecalciferol (VD3) serves as an electron-donating group in the presence of electron-accepting species like bismuth nanoparticles. In this case, the hydroxyl group in cholecalciferol can donate electrons to the bismuth nanoparticles on the surface of the composite. This transfer leads to the quenching of optical signals. Tris–HCl buffer plays a role in regulating this electron transfer process. Bismuth is a heavy element with a more complex configuration in comparison to noble metals like silver and gold. Bismuth has multiple electron shells and a more intricate electron distribution. In our composite, the surface of bismuth nanoparticles may contain functional groups and defects that can help bismuth to accept electrons from electron-rich species. This type of electronic conduction, which causes quenching, was not observed in other vitamins (D2, B1, B2, A, E, C, and K3). This was verified experimentally and rGO/pPy/Bi NC is the selective optical sensor for vitamins K1, K2, B6, and D3 in their respective buffers, acids or bases.
 |
| | Fig. 8 UV-Visible spectra of (A) GO and (B) rGO/pPY/Bi NC. | |
3.5. Optimization of the electrolytic medium for selective determination of vitamin K1, K2, D3, and B6 using rGO/pPy/Bi NC as an optical sensor
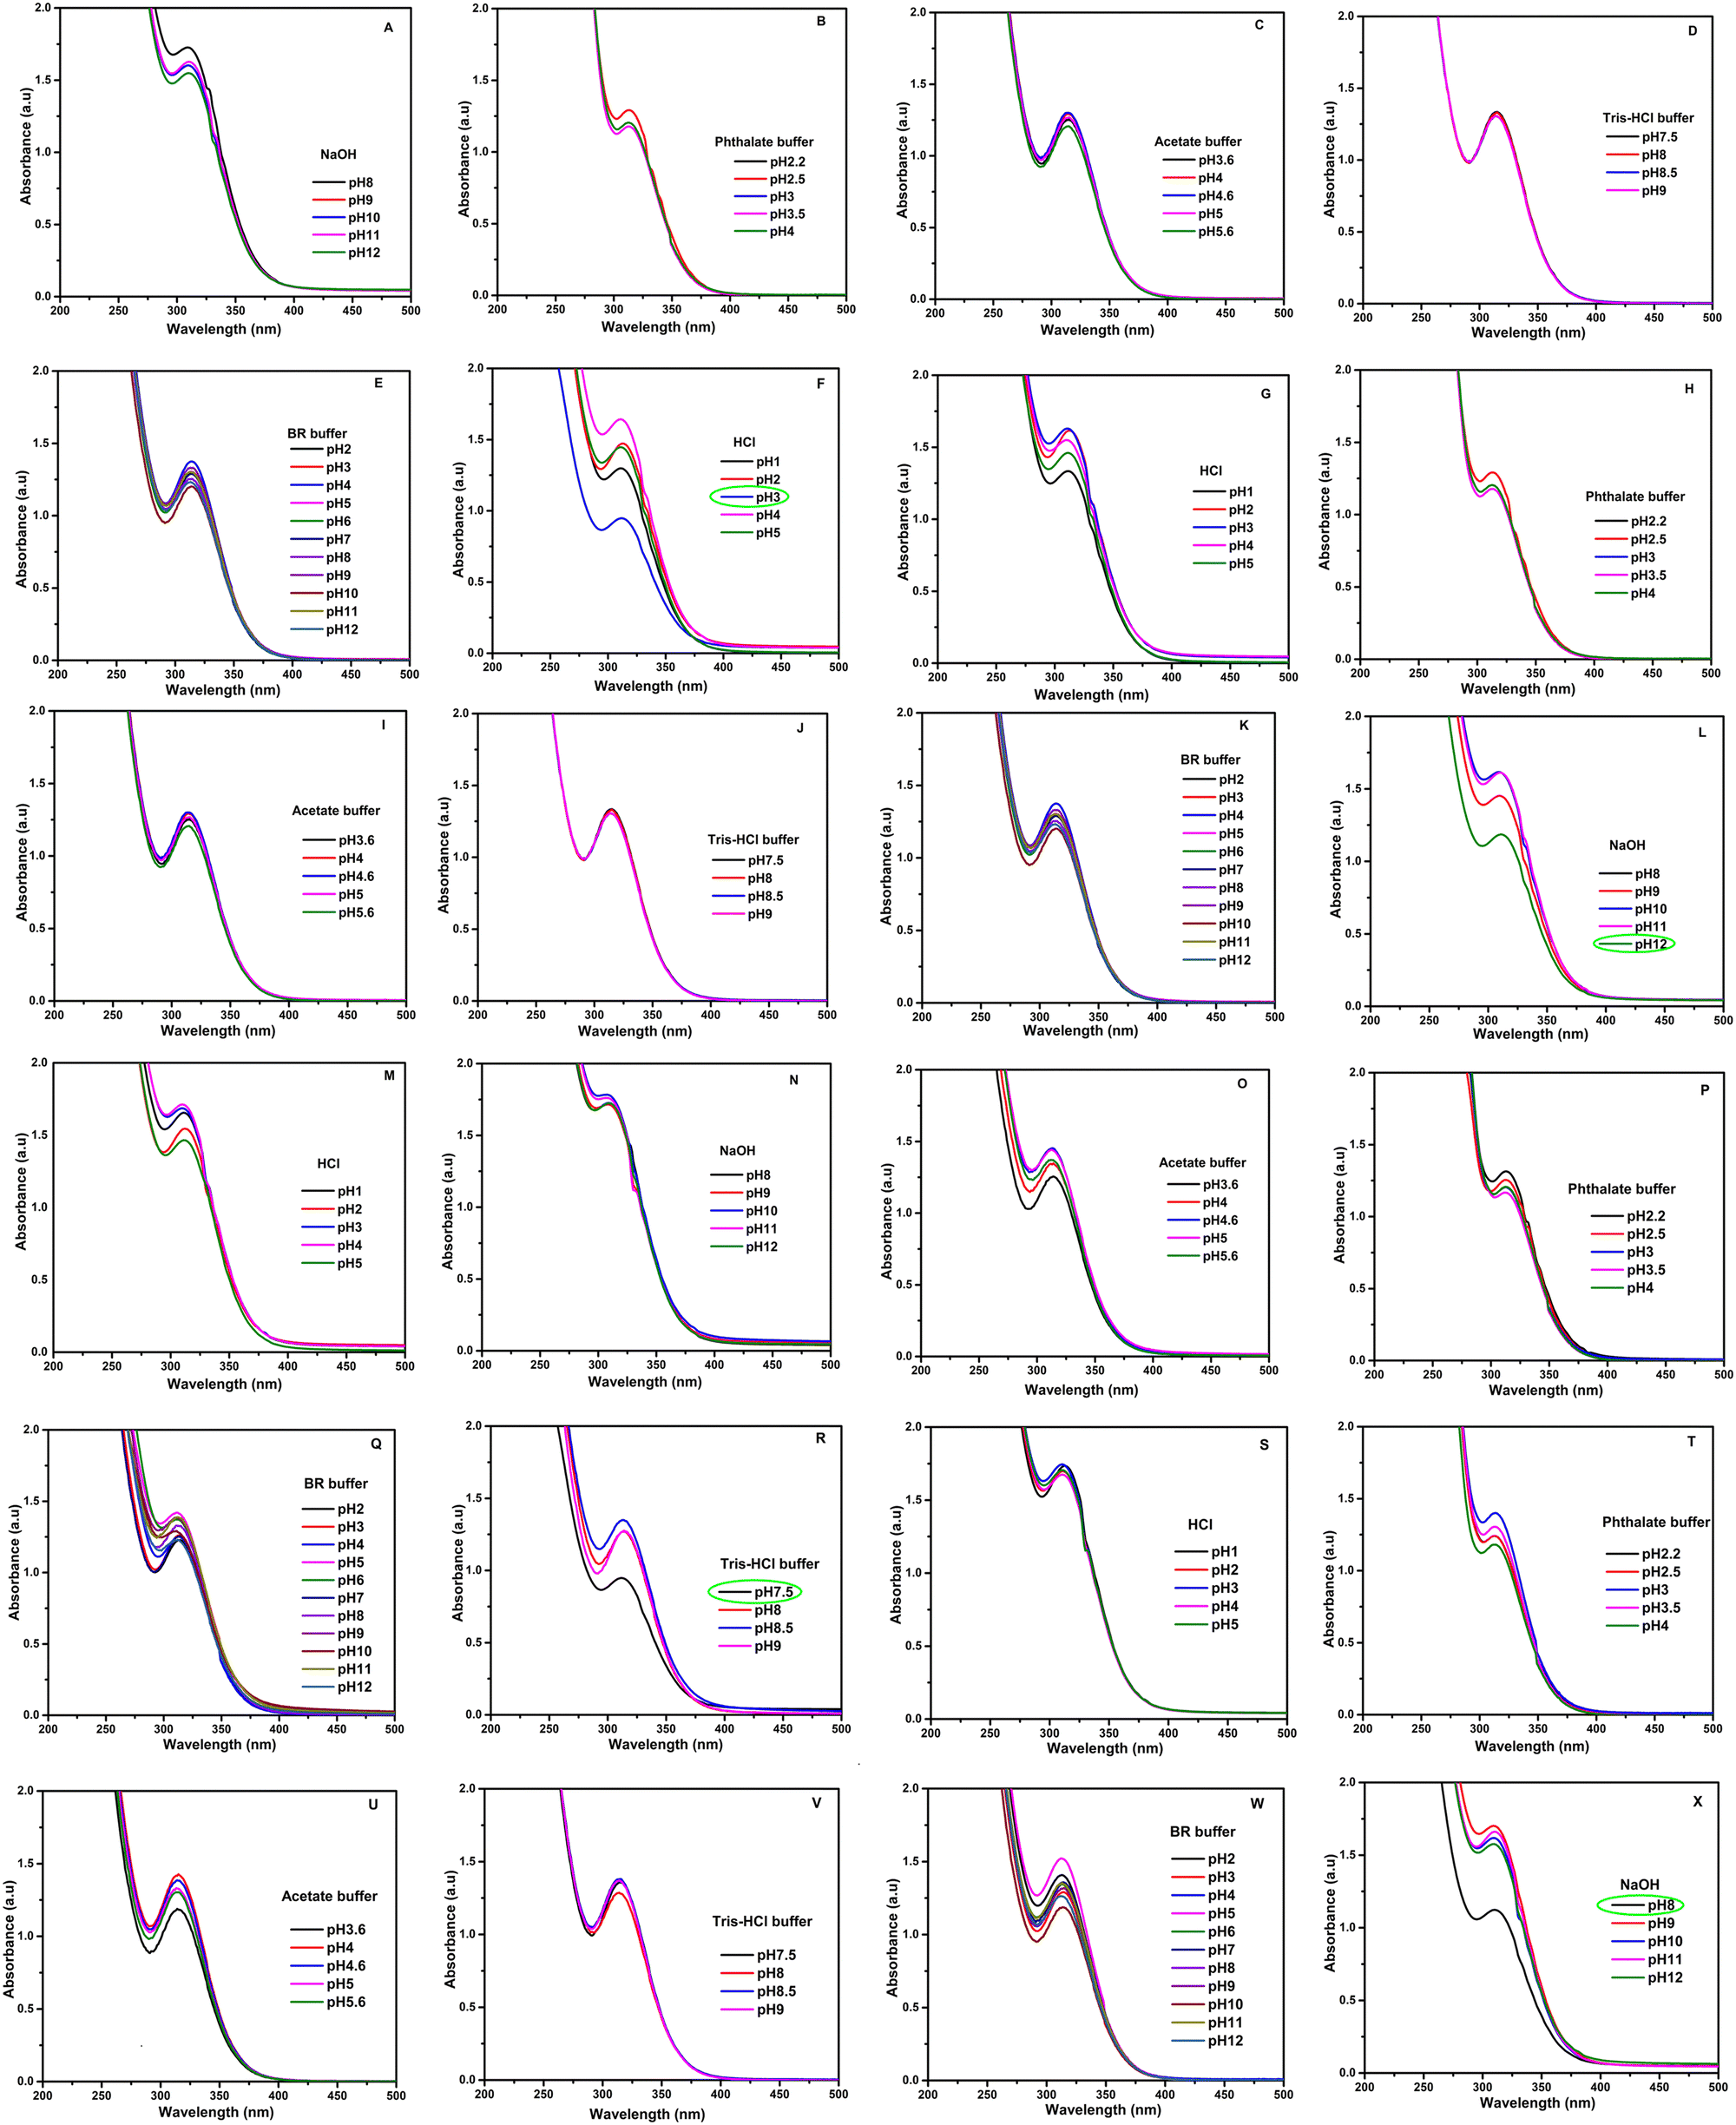
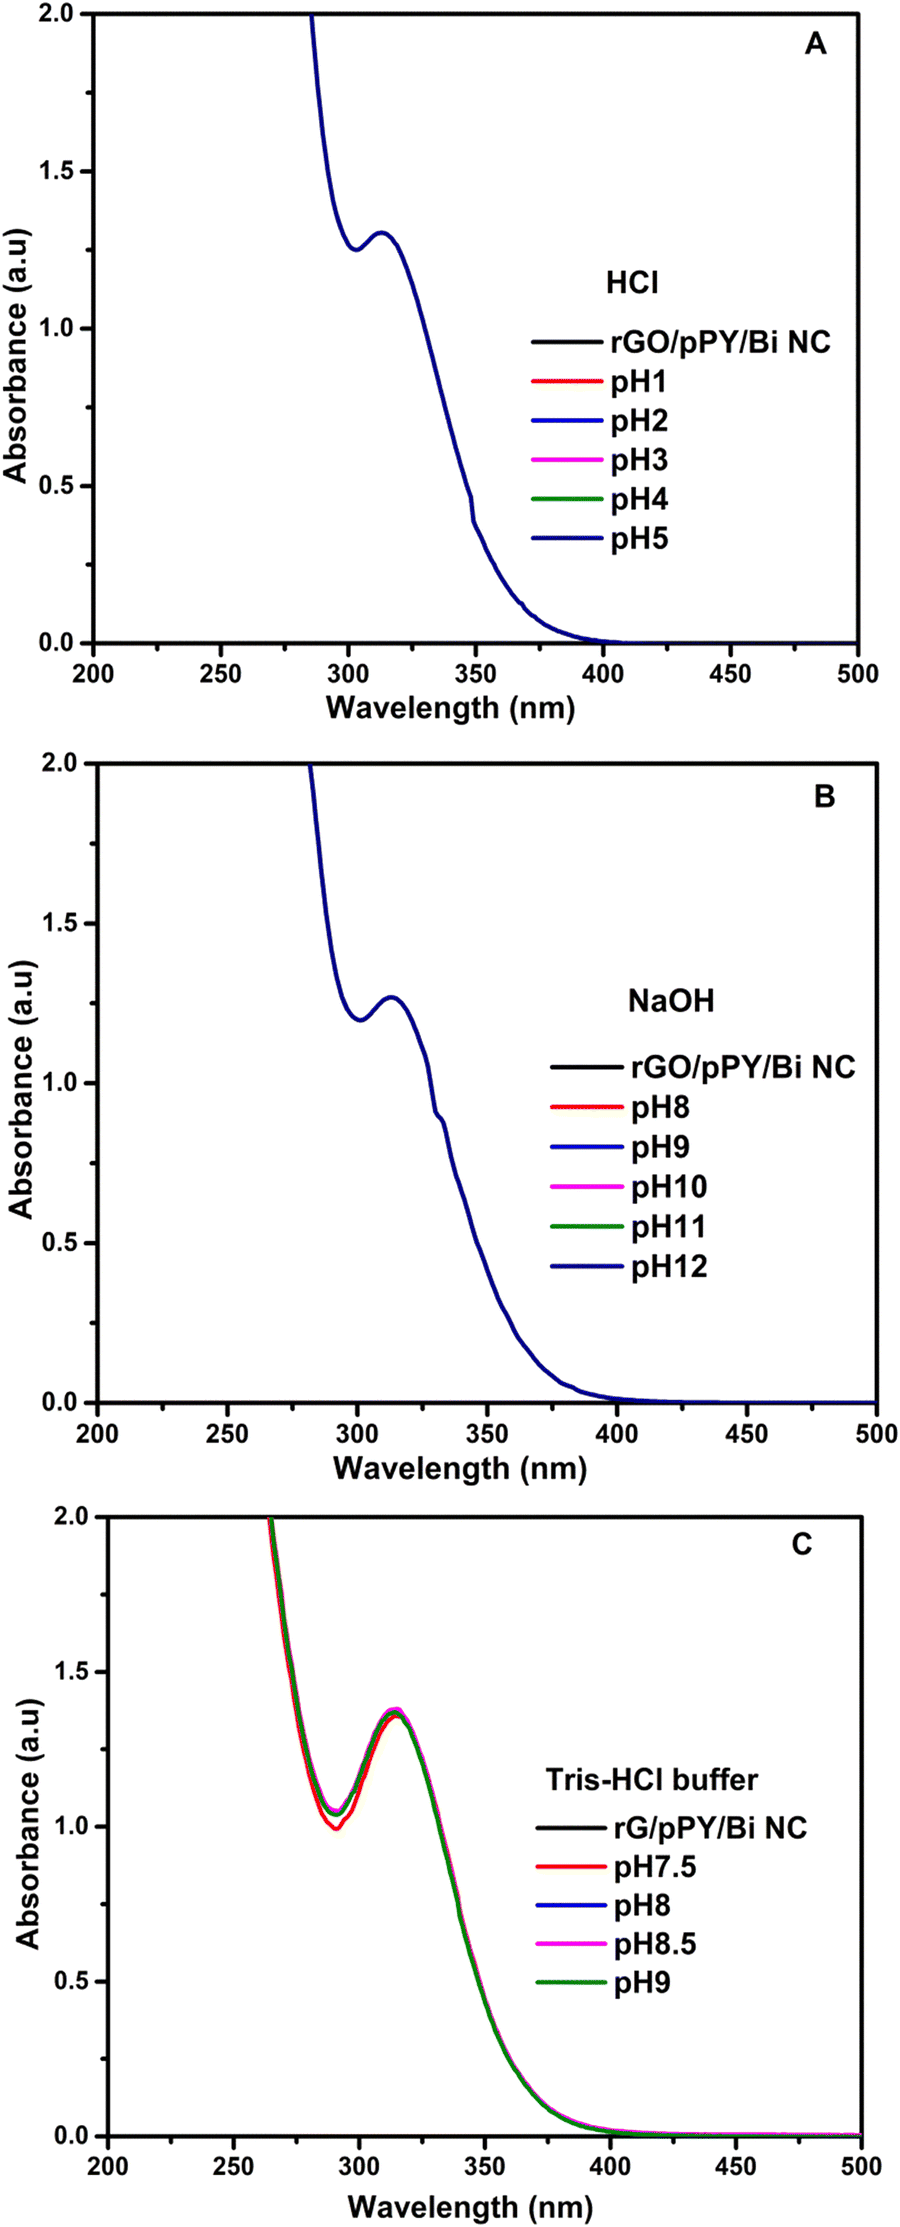
Optimization of various solutions of buffers, acids, and bases was performed for the selective determination of vitamins K1, K2, B6, and D3 using the rGO/pPy/Bi NC as an optical sensor. The study showed that only HCl at pH 3 is favorable for detection of VK1, NaOH at pH 12 for VK2, NaOH at pH 8 for VB6, and tris–HCl buffer at pH 7.5 for VD3. The results can be seen in Fig. 9(A–F) for VK1 optimization in acids, bases, and buffers. Fig. 9(G–L) shows optimization of VK2 in acids, bases, and buffers; Fig. 9(M–R) shows optimization of VD3 in acids, bases, and buffers; and Fig. 9(S–X) shows optimization of VB6. The effect of HCl, NaOH, and tris–HCl buffer was also studied on rGO/pPY/Bi NC. Fig. 10(A–C) shows that there is no change in the absorbance of the nanocomposite. Hence, it is concluded that these buffers served as selective media in the presence of their respective vitamins and did not show any kind of interaction with the nanocomposite in their absence.
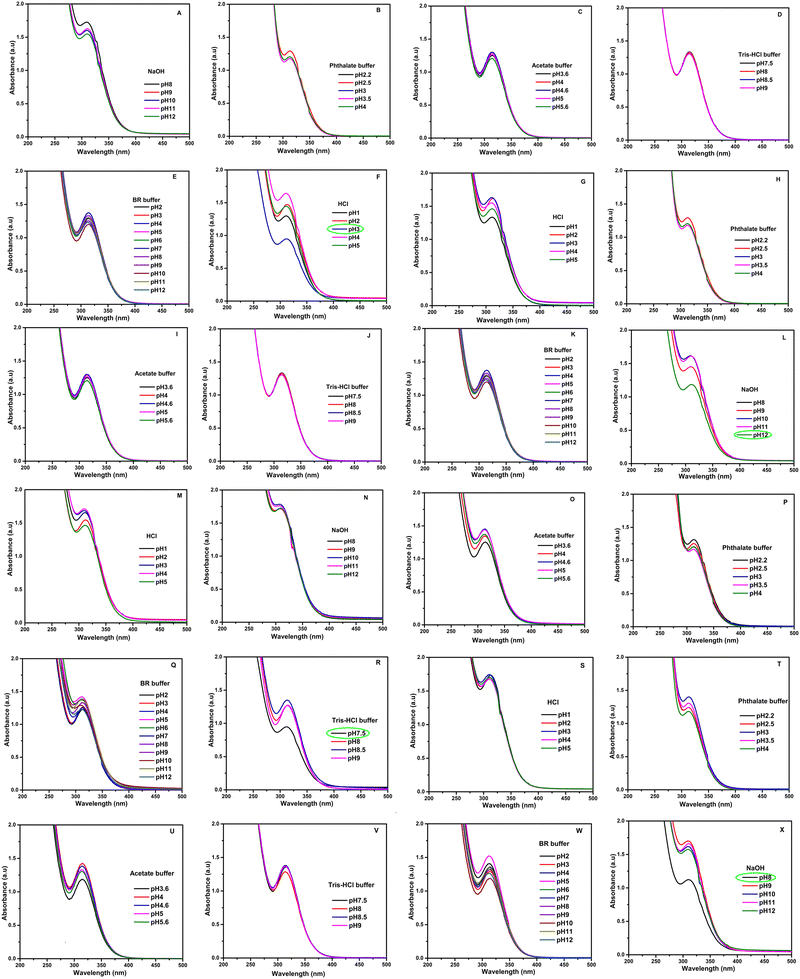 |
| | Fig. 9 Optimization of the response of rGO/pPy/Bi NC for (A)–(F) vitamin K1, (G)–(L) vitamin K2, (M)–(R) vitamin D3 and (S)–(X) vitamin B6 in different acids, bases and buffers at their respective pH. | |
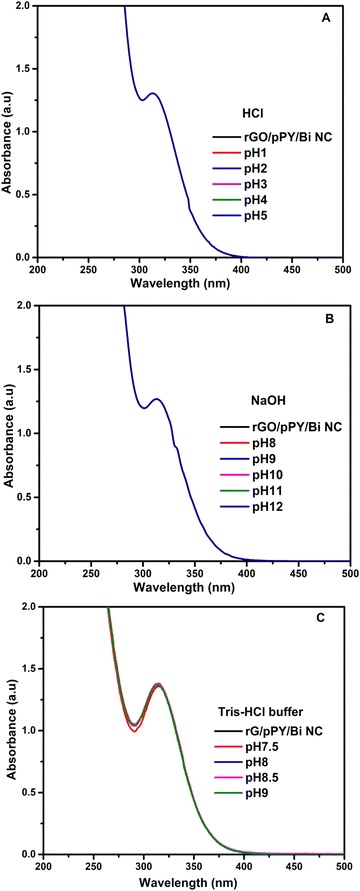 |
| | Fig. 10 UV-Vis response of rGO/pPY/Bi NC (S.M) in (A) HCl, (B) NaOH and (C) tris–HCl buffer. | |
3.6. Quantitative determination of vitamin K1, K2, B6 and D3 using rGO/pPy/Bi NC as an optical sensor
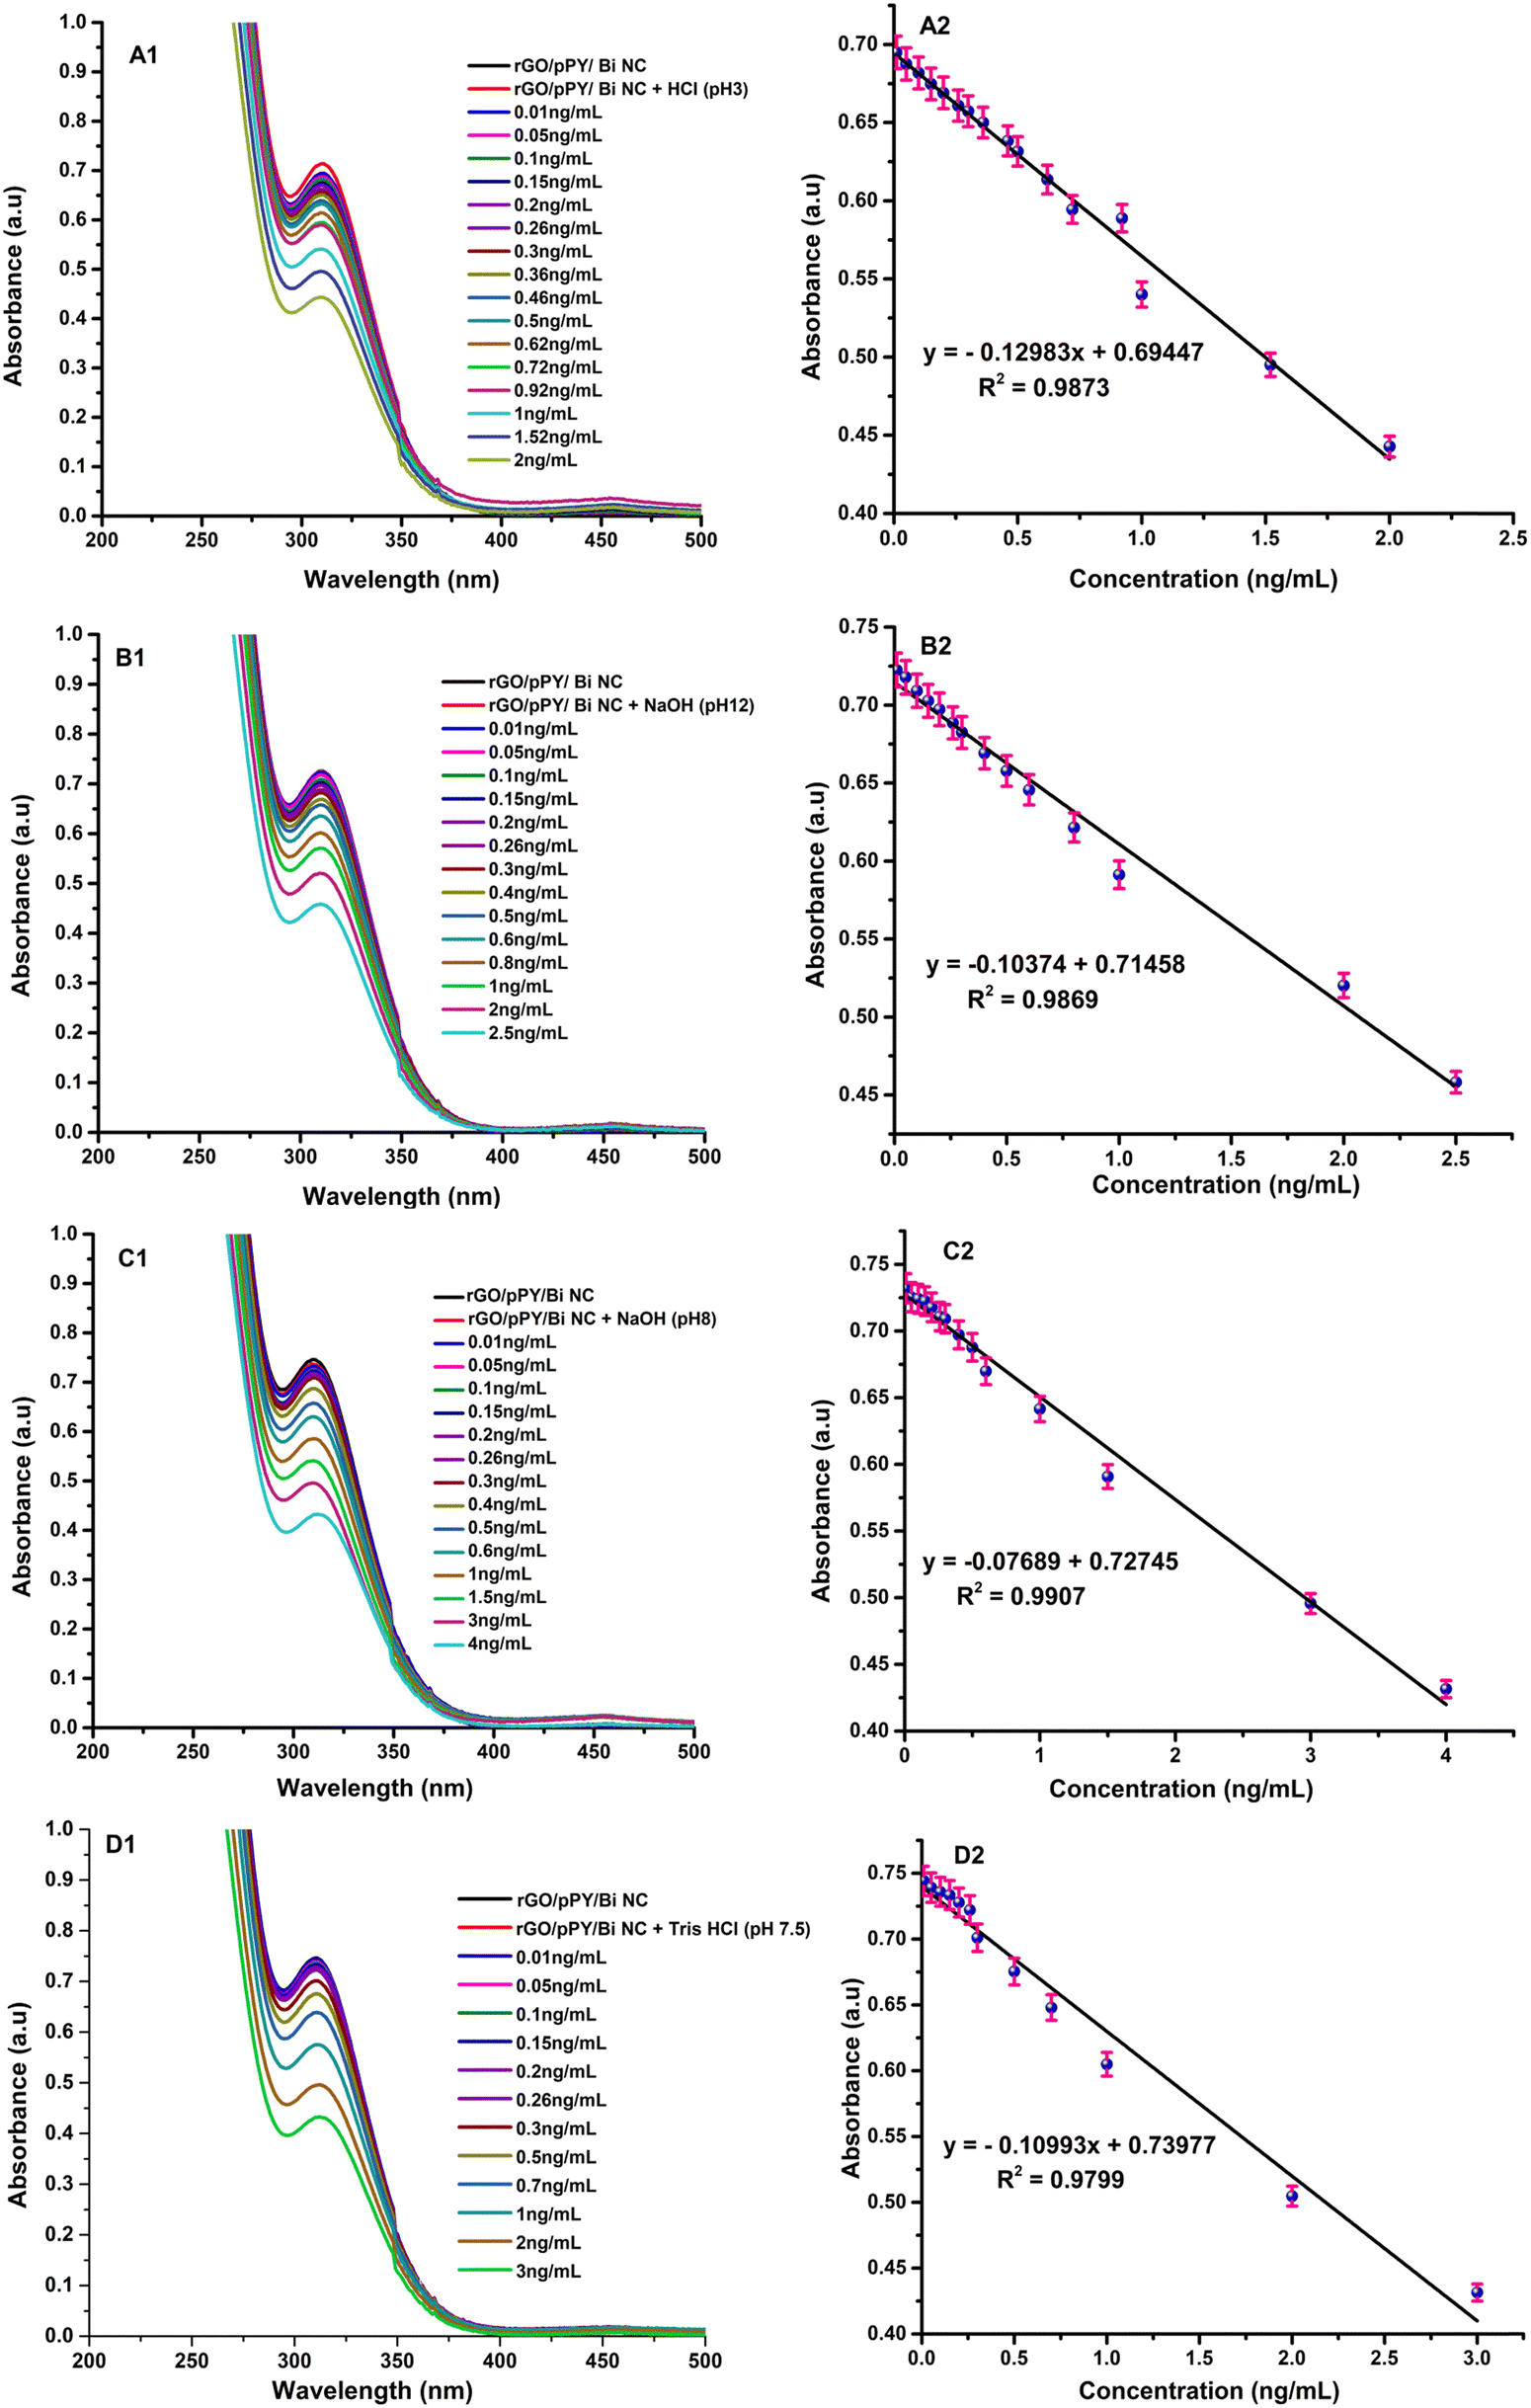
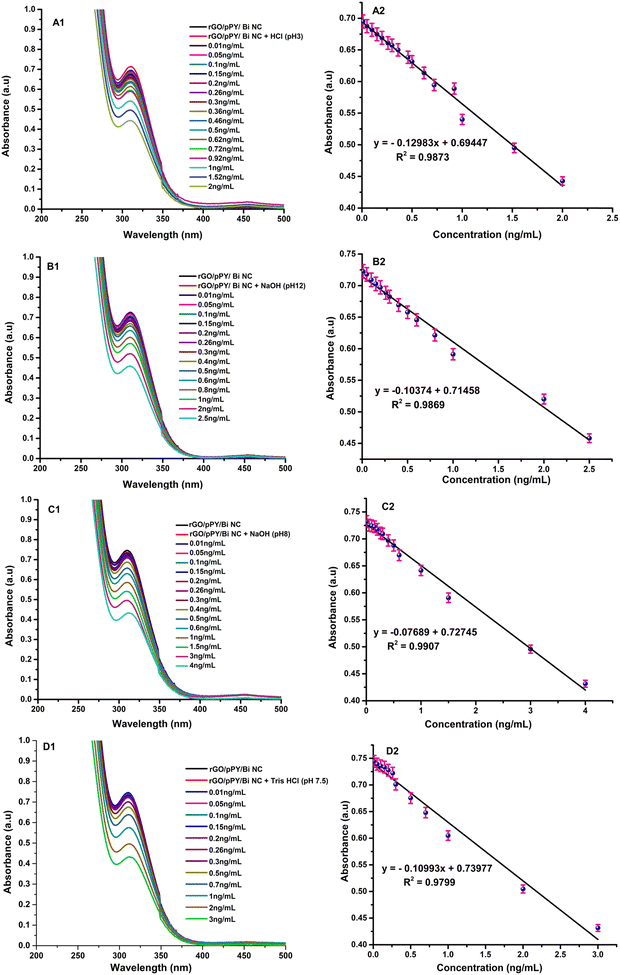
The analytical characteristics (linear range, limit of detection (LOD), limit of quantification (LOQ)) of the developed GO based nanocomposite (rGO/pPy Bi NC) were evaluated using the recommended procedure under optimum conditions. The analytical figures of merit for the determination of VK1, VK2, VB6 and VD3 are listed in Tables 2–5, respectively. The linear range of 0.29–2 ng mL−1, 0.3–2.5 ng mL−1, 0.38–4 ng mL−1, and 0.48–3 ng mL−1 were obtained for VK1, VK2, VB6, and VD3, respectively. It was observed that the absorption peak of rGO/pPy/Bi NC was continuously declining with increasing concentration of VK1, VK2, VB6, and VD3. Fig. 11(A)–(D) exhibits the UV-vis spectra of rGO/pPy/Bi NC along with the linear calibration graphs of VK1, VK2, VB6, and VD3, respectively. A good linearity was obtained with a coefficient of determination (R2) of 0.988, 0.988, 0.991, and 0.982 for VK1, VK2, VB6, and VD3, respectively.68,69 LODs for the developed rGO/pPy/Bi NC based optical sensing methods were found to be 0.075 ng mL−1, 0.1 ng mL−1, 0.12 ng mL−1, and 0.15 ng mL−1 for VK1, VK2, VB6 and VD3, respectively. However, the LOQs for the developed rGO/pPy/Bi NC based methods were found to be 0.29 ng mL−1, 0.3 ng mL−1, 0.38 ng mL−1, and 0.48 ng mL−1 for VK1, VK2, VB6, and VD3, respectively. The developed optical methods were also compared with the other sensing materials and methods as shown in Table 6. It was revealed that the prepared sensing material rGO/pPy/Bi NC is capable of sensing multiple vitamins optically in different electrolytes. Moreover, the developed analytical methods are highly sensitive and selective. The other reported methods were based on the electrochemical detection and most of the methods are capable of sensing only one vitamin. The present study utilized optical sensing for the detection of four different vitamins using a single smart nanocomposite. Further, the LOD and LOQ values of the developed methods suggested that they are highly sensitive and can be used for monitoring the levels of vitamin K1, K2, B6, and D3 in human blood.
Table 2 Analytical figures of merit for determination of VK1 using rGO/pPy/Bi NC
| S. no. |
List of analytical figures |
Values |
| 1. |
LOD |
0.075 ng mL−1 |
| 2. |
LOQ |
0.29 ng mL−1 |
| 3. |
Linear range |
0.29 ng mL−1 to 2 ng mL−1 |
| 4. |
Slope |
0.129 |
| 5. |
Intercept |
0.69 |
| 6. |
Linearity (R2) |
0.998 |
|
|
| 7. |
Intra-day precision |
|
| a. |
0.29 ng mL−1 (n = 3) |
0.14 |
| b. |
0.62 ng mL−1 (n = 3) |
0.16 |
| c. |
2 ng mL−1 (n = 3) |
0.22 |
|
|
| 8. |
Inter-day precision |
|
| a. |
0.29 ng mL−1 (n = 3) |
0.15 |
| b. |
0.62 ng mL−1 (n = 3) |
0.14 |
| c. |
2 ng mL−1 (n = 3) |
0.21 |
Table 3 Analytical figures of merit for determination of VK2 using rGO/pPy/Bi NC
| S. no. |
List of analytical figures |
Values |
| 1. |
LOD |
0.10 ng mL−1 |
| 2. |
LOQ |
0.30 ng mL−1 |
| 3. |
Linear range |
0.3 ng mL−1 to 2.5 ng mL−1 |
| 4. |
Slope |
0.1037 |
| 5. |
Intercept |
0.71 |
| 6. |
Linearity (R2) |
0.9879 |
|
|
| 7. |
Intra-day precision |
|
| a. |
0.3 ng mL−1 (n = 3) |
0.13 |
| b. |
0.8 ng mL−1 (n = 3) |
0.16 |
| c. |
2.5 ng mL−1 (n = 3) |
0.20 |
|
|
| 8. |
Inter-day precision |
|
| a. |
0.3 ng mL−1 (n = 3) |
0.16 |
| b. |
0.8 ng mL−1 (n = 3) |
0.17 |
| c. |
2.5 ng mL−1 (n = 3) |
0.24 |
Table 4 Analytical figures of merit for determination of VB6 using rGO/pPy/Bi NC
| S. no. |
List of analytical figures |
Values |
| 1. |
LOD |
0.12 ng mL−1 |
| 2. |
LOQ |
0.38 ng mL−1 |
| 3. |
Linear range |
0.38 ng mL−1 to 4 ng mL−1 |
| 4. |
Slope |
0.076 |
| 5. |
Intercept |
0.72 |
| 6. |
Linearity |
0.99 |
|
|
| 7. |
Intra-day precision |
|
| a. |
0.4 ng mL−1 (n = 3) |
0.24 |
| b. |
2 ng mL−1 (n = 3) |
0.16 |
| c. |
4 ng mL−1 (n = 3) |
0.36 |
|
|
| 8. |
Inter-day precision |
|
| a. |
0.4 ng mL−1 (n = 3) |
0.14 |
| b. |
2 ng mL−1 (n = 3) |
0.15 |
| c. |
4 ng mL−1 (n = 3) |
0.23 |
Table 5 Analytical figures of merit for determination of VD3 using rGO/pPy/Bi NC
| S. no. |
List of analytical figures |
Values |
| 1. |
LOD |
0.15 ng mL−1 |
| 2. |
LOQ |
0.48 ng mL−1 |
| 3. |
Linear range |
0.48 ng mL−1 to 3 ng mL−1 |
| 4. |
Slope |
0.1099 |
| 5. |
Intercept |
0.74 |
| 6 |
Linearity |
0.98 |
|
|
| 7. |
Intra-day precision |
|
| a. |
0.5 ng mL−1 (n = 3) |
0.14 |
| b. |
1.5 ng mL−1 (n = 3) |
0.22 |
| c. |
3 ng mL−1 (n = 3) |
0.23 |
|
|
| 8. |
Inter-day precision |
|
| a. |
0.5 ng mL−1 (n = 3) |
0.15 |
| b. |
1.5 ng mL−1 (n = 3) |
0.19 |
| c. |
3 ng mL−1 (n = 3) |
0.24 |
 |
| | Fig. 11 Calibration curves of (A1) vitamin K1, (B1) vitamin K2, (C1) vitamin B6 and (D1) vitamin D3 and linear plot of (A2) vitamin K1, (B2) vitamin K2, (C2) vitamin B6 and (D2) vitamin D3 obtained at different concentrations using rGO/pPy/Bi NC in respective acid, base, and buffer solutions. | |
Table 6 Comparison of rGO/pPY/Bi NC with the reported sensor
| Method |
Analyte |
LOD (ng mL−1) |
Sensing material |
Ref. |
| SWV |
VK1 |
5.2 |
PGE/AgNPs/2-A-5-CBP |
63
|
| HPLC-MS/MS (ESI) |
VK1 |
0.05 |
|
70
|
| SWAdSV |
|
11.3 |
GCE |
71
|
| Thermal wave transport analysis |
VK1 |
90.14 |
MIP |
72
|
| DP AdSV |
VK2 |
0.009 |
Refreshable silver liquid amalgam film multi-electrode (RAgLAFm-E) |
73
|
| SWASV |
K1, K2 |
99 |
Screen-printed graphene electrode |
74
|
| DPV |
VD3 |
69.2 |
AuPd |
75
|
| SWV |
VD3 |
3.8E−4 |
MIP-SPCE |
76
|
| Electrochemical |
VD3 |
0.96 |
NiNPs-CuNPs-reduced-fullerene-C60/GCE |
77
|
| Electrochemical |
VD3 |
6.1E−3 |
NCNT/GCE |
78
|
| Portable electrochemical aptasensor |
VD3 |
0.84 |
GQD-Au |
79
|
| Colorimetric aptasensor |
VD3 |
385 |
AuNP |
80
|
| Electrochemical |
VB6 |
135 |
ZnO/CuO nanosheets, ionic liquids and 2-(ferrocenylethynyl)fluoren-9-one/CPE |
81
|
| SWV |
VB6 |
17 |
ZrO2/NPs/IL/CPE |
82
|
| DPV |
VB6 |
1.4 and 795 |
44-DABP/GC |
83
|
| Electrochemical |
VB6 |
0.5 |
GC/(ILC-CNTs)/CuO |
84
|
| Optical sensor |
VK1 |
0.075 |
rGO/pPY/BiNC |
Present work |
| VK2 |
0.1 |
| VD3 |
0.15 |
| VB6 |
0.12 |
3.7. Determination of vitamins K1, K2, B6 and D3 in human blood serum/plasma
The newly developed rGO/pPy/Bi NC based optical sensor was employed for the selective determination of VK1, VK2, VB6, and VD3 in human blood serum or plasma samples. Determinations of vitamins in blood (serum/plasma) samples were done by the standard addition method. The sample of serum/plasma was diluted twofold. Then, for determination of VK1 and VK2, samples of serum were spiked with known concentrations of VK1 and VK2 separately (Tables 7 and 8). Likewise for the determination of VB6 and VD3, samples of plasma were spiked with known concentrations of VB6 and VD3 separately (Tables 9 and 10). The estimated VK1, VK2, VB6 and VD3 recoveries in blood serum/plasma are given in Table 7 and Tables 8–10, respectively. The obtained results of recovery percent revealed that the prepared rGO/pPy/Bi NC is capable of sensing VK1, VK2, VB6 and VD3 even in the complex blood matrix without compromising its selectivity and sensing efficiency.
Table 7 The estimated amount of VK1 and recoveries % in spiked blood serum of different volunteers
| VK1 added (ng mL−1) |
Sample 1 recovery (%) |
Detected (ng mL−1) |
Sample 2 recovery (%) |
Detected (ng mL−1) |
Sample 3 recovery (%) |
Detected (ng mL−1) |
Sample 4 recovery (%) |
Detected (ng mL−1) |
Sample 5 recovery (%) |
Detected (ng mL−1) |
| 0.3 |
104 |
0.31 |
105 |
0.32 |
96 |
0.29 |
103 |
0.31 |
105 |
0.32 |
| 0.5 |
105 |
0.53 |
106 |
0.53 |
97 |
0.48 |
102 |
0.51 |
107 |
0.54 |
| 0.7 |
105 |
0.73 |
106 |
0.74 |
99 |
0.69 |
105 |
0.74 |
106 |
0.74 |
| 0.9 |
102 |
0.92 |
109 |
0.98 |
96 |
0.86 |
101 |
0.91 |
108 |
0.97 |
| 1.5 |
107 |
1.61 |
108 |
1.62 |
92 |
1.38 |
101 |
1.52 |
106 |
1.59 |
| 1.75 |
106 |
1.85 |
114 |
1.99 |
98 |
1.72 |
106 |
1.86 |
110 |
1.93 |
| 2 |
116 |
2.32 |
116 |
2.32 |
99 |
1.98 |
109 |
2.18 |
115 |
2.3 |
Table 8 The estimated amount of VK2 and recoveries % in spiked blood serum of different volunteers
| VK2 added (ng mL−1) |
Sample 1 recovery (%) |
Detected (ng mL−1) |
Sample 2 recovery (%) |
Detected (ng mL−1) |
Sample 3 recovery (%) |
Detected (ng mL−1) |
Sample 4 recovery (%) |
Detected (ng mL−1) |
Sample 5 recovery (%) |
Detected (ng mL−1) |
| 0.3 |
98 |
0.29 |
91 |
0.27 |
92 |
0.28 |
98 |
0.29 |
102 |
0.31 |
| 0.5 |
97 |
0.48 |
98 |
0.49 |
96 |
0.48 |
96 |
0.48 |
105 |
0.52 |
| 1 |
96 |
0.96 |
93 |
0.93 |
97 |
0.97 |
97 |
0.97 |
103 |
1.03 |
| 1.75 |
95 |
1.66 |
91 |
1.59 |
92 |
1.61 |
93 |
1.63 |
102 |
1.8 |
| 2 |
99 |
1.98 |
95 |
1.9 |
88 |
1.76 |
92 |
1.84 |
101 |
2.02 |
| 2.25 |
99 |
2.23 |
96 |
2.16 |
90 |
2.02 |
93 |
2.1 |
104 |
2.34 |
| 2.5 |
102 |
2.55 |
98 |
2.45 |
93 |
2.32 |
95 |
2.4 |
106 |
2.65 |
Table 9 The estimated amount of VB6 and recoveries % in spiked blood plasma of different volunteers
| VB6 added (ng mL−1) |
Sample 1 recovery (%) |
Detected (ng mL−1) |
Sample 2 recovery (%) |
Detected (ng mL−1) |
Sample 3 recovery (%) |
Detected (ng mL−1) |
Sample 4 recovery (%) |
Detected (ng mL−1) |
Sample 5 recovery (%) |
Detected (ng mL−1) |
| 0.4 |
91 |
0.36 |
98 |
0.39 |
95 |
0.38 |
97 |
0.39 |
101 |
0.40 |
| 0.6 |
92 |
0.55 |
98 |
0.59 |
98 |
0.59 |
99 |
0.59 |
91 |
0.55 |
| 0.8 |
91 |
0.73 |
97 |
0.78 |
94 |
0.75 |
96 |
0.77 |
93 |
0.74 |
| 1 |
91 |
0.91 |
94 |
0.94 |
93 |
0.93 |
95 |
0.95 |
93 |
0.93 |
| 2 |
92 |
1.84 |
98 |
1.96 |
98 |
1.96 |
109 |
2.18 |
95 |
1.9 |
| 3 |
102 |
3.06 |
103 |
3.1 |
107 |
3.21 |
107 |
3.21 |
107 |
3.21 |
| 4 |
107 |
4.28 |
106 |
4.24 |
110 |
4.4 |
104 |
4.16 |
115 |
4.6 |
Table 10 The estimated amount of VD3 and recoveries % in spiked blood plasma of different volunteers
| VD3 added (ng mL−1) |
Sample 1 recovery (%) |
Detected (ng mL−1) |
Sample 2 recovery (%) |
Detected (ng mL−1) |
Sample 3 recovery (%) |
Detected (ng mL−1) |
Sample 4 recovery (%) |
Detected (ng mL−1) |
Sample 5 recovery (%) |
Detected (ng mL−1) |
| 0.5 |
93 |
0.46 |
98 |
0.49 |
93 |
0.46 |
95 |
0.47 |
94 |
0.47 |
| 0.75 |
95 |
0.71 |
97 |
0.73 |
93 |
0.69 |
95 |
0.71 |
95 |
0.71 |
| 1 |
96 |
0.96 |
95 |
0.95 |
92 |
0.92 |
91 |
0.91 |
94 |
0.94 |
| 1.5 |
93 |
1.39 |
96 |
1.44 |
90 |
1.35 |
93 |
1.39 |
97 |
1.45 |
| 2 |
103 |
2.06 |
99 |
1.98 |
87 |
1.74 |
90 |
1.8 |
96 |
1.92 |
| 2.5 |
109 |
2.72 |
113 |
2.82 |
95 |
2.37 |
98 |
2.45 |
103 |
2.57 |
| 3 |
119 |
3.57 |
116 |
3.48 |
104 |
3.12 |
103 |
3.09 |
110 |
3.3 |
3.8. Validation and reproducibility of the developed sensor
The validation of rGO/pPy Bi NC was evaluated by recording the absorbance response of 0.5 ng mL−1 of VK1, VK2, VB6, and VD3 at different time periods on the same day and at different time intervals for more than 1 month. The percent relative standard deviation (%RSD) was found to be 0.17%, 0.16%, 0.25%, and 0.19% for VK1, VK2, VB6, and VD3, respectively. These results suggested that, the developed optical sensor exhibited long term stability when exposed to the corresponding analyte (vitamins). The reproducibility was calculated by performing the intra-day (recording the absorbance response of the analyte at three different times in a day) and inter-day (recording the absorbance response of the analyte on three different days) study of the developed sensor for determination of vitamins (VK1, VK2, VD3, and VB6) (Tables 2–5). The absorbance response was recorded repeatedly three times in a day for three consecutive days at different concentrations of VK1 (0.29, 0.62, and 2 ng mL−1), VK2 (0.3, 0.8, and 2.5 ng mL−1), VB6 (0.4, 2, and 4 ng mL−1), and VD3 (0.5, 1.5, and 3 ng mL−1). The maximum variation in the absorbance response of analytes VK1, VK2, VB6, and VD3 in terms of percent RSD is given in Tables 2–5. The calculated percent RSD values did not exceed 1%. These results confirmed that the rGO/pPy/Bi NC sensor has excellent reproducibility in sensing the vitamins K1, K2, B6, and D3.
4. Conclusion
Graphene-based nanocomposites are cost effective, easily fabricated and remarkable in terms of their optical and electronic properties. The current study presents a one pot synthesis of reduced graphene oxide coated with polypyrrole embedded with Bi nanoparticles (rGO/pPY/Bi NC). The synergistic effect of these three materials turns rGO/pPy/Bi NC into a smart pH sensitive sensing material that can optically sense four different vitamins, i.e. VK1, VK2, VB6 and VD3, in different electrolytes up to the trace levels. When it comes to the sensing of vitamins, they are mostly determined using electrochemical sensing methods and reports on their optical sensing are scarce. Moreover, reports on sensing multiple vitamins using a single sensing material are also rare. Quantification of vitamins for the assessment of human health is very important to take early precautions. Therefore, this study presented four analytical methods based on optical sensing of VK1, VK2, VB6 and VD3 using rGO/pPY/Bi NC. All the optical methods were thoroughly validated for their precision (inter- and intraday), reproducibility and reliability. The developed methods were capable of detecting selected vitamins specifically at concentrations as low as ng mL−1 even in the complex matrix of human blood (serum and plasma). The prepared rGO/pPy/Bi NC was also thoroughly characterized for its composition and structural properties using different analytical techniques. It is concluded that the disclosed material holds significant clinical utility for evaluating the vitamin level in patients using cost effective UV-vis spectroscopy. The developed methods are user friendly and any clinical lab worker can easily perform the vitamin evaluation tests.
Conflicts of interest
All the authors of this manuscript declare that there is no conflict of interest related to the research work presented in this manuscript.
Acknowledgements
This research work was carried out under the HEC Funding Project No. 9576/Sindh/NRPU/R&D/HEC/2017. The authors are highly grateful to Pakistan Higher Education Commission for their financial support to carry out this research.
References
- J. Thangphatthanarungruang,
et al., A Novel Electrochemical Sensor for the Simultaneous Determination of Fat-Soluble Vitamins Using a Screen-Printed Graphene/Nafion Electrode, Key Eng. Mater., 2018, 777, 597–601 Search PubMed.
- K. Shrivas,
et al., Sucrose capped gold nanoparticles as a plasmonic chemical sensor based on non-covalent interactions: Application for selective detetiction of vitamins B1 and B6 in brown and white rice food samples, Food Chem., 2018, 250, 14–21 CrossRef CAS PubMed.
- D. Çimen and A. Denizli, Development of rapid, sensitive, and effective plasmonic nanosensor for the detection of vitamins in infact formula and milk samples, Photonic Sens., 2020, 10, 316–332 CrossRef.
- D. Kiamiloglou and S. Girousi, Different Aspects of the Voltammetric Detection of Vitamins: A Review, Biosensors, 2023, 13(6), 651 CrossRef CAS PubMed.
- L. Huang,
et al., Electrochemical vitamin sensors: A critical review, Talanta, 2021, 222, 121645 CrossRef CAS PubMed.
- B. R. Khalkho,
et al., L-cysteine modified silver nanoparticles for selective and sensitive colorimetric detection of vitamin B1 in food and water samples, Heliyon, 2020, 6 Search PubMed.
- E. Martínez-Moneo,
et al., Deficiency of fat-soluble vitamins in chronic pancreatitis: A systematic review and meta-analysis, Pancreatology, 2016, 16(6), 988–994 CrossRef PubMed.
- R. Tabassum and B. D. Gupta, Simultaneous estimation of vitamin K1 and heparin with low limit of detection using cascaded channels fiber optic surface plasmon resonance, Biosens. Bioelectron., 2016, 86, 48–55 CrossRef CAS PubMed.
- W. C. Byrdwell, Comparison of Analysis of Vitamin D3 in Foods Using Ultraviolet and Mass Spectrometric Detection, J. Agric. Food Chem., 2009, 57(6), 2135–2146 CrossRef CAS PubMed.
- W. C. Byrdwell,
et al., Liquid chromatography with ultraviolet and dual parallel mass spectrometric detection for analysis of vitamin D in retail fortified orange juice, J. Food Compos. Anal., 2011, 24(3), 299–306 CrossRef CAS.
- T.-T. Liu,
et al., Simultaneous profiling of vitamin D metabolites in serum by supercritical fluid chromatography-tandem mass spectrometry (SFC-MS/MS), J. Chromatogr. B, 2019, 1120, 16–23 CrossRef CAS PubMed.
- N. Ali, Role of vitamin D in preventing of COVID-19 infection, progression and severity, J. infect. public health, 2020, 13(10), 1373–1380 CrossRef PubMed.
- N. Alpar,
et al., Voltammetric method for the simultaneous determination of melatonin and pyridoxine in dietary supplements using a cathodically pretreated boron-doped diamond electrode, Electroanalysis, 2017, 29(7), 1691–1699 CrossRef CAS.
- M. Fusaro,
et al., Low vitamin K1 intake in haemodialysis patients, Clin. Nutr., 2017, 36(2), 601–607 CrossRef CAS PubMed.
- S. Liu,
et al., Resonance Rayleigh-Scattering Method for the Determination of Vitamin B1 with Methyl Orange, Anal. Sci., 2002, 18(9), 971–976 CrossRef CAS PubMed.
- A. Zafra-Gómez,
et al., Simultaneous determination of eight water-soluble vitamins in supplemented foods by liquid chromatography, J. Agric. Food Chem., 2006, 54(13), 4531–4536 CrossRef PubMed.
- A. Kumari, V. Vyas and S. Kumar, Advances in electrochemical and optical sensing techniques for vitamins detection: a review, ISSS J. Micro. Smart Syst., 2021, 1–13 CAS.
- A. Kumari, V. Vyas and S. Kumar, Advances in electrochemical and optical sensing techniques for vitamins detection: A review, ISSS J. Micro. Smart Syst., 2022, 11(1), 329–341 CrossRef PubMed.
- T. Sarkar, H. Bohidar and P. R. Solanki, Carbon dots-modified chitosan based electrochemical biosensing platform for detection of vitamin D, Int. J. Biol. Macromol., 2018, 109, 687–697 CrossRef CAS PubMed.
- M. Khalife,
et al., Electrochemical biosensor based on NAD (P) H-dependent Quinone Reductase for rapid and efficient detection of vitamin K3, Food Chem., 2024, 433, 137316 CrossRef CAS PubMed.
- P. M. Jahani, M. Jafari and S. A. Ahmadi, Voltammetric determination of vitamin B6 in the presence of vitamin C based on zinc ferrite nano-particles modified screen-printed graphite electrode, Admet and Dmpk, 2023, 11(2), 251–261 Search PubMed.
- F. Mohanty and S. K. Swain, Silver nanoparticles decorated polyethylmethacrylate/graphene oxide composite: as packaging material, Polym. Compos., 2019, 40(S2), E1199–E1207 CAS.
- M. Šimšíková,
et al., Green approach for preparation of reduced graphene oxide decorated with gold nanoparticles and its optical and catalytic properties, Mater. Chem. Phys., 2016, 177, 339–345 CrossRef.
- M. Soylak, M. Jagirani and F. Uzcan, Metal-doped Magnetic Graphene Oxide Nanohybrid for Solid-phase 2 Microextraction of Copper from Environmental Samples, Iran. J. Sci. Technol., Trans. A: Sci., 2022, 46 Search PubMed.
- A. H. Kori, M. S. Jagirani and M. Soylak, Graphene-Based Nanomaterials: A Sustainable Material for Solid-Phase Microextraction (SPME) for Environmental Applications, Anal. Lett., 2023, 1–16 Search PubMed.
- C. Tharamani, H. Thejaswini and S. Sampath, Synthesis of size-controlled Bi particles by electrochemical deposition, Bull. Mater. Sci., 2008, 31(3), 207–212 CrossRef CAS.
- M. Imran,
et al., Polyvinylpyrrolidone and chitosan-coated magnetite (Fe3O4) nanoparticles for catalytic and antimicrobial activity with molecular docking analysis, J. Environ. Chem. Eng., 2023, 11(3), 110088 CrossRef.
- C. M. Bedoya Hincapie,
et al., Physical-chemical properties of bismuth and bismuth oxides: Synthesis, characterization and applications, Dyna, 2012, 79(176), 139–148 Search PubMed.
- L. Shahriary and A. A. Athawale, Graphene oxide synthesized by using modified hummers approach, Int. J. Renew. Energy Environ. Eng., 2014, 2(01), 58–63 Search PubMed.
- D. Ma,
et al., Synthesis of bismuth nanoparticles and self-assembled nanobelts by a simple aqueous route in basic solution, Colloids Surf., A, 2012, 395, 276–283 CrossRef CAS.
- S. Ahmed,
et al., A composite of imprinted polypyrrole beads and reduced graphene oxide for specific electrochemical sensing of atrazine in complex matrices, Monatsh. Chem., 2020, 151(8), 1271–1282 CrossRef CAS.
- W.-P. Xu,
et al., Facile synthesis of silver@ graphene oxide nanocomposites and their enhanced antibacterial properties, J. Mater. Chem., 2011, 21(12), 4593–4597 RSC.
- L. Tao,
et al., Silver nanoparticle-decorated graphene oxide for surface-enhanced Raman scattering detection and optical limiting applications, J. Mater. Sci., 2018, 53(1), 573–580 CrossRef CAS.
- S. Morimune, T. Nishino and T. Goto, Poly (vinyl alcohol)/graphene oxide nanocomposites prepared by a simple eco-process, Polym. J., 2012, 44(10), 1056–1063 CrossRef CAS.
- K. Petsom,
et al., The effect of additive chemicals on synthesis of bismuth nanoparticles, Mater. Today: Proc., 2018, 5(6), 14057–14062 CAS.
- D. Leng,
et al., Plasmonic Bismuth Nanoparticles: Thiolate Pyrolysis Synthesis, Size-Dependent LSPR Property, and Their Oxidation Behavior, Inorg. Chem., 2021, 60(22), 17258–17267 CrossRef CAS PubMed.
- Y. Tian and J. Toudert, Nanobismuth: Fabrication, Optical, and Plasmonic Properties—Emerging Applications, J. Nanotechnol., 2018, 2018, 3250932 Search PubMed.
- J. Chen,
et al., Electronic and optical properties of pyrrole and thiophene oligomers: A density functional theory study, Int. J. Quantum Chem., 2017, 117(24), e25453 CrossRef.
- C. Manoratne, S. Rosa and I. Kottegoda, XRD-HTA, UV visible, FTIR and SEM interpretation of reduced graphene oxide synthesized from high purity vein graphite, Mater. Sci. Res. India, 2017, 14(1), 19–30 CAS.
-
S. R. B. Nazri
et al., Synthesis, characterization and study of graphene oxide, in AIP Conference Proceedings, AIP Publishing LLC, 2018 Search PubMed.
- M. Maruthapandi and A. Gedanken, A short report on the polymerization of pyrrole and its copolymers by sonochemical synthesis of fluorescent carbon dots, Polymers, 2019, 11(8), 1240 CrossRef PubMed.
- Z. Ahmad,
et al., Synthesis of polypyrrole nano/microspheres using cobalt(III) as an oxidizing agent and its ammonia sensing behavior, Macromol. Res., 2016, 24, 596–601 CrossRef CAS.
- M. Abbasian, N. K. Aali and S. E. Shoja, Synthesis of Poly (methyl methacrylate)/Zinc Oxide Nanocomposite with Core-Shell Morphology by Atom Transfer Radical Polymerization, J. Macromol. Sci., Part A, 2013, 50(9), 966–975 CrossRef CAS.
- Z. Yi,
et al., Surface-Plasmon-Enhanced Band Emission and Enhanced Photocatalytic Activity of Au Nanoparticles-Decorated ZnO Nanorods, Plasmonics, 2015, 10(6), 1373–1380 CrossRef CAS.
- T. Das, S. Patra and R. Madhuri, Bismuth Oxide Decorated Graphene Oxide Nanocomposites synthesized via Sonochemical Assisted Hydrothermal Method for Adsorption of Cationic Organic Dyes, J. Colloid Interface Sci., 2017, 509 Search PubMed.
- H. Yang,
et al., Uniform Decoration of Reduced Graphene Oxide Sheets with Gold Nanoparticles, J. Nanotechnol., 2012, 2012, 328565 Search PubMed.
- H. Yang,
et al., Uniform decoration of reduced graphene oxide sheets with gold nanoparticles, J. Nanotechnol., 2012, 2012 Search PubMed.
- M. Rodner,
et al., Graphene Decorated with Iron Oxide Nanoparticles for Highly Sensitive Interaction with Volatile Organic Compounds, Sensors, 2019, 19(4), 918 CrossRef PubMed.
- E. L. Albert, C. A. C. Abdullah and Y. Shiroshaki, Synthesis and characterization of graphene oxide functionalized with magnetic nanoparticle via simple emulsion method, Results Phys., 2018, 11, 944–950 CrossRef.
- N. Zaaba,
et al., Synthesis of graphene oxide using modified hummers method: solvent influence, Procedia Eng., 2017, 184, 469–477 CrossRef CAS.
-
J. Fang
et al., Colloidal Bismuth Nanoparticles: Synthesis and UV-Vis Absorption, in Cluster and Nanostructure Interfaces, World Scientific, 2000, pp. 91–96 Search PubMed.
- L. Kabir and S. K. Mandal, Structural and optical properties of single crystalline bismuth nanoparticles in polymer, Int. J. Mod. Phys.: Conf. Ser., 2013, 22, 654–659 CAS.
- M. Ikram,
et al., Assessment of catalytic, antimicrobial and molecular docking analysis of starch-grafted polyacrylic acid doped BaO nanostructures, Int. J. Biol. Macromol., 2023, 230, 123190 CrossRef CAS PubMed.
- S. Shrikrushna, J. A. Kher and M. V. Kulkarni, Influence of dodecylbenzene sulfonic acid doping on structural, morphological, electrical and optical properties on polypyrrole/3C-SiC nanocomposites, J. Nanomed. Nanotechnol., 2015, 6(5), 1 Search PubMed.
- M. Ikram,
et al., Synthesis of Al/starch co-doped in CaO nanoparticles for enhanced catalytic and antimicrobial activities: experimental and DFT approaches, RSC Adv., 2022, 12(50), 32142–32155 RSC.
- I. Kondratowicz, M. Nadolska and K. Żelechowska, Reduced Graphene Oxide Joins Graphene Oxide to Teach Undergraduate Students Core Chemistry and Nanotechnology Concepts, J. Chem. Educ., 2018, 95(6), 1012–1017 CrossRef CAS.
- R. V. Tolentino-Hernandez,
et al., One-step, low temperature synthesis of reduced graphene oxide decorated with ZnO nanocrystals using galvanized iron steel scrap, Mater. Res. Express, 2021, 8(6), 065010 CrossRef CAS.
- A. Khorsand Zak,
et al., X-ray analysis of ZnO nanoparticles by Williamson–Hall and size–strain plot methods, Solid State Sci., 2011, 13(1), 251–256 CrossRef CAS.
- S. K. Abdel-Aal,
et al., structure investigation by neutron diffraction and x-ray diffraction of graphene nanocomposite CuO–rGO prepared by low-cost method, Phys. Status Solidi A, 2021, 218(12), 2100138 CrossRef CAS.
- A. Gholizadeh, Structural and mechanical properties of AFe2O4 (A= Zn, Cu0. 5Zn0. 5, Ni0. 3Cu0. 2Zn0. 5) nanoparticles prepared by citrate method at low temperature, J. Nanoanal., 2018, 5(1), 7–16 Search PubMed.
- V. Mote, Y. Purushotham and B. Dole, Williamson-Hall analysis in estimation of lattice strain in nanometer-sized ZnO particles, J. Theor. Appl. Phys., 2012, 6, 1–8 CrossRef.
- H. Safardoust-Hojaghan,
et al., Synthesis of micro sphere-like bismuth nanoparticles by microwave assisted polyol method; designing a novel electrochemical nanosensor for ultra-trace measurement of Pb 2+ ions, New J. Chem., 2015, 39(6), 4676–4684 RSC.
- S. Rostami-Javanroudi and A. Babakhanian, New electrochemical sensor for direct quantification of vitamin K in human blood serum, Microchem. J., 2021, 163, 105716 CrossRef CAS.
- J. F. Sun,
et al., CdTe quantum dots as fluorescence sensor for the determination of vitamin B6 in aqueous solution, Chin. Chem. Lett., 2008, 19(7), 855–859 CrossRef CAS.
- A. Moustafa,
et al., Electrochemical determination of vitamin B6 (pyridoxine) by reformed carbon paste electrode with iron oxide nanoparticles, Ionics, 2022, 28(9), 4471–4484 CrossRef CAS.
- S. Sirajudeen, I. Shah and A. Al Menhali, A Narrative Role of Vitamin D and Its Receptor: With Current Evidence on the Gastric Tissues, Int. J. Mol. Sci., 2019, 20, 3832 CrossRef PubMed.
- S. Alharthi, M. Attia and M. Abou-Omar, pH assists simultaneous determination of folic acid and vitamin D 3 in biological fluids using a novel Tb 3 +/–acyclovir optical biosensor, RSC Adv., 2021, 11(34), 20865–20873 RSC.
- K. Farhadi,
et al., Highly selective Hg2+ colorimetric sensor using green synthesized and unmodified silver nanoparticles, Sens. Actuators, B, 2012, 161(1), 880–885 CrossRef CAS.
- K. Shrivas,
et al., Sucrose capped gold nanoparticles as a plasmonic chemical sensor based on non-covalent interactions: Application for selective detection of vitamins B1 and B6 in brown and white rice food samples, Food Chem., 2018, 250, 14–21 CrossRef CAS PubMed.
- Y. Xu,
et al., Extraction and Determination of Vitamin K1 in Foods by Ultrasound-Assisted Extraction, SPE, and LC-MS/MS, Molecules, 2020, 25(4), 839 CrossRef CAS PubMed.
- G. Kastrati,
et al., Simultaneous Determination of Vitamin E and Vitamin K in Food Supplements Using Adsorptive Stripping Square-Wave Voltammetry at Glassy Carbon Electrode, Appl. Sci., 2020, 10(14), 4759 CrossRef CAS.
- K. Eersels,
et al., A novel biomimetic tool for assessing vitamin K status based on molecularly imprinted polymers, Nutrients, 2018, 10(6), 751 CrossRef PubMed.
- K. Jedlińska, M. Strus and B. Baś, A new electrochemical sensor with the Refreshable Silver Liquid Amalgam Film multi-Electrode for sensitive voltammetric determination of vitamin K2 (menaquinone), Electrochim. Acta, 2018, 265, 355–363 CrossRef.
- W. Jesadabundit,
et al., Simple and Cost-Effective Electrochemical Approach for Monitoring of Vitamin K in Green Vegetables, ChemElectroChem, 2020, 7(1), 155–162 CrossRef CAS.
- K. Men,
et al., Electrochemical detection of vitamin D2 and D3 Based on a AuPd modified glassy carbon electrode, Int. J. Electrochem. Sci., 2017, 12(10), 9555–9564 CrossRef CAS.
- S. Kia, S. Bahar and S. Bohlooli, A novel electrochemical sensor based on plastic antibodies for vitamin D3 detection in real samples, IEEE Sens. J., 2019, 19(13), 4752–4757 CAS.
- T. Anusha,
et al., Designing and fabrication of electrochemical nanosensor employing fullerene-C60 and bimetallic nanoparticles composite film for the detection of vitamin D3 in blood samples, Diamond Relat. Mater., 2020, 104, 107761 CrossRef CAS.
- H. Bora, D. Mandal and A. Chandra, High-performance, nitrogen-doped, carbon-nanotube-based electrochemical sensor for vitamin D3 detection, ACS Appl. Bio Mater., 2022, 5(4), 1721–1730 CrossRef CAS PubMed.
- S. Wadhwa,
et al., Graphene quantum dot-gold hybrid nanoparticles integrated aptasensor for ultra-sensitive detection of vitamin D3 towards point-of-care application, Appl. Surf. Sci., 2020, 521, 146427 CrossRef CAS.
- O. A. Alsager,
et al., Colorimetric aptasensor of vitamin D3: a novel approach to eliminate residual adhesion between aptamers and gold nanoparticles, Sci. Rep., 2018, 8(1), 12947 CrossRef PubMed.
- M. M. Motaghi,
et al., Nanostructure electrochemical sensor for voltammetric determination of vitamin C in the presence of vitamin B6: Application to real sample analysis, Int. J. Electrochem. Sci., 2016, 11(9), 7849 CrossRef CAS.
- A. Baghizadeh,
et al., A voltammetric sensor for simultaneous determination of vitamin C and vitamin B 6 in food samples using ZrO2 nanoparticle/ionic liquids carbon paste electrode, Food Anal. Methods, 2015, 8, 549–557 CrossRef.
- T. Tabanlıgil Calam, A novel, efficient and sensitive method for the simultaneous determination of riboflavin (vitamin B2) and pyridoxine hydrochloride (vitamin B6) in food and pharmacological samples using an electrochemical sensor based on 4,4′-diamino benzophenone, Microchem. J., 2021, 169, 106557 CrossRef.
- N. F. Atta,
et al., Effective and Facile Determination of Vitamin B6 in Human Serum with CuO Nanoparticles/Ionic Liquid Crystal Carbon Based Sensor, J. Electrochem. Soc., 2017, 164(13), B730 CrossRef CAS.
|
| This journal is © The Royal Society of Chemistry 2024 |
Click here to see how this site uses Cookies. View our privacy policy here. 
 Open Access Article
 This Open Access Article is licensed under a Creative Commons Attribution-Non Commercial 3.0 Unported Licence
 *a,
Shahabuddin
Memon
a and
Sirajuddin
b
*a,
Shahabuddin
Memon
a and
Sirajuddin
b