
 Open Access Article
 This Open Access Article is licensed under a
 Creative Commons Attribution 3.0 Unported Licence
An ancillary-ligand strategy for the improvement of electrochemical sensing towards S-containing amines with ultralow detection limits†
Teng
Ma
 ,
Yizhen
Zhao
,
Xiao
Liu
,
Xingyue
He
,
Bin
Lei
,
Xiao-Hang
Qiu
*,
Jian-Gong
Ma
* and
Peng
Cheng
,
Yizhen
Zhao
,
Xiao
Liu
,
Xingyue
He
,
Bin
Lei
,
Xiao-Hang
Qiu
*,
Jian-Gong
Ma
* and
Peng
Cheng
Department of Chemistry, Key Laboratory of Advanced Energy Material Chemistry (MOE), Frontiers Science Center for New Organic Matter, and Renewable Energy Conversion and Storage Center (RECAST), College of Chemistry, Nankai University, Tianjin 300071, P. R. China. E-mail: qiuxh@nankai.edu.cn; mvbasten@nankai.edu.cn
First published on 28th November 2023
Abstract
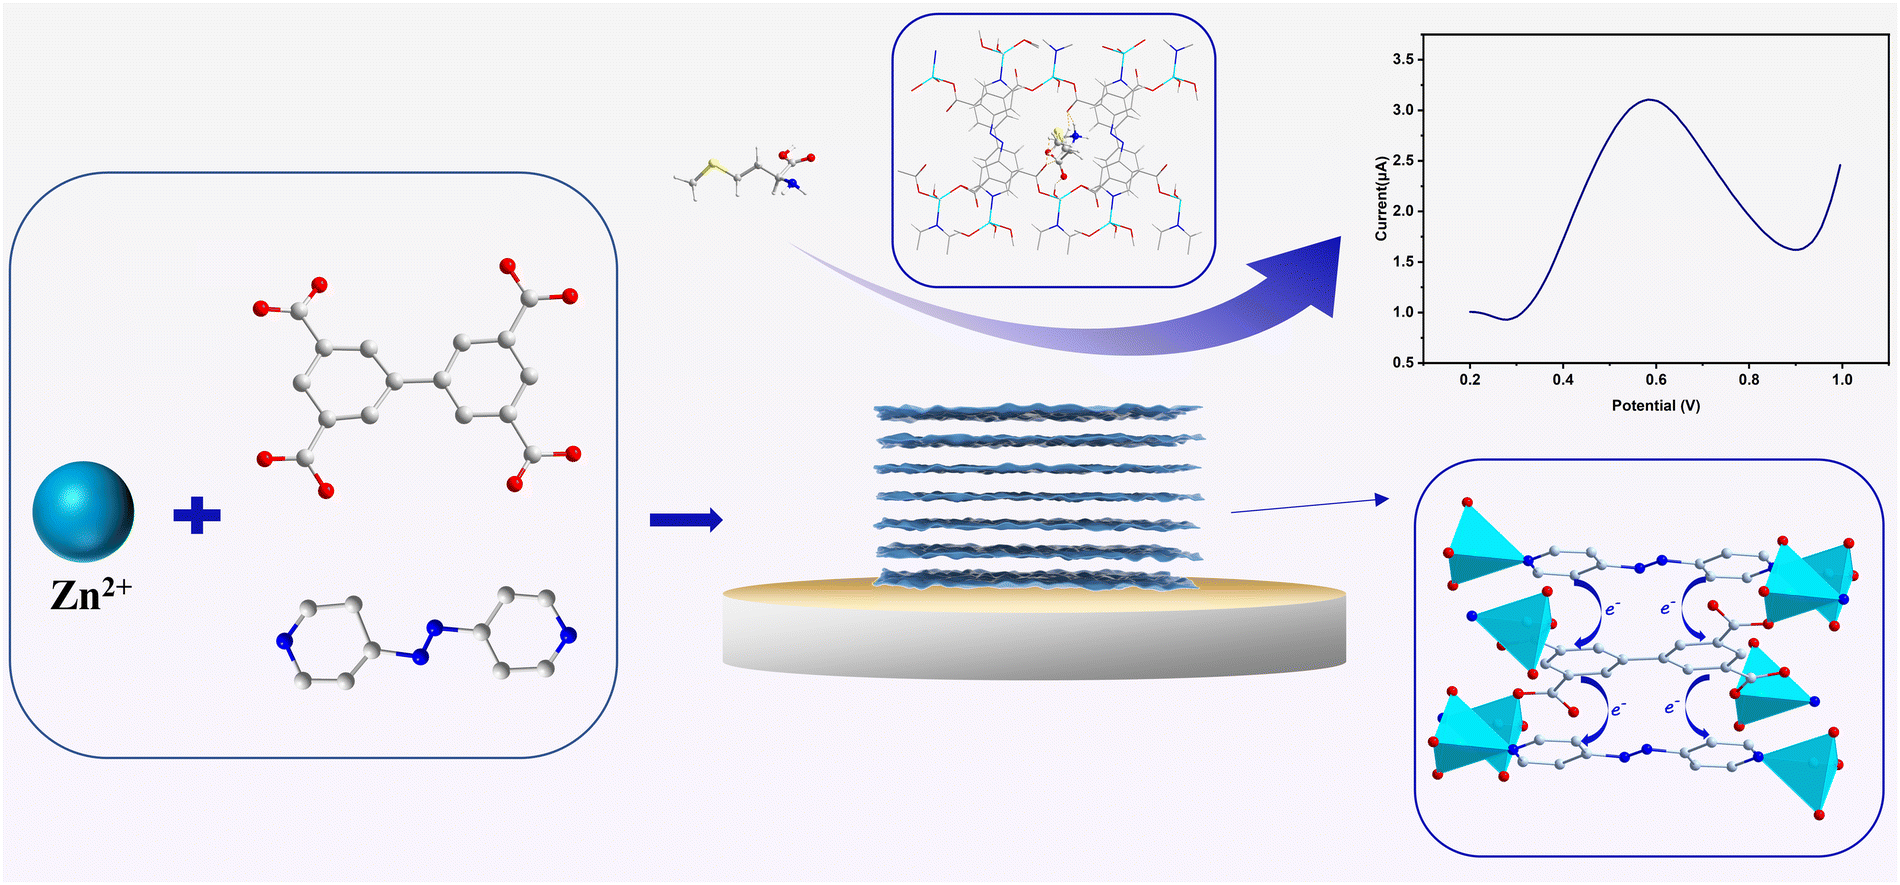
Two new Zn(II) metal–organic frameworks (MOFs), namely [Zn2(bptc)(DMF)2(H2O)]·4H2O (1) and [Zn2(bptc)(azpy)(H2O)2]·2H2O (2) (H4bptc = 3,3′,5,5′-biphenyltetracarboxylic acid, azpy = 4,4′-azopyridine), were synthesized through a solvothermal reaction. The incorporation of the redox-active ancillary ligand azpy endows 2 with electrochemical activity, which enables sensing of S-containing amines (including L-methionine and L-penicillamine) compared to that of 1. The sensor demonstrates exceptional selectivity towards L-methionine due to specific host–guest interactions resulting from hydrogen bonding and size-selective discrimination, leading to an ultralow detection limit of 6.4 × 10⁻³ nM. Furthermore, the detection of L-penicillamine becomes viable due to the structural and size resemblance with L-methionine. This deduction is substantiated through both computational analysis and empirical investigations, which supplies a new way for the construction and modification of electroactive MOF sensors with superior selectivity and sensitivity.
Introduction
Sulfur-containing biomolecules, such as L-methionine (L-Met), are essential functional units in the human body, playing a vital role in human metabolism and growth. Oxidative stress occurs when there is an imbalance between reactive nitrogen/reactive oxygen species and antioxidant levels within cells.1 This kind of stress has been associated with various diseases such as diabetes, cardiovascular disease, and Alzheimer's disease.2–4 The concentration of L-Met reflects the level of oxidative stress in vivo5–7 as it can be easily oxidized to methionine sulfoxide due to the presence of sulfhydryl groups in its side chain. Several methods, including colorimetric,8 chromatographic,9 and fluorescence10 techniques, have been developed for the quantitative determination of L-Met. However, these methods are always limited by complex operations, the requirement for expensive instruments and so on. As a relatively facile method, electrochemical sensing stands out due to its simplicity, instrument miniaturization, high efficiency, and fast response.11,12Metal–organic frameworks (MOFs) are a class of porous materials formed through the coordination self-assembly of inorganic metal nodes (or clusters) and organic linkers,13,14 which are widely used in various areas,15–18 due to their tunable structure, large surface area, and porosity. Recently, MOFs have gained increasing attention in the field of electrochemical sensing due to the porous nature, which enables the accumulation and delivery of analytes, as well as the tunability of active sites.19–24 However, designing MOFs with both stability and electrochemical activity with appropriate parameters for electrochemical sensing remains a great challenge.
In this study, we exhibited an efficient strategy to successfully construct electrochemically active MOF sensors with revolutionary sensitivity through introducing the redox-active ancillary ligand. With 3,3′,5,5′-biphenyltetracarboxylic acid (H4bptc) as a quadrupedal ligand, electrochemically inert 1 ([Zn2(bptc)(DMF)2(H2O)]·4H2O) with a 3D framework structure was synthesized, which was subsequently altered into electrochemically active 2 ([Zn2(bptc)(azpy)(H2O)2]·2H2O) with a two-dimensional layered spatial structure by employing the redox-active ancillary ligand 4,4′-azopyridine (azpy).25–27 The redox-active nature of the azpy ligand and the π–π stacking between the ligands in the two-dimensional layered structure facilitated electron transport, endowing 2 with both superior sensing activity towards S-containing amines (including L-methionine and L-penicillamine) and excellent stability, which is crucial for reliable electrochemical sensing. The hydrogen bonding interaction between 2 and L-Met and the well-matched size of the one-dimensional channel (8.5 Å × 4.5 Å) with that of L-Met (Scheme 1) led to excellent activity and selectivity, respectively, based on which L-Pen, which has similar functional groups and sizes to L-Met, was confirmed to be efficiently detected as well.
 | ||
| Scheme 1 Schematic illustration of the synthesis of 2 for the sensing of the L-Met molecule. | ||
Experimental section
Chemicals
All reagents and solvents were purchased from commercial sources and used without further purification unless otherwise specified. 4,4′-Azopyridine was purchased from Shanghai Bide Pharmaceutical Technology Co., Ltd, 3,3′,5,5′-biphenyltetracarboxylic acid from Jilin Chinese Academy of Sciences – Yanshen Technology Co., Ltd, Zn(NO3)2·6H2O and L-Methionine (L-Met) from Shanghai Aladdin Biochemical Technology Co., Ltd, and L-Penicillamine (L-Pen) from Beijing J&K Scientific Ltd. Additionally, DMA was purchased from Tianjin Concord Technology Co., Ltd.Apparatus and characterization
The crystallographic diffraction data of 1 were collected using a Rigaku ROD X-ray single crystal diffractometer with graphite-monochromated Cu-Kα radiation (λ = 1.54178 Å). The crystallographic diffraction data of 2 were collected using a Rigaku Supernova X-ray single crystal diffractometer equipped with graphite-monochromated Mo-Kα radiation (λ = 0.71073 Å). The structures were solved by SHELXT (intrinsic phasing) and refined by SHELXL (full matrix least-squares techniques) in the Olex2 package.28–30 The highly disordered solvent molecules are removed using the PLATON/SQUEEZE program.31 Powder X-ray diffraction (PXRD) data were collected using an Ultima IV diffractometer (Rigaku) using Cu Kα radiation (40 kV, 40 mA). Elemental analysis (C, H, and N) was performed using a PerkinElmer 2400-IICHNS/O analyzer. Fourier transform infrared (FT-IR) spectroscopy was carried out using a Bruker Alpha instrument. Thermogravimetric analysis (TGA) was performed using a thermogravimetry model NETZSCH TG 209, with a heating rate of 10 °C min−1. XPS data were collected using a Thermo ESCALAB 250XI instrument. SEM and energy-dispersive X-ray spectroscopy (EDS) mapping images were collected using an FEI Apreo S LoVac instrument. Cyclic voltammetry (CV) and differential pulse voltammetry (DPV) were conducted in a conventional three-electrode system using a Metrohm Autolab PGSTAT302N device run on the NOVA software. A gold electrode (AuE), a Pt electrode and a saturated calomel electrode (SCE) were used as the working electrode, counter electrode, and reference electrode, respectively.Synthesis of [Zn2(bptc)(DMF)2(H2O)]·4H2O (1) and [Zn2(bptc)(azpy)(H2O)2]·2H2O (2)
Preparation of modified electrodes
The bare AuE was carefully polished using 0.05 μm alumina slurry and then cleaned sequentially with ethanol and double distilled deionized water by ultrasonication. The ink was prepared using the mixture of 2 mg of the Zn-MOF, 30 μL of Nafion, and 1 mL of isopropanol followed by ultrasonication for 2 hours. Then, 20 μL of the ink was evenly loaded onto the polished AuE 4 times and the electrode was dried overnight at room temperature.Electrochemical measurements
CV and DPV techniques were utilized to determine the concentration of L-methionine and L-penicillamine in acetic acid/sodium acetate buffer solution (ABS). CV was performed at a potential range of −0.9 V to 1.4 V and a scan rate of 0.05 V s−1. The oxidation current was recorded by DPV with a pulse amplitude of 0.025 V, a pulse interval time of 0.5 s, and a scan rate of 0.01 V s−1 over the potential range of 0.2 to 1.0 V versus the SCE.Computational methods
DFT calculations were performed using a VASP 5.4 code.32,33 An energy cut-off at 400 eV and 1 × 1 × 1 gamma k points were utilized to achieve a total energy convergence of less than −0.02 eV Å−1. The generalized gradient approximation was used with a Perdew–Burke–Ernzerhof exchange–correlation function.34 The interactions between the ionic cores and the valence electrons were depicted by ultrasoft pseudo-potentials.The interaction between L-Met (or L-Pen) molecules and the framework of 2 in the system was analyzed using the zero-damping DFT-D3 dispersion correction method developed by Grimme. The binding energy of L-Met (or L-Pen) molecules was calculated as follows:
| Ebinding = E(2+nL-Met) – E(2) – n × E(L-Met) |
Here, E(2+nL-Met), E(2) and E(L-Met) represent the total energies of the L-Met molecules binding to the framework of 2, the clean framework of 2 in a vacuum, and the free L-Met molecule, respectively. Similar calculations were performed for the binding energy of L-Pen.
Results and discussion
Characterization of materials
1 was obtained through heating H4bptc and Zn(NO3)2 in the mixture of DMF and H2O. 1 crystallizes in the monoclinic system with the P21/c space group (Table S1, ESI†) with two Zn2+ ions, one bptc4− ligand, one coordinated H2O molecule and two coordinated DMF molecules per asymmetric unit (Fig. 1a). The framework consists of Zn2+ ions in two coordination environments both with distorted octahedral geometries, Zn1 is coordinated with two η2 carboxylate groups and two η1 carboxylate oxygen atoms while Zn2 is coordinated with three η1 carboxylate oxygen atoms, one water molecule and two terminal DMF molecules (Fig. 1b and c). The Zn dimers formed by bridged Zn1 and Zn2 are further connected by the bptc4− ligand, resulting in a 3D framework with a 1D channel (8 Å × 11 Å) (Fig. 1d). The phase purity of 1 was confirmed by powder X-ray diffraction (PXRD), which showed consistent patterns with the simulated profile (Fig. S1a, ESI†). Additionally, the successful synthesis of 1 was further confirmed by the disappearance of absorption peaks of the ligand at 3400–2500 cm−1 in the Fourier Transform infrared spectra (FTIR) which corresponded to the stretching vibration of O–H (Fig. S1b, ESI†).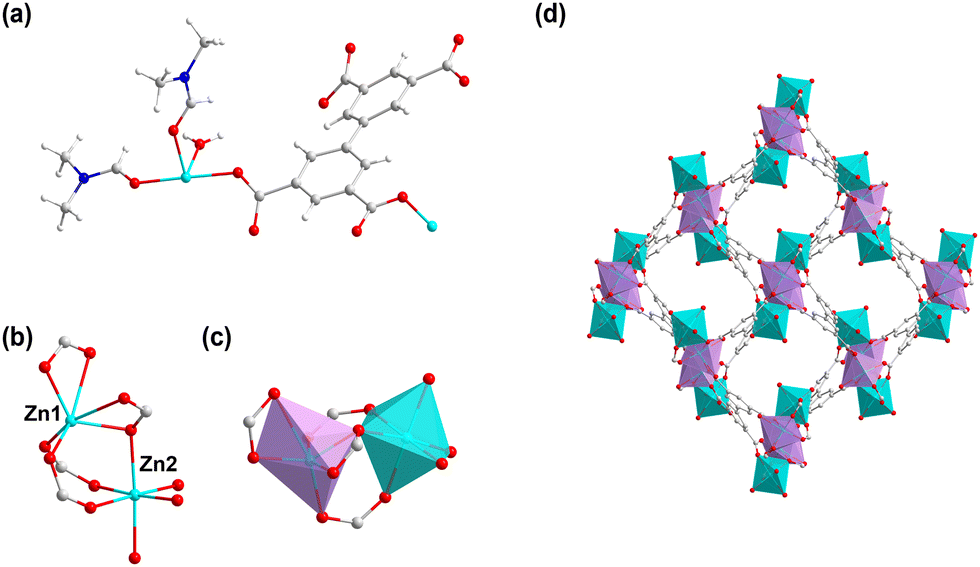 | ||
| Fig. 1 (a) The asymmetric unit of 1. (b) The coordination environment of the Zn ion in 1. (c) The octahedral geometries of Zn1 and Zn2. (d) The one-dimensional channel of 1. | ||
2 was synthesized similarly to 1 by the solvothermal reaction except the addition of azpy. Single crystal X-ray diffraction reveals that 2 crystallizes in the triclinic system with the P![[1 with combining macron]](https://www.rsc.org/images/entities/char_0031_0304.gif) space group (Table S2, ESI†). The asymmetric unit includes one crystallographically independent Zn2+ ion, half of a bptc4− ligand, half of a 4,4′-azopyridine molecule, and one coordinated H2O molecule (Fig. 2a). Fig. 2b shows that each Zn2+ ion is coordinated to two oxygen atoms from two bptc4− ligands, one oxygen atom from a H2O molecule, and one nitrogen atom from one azpy molecule. A two-dimensional layered structure is formed through the coordination of Zn2+, the bptc4− ligand and azpy. Moreover, the hydrogen bond interaction between the uncoordinated oxygen atom on the bptc4− ligand and the coordinated water molecule on Zn2+ as well as the π–π conjugated interaction between the benzene ring led to the construction of a three-dimensional framework structure (Fig. 2c–e). In addition, 2 exhibits a 2D layered structure, resulting in a one-dimensional channel along the a-axis with dimensions of 8.5 Å × 4.5 Å (Fig. 2f). The morphology of 2 was characterized by scanning electron microscopy (SEM), revealing a lamellar stacked structure (Fig. 3a–c), which is consistent with its assembly through π–π conjugated interactions to form a three-dimensional framework. Furthermore, the energy-dispersive X-Sray spectroscopy (EDS) mapping shows a uniform distribution of C, N, O, and Zn elements (Fig. 3d–g).
space group (Table S2, ESI†). The asymmetric unit includes one crystallographically independent Zn2+ ion, half of a bptc4− ligand, half of a 4,4′-azopyridine molecule, and one coordinated H2O molecule (Fig. 2a). Fig. 2b shows that each Zn2+ ion is coordinated to two oxygen atoms from two bptc4− ligands, one oxygen atom from a H2O molecule, and one nitrogen atom from one azpy molecule. A two-dimensional layered structure is formed through the coordination of Zn2+, the bptc4− ligand and azpy. Moreover, the hydrogen bond interaction between the uncoordinated oxygen atom on the bptc4− ligand and the coordinated water molecule on Zn2+ as well as the π–π conjugated interaction between the benzene ring led to the construction of a three-dimensional framework structure (Fig. 2c–e). In addition, 2 exhibits a 2D layered structure, resulting in a one-dimensional channel along the a-axis with dimensions of 8.5 Å × 4.5 Å (Fig. 2f). The morphology of 2 was characterized by scanning electron microscopy (SEM), revealing a lamellar stacked structure (Fig. 3a–c), which is consistent with its assembly through π–π conjugated interactions to form a three-dimensional framework. Furthermore, the energy-dispersive X-Sray spectroscopy (EDS) mapping shows a uniform distribution of C, N, O, and Zn elements (Fig. 3d–g).
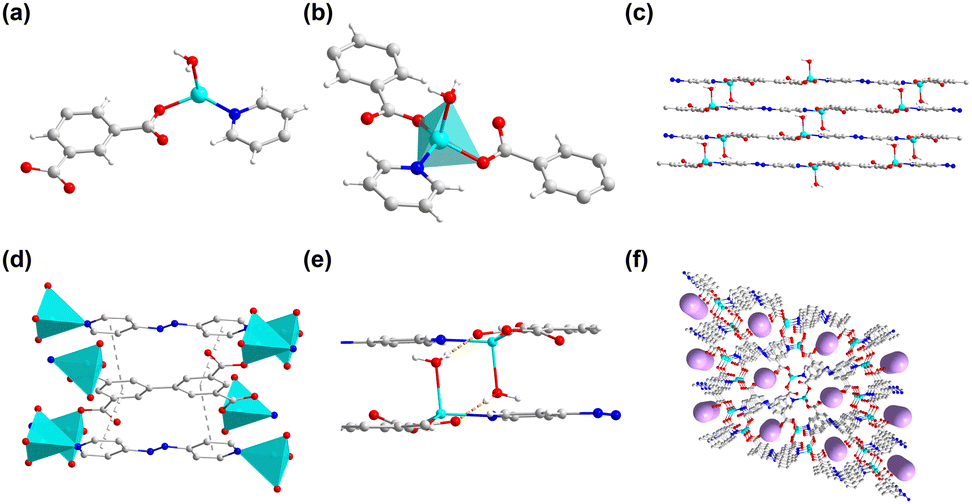 | ||
| Fig. 2 (a) The asymmetric unit of 2. (b) The coordination environment of the Zn ion. (c) Three-dimensional framework structure. (d) π–π stacking interactions in 2. (e) Hydrogen bond interactions in 2. (f) The one-dimensional channel along the a-axis. | ||
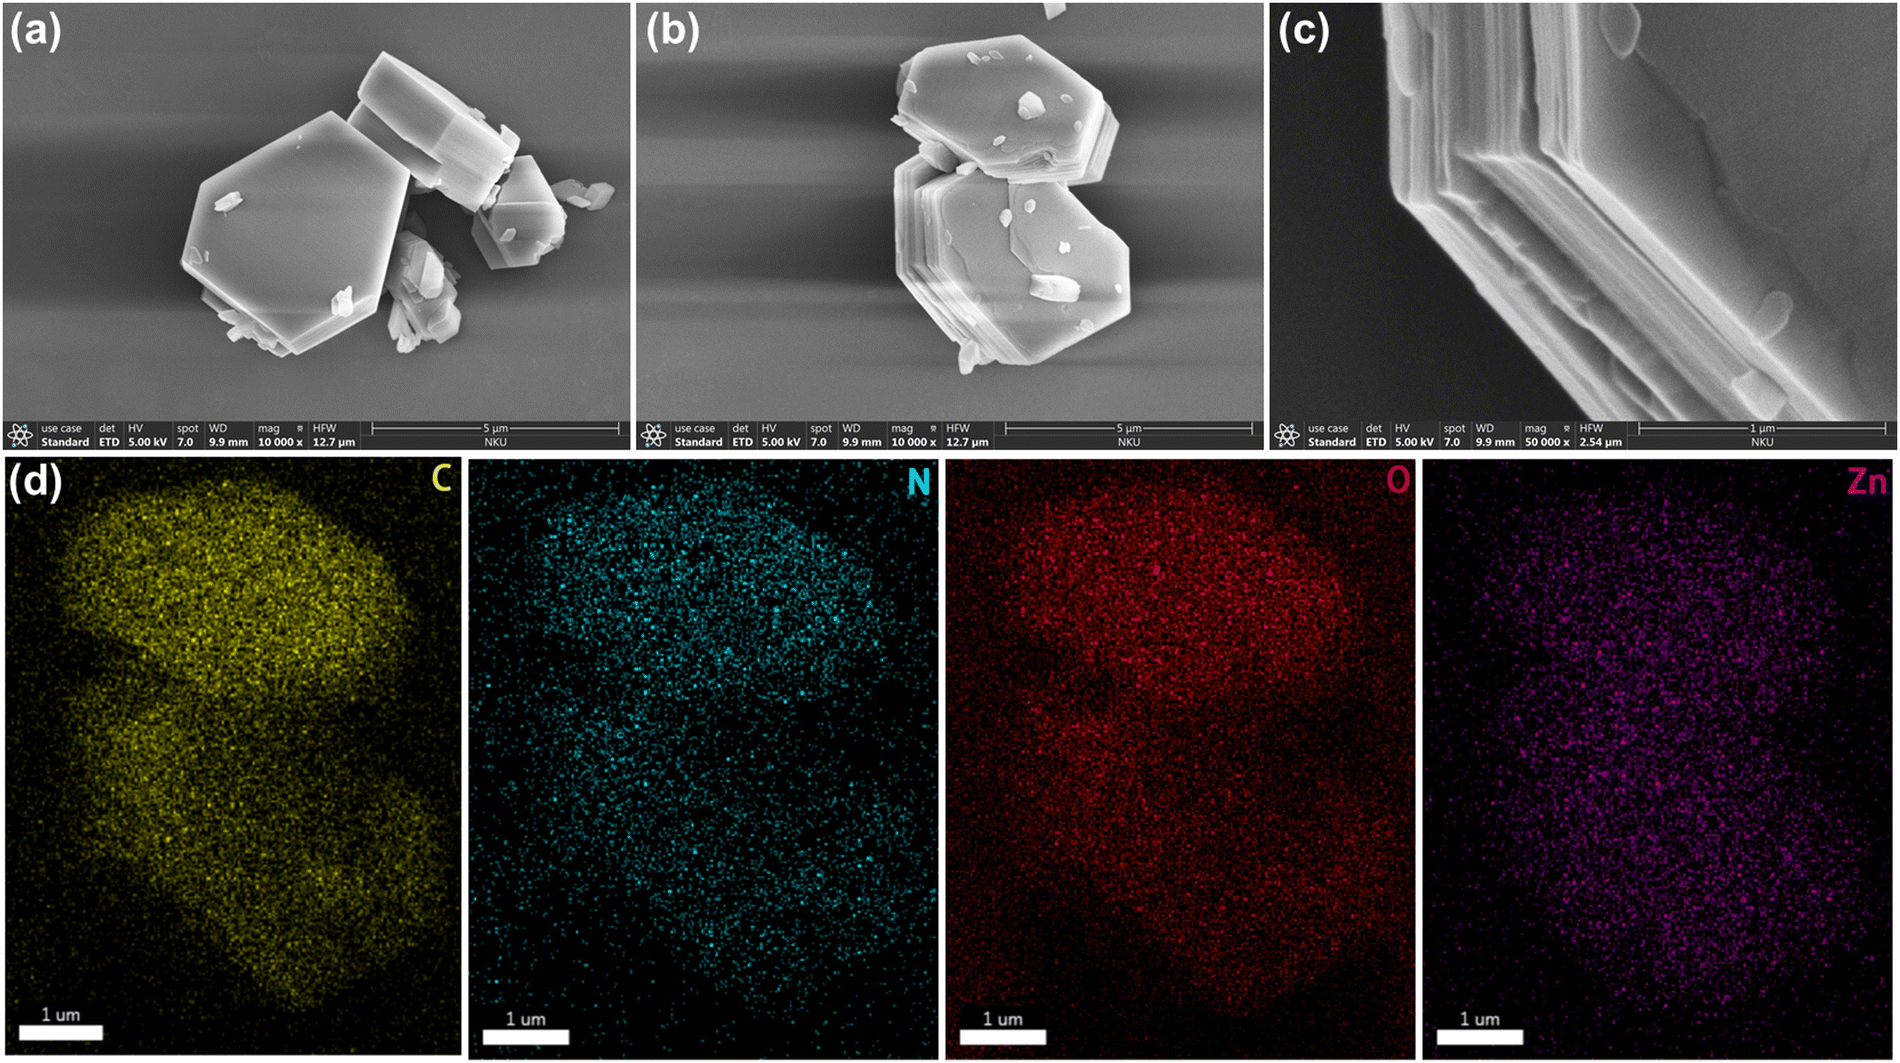 | ||
| Fig. 3 (a)–(c) SEM images of the layered stacking structure of 2. (d) EDS mapping of 2. | ||
The phase purity of 2 is confirmed by powder X-ray diffraction (PXRD), and the diffraction pattern is consistent with the simulated profile, indicating the high phase purity of 2 (Fig. 4a). The Fourier transform infrared spectra (FTIR) further confirm the successful synthesis of 2, and the absorption peak at around 3400–2500 cm−1 disappears while the absorption peak at 1674 cm−1, which corresponds to the stretching vibration of C![[double bond, length as m-dash]](https://www.rsc.org/images/entities/char_e001.gif) O, shifts to 1605 cm−1 (Fig. 4b). The N2 adsorption isotherm of 2 is exhibited in Fig. S2 (ESI†) and the pore size distribution is around 3.8 Å.
O, shifts to 1605 cm−1 (Fig. 4b). The N2 adsorption isotherm of 2 is exhibited in Fig. S2 (ESI†) and the pore size distribution is around 3.8 Å.
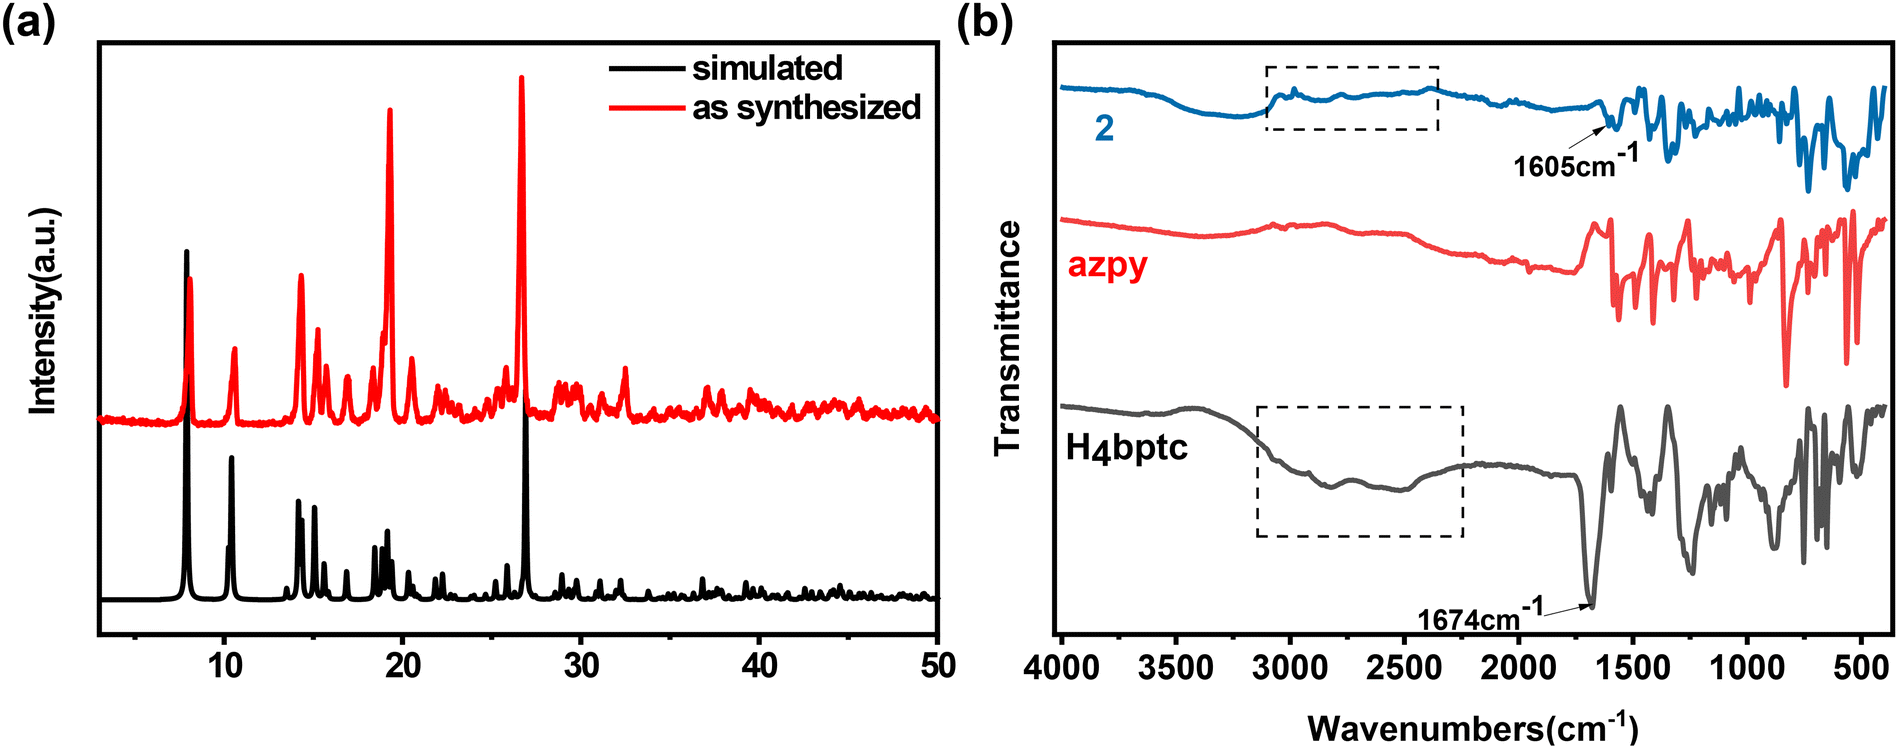 | ||
| Fig. 4 (a) PXRD patterns of simulated and as-synthesized 2. (b) FT-IR spectra of H4bptc, azpy, and 2. | ||
Thermogravimetric analysis (TGA) was performed to investigate the thermal stability of 2. The TGA curve indicates that 2 remains stable up to 400 °C, revealing the good thermal stability of 2 (Fig. S3, ESI†). Furthermore, the structure robustness of 2 was investigated by immersing 2 in different organic solvents and aqueous solutions with varying pH levels for a period of 7 days. The PXRD patterns obtained after immersing 2 in organic solvents (Fig. S4a, ESI†) and aqueous solutions with pH values ranging from 2 to 12 (Fig. S4b, ESI†) are in good agreement with the simulated data, confirming the excellent stability of 2 towards solvents and pH. Such structural stability of 2 lays the foundation for further electrochemical sensing applications in buffers with different pH values.
The element species and valence states of 2 were analyzed using X-ray photoelectron spectroscopy (XPS). The XPS survey spectra (Fig. S5a, ESI†) confirms the presence of Zn, C, N and O elements, which is consistent with the EDS elemental mapping. The high-resolution XPS spectra of Zn 2p show peaks at 1045.42 eV and 1022.39 eV, corresponding to the 2p1/2 and 2p3/2 of Zn(II) (Fig. S5b, ESI†).35 The peaks at 399.94 eV and 400.75 eV in the high-resolution XPS spectra of N 1s can be attributed to pyridine nitrogen and the azo group of azpy (Fig. S5c, ESI†).36 The high-resolution XPS spectra of C 1s show three peaks at 284.8 eV, 285.96 eV and 288.42 eV, representing C–C, C–N and O–CO bonds, respectively (Fig. S5d, ESI†).37,38 These results indicate the successful coordination of bptc and azpy.
Electrochemical behavior
The intrinsic electrochemical properties of 1 and 2 were characterized in ABS. The CV curve of 1 modified AuE (1@AuE) in 0.2 M ABS (pH = 4.4) shows no significant difference compared to the bare AuE, where the anodic peak between 0.9 V and 1.1 V is attributed to the formation of an oxide layer on the gold surface, the cathodic peak between 0.5 V and 0.7 V is resulted from the reduction of the oxide layer, and the small cathodic peak between 0 V and −0.1 V is related to the presence of active metal atoms (hydrous oxide species) at the electrode surface.39 However, the CV curve of 2 modified AuE (2@AuE) in 0.2 M ABS (pH = 4.4) exhibits a weak cathodic redox peak at 0.10 V, indicating the presence of a weak faradaic process which is contributed to the reduced two-electron one-proton reduction of the unprotonated azpy ligand to the protonated azpy ligand.40 Nevertheless, the absence of oxidation peaks and the presence of reduction peaks indicate a lack of electrochemical reversibility (Fig. S6a and b, ESI†).41 The electrochemical activities of 1@AuE and 2@AuE towards L-Met were compared with those of the bare AuE. When 20 μM L-Met was added to the ABS, 2@AuE exhibited clear oxidation peaks, while 1@AuE and the bare AuE did not exhibit any response (Fig. 5a and b). The distinct electrochemical response of 2@AuE to L-Met may be attributed to the incorporation of the redox-active ancillary ligand azpy as well as the assistance of microchannels for mass transfer and the supramolecular interactions between the framework of 2 with L-Met.42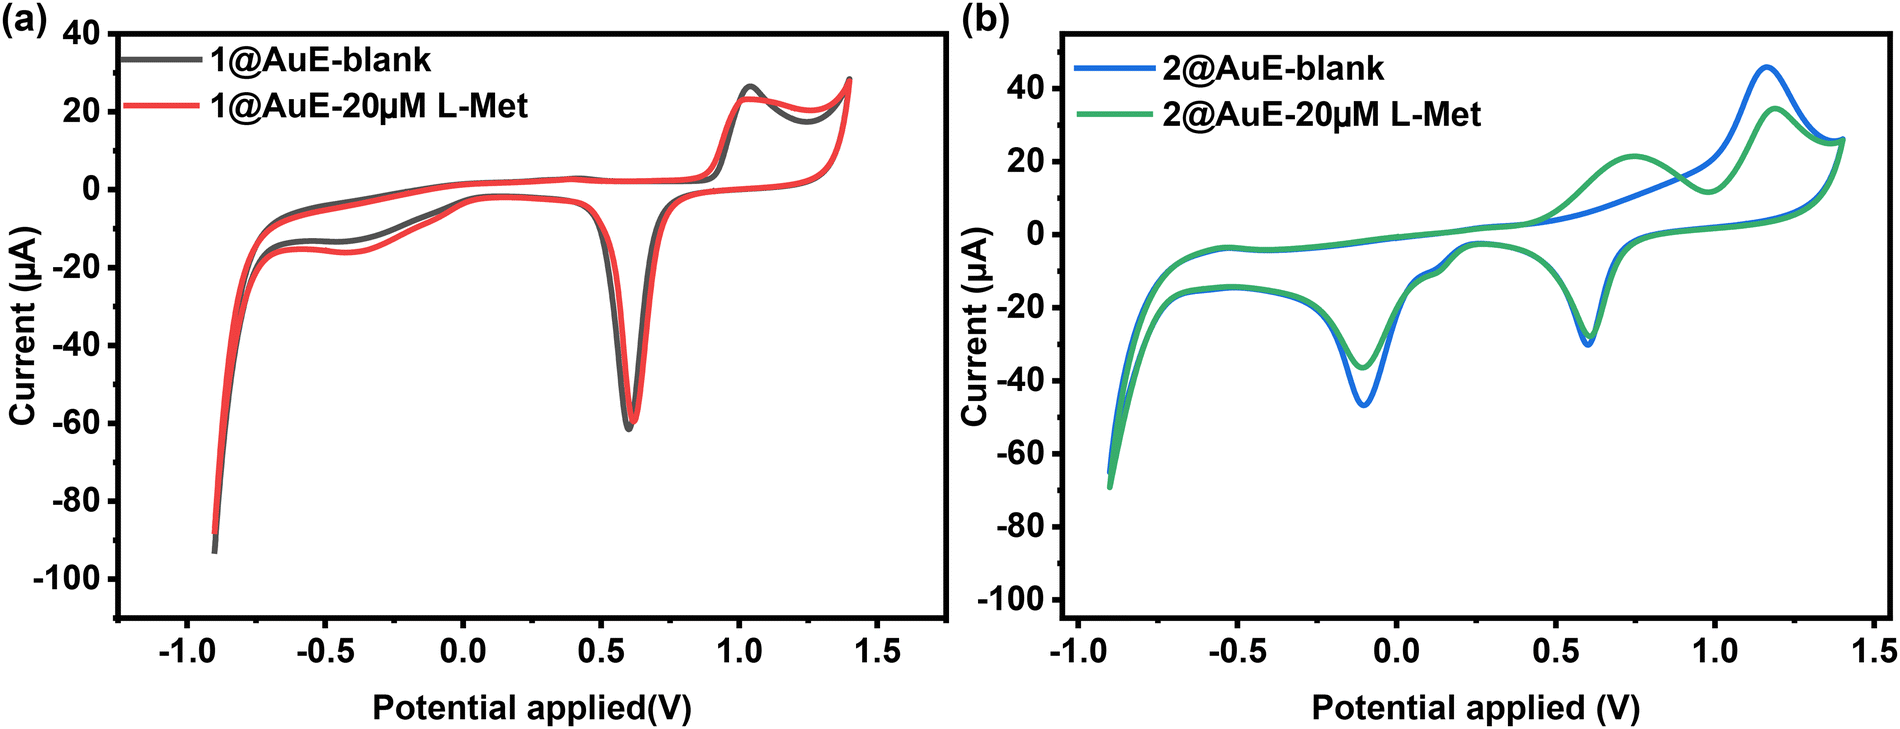 | ||
| Fig. 5 (a) Comparison of CV curves of 1@AuE and the bare AuE in the presence and absence of 20 μM L-Met in ABS buffer at pH 4.4. (b) Comparison of CV curves of 2@AuE and the bare AuE in the presence and absence of 20 μM L-Met in ABS buffer at pH 4.4. | ||
Differential pulse voltammetric determination for L-Met of 2@AuE
Compared to CV measurement, DPV measurement is more sensitive to low concentrations of analytes due to the minimal contribution of the capacitive-current to the measurement signal.43 Therefore, based on the results of CV, the quantitative determination of L-Met was further determined using DPV measurements. To determine the optimum conditions, the effect of pH on the electrochemical response of 2@AuE towards L-Met in ABS (pH = 4.2–5.0) was investigated using CV measurements (Fig. 6a and b). The anodic peak current initially increases and then decreases within the pH range of 4.2–5.0, and the maximum peak current response towards L-Met is observed at pH 4.4, indicating that pH 4.4 is the optimum pH for detecting L-Met on the 2@AuE. The accumulation time plays a crucial role in DPV measurements. The peak current increases continuously with an accumulation time from 0 s to 360 s, followed by a slight decrease (Fig. S7a and b, ESI†). Therefore, an accumulation time of 360 s was considered as the optimal DPV conditions for L-Met.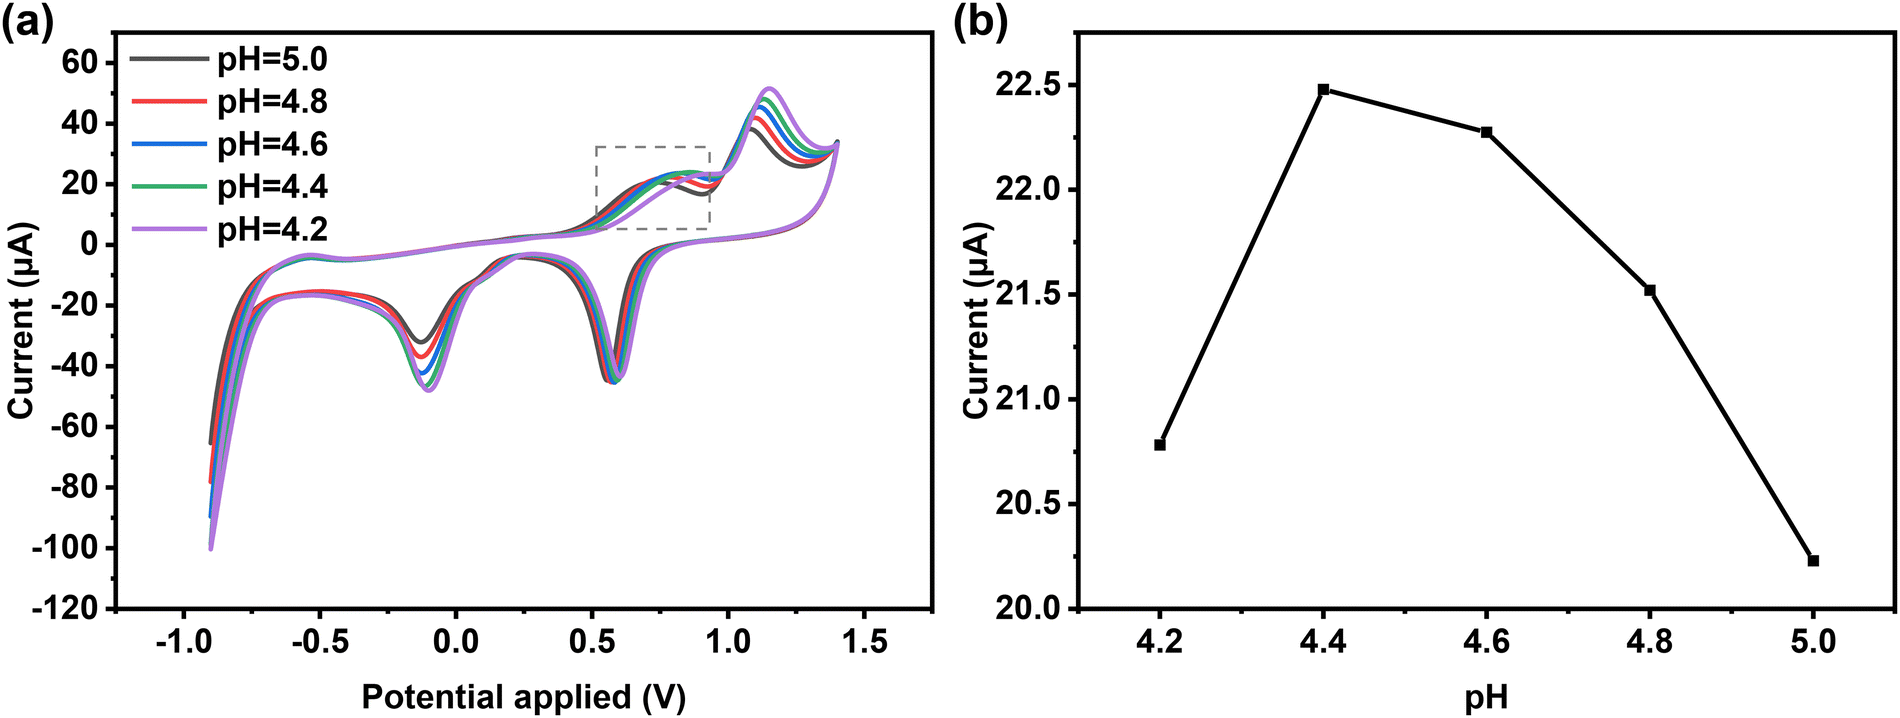 | ||
| Fig. 6 CV curves of 50 μM L-Met on 2@AuE in ABS buffer with different pHs (4.2–5.0). (b) The relationship between the oxidation currents of L-Met and pH values. | ||
The feasibility of using 2@AuE for the detection of L-Met was confirmed through the DPV method under optimal conditions (Fig. 7a and b). The peak current increased with the increasing concentration of L-Met (c), showing two linear relationships within the ranges of 0.05–1 μM and 1–30 μM. The linear calibration equation for the range of 0.05–1 μM is expressed as Ip (μA) = 0.32732 log![[thin space (1/6-em)]](https://www.rsc.org/images/entities/char_2009.gif) c (μM) + 1.73409, with a correlation coefficient of 0.991. In the higher concentration range of 1–30 μM, the linear equation is denoted as Ip (μA) = 0.96355 logc (μM) + 1.6991, and the correlation coefficient is 0.994. Furthermore, the sensitivities are reported to be 3.637 μA μM−1 cm−2 and 10.706 μA μM−1 cm−2 in the linear range of 0.05–1 μM and 1–30 μM, respectively. The limit of detection (LOD = 3Sb/S, where Sb is the standard deviation of the blank signal, and S is the slope of the calibration curve44) for the 2@AuE sensor towards L-Met is calculated as low as 6.4 × 10⁻⁶ μM, revealing a 2 orders of magnitude improvement compared with the performance of other known electrochemical sensors for detecting L-Met (Table S3, ESI†).
c (μM) + 1.73409, with a correlation coefficient of 0.991. In the higher concentration range of 1–30 μM, the linear equation is denoted as Ip (μA) = 0.96355 logc (μM) + 1.6991, and the correlation coefficient is 0.994. Furthermore, the sensitivities are reported to be 3.637 μA μM−1 cm−2 and 10.706 μA μM−1 cm−2 in the linear range of 0.05–1 μM and 1–30 μM, respectively. The limit of detection (LOD = 3Sb/S, where Sb is the standard deviation of the blank signal, and S is the slope of the calibration curve44) for the 2@AuE sensor towards L-Met is calculated as low as 6.4 × 10⁻⁶ μM, revealing a 2 orders of magnitude improvement compared with the performance of other known electrochemical sensors for detecting L-Met (Table S3, ESI†).
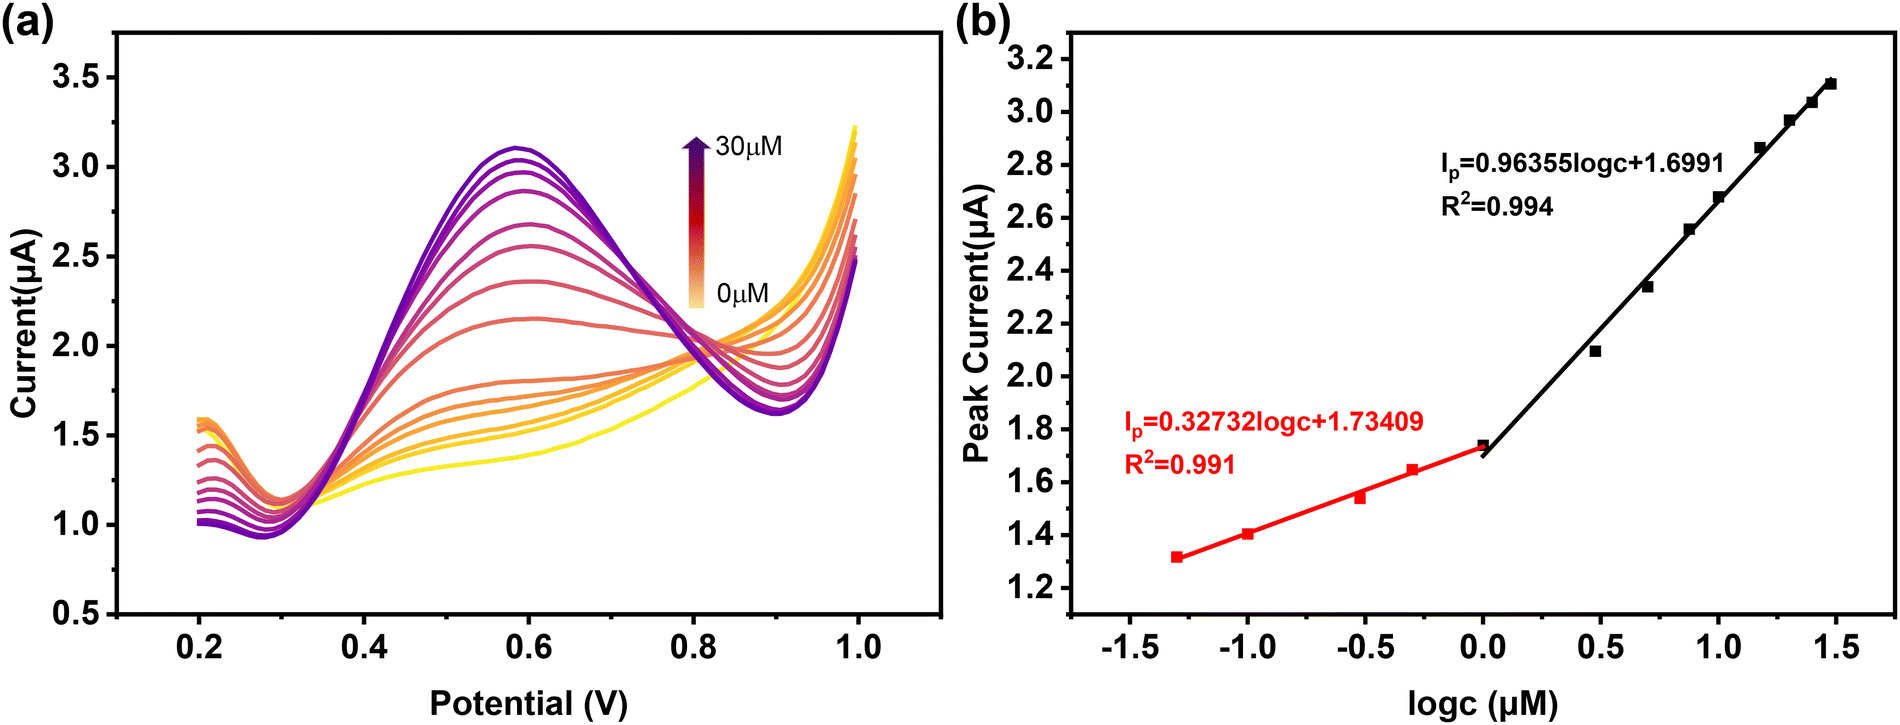 | ||
| Fig. 7 (a) DPV curves of different concentrations of L-Met on 2@AuE. (b) Linear relationship between the concentration of L-Met and the oxidation peak current. | ||
To demonstrate stability and recyclability, the electrode was used to analyze L-Met under the optimized conditions for 10 times, and the peak current remained unchanged (Fig. S8a, ESI†). The SEM images after sensing and 10 cycles in the sensing of L-Met exhibited an identical lamellar morphology as before (Fig. S9, ESI†). And, the PXRD peaks of 2 after sensing and 10 cycles remained the same, ensuring the stability and recyclability of 2 as the sensing material (Fig. S10, ESI†). The anti-interference ability, also known as selectivity, was measured by adding a 10-fold concentration of coexisting interferents of L-Met using an amperometric method. As shown in Fig. S8b (ESI†), the 2@AuE sensor demonstrates high selectivity towards L-Met, which may be attributed to the specific interactions between 2 and L-Met.
Computational methods
The 3D framework consists of 1D channels along the a-axis, with a diameter of 8.5 Å × 4.5 Å. The 1D microchannels provide numerous active sites, allowing for the rapid aggregation of analytes and facilitating mass and electron transport. We further investigated the hydrogen bonding interactions and absorption energy through DFT calculations. The results show that L-Met can form two strong hydrogen bondings (1.717 Å and 1.416 Å) with 2, as well as three relatively weak hydrogen bondings (2.037 Å, 2.081 Å and 2.084 Å). The absorption energy is calculated to be −0.61 eV (Fig. 8a). | ||
| Fig. 8 Hydrogen bonding interactions between 2 with L-Met (a) and L-Pen (b) shown by DFT calculations. | ||
Based on the experimental and computational results, the superior activity of 2 as an electrochemical sensor could be explained. Firstly, the introduction of the auxiliary ligand azpy enables the transition from the oxidation to the reduction state through the filling of the p-orbital electrons on the sp2 nitrogen,25 together with the π–π stacking conjugated interactions between the benzene rings throughout the two-dimensional lamellar framework enabling the transport of electrons through space and promoting the oxidation of L-Met,45 thus endowing 2 with electrochemical activity to achieve the response to L-Met. Secondly, the formation of appropriate hydrogen bonding host–guest interactions could significantly lower the system energy, which enables the framework of 2 to automatically catch L-Met molecules even in a solution of ultralow concentrations. Finally, the appropriate size and shape of the cavities of 2 are favorite to the L-Met molecule rather than other interferent molecules, leading to the specific selectivity during the sensing process in a relatively complex system mimicking the bio-environment.
Additionally, we examined the interaction and adsorption energies of 2 with another molecule, L-Pen, which has a similar size and functional group to L-Met. L-Pen was found to form one strong (1.782 Å) and three weaker hydrogen bonds (1.900 Å, 2.002 Å, and 2.091 Å) with 2, with an adsorption energy of −1.09 eV (Fig. 8b), indicating the possibility of L-Pen detected by 2.
The electrochemical response of 2@AuE towards L-Pen
L-Pen was used as a model molecule to validate the calculations mentioned above. As shown in Fig. S11 (ESI†), compared with the bare AuE, 2@AuE exhibits a clear anodic oxidation peak when exposed to 20 μM L-Pen in ABS. Furthermore, the optimal measurement conditions including pH and accumulation time were investigated. The peak current shows a process of increasing and then decreasing with an increase in pH from 4.2 to 5.0, reaching its maximum value at pH = 4.8 (Fig. S12, ESI†). Hence, pH 4.8 was considered as the optimum pH. Fig. S9b (ESI†) shows the optimal accumulation time as 90 s (Fig. S13, ESI†).Under the optimal test conditions, DPV measurements exhibit a linear increase in peak currents with the addition of L-Pen (Fig. S14a and b, ESI†) in the concentration range of 1–30 μM and the linear equation is expressed as Ip (μA) = 0.0533 logc (μM) + 1.30236 (R2 = 0.995). The sensitivity and LOD reached 0.5922 μA μM−1 cm−2 and 0.55 μM, respectively. The SEM images (Fig. S15, ESI†) and PXRD patterns (Fig. S16, ESI†) after sensing and 10 recycle works for L-Pen were also investigated, and the layered structure and main peaks of 2 still remained. The 2@AuE sensor has been demonstrated to be a superior candidate for L-Pen electrochemical sensing. Thus, the experimental results confirmed that the computational prediction of L-Pen can be detected.
Conclusions
In summary, using the ancillary-ligand strategy, the synthesis of a type of Zn-MOF was successfully converted from an electrochemical-inert complex to an ultra-sensitive sensor capable of detecting S-containing amines. The ultralow detection limits and high sensitivity are achieved due to enhanced electron transfer, analyte aggregation, and effective transport. This is facilitated by the utilization of redox-active ligands, the promotion of π–π interactions between the two-dimensional layered frameworks, and the construction of one-dimensional channels. Additionally, computational analysis suggests that L-Pen, which has similar functional groups and sizes, can also be detected. This hypothesis was successfully confirmed through the perfect correspondence of electrochemical experiments with the theoretical calculations. These findings offer valuable insights into the future directional design of electrochemical sensors.Conflicts of interest
The authors declare no conflicts of interest.Acknowledgements
This work was supported by the NSFC (22121005, U23A20554 and 22305131) and the Fundamental Research Funds for the Central Universities (63233011).Notes and references
- T. Finkel and N. J. Holbrook, Nature, 2000, 408, 239–247 CrossRef CAS.
- L. Grant, E. K. Lees, L. A. Forney, N. Mody, T. Gettys, P. A. Brown, H. M. Wilson and M. Delibegovic, Mech. Ageing Dev., 2016, 157, 35–43 CrossRef CAS PubMed.
- K. A. Tallman, C. L. Rector and N. A. Porter, J. Am. Chem. Soc., 2009, 131, 5635–5641 CrossRef CAS PubMed.
- Y. Zhao, Y. Zhao, K. Fan and L. Jin, JAMA Network Open, 2022, 5, e220944 CrossRef.
- C. L. Green, S. E. Mitchell, D. Derous, Y. Wang, L. Chen, J.-D. J. Han, D. E. L. Promislow, D. Lusseau, A. Douglas and J. R. Speakman, Aging Cell, 2017, 16, 529–540 CrossRef CAS.
- A. R. Johnson, Y. Qin, A. J. Cozzo, A. J. Freemerman, M. J. Huang, L. Zhao, B. P. Sampey, J. J. Milner, M. A. Beck, B. Damania, N. Rashid, J. A. Galanko, D. P. Lee, M. L. Edin, D. C. Zeldin, P. T. Fueger, B. Dietz, A. Stahl, Y. Wu, K. L. Mohlke and L. Makowski, Mol. Metab., 2016, 5, 506–526 CrossRef CAS.
- C. Tapia-Rojas, C. B. Lindsay, C. Montecinos-Oliva, M. S. Arrazola, R. M. Retamales, D. Bunout, S. Hirsch and N. C. Inestrosa, Mol. Neurodegener., 2015, 10, 62 CrossRef.
- P. C. Huang, N. Gao, J. F. Li and F. Y. Wu, Sens. Actuators, B, 2018, 255, 2779–2784 CrossRef CAS.
- N. Xiong, R. Yu, T. Chen, Y. P. Xue, Z. Q. Liu and Y. G. Zheng, J. Chromatogr. B: Anal. Technol. Biomed. Life Sci., 2019, 1110–1111, 108–115 CrossRef CAS.
- S. Nsanzamahoro, W. F. Wang, Y. Zhang, Y. P. Shi and J. L. Yang, Talanta, 2021, 231, 122369 CrossRef CAS PubMed.
- R. Wang, K. Lan, R. Lin, X. Jing, C. T. Hung, X. Zhang, L. Liu, Y. Yang, G. Chen, X. Liu, C. Fan, A. M. El-Toni, A. Khan, Y. Tang and D. Zhao, ACS Nano, 2021, 15, 7713–7721 CrossRef CAS PubMed.
- J. Zhang, F. Lv, Z. Li, G. Jiang, M. Tan, M. Yuan, Q. Zhang, Y. Cao, H. Zheng, L. Zhang, C. Tang, W. Fu, C. Liu, K. Liu, L. Gu, J. Jiang, G. Zhang and S. Guo, Adv. Mater., 2022, 34, e2105276 CrossRef PubMed.
- L. Feng, K. Y. Wang, X. L. Lv, T. H. Yan and H. C. Zhou, Natl. Sci. Rev., 2020, 7, 1743–1758 CrossRef CAS.
- X. Peng, P. M. Pelz, Q. Zhang, P. Chen, L. Cao, Y. Zhang, H. G. Liao, H. Zheng, C. Wang, S. G. Sun and M. C. Scott, Nat. Commun., 2022, 13, 5197 CrossRef CAS PubMed.
- B. Li, J. G. Ma and P. Cheng, Angew. Chem., Int. Ed., 2018, 57, 6834–6837 CrossRef CAS PubMed.
- C. Rao, L. Zhou, Y. Pan, C. Lu, X. Qin, H. Sakiyama, M. Muddassir and J. Liu, J. Alloys Compd., 2022, 897, 163178 CrossRef CAS.
- M. Zheng, J. Chen, L. Zhang, Y. Cheng, C. Lu, Y. Liu, A. Singh, M. Trivedi, A. Kumar and J. Liu, Mater. Today Commun., 2022, 31, 103514 CrossRef CAS.
- Y. Zhong, Z. Peng, Y. Peng, B. Li, Y. Pan, Q. Ouyang, H. Sakiyama, M. Muddassir and J. Liu, J. Mater. Chem. B, 2023, 11, 6335–6345 RSC.
- X. Q. Wu, J. G. Ma, H. Li, D. M. Chen, W. Gu, G. M. Yang and P. Cheng, Chem. Commun., 2015, 51, 9161–9164 RSC.
- Z. Zhou, S. Mukherjee, S. Hou, W. Li, M. Elsner and R. A. Fischer, Angew. Chem., Int. Ed., 2021, 60, 20551–20557 CrossRef CAS PubMed.
- Y. Zhou, Q. Hu, F. Yu, G. Y. Ran, H. Y. Wang, N. D. Shepherd, D. M. D'Alessandro, M. Kurmoo and J. L. Zuo, J. Am. Chem. Soc., 2020, 142, 20313–20317 CrossRef CAS.
- T. Ma, H. Li, J. G. Ma and P. Cheng, Dalton Trans., 2020, 49, 17121–17129 RSC.
- D. Cheng, P. Li, Z. Xu, X. Liu, Y. Zhang, M. Liu and S. Yao, ACS Sens., 2022, 7, 2465–2474 CrossRef CAS PubMed.
- Z. Zeng, X. Fang, W. Miao, Y. Liu, T. Maiyalagan and S. Mao, ACS Sens., 2019, 4, 1934–1941 CrossRef CAS.
- X. Li, X. H. Zhao, Y. Y. Liu, T. A. Hatton and Y. Y. Liu, Nat. Energy, 2022, 7, 1065–1075 CrossRef CAS.
- K. M. Waldie, S. Ramakrishnan, S. K. Kim, J. K. Maclaren, C. E. Chidsey and R. M. Waymouth, J. Am. Chem. Soc., 2017, 139, 4540–4550 CrossRef CAS PubMed.
- B. D. Matson, E. A. McLoughlin, K. C. Armstrong, R. M. Waymouth and R. Sarangi, Inorg. Chem., 2019, 58, 7453–7465 CrossRef CAS PubMed.
- O. V. Dolomanov, L. J. Bourhis, R. J. Gildea, J. A. Howard and H. Puschmann, J. Appl. Crystallogr., 2009, 42, 339–341 CrossRef CAS.
- G. Sheldrick, Acta Crystallogr., Sect. A: Found. Crystallogr., 2008, 64, 112–122 CrossRef CAS.
- G. M. Sheldrick, Acta Crystallogr., Sect. C: Struct. Chem., 2015, 71, 3–8 Search PubMed.
- A. Spek, Utrecht University: Utrecht, The Netherlands, 2001.
- G. Kresse and J. Furthmüller, Comput. Mater. Sci., 1996, 6, 15–50 CrossRef CAS.
- G. Kresse and D. Joubert, Phys. Rev. B: Condens. Matter Mater. Phys., 1999, 59, 1758–1775 CrossRef CAS.
- J. P. Perdew, K. Burke and Y. Wang, Phys. Rev. B: Condens. Matter Mater. Phys., 1996, 54, 16533–16539 CrossRef CAS PubMed.
- N. Heidary, M. Morency, D. Chartrand, K. H. Ly, R. Iftimie and N. Kornienko, J. Am. Chem. Soc., 2020, 142, 12382–12393 CrossRef CAS.
- S. Gao, Z. Zheng, J. Lu and R. Cao, Chem. Commun., 2010, 46, 7584–7586 RSC.
- F. L. Li, P. Wang, X. Huang, D. J. Young, H. F. Wang, P. Braunstein and J. P. Lang, Angew. Chem., Int. Ed., 2019, 58, 7051–7056 CrossRef CAS.
- L. Yang, W. W. Hong, Y. Zhang, Y. Tian, X. Gao, Y. R. Zhu, G. Q. Zou, H. S. Hou and X. B. Ji, Adv. Funct. Mater., 2019, 29, 1903454 CrossRef CAS.
- R. F. Carvalhal, R. Sanches Freire and L. T. Kubota, Electroanal, 2005, 17, 1251–1259 CrossRef CAS.
- E. A. McLoughlin, K. M. Waldie, S. Ramakrishnan and R. M. Waymouth, J. Am. Chem. Soc., 2018, 140, 13233–13241 CrossRef CAS.
- M. Ko, L. Mendecki, A. M. Eagleton, C. G. Durbin, R. M. Stolz, Z. Meng and K. A. Mirica, J. Am. Chem. Soc., 2020, 142, 11717–11733 CrossRef CAS.
- Z. Qu, Y. Muhammad, W. He, J. Li, Z. Gao, J. Fu, S. Jalil Shah, H. Sun, J. Wang, Z. Huang and Z. Zhao, Chem. Eng. J., 2021, 404, 126570 CrossRef CAS.
- A. J. Bard, L. R. Faulkner and H. S. White, Electrochemical methods: fundamentals and applications, John Wiley & Sons, 2nd edn, 2022 Search PubMed.
- J. Inczédy and T. Lengyel, Compendium of analytical nomenclature: definitive rules 1997, Institut d'Estudis Catalans, 1998.
- M. Gómez-Mingot, J. Iniesta, V. Montiel, R. O. Kadara and C. E. Banks, Sens. Actuators, B, 2011, 155, 831–836 CrossRef.
Footnote |
| † Electronic supplementary information (ESI) available. CCDC 2297488 and 2297489. For ESI and crystallographic data in CIF or other electronic format see DOI: https://doi.org/10.1039/d3ma00895a |
| This journal is © The Royal Society of Chemistry 2024 |