
 Open Access Article
 This Open Access Article is licensed under a
 Creative Commons Attribution 3.0 Unported Licence
Melt stability of carbonic anhydrase in polyethylene oxide for extrusion of protein–polymer composite materials†
Samuel S.
Hays
a and
Jonathan K.
Pokorski
 *abc
*abc
aDepartment of NanoEngineering, University of California San Diego, La Jolla, CA 92093, USA. E-mail: jpokorski@ucsd.edu
bDepartment of Material Science, University of California San Diego, La Jolla, CA 92093, USA
cInstitute for Materials Discovery and Design, University of California San Diego, La Jolla, CA 92093, USA
First published on 13th February 2024
Abstract
Carbonic anhydrase is an enzyme which can convert dissolved carbon dioxide into carbonate and is commonly investigated in carbon capture applications as a green alternative to sequester carbon. It is common to immobilize the enzyme within a scaffold or polymer matrix for these applications to improve the efficiency and lifetime of the enzyme. A potential manufacturing route to generate protein–polymer composite materials at scale is melt processing: a technique capable of processing large amounts of material into pre-defined geometries. Intuitively, for such applications, the carbonic anhydrase would need to retain its activity under the harsh temperature and shear conditions associated with polymer melt processing, which had yet to be demonstrated. This manuscript demonstrates the recovery of active bovine carbonic anhydrase following high temperature and low- to moderate-shear exposure in a polyethylene oxide melt using both rheometry and twin-screw extrusion. Following processing, kinetic assays demonstrate that the enzyme can retain measurable amounts of activity, even following treatment up to 190 °C. Activity assays are supported by spectroscopic measurements suggesting that no significant structural change in the enzyme occurs until roughly 160 °C. Retaining more protein activity at higher temperatures appears to be related to the molecular weight of the polyethylene oxide in the melt. In sum, we demonstrate that carbonic anhydrase can retain appreciable activity following the rigors of melt processing in model systems and under real-world twin-screw extrusion.
Introduction
The Paris Agreement of 2015 was created, in part, as an effort to prevent the global average temperature from going 1.5 °C above pre-industrial levels. Anything beyond this 1.5 °C increase is predicted to cause significant damage to global ecosystems. Anthropogenic CO2 is a main contributor to the rising temperatures, with atmospheric CO2 levels reaching approximately 420 ppm. Roughly 60% of the CO2 ending up in the atmosphere each year comes from industry and power sectors, releasing CO2 in a complex mixture of post-combustion waste referred to as flue gas.1,2Typically, the CO2 from flue gas is captured via absorption using an amine solvent.3 The flue gas is fed into the solvent, where the CO2 reacts with the amines to form a soluble carbamate salt, while other gaseous species like N2 do not. Once the solution is saturated, it can be regenerated via heating to release CO2 in a controlled manner. The amine solution can then be reused for future CO2 capture. This technique is successful, and future improvements are aimed to improve amine stability, capture efficiency, and energy efficiency. However, heating large volumes of liquid, such as that required for amine regeneration, is energy intensive. It has been estimated that capturing 90% of the CO2 in flue gas using amine scrubbers increases energy requirements of power plants by 20–40%,1 and roughly 15% of total US energy is spent each year on performing thermal separations.4
The development of more energy efficient separation technologies remains at the forefront of carbon capture research (Fig. 1). One possible route is via enzyme-assisted conversion of CO2 into insoluble products such as calcium or magnesium carbonate. Carbonic anhydrase is an enzyme that has seen a growing interest in both academic and industrial settings. Found naturally in multiple locations throughout the body of many organisms, carbonic anhydrase assists with numerous biological processes. In mammals, for example, the enzyme primarily controls blood pH via conversion between aqueous CO2 and bicarbonate ions, shown in eqn (1).
| CO2(aq.) + H2O ↔ HCO3− + H+ | (1) |
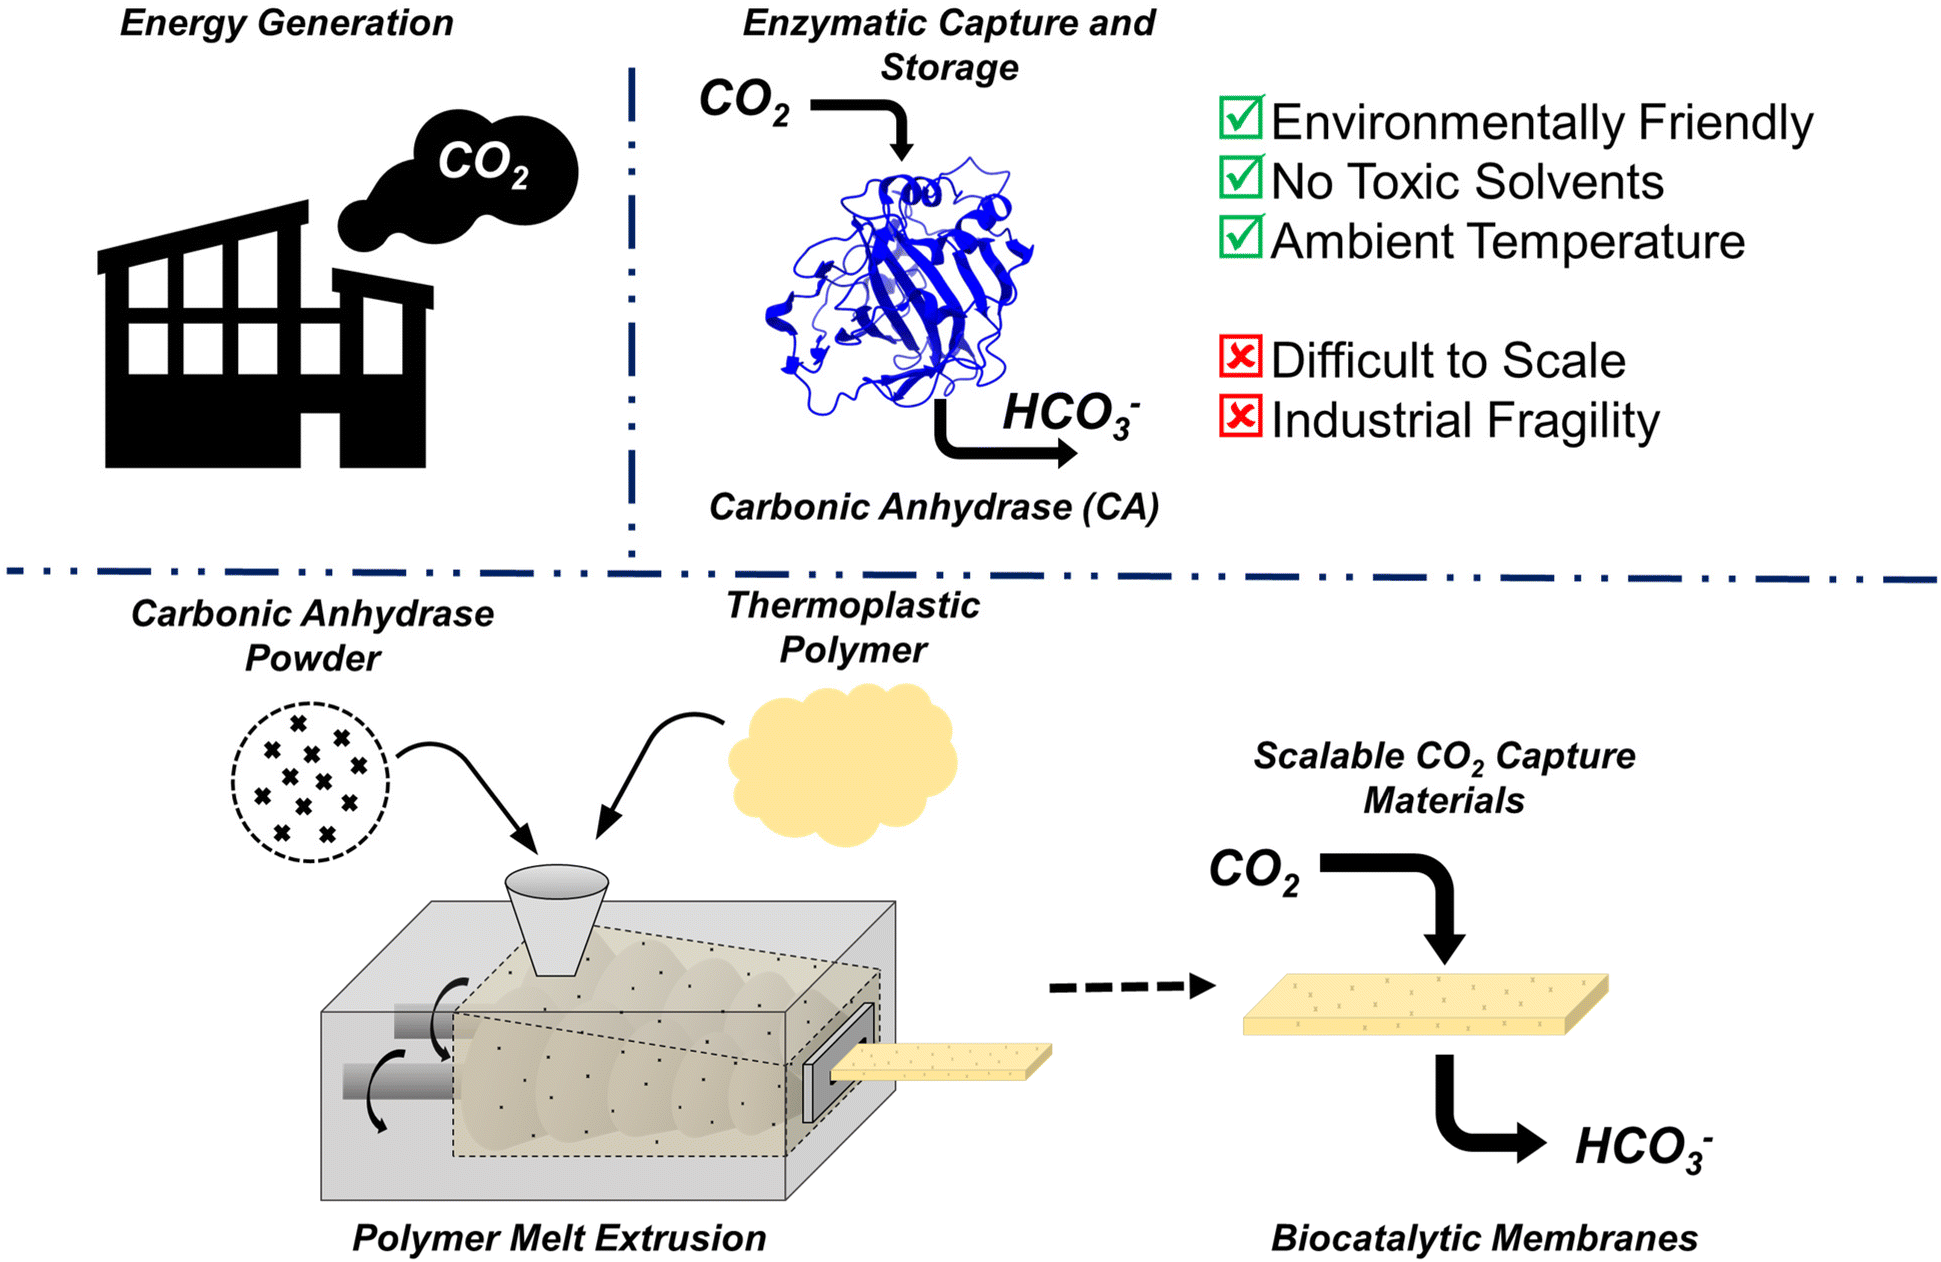 | ||
| Fig. 1 Carbonic anhydrase can be a useful tool for carbon capture, due to its ability to catalyze conversion of CO2 to HCO3−. Immobilizing the enzyme can aid in scale-up to industrial-size applications and improve enzyme stability. Enzymatic membranes produced using hot-melt extrusion (HME), present an exciting new manufacturing pathway for scalable CO2 capture materials. Capable of processing large amounts of materials at the industrial scale, this approach can rival other scalable membrane manufacturing techniques. | ||
It is also known to have a high turnover number (kcat ∼ 106 s−1), making the enzyme very attractive for CO2 capture applications.5,6 However, free carbonic anhydrase in solution has limited stability.7 Immobilization onto a solid support can improve the stability of the enzyme, broadening the shelf-life of the material or making it more thermally tolerant.8,9 There has been significant interest in immobilizing carbonic anhydrase in polymer networks for CO2 capture, with researchers taking many different approaches, including covalent attachment, crosslinking, adsorption, and entrapment.7,10
Hydrogel membranes are often used as supports for enzyme immobilization and can be envisioned as crosslinked, swollen polymer networks. Membranes, in general, are an extremely useful tool for low-energy gas separation. CO2 capture from flue gas is a key separation where hydrogel membranes can play an impactful role, as they should perform well in humid, moderate temperature and pressure environments.11,12 Immobilizing carbonic anhydrase in a hydrogel membrane can combine the catalytic efficiency of the enzyme with the good permeability and selectivity of the membrane. However, one key challenge for success is scalability of manufacturing. Over the last decade, there has been a growing interest in hot melt extrusion of protein–polymer composite materials. Here, the polymer is heated and sheared to produce a melt surrounding the protein, then this mixture is forced out of a die allowing for precise geometric control and high protein encapsulation. HME is known to have tremendous scalability,13 and should be able to compete with other common membrane manufacturing techniques, such as the common dry jet/wet quench process.
Significant work has been done in recent years demonstrating and improving the thermal stability of enzymes, showing they can maintain activity following HME. One key to preserving enzymes at high temperatures is ensuring a dehydrated environment. Small changes in H2O wt% can significantly alter the glass transition temperature (Tg), melting temperature (Tm), and denaturation temperature (Td), of a protein.14,15 Previous researchers have highlighted the importance of melt processing enzyme-containing materials in a dehydrated environment to ensure activity once the material is used at ambient temperatures.16 Taking this into account, a common polymer used to manufacture protein–polymer composite materials is polyethylene oxide (PEO), due to its low melting point and ability to form crosslinked hydrogel films.17–19
In this work, we measure the recovery of active carbonic anhydrase under various melt conditions using rheometry to mimic both temperature and shear of HME. Once ideal conditions were determined, the technology was scaled up to a lab-scale twin-screw extruder, demonstrating potential for large scale manufacturing of hydrogel composite membranes. Collectively, these results show that bovine carbonic anhydrase is a viable green catalyst for carbon-capture following melt processing. Additionally, it was observed that the PEO molecular weight chosen to produce the melt can affect protein stability. Initial steps were taken to attempt to understand this mechanism and we posit potential denaturation pathways within the melt and during aqueous dissolution post-processing. Together, the collection of these results demonstrates the feasibility of melt processing protein–polymer composites as scalable CO2 capture materials.
Experimental
Materials
PEO 3350 was purchased from Sigma-Aldrich. PEO 20![[thin space (1/6-em)]](https://www.rsc.org/images/entities/char_2009.gif) 000 and PEO 100000 were purchased from Alfa Aesar. Bradford assay reagent (Coomassie Blue G-250) was purchased from Thermo Fisher Scientific. Bovine carbonic anhydrase was purchased from Sigma-Aldrich as a mixture of bovine carbonic anhydrase isozymes with a specific activity of ≥2000 W–A units per mg protein and an estimated average molecular weight of 30 kDa by the manufacturers. p-Nitrophenyl acetate and p-nitrophenol were both purchased from Alfa Aesar. FPLC grade acetonitrile was purchased from Thermo Fisher Scientific.
000 and PEO 100000 were purchased from Alfa Aesar. Bradford assay reagent (Coomassie Blue G-250) was purchased from Thermo Fisher Scientific. Bovine carbonic anhydrase was purchased from Sigma-Aldrich as a mixture of bovine carbonic anhydrase isozymes with a specific activity of ≥2000 W–A units per mg protein and an estimated average molecular weight of 30 kDa by the manufacturers. p-Nitrophenyl acetate and p-nitrophenol were both purchased from Alfa Aesar. FPLC grade acetonitrile was purchased from Thermo Fisher Scientific.
Rheometer
Lyophilized bovine carbonic anhydrase was added to vacuum-dried PEO powder and thoroughly mixed via shaking to produce a 1.5 wt% mixture of enzyme in PEO. Powder mixtures (∼500 mg) were exposed to high temperature and shearing conditions using a Discovery HR30 rheometer from TA Instruments. The powders were loaded onto the rheometer, which had already been pre-set to the intended temperature. Four temperatures were examined in this work (100 °C, 130 °C, 160 °C, and 190 °C). Each powder sample was allowed to melt thoroughly before shearing began, which ranged from 1–3 minutes, depending on the plate temperature and the PEO molecular weight. Once thoroughly melted, the shearing plate was lowered onto the sample to give an 800 μm gap. For all experiments, a 20 mm parallel-plate attachment was used. Any sample that had been pushed out from under the parallel plate was removed before shearing began. Once all excess was removed, the samples were sheared for 15 minutes at their respective shear rates (0 s−1 or 10 s−1). Following the 15-minute shearing, the setup was cooled to 25 °C, and the sample was removed from the rheometer. The plates were cleaned using water and wiped dry before the next run was performed.Twin-screw extrusion
Lab-scale extrusion was performed using a HAAKE™ MiniCTW Micro-Conical Twin Screw Compounder. A 1.5 wt% powder mixture of lyophilized carbonic anhydrase in vacuum-dried PEO powder was created and mixed via shaking. For each extrusion, the system was preheated to the intended temperature, and the screw rotation speed was set to 20 rpm. This speed was estimated to produce a maximum shear rate of approximately 10 s−1 (Table S1†), neglecting any pressure effects, allowing for a comparison between the rheometer and the twin-screw extruder.20 Roughly 4 grams of pre-mixed PEO-enzyme powder was added to the extruder, and allowed to melt and mix using the built-in recirculating channel for 15 minutes. The melt was then extruded through a 5 mm × 0.5 mm ribbon die and collected.Formation of stock sample solutions
Following melt-processing, the protein–polymer mixtures were weighed and dissolved in 1.5 mL of 0.04 M phosphate buffer pH 7.4. The samples were mixed for approximately 12 hours to ensure complete dissolution of the polymer and protein. Next, 3 dilutions were made from each sample. The scale factor used for dilution depended on the estimated concentration, which was calculated based on the initial weight percent of the sample. To do this, the weight post-shearing but pre-dissolution was recorded and multiplied by the initial weight percent (ranged from 1.38 wt% to 1.52 wt%) to give an estimation for the total protein content left in the sample. The remaining mass was attributed to PEO.Several authors have shown the dependence of PEO–H2O solution density on the weight percent and molecular weight of PEO.21,22 As the weight percents were held relatively constant throughout, three density calculations were performed (one for each PEO molecular weight used). First, the density of the buffer, ρbuff, was determined by weighing various known volumes. Next, PEO-buffer solutions were created matching the weight percents used in shearing experiments, giving 24 hours for the polymer to completely dissolve and mix. Next, various known volumes of the solution were taken and weighed to determine the densities, ρbuff+PEO, and the average was taken for each PEO molecular weight solution. The density can then be used to calculate the total volume of solution. This value can then be used to estimate the concentration of enzyme assuming all of it was recovered post-processing (eqn (2)). Densities of control solutions are shown in the ESI (Table S2†).
 | (2) |
Here, mprotein,est is the estimated mass of protein based on the initial wt% of the protein–PEO powder mixture, ρprotein+buff is the density of the PEO + buffer solution, Vbuff is the volume of buffer added to solution, ρbuff is the density of the buffer, and mPEO,est is the estimated mass of PEO based on the initial wt% of the powder mixture. The same solution was used for each characterization (Bradford assays, activity assays, and circular dichroism spectra), and dilutions were made from it to give concentrations within the working range of each technique.
Bradford assays
A Bradford assay is a colorimetric technique used to quantify protein concentration in solution and was used in this work to estimate the percentage of protein recovered following melt-processing. Using the estimated concentration mentioned above, the dilutions were scaled to get concentrations that would produce a maximum absorbance value below 1.0 to ensure it falls within the linear range of the plate-reader instrument. 5 μL of each dilution was combined with 200 μL of Bradford reagent in a 96-well plate. The samples were all run in triplicate. Using a Synergy | HT microplate reader, absorbance measurements with a wavelength of 595 nm were taken at 2 minutes, 5 minutes, and 10 minutes. The concentrations were then calculated from the measured absorbances by comparing to a control curve, which was produced using the same concentration of protein with PEO in the same buffer to accommodate any deviation the polymer might introduce (Fig. S1–3†). It should be noted that the control curves for PEO 3350, PEO 20000 and PEO 100000 were essentially identical, suggesting that the variation in PEO molecular weight had no effect. The ratio of this calculated concentration (from the Bradford Assay), and the estimated concentration (from the initial weight percent), represents the percentage of protein that is recovered in its soluble form following shearing.
Activity assays
The activity of carbonic anhydrase was calculated by measuring the rate of hydrolysis of p-nitrophenyl acetate (PNPA), to p-nitrophenol (PNP), across various dilutions from each sheared sample using a wavelength of 410 nm in the same Synergy | HT microplate reader. 5 dilutions were made from each using the same stock buffer, with an additional control containing no enzyme. 148 μL of each dilution was combined with 22 μL of 1.00 × 10⁻² M PNPA in acetonitrile. Each dilution was run in triplicate. The reaction was monitored for 30 minutes, with absorbance readings taken every minute. Concentrations of PNP were determined by comparing to a standard curve. Various dilutions of PNP solution were made and, using the Beer–Lambert law, the product of molar extinction coefficient and path length was determined. As all samples were run under the same condition, this value should be constant for all experiments. For the calculation of protein activity, only the first 10 minutes were selected to ensure that the reaction could still be approximated as linear. The velocity of each reaction was determined by plotting the change in absorbance over time. The specific activity was then taken as the slope of reaction rate vs. protein concentration.Determining the specific activity of the enzyme (activity per unit of protein), requires knowledge of the concentration. For each sheared sample, the dilutions (0.025 mg mL−1, 0.020 mg mL−1, 0.015 mg mL−1, 0.010 mg mL−1, 0.005 mg mL−1, and 0.000 mg mL−1) were made assuming the concentration was Ci,est. Doing so allows one to compare the measured activity to the activity expected if all of the enzyme remained active.
Calculations were then reperformed using the concentration that was measured via the Bradford assay, which can provide a more accurate measurement of the activity of the carbonic anhydrase actually in solution.
For control curves, as with the Bradford assay control curves, separate experiments were performed containing each PEO molecular weight with native carbonic anhydrase to ensure that any effect PEO has on the reaction is accounted for. No significant change was observed between molecular weights (Fig. S5†).
Circular dichroism
Circular dichroism spectroscopy measurements were used to examine the secondary structure of the protein post processing. All samples were diluted to 1 mg mL−1 based on Ci, est in the same phosphate buffer mentioned above. 400 μL of each sample was loaded into a 0.2 cm path length quartz cuvette. Using an AVIV 215 circular dichroism spectrometer, the samples were scanned from 320 nm to 185 nm with a step size of 1 nm and an averaging time of 0.5 s. Each sample was scanned 4 times and the average was taken.Results and discussion
Polymer molecular weight, temperature, and screw speed are the primary variables when considering melt manufacturing conditions because they significantly impact melt viscosity and additive distribution during processing. Polymer molecular weight has also been suggested to partially affect protein stability.23 Intuitively, one may hypothesize that polymer molecular weight, temperature, and shear forces in a polymer melt may affect protein stability as well, either by changing the rate of protein diffusion in the melt, and thus aggregation, or even by changing protein denaturation thermodynamics. As such, we evaluated these three key variables using simulated extrusion conditions on a rheometer. By simulating melt extrusion on a rheometer, this allows for much smaller sample size (∼500 mg vs. ∼5 g), and more rapid screening of ideal extrusion conditions.The effect of PEO molecular weight on carbonic anhydrase stability was investigated by selecting PEO 3350, PEO 20000, and PEO 100000 and dry-blending each with carbonic anhydrase to create a 1.5 wt% protein-powder mixture. The samples were then melted in a rheometer at various temperatures (100 °C, 130 °C, 160 °C, and 190 °C) and shear rates (0−1 and 10 s−1). Each sample was sheared under their respective conditions for 15 minutes and evaluated for general protein recovery and activity.
It has been well documented that PEO can precipitate proteins from solution, so controls were first established with the same weight percents as the sheared samples, but without the high temperature exposure.24 From these results, it was observed that approximately 170 mg of PEO 3350 and PEO 20000 could be combined with 1.0 mL of phosphate buffer without producing any significant precipitation or saturating the solution with PEO. For PEO 100000, roughly 120 mg could be added to 1.0 mL of phosphate buffer to produce the homogeneous solution. These masses were used when dissolving samples following shearing conditions.
The estimated concentration was determined by using the initial powder weight percent to estimate carbonic anhydrase content and dividing that mass by the total volume of solution (eqn (2)). Next, the concentration of protein in solution was measured using a Bradford assay. Additional controls were performed to ensure that insoluble aggregated protein that resulted from shearing experiments did not contribute to the measured absorbance. This was done by heating a solution of native carbonic anhydrase above its denaturation temperature (∼90 °C), leaving for 1 hour, and performing the Bradford assay. Here it was observed that little to no signal was produced (Fig. S4†).
Bradford assay results for Rheometer–Sheared samples
Interestingly, the effect of PEO molecular weight did not play a major role in soluble protein recovery at 100 °C (Fig. 2). All three molecular weight samples, for both 0 s−1 and 10 s−1, had a protein concentration between ∼80–100% of the ideal protein concentration. Similar behavior is also observed for the samples at 130 °C, with minimal difference between the different PEO molecular weight samples. It is upon reaching 160 °C that significant deviation between samples appears. By 160 °C, the protein concentration is between 20–40% of its expected value in PEO 3350, and by 190 °C, the Bradford assay detected no protein in solution. In contrast to the PEO 3350 samples, PEO 20000 and PEO 100000 both had concentrations roughly 50% of the initial value at 160 °C, and still had at least a quarter at 190 °C for both shear rates.
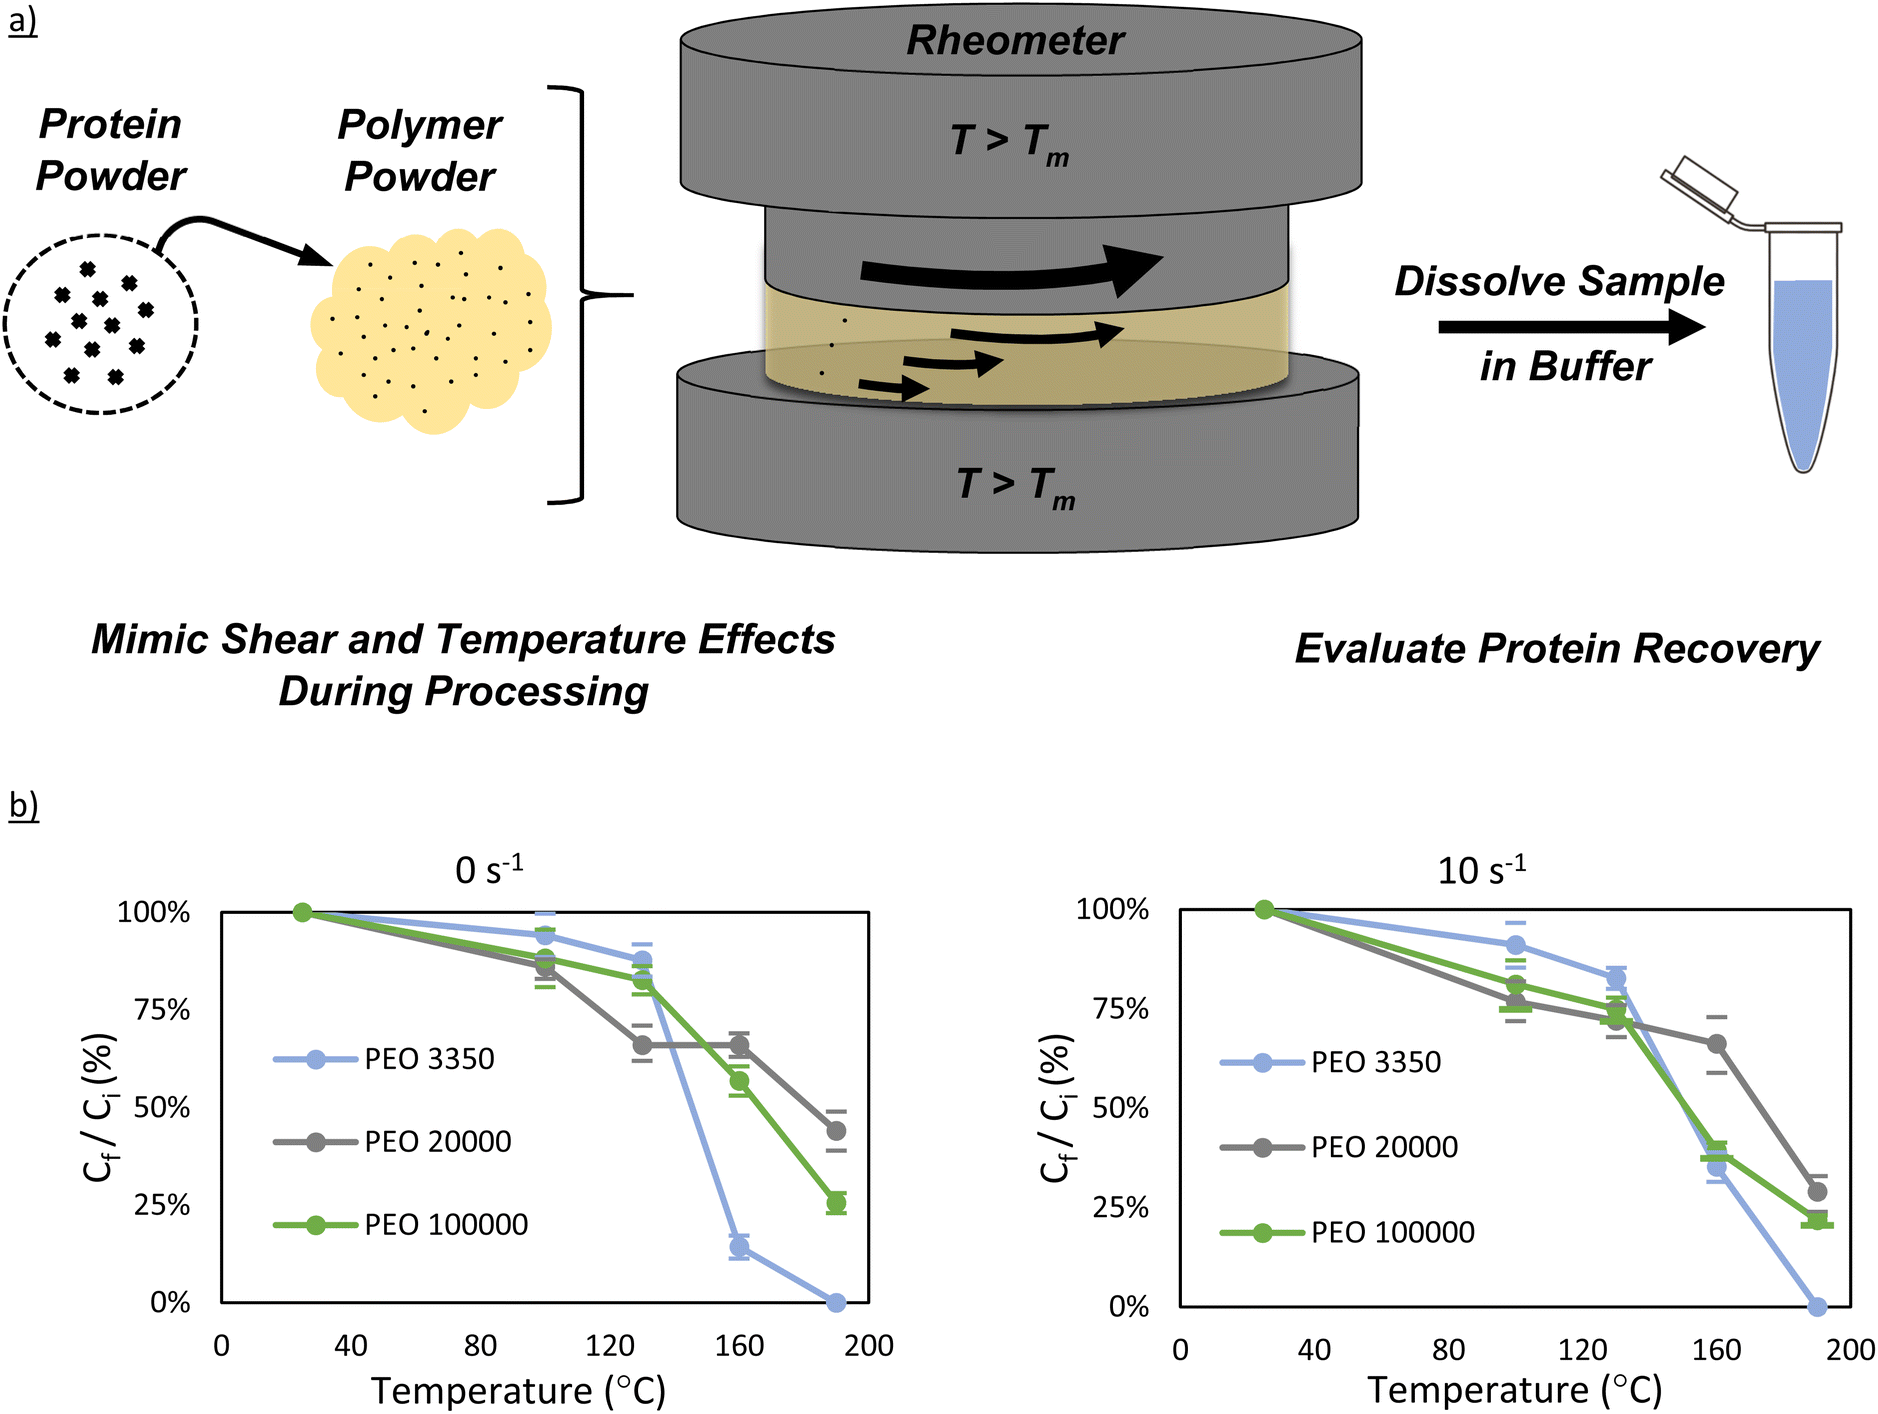 | ||
| Fig. 2 (a) A 1.5 wt% protein–polymer powder mixture was formed using lyophilized bovine carbonic anhydrase and dried PEO. Samples were loaded onto a pre-heated rheometer and sheared for 15 minutes. Samples were then cooled to room temperature and dissolved in phosphate buffer pH 7.4. (b) Bradford assays were performed to estimate protein concentration. The plots show Bradford assay results for 0 s−1 shear and 10 s−1 shear for PEO 3350 (blue), PEO 20000 (grey), PEO 100000 (green). Cf represents the concentration of protein detected via the Bradford assay. Ci represents the expected concentration based on the weight percent of the sample. | ||
Activity assay results for Rheometer–Sheared samples
Activity assays were next performed to evaluate the function of the protein recovered in solution (Fig. 3). If the specific activity calculated using Ci,est matches that of the native enzyme, this would imply that the enzyme remained largely unaffected by melt-processing. Additionally, a significant drop of specific activity would suggest Ci,est is overestimating the concentration, and measurable amounts of enzyme were lost via denaturation and aggregation. | ||
| Fig. 3 Activity assays of bovine carbonic anhydrase in phosphate buffered solution melt-processed in (a) PEO 3350 at 0 s−1 shear, (b) PEO 3350 at 10 s−1 shear, (c) PEO 20000 at 0 s−1 shear, (d) PEO 20000 at 10 s−1 shear, (e) PEO 100000 at 0 s−1 shear, (f) PEO 100000 at 10 s−1 shear. Absorbance values were monitored at 410 nm at 20 °C over a 30-minute period. Samples were run in triplicate and the error bars represent 1 standard deviation from the mean. The solid blue lines in each plot represent the specific activity based on Ci,est, while the large-dash red lines represent the specific activity based on the concentration from Bradford assays. The small-dash black lines represent ±1 standard deviation from the activity of the native enzyme at room temperature, extended for easier comparison. | ||
A sharp decrease in protein activity follows the same trend as recovered protein in solution under a given processing condition (Table 1). For instance, if a sample was shown to have a concentration that is roughly 50% of its estimated value in the Bradford assay, then the calculated activity was roughly 50% of the native activity. Additionally, similar trends with regard to PEO molecular weight were observed. For all PEO samples processed at 100 °C, the measured activity was at least 80% of the expected native carbonic anhydrase activity. After 130 °C, differences between PEO 3350 and the two higher molecular weight samples started to show, as seen in the Bradford assays, with the most noticeable difference at the highest temperature. At 190 °C, PEO 3350 samples demonstrated essentially no enzymatic activity, while PEO 20000 and PEO 100000 samples showed activities around 25% of expected values. These results again suggest that PEO molecular weight might not play a role in the recovery of protein until temperatures around 160 °C or greater, indicating that the enzyme may start to experience significant structural change near that temperature.
| PEO 3350 | PEO 20000 |
PEO 100000 |
||||||||||
|---|---|---|---|---|---|---|---|---|---|---|---|---|
| T (°C) | 0 s−1 | 10 s−1 | 0 s−1 | 10 s−1 | 0 s−1 | 10 s−1 | ||||||
| C f/Ci(%) | A f/Ai(%) | C f/Ci(%) | A f/Ai(%) | C f/Ci(%) | A f/Ai(%) | C f/Ci(%) | A f/Ai(%) | C f/Ci(%) | A f/Ai(%) | C f/Ci(%) | A f/Ai(%) | |
| 100 | 94 ± 6 | 81 ± 2 | 91 ± 6 | 96 ± 2 | 86 ± 2 | 81 ± 2 | 77 ± 5 | 76 ± 3 | 88 ± 7 | 69 ± 5 | 81 ± 6 | 90 ± 2 |
| 130 | 88 ± 4 | 68 ± 1 | 83 ± 3 | 77 ± 4 | 66 ± 5 | 60 ± 5 | 72 ± 4 | 72 ± 5 | 83 ± 4 | 66 ± 6 | 75 ± 3 | 84 ± 7 |
| 160 | 14 ± 4 | 19 ± 2 | 35 ± 4 | 43 ± 1 | 66 ± 3 | 60 ± 4 | 66 ± 7 | 58 ± 2 | 57 ± 4 | 41 ± 1 | 39 ± 2 | 48 ± 5 |
| 190 | 0 ± 1 | 3 ± 1 | 0 ± 1 | 1 ± 1 | 44 ± 5 | 57 ± 2 | 30 ± 3 | 31 ± 1 | 26 ± 3 | 22 ± 1 | 22 ± 1 | 22 ± 6 |
When the activity calculations were reperformed using the corrected concentrations measured by the Bradford assays, the specific activity was not significantly diminished from native protein activity. This result may appear obvious, but it is incredibly important. The enzyme that is successfully recovered behaves as native enzyme. This might not guarantee that the recovered enzyme is folded equivalently to the native enzyme, but circular dichroism can shed light on this. Additionally, at this point, it is unclear if the carbonic anhydrase denatured and then refolded, or if it was unaffected by melt processing altogether.
CD results for Rheometer–Sheared samples
Additionally, circular dichroism was used to examine the secondary structure of carbonic anhydrase after melt processing. Bovine carbonic anhydrase primarily consists of β-sheets and random coils, clearly shown in the far-UV region of the CD spectrum.25 Some evaluation regarding tertiary structure can be gained by examining peaks within the near-UV region, with peaks being associated with arrangements of phenylalanine, tyrosine, and tryptophan residues. Fig. 4 displays the CD spectra for each of the sheared samples. The solutions were diluted to a value of 1 mg mL−1 based on the estimated concentration, Ci, est, and scanned from 320 nm to 185 nm. Interpretation of CD spectra aligns with that of the Bradford assays and the activity assays. As the temperature of melt-processing increases, changes occur in the protein affecting secondary and tertiary structures, and thus the peak signals decrease in magnitude. This is observed most notably by the peak at approximately 220 nm. In some cases, it appears that the curves from 100 °C and 130 °C samples are similar to the control, even though the Bradford and activity assays suggest there has been some protein loss. This is most likely because aggregated protein can still display essentially native-protein secondary structure,26 and a measurable loss in activity does not always correlate directly with the same measurable loss in structure.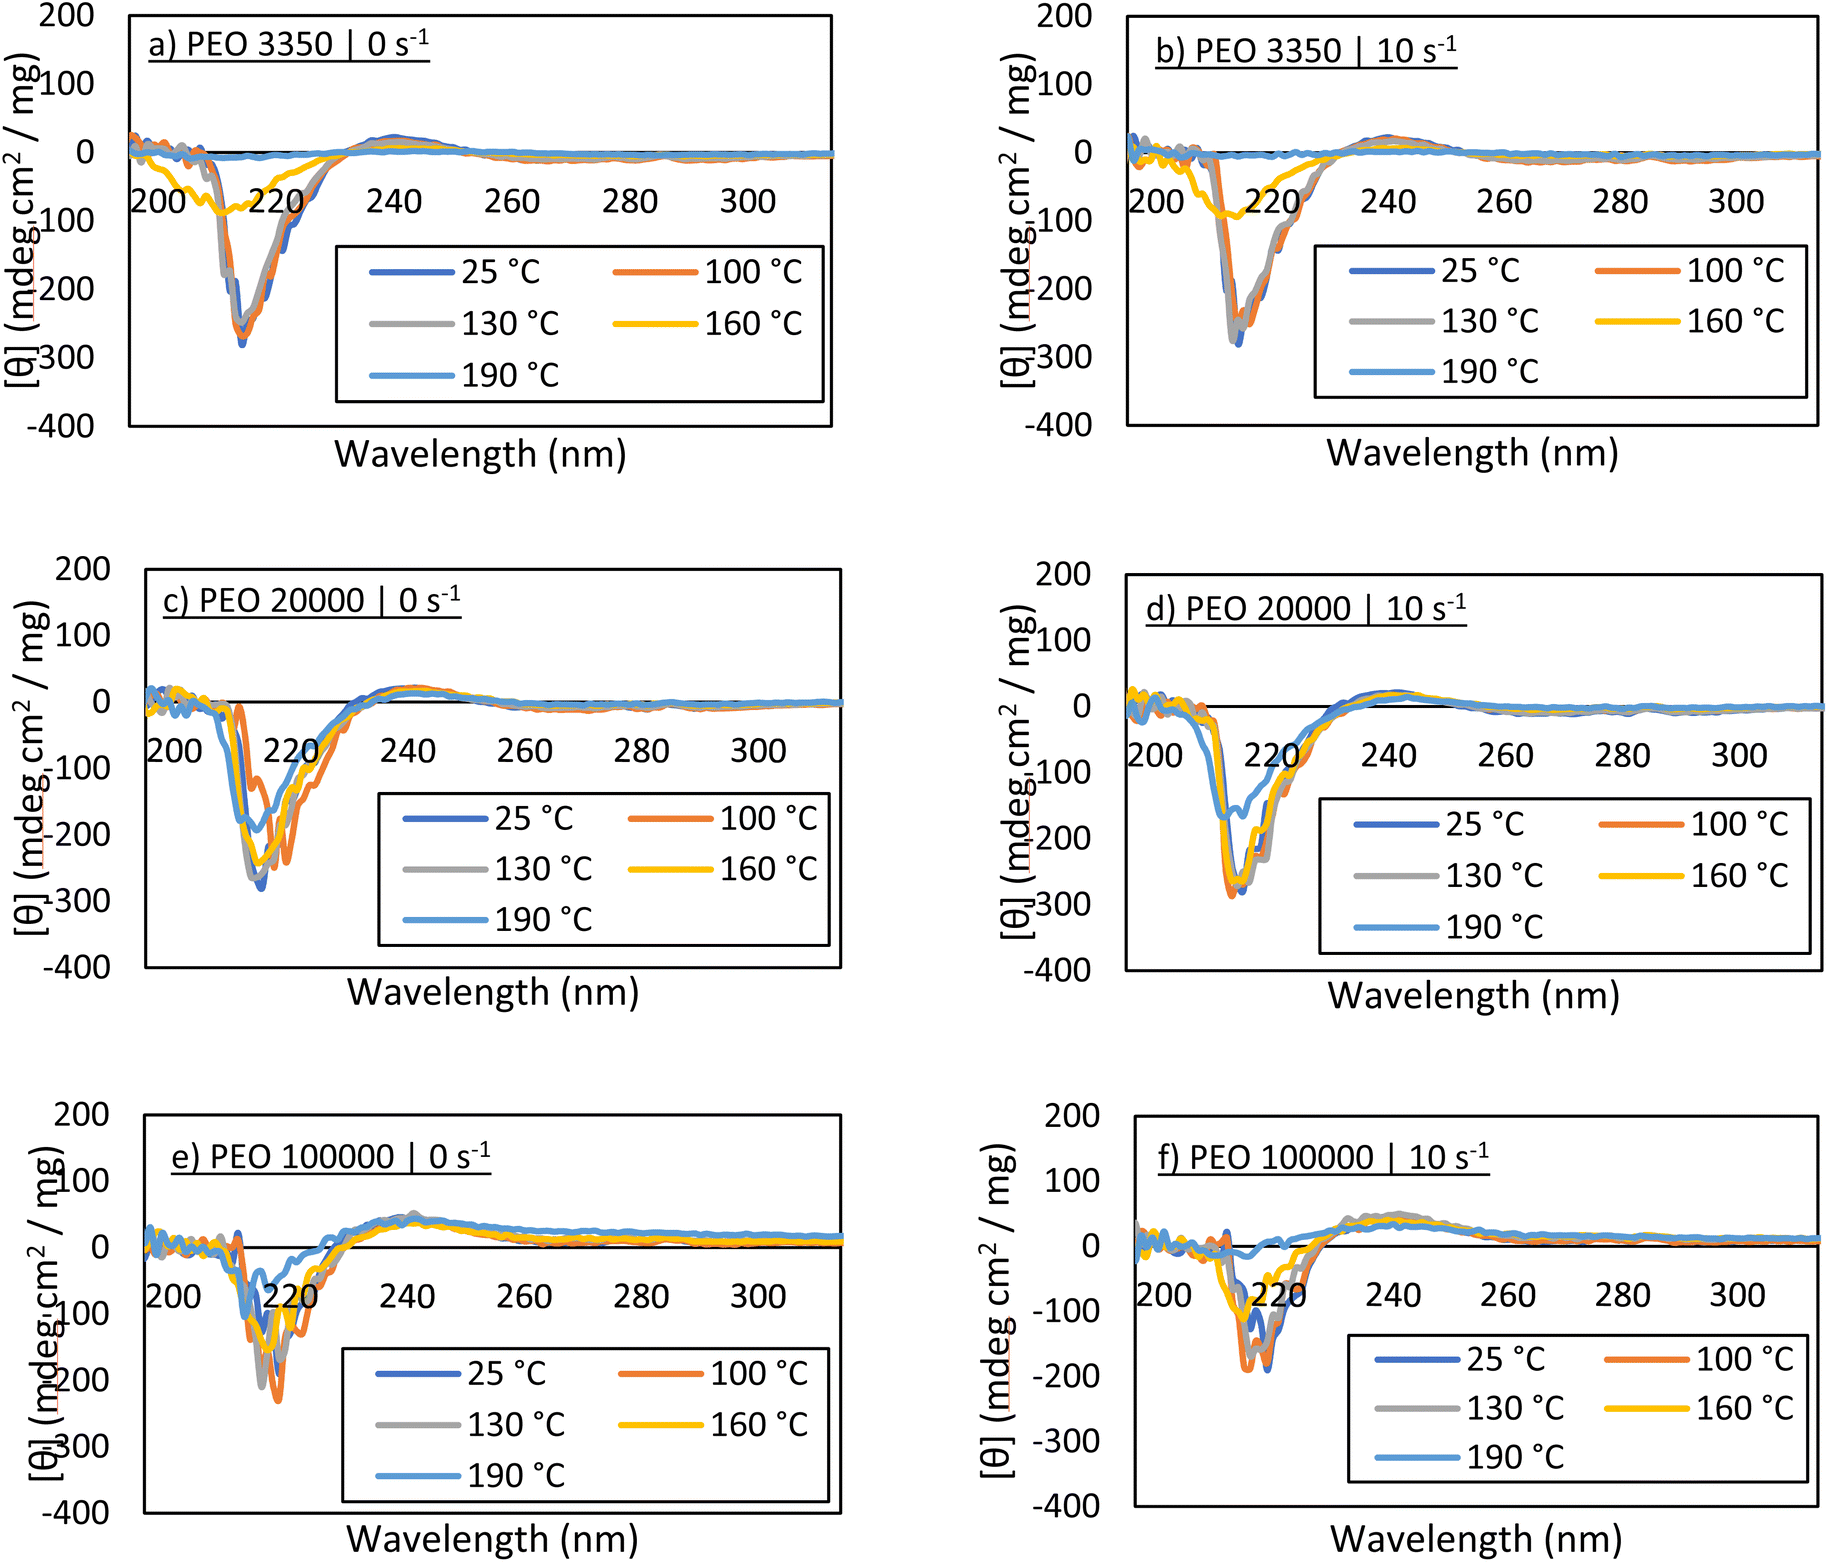 | ||
| Fig. 4 Circular dichroism spectra of bovine carbonic anhydrase in phosphate buffer solution melt-processed in (a) PEO 3350 at 0 s−1 shear, (b) PEO 3350 at 10 s−1 shear, (c) PEO 20000 at 0 s−1 shear, (d) PEO 20000 at 10 s−1 shear, (e) PEO 100000 at 0 s−1 shear, (f) PEO 100000 at 10 s−1 shear. Spectra were obtained at 25 °C across a range from 320 nm to 200 nm by single nanometer steps. 4 scans were obtained for each run, and the average was plotted. | ||
CD spectra obtained from PEO 100000 samples demonstrate a decent amount of noise. In fact, noise increases with PEO molecular weight. This is also observed even in the control sample, and thus is attributed to the presence of large PEO chains in the solution. The polymer chains do not appear to impact the placement of the peaks associated with carbonic anhydrase secondary structure, but they may affect the detection of peaks associated with tertiary structure, simply because the peaks at 280 nm and 290 nm are low in magnitude. Nevertheless, specifically at 100 °C and 130 °C for all PEO molecular weights, the secondary structure of the protein in solution appears largely unaffected. This, when paired with the activity assays, strongly suggests that the enzyme in solution resembles native carbonic anhydrase.
Scale up to twin screw extrusion
It appears that PEO 20000 and PEO 100000 are very effective at preserving carbonic anhydrase activity after melt processing. Additionally, PEO 100000 should provide good mechanical properties in future work for membrane manufacturing, post extrusion. As a result, this molecular weight was selected for scale up to a benchtop twin-screw extruder. Here, a 4 g powder mixture using the same 1.5 wt% of carbonic anhydrase was made using vacuum-dried PEO 100000 powder. The extruder was heated to a specific temperature and the screws were pre-set prior to sample addition. The powder was added, and 15 minutes were allowed for proper melting and mixing. It was then extruded through a 5 × 0.5 mm ribbon die. As with the samples described above, Bradford assays, activity assays, and circular dichroism spectroscopy were all used to examine the effects of extrusion on the protein structure (Fig. 5).
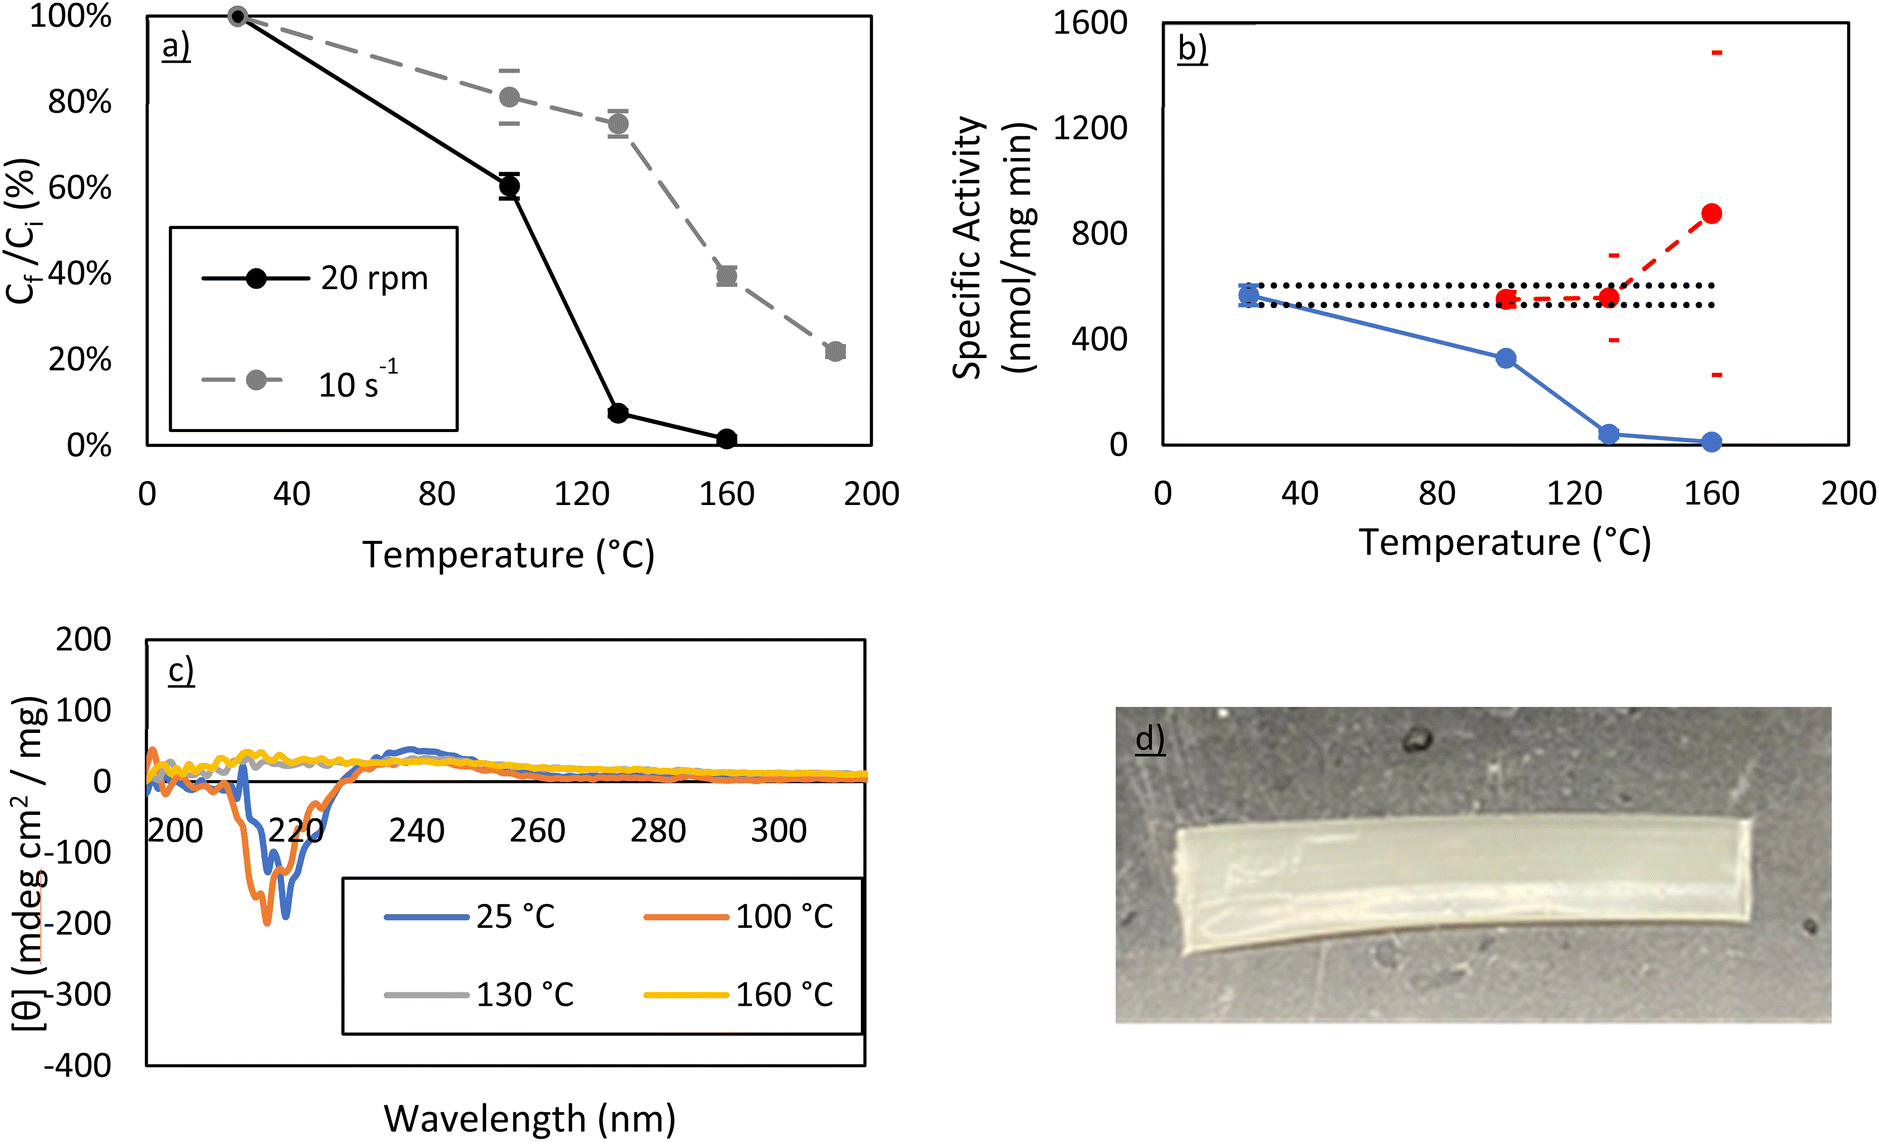 | ||
| Fig. 5 (a) Bradford assay results for PEO 100000 samples processed on a rheometer at 10 s−1 shear, and PEO 100000 samples processed on a benchtop twin-screw extruder at 20 rpm. (b) Activity assay results for PEO 100000 samples processed on a benchtop twin-screw extruder at 20 rpm. (c) CD spectra for PEO 100000 samples processed on a benchtop twin-screw extruder at 20 rpm. (d) A 1-inch segment of PEO 10000 extrudate containing 1.5 wt% CA processed at 100 °C and 20 rpm for 15 minutes. | ||
At 100 °C, a 40–50% loss of soluble protein is observed in the extruder whereby only 10–20% of protein was lost during rheometry studies at the same temperature. This is further supported by the activity assays and the CD spectra post-extrusion. Importantly, the concentration-corrected specific activity still demonstrates that the protein in solution is just as active as the control. At 130 °C and 160 °C, however, there is almost no protein left in solution. The 190 °C run was not performed as it was clear that the amount of protein recovered in solution would be essentially zero.
This suggests that the shearing forces on the protein are significantly higher in the extruder than on the rheometer. This is most likely due to pressure effects in the extruder which are known to dramatically change shear forces from simple estimations.20 Regardless, retaining 60% of carbonic anhydrase activity after melt-processing at 100 °C in a more realistic manufacturing environment is a very positive result. This percentage may be increased further in the future, either by stabilizing the protein via a technique like PEGylation,16 by changing the isozyme to a more thermally stable carbonic anhydrase, or by optimizing extrusion conditions to minimize residence time.
An obvious point of concern for manufacturing membranes like this would be ensuring the homogeneous mixing of carbonic anhydrase in the PEO polymer. Samples of equal mass were taken from the ∼1 ft-long extrudate produced using PEO 100000 at 100 °C and 20 rpm, and the concentrations of carbonic anhydrase were measured in each via a Bradford assay (Table S3†). There was very strong agreement across the 4 samples, with roughly a constant concentration observed in each. This suggests that the protein is uniformly mixed along the length of the extrudate.
Insights on the mechanism
The recovery of soluble bovine carbonic anhydrase following melt processing appears to be correlated with the molecular weight of PEO, especially at 160 °C and higher. To begin to understand why, it is useful to consider both the conformation of the protein in the polymer melt and that in aqueous solution.When the protein is in the polymer melt, an intuitive first question is whether the protein is folded or unfolded at elevated temperature. Two common theories have been investigated thoroughly in the literature related to enhanced protein stability in a lyophilized form: vitrification theory and water replacement theory. Vitrification theory suggests that the protein denaturation temperature is improved by entrapping the protein in a material with a much higher glass transition temperature, Tg. By doing so, the protein does not have the required mobility necessary to denature, as it would in a purely aqueous solution at the same temperature.27–29 PEO has a very low Tg, so it is possible that PEO cannot act as a vitrifying agent. By stringent definition, this may be true, however similar behaviors have been observed when proteins are conjugated to viscous liquids.30 Water replacement theory approaches protein stability from a thermodynamic rather than kinetic view. According to this theory, the storage material can surround and interact with the protein via hydrogen bonding, stabilizing the native protein structure at much higher temperatures.27,31,32
Both theories have been shown to play a role in enhancing protein stability, but it is unclear if either play a role in this scenario. It is also plausible that simply creating a dehydrated environment prevents protein aggregation, even if the protein is not in the native state. If carbonic anhydrase does deviate from its native state while in the melt, it may be able to simply refold once in an aqueous solution at room temperature. Dehydrating the PEO would minimize the number of interactions between an unfolded protein and a water molecule, which would limit association of denatured proteins, and shield exposed hydrophobic regions from aggregation. These competing theories can be simplified to whether the protein is in a native or non-native state in the PEO melt. Initial steps were taken to shed light on which it might be.
Protein folding is a thermodynamic process. This implies that if the protein is at equilibrium in a certain state at a certain temperature, then it should stay in that state independent of time assuming no environmental change. Protein–polymer (1.5 wt%) powder samples were prepared using PEO 3350 and PEO 100000. Because CD spectra suggest there is significant protein structural change at 160 °C when in PEO 3350, while it is not as apparent in PEO 100000, these two molecular weights were selected. In addition to 160 °C, samples were also prepared for 130 °C as well, as 130 °C was the highest temperature that appeared to have relatively small amounts of protein loss.
Similar to the methods described above, the powder mixtures were sheared in a rheometer, however, instead of 15 minutes, samples were sheared for 1 hour (Table 2). The 15-minute samples are shown as well for comparison.
| Sample | C f/Ci (%) | Activity (nmol mg−1 min−1) | |||
|---|---|---|---|---|---|
| PEO molecular weight (g mol−1) | Temperature (°C) | 15 min | 60 min | 15 min | 60 min |
| 3350 | 130 | 83 ± 3 | 40 ± 2 | 481 ± 26 | 251 ± 10 |
| 3350 | 160 | 36 ± 4 | 6 ± 2 | 265 ± 7 | 57 ± 9 |
| 100000 |
130 | 75 ± 3 | 28 ± 3 | 476 ± 37 | 185 ± 10 |
| 100000 |
160 | 39 ± 2 | 19 ± 2 | 275 ± 27 | 92 ± 9 |
All samples showed measurably more protein loss after shearing for 1 hour. This suggests that the protein is at least partially unfolded at both temperatures tested. One can envision a simplified, two-step reaction scheme to produce protein aggregates, shown below:
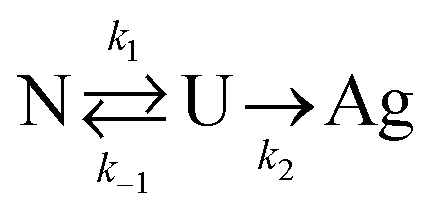 | (3) |
There is clear, non-reversible protein loss as well, related to k2 in the simplified reaction scheme. The question now is how does PEO molecular weight factor in? Brogan et al. presented evidence that proteins conjugated to an anionic polymer-surfactant can experience entropic restrictions leading to improved thermal stability.30 In another case, Lawrence and Price argued that observed entropic stabilization of PEO-protein conjugates is related to disturbance of water, lowering the density of water molecules around the protein.33 Chao et al. observed via modeling that PEO hydrogen bonding with the surface of the protein is minimal.34 Cattani, Vogeley, and Crowley modeled the interaction between a single protein–PEO conjugate and observed that the PEO monomer tends not to create a shell around the protein.35 Instead, they created a domain separate from the protein, supporting the conclusions from Chao et al., that PEO interaction with the surface of the protein cannot alone explain stabilization.
Obviously, the scenarios described are not identical to the conditions experienced during melt-processing, however they can provide guidance. These conclusions suggest that k1 in the reaction scheme above might not be affected additionally by variation in PEO molecular weight while in the melt phase. Here, the dehydrated environment and the fact that the protein is in a stable, lyophilized state may be the main contributors to protein stability (Fig. S6†).
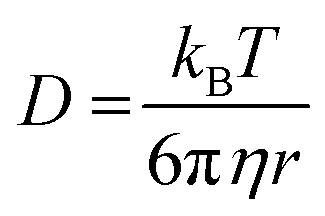
This would then suggest that the main factor contributing to protein recovery is the minimization of aggregation. When considering the role of molecular weight here, one can consider advective and diffusive transport. Insights on the effects of diffusive transport can be gained by examining the Stokes–Einstein equation:
 | (4) |
000 to PEO 3350 is 104 with a shear rate of 10 s−1 at 100 °C, and that ratio is only larger when considering melt viscosity in the 0 s−1 scenario (Table S4 and Fig. S7†). However, there is not a 104 increase in recovery when moving from PEO 3350 to PEO 100000 (Fig. 3–5). Additionally, PEO 20k has a viscosity about 102 lower than PEO 100k at 100 °C, and those samples had similar protein recovery across the entire range. It is not necessary that diffusion scales directly with stability, but one would perhaps predict a more observable relationship between the two variables if diffusion was a key factor.
Considering now advective transport, or transport via bulk motion of the melt, it is interesting that similar amounts of protein loss are observed when comparing 0 s−1 and 10 s−1 scenarios. Lyophilized carbonic anhydrase, although a fine powder, is a powder nonetheless, consisting of macroscopic clumps containing many enzymes. It is possible that the shearing forces present with a shear rate of 10 s−1 are not high enough to break up the large clumps. This would explain why protein loss is similar between the two shear rates, suggesting advective transport might not have a major role as well.
The last step in this process is the cooling and dissolution of the sample in the buffer. As mentioned above, the concentrations were selected to maximize protein in solution without any precipitation caused by the presence of PEO. However, this assumes that the protein is in the native state in solution and does not need to undergo any refolding. In the cases above, especially for samples processed under higher temperatures, the protein may be significantly unfolded, if not already aggregated. Cleland et al., over a series of publications, demonstrated that PEO can enhance carbonic anhydrase refolding in solution by minimizing interactions between unfolded proteins via weak interactions between the polymer and the protein in the molten globule state.36–38 However, they observed that this effect is dependent on the ratio between PEO molecules and protein molecules, where if the PEO-protein ratio is too high, the protein will not refold. The weight percents were maintained throughout the work, but because the molecular weights are different, the ratio of PEO molecules to protein molecules is vastly different (∼500–1000 for PEO 3350 to ∼20–30 for PEO 100000). This may explain why molecular weight is playing a role and would explain why this difference is emphasized at higher temperatures.
Conclusions
This work demonstrates the feasibility of hot-melt extrusion of bovine carbonic anhydrase in PEO to form CO2-capture materials that could be massively scaled. Melt-processing PEO-protein powder mixtures on a rheometer demonstrated that higher molecular weight PEOs led to significantly more carbonic anhydrase recovery after exposure to temperatures at and above 160 °C, with minimal difference observed at lower temperatures. This conclusion is supported by Bradford assays, activity assays, and CD spectroscopy. The reasoning behind this conclusion is still unknown, but time-dependent studies suggest that the protein is substantially unfolded at 130 °C and higher. Additionally, faster advective transport did not cause dramatically more or less protein loss. Finally, orders-of-magnitude differences in viscosity did not produce orders-of-magnitude differences in recovery. Because of these conclusions, it seems that variables like cooling rate, PEO molecule to protein molecule ratios, or other more complex protein–polymer interactions are behind the increased recovery. More work is required to better understand this dynamic however.Hot-melt extrusion results on a lab-scale twin-screw microcompounder indicated that, even in harsher environments, bovine carbonic anhydrase is still able to retain much of its activity once back at room temperature. This suggests that HME may be a viable technique to produce enzymatic CO2 capture membranes. In our future work we will examine the separation performance of these membranes.
Conflicts of interest
There are no conflicts to declare.Acknowledgements
We would like to thank Alexander M. Hoffnagle and the Tezcan Lab for assistance with the AVIV 215 circular dichroism spectrometer. We also acknowledge the support of the Division of Civil, Mechanical, and Manufacturing Innovation through the National Science Foundation (NSF CMMI 1901713).References
- D. M. D'Alessandro, B. Smit and J. R. Long, Angew. Chem., Int. Ed., 2010, 49, 6058–6082 CrossRef PubMed.
- B. Metz, O. Davidson, H. C. De Coninck, M. Loos and L. Meyer, IPCC special report on carbon dioxide capture and storage, Cambridge University Press, Cambridge, 2005 Search PubMed.
- P. Luis, Desalination, 2016, 380, 93–99 CrossRef CAS.
- D. S. Sholl and R. P. Lively, Nature, 2016, 532, 435–437 CrossRef PubMed.
- R. M. Cowan, J. J. Ge, Y. J. Qin, M. L. McGregor and M. C. Trachtenberg, Ann. N. Y. Acad. Sci., 2003, 984, 453–469 CrossRef CAS PubMed.
- D. N. Silverman and S. Lindskog, Acc. Chem. Res., 1988, 21, 30–36 CrossRef CAS.
- C. Molina-Fernández and P. Luis, J. CO2 Util., 2021, 47, 101475 CrossRef.
- H. T. Imam, P. C. Marr and A. C. Marr, Green Chem., 2021, 23, 4980–5005 RSC.
- C. Garcia-Galan, Á. Berenguer-Murcia, R. Fernandez-Lafuente and R. C. Rodrigues, Adv. Synth. Catal., 2011, 353, 2885–2904 CrossRef CAS.
- S. Ren, S. Jiang, X. Yan, R. Chen and H. Cui, J. CO2 Util., 2020, 42, 101305 CrossRef CAS.
- L.-H. Cheng, L. Zhang, H.-L. Chen and C.-J. Gao, J. Membr. Sci., 2008, 324, 33–43 CrossRef CAS.
- Z. Ziobrowski and A. Rotkegel, Materials, 2022, 15, 460 CrossRef CAS PubMed.
- Y. Zheng and J. K. Pokorski, WIREs Nanomed. Nanobiotechnol., 2021, 13, e1712 CrossRef CAS PubMed.
- M. G. Huson, E. V. Strounina, C. S. Kealley, M. K. Rout, J. S. Church, I. A. M. Appelqvist, M. J. Gidley and E. P. Gilbert, Biomacromolecules, 2011, 12, 2092–2102 CrossRef CAS PubMed.
- L. H. G. van Donkelaar, J. T. Martinez, H. Frijters, T. R. Noordman, R. M. Boom and A.-J. van der Goot, Food Res. Int., 2015, 72, 241–246 CrossRef CAS.
- P. Lee, J. Towslee, J. Maia and J. Pokorski, Macromol. Biosci., 2015, 15, 1332–1337 CrossRef CAS PubMed.
- R. S. H. Wong, M. Ashton and K. Dodou, Pharmaceutics, 2015, 7, 305–319 CrossRef CAS PubMed.
- M. Doytcheva, D. Dotcheva, R. Stamenova and C. Tsvetanov, Macromol. Mater. Eng., 2001, 286, 30–33 CrossRef CAS.
- D. Choi, W. Lee, J. Park and W. Koh, Bio-Med. Mater. Eng., 2008, 18, 345–356 CAS.
- B. Vergnes, Polymers, 2021, 13, 304 CrossRef CAS PubMed.
- W. Afzal, A. H. Mohammadi and D. Richon, J. Chem. Eng. Data, 2009, 54, 1254–1261 CrossRef CAS.
- M. M. Muñoz, D. A. Tinjacá, A. Jouyban, F. Martínez and W. E. Acree, Phys. Chem. Liq., 2018, 56, 100–109 CrossRef.
- B. Treetharnmathurot, C. Ovartlarnporn, J. Wungsintaweekul, R. Duncan and R. Wiwattanapatapee, Int. J. Pharm., 2008, 357, 252–259 CrossRef CAS PubMed.
- K. C. Ingham, in Methods in Enzymology, ed. M. P. Deutscher, Academic Press, 1990, vol. 182, pp. 301–306 Search PubMed.
- N. Sarraf, A. Saboury, B. Ranjbar and A. Moosavi-Movahedi, Acta Biochim. Pol., 2004, 51, 665–671 CrossRef CAS PubMed.
- K. Griebenow and A. M. Klibanov, Proc. Natl. Acad. Sci. U. S. A., 1995, 92, 10969–10976 CrossRef CAS PubMed.
- N. Grasmeijer, M. Stankovic, H. de Waard, H. W. Frijlink and W. L. J. Hinrichs, Biochim. Biophys. Acta, Proteins Proteomics, 2013, 1834, 763–769 CrossRef CAS PubMed.
- L. Chang, D. Shepherd, J. Sun, D. Ouellette, K. L. Grant, X. Tang and M. J. Pikal, J. Pharm. Sci., 2005, 94, 1427–1444 CrossRef CAS PubMed.
- L. Chang and M. J. Pikal, J. Pharm. Sci., 2009, 98, 2886–2908 CrossRef CAS PubMed.
- A. P. S. Brogan, G. Siligardi, R. Hussain, A. W. Perriman and S. Mann, Chem. Sci., 2012, 3, 1839–1846 RSC.
- J. H. Crowe, J. S. Clegg and L. M. Crowe, The properties of water in foods ISOPOW 6, 1998, pp. 440–455 Search PubMed.
- S. D. Allison, B. Chang, T. W. Randolph and J. F. Carpenter, Arch. Biochem. Biophys., 1999, 365, 289–298 CrossRef CAS PubMed.
- P. B. Lawrence and J. L. Price, Curr. Opin. Chem. Biol., 2016, 34, 88–94 CrossRef CAS PubMed.
- S.-H. Chao, S. S. Matthews, R. Paxman, A. Aksimentiev, M. Gruebele and J. L. Price, J. Phys. Chem. B, 2014, 118, 8388–8395 CrossRef CAS PubMed.
- G. Cattani, L. Vogeley and P. B. Crowley, Nat. Chem., 2015, 7, 823–828 CrossRef CAS PubMed.
- J. L. Cleland and T. W. Randolph, J. Biol. Chem., 1992, 267, 3147–3153 CrossRef CAS PubMed.
- J. L. Cleland, S. E. Builder, J. R. Swartz, M. Winkler, J. Y. Chang and D. I. C. Wang, Bio/Technology, 1992, 10, 1013–1019 CAS.
- J. L. Cleland, C. Hedgepeth and D. I. Wang, J. Biol. Chem., 1992, 267, 13327–13334 CrossRef CAS PubMed.
Footnote |
| † Electronic supplementary information (ESI) available. See DOI: https://doi.org/10.1039/d3lp00193h |
| This journal is © The Royal Society of Chemistry 2024 |