Green synthesis of a disordered N-doped carbonaceous aerogel from waste for the removal of over-the-counter drugs and environmental assessment†
Received
13th February 2024
, Accepted 18th February 2024
First published on 20th February 2024
Abstract
As the world grapples with the growing threat of water pollution, a particular concern is the presence of pharmaceutical pollutants in our water sources. Advanced adsorption methods for the removal of over-the-counter pharmaceuticals from wastewater have yet to appear due to the complexity of adsorbent synthesis and the risk of introducing nanomaterial contaminants into water. Herein, the risk of secondary contamination was reduced by using a sustainable, cost-effective, self-standing and super hydrophobic 3D N-doped carbonaceous aerogel (N-CA). The N-CA was synthesized in a one-pot approach using waste jaggery as a raw material. N-CA has advantageous characteristics, such as ultralight and easily separable, environmental friendliness, high stability, economic feasibility and ease in synthesis. N-CA demonstrates remarkable adsorption efficiency towards the removal of emerging pollutants with varying structures under natural conditions. In just 40 minutes, N-CA removes ∼96% of acetylsalicylic acid (ASP) and ∼99% of acetaminophen (PCM) at room temperature. The maximum adsorption capacity (qm) of N-CA was determined to be 138.6963 ± 7.8687 mg g−1 for ASP and 117.7856 ± 2.7219 mg g−1 for PCM. The recycling study of N-CA demonstrated that the PCM and ASP absorption was almost the same up to seven and five cycles, respectively. Additionally, enhanced germination of beans and healthy growth of plants were observed in treated water compared to ASP and PCM contaminated water. The observations from this study reveal the potential of waste biomass-based materials in water remediation and the value of treated water in many applications.
1. Introduction
In recent decades, the quality of our precious water resources has faced a serious threat from a multitude of factors including commercial and non-commercial use of pharmaceuticals,1 micro pollutants,2 pesticides,3 personal care products,4 and industrial waste.5,6 Water pollution has become a pressing concern with wide-ranging complications for the local environment and the public.4 Pharmaceutical waste in water also threatens the quality of drinking water and most of the medicines are not persistent but daily-use medications may be pseudo-persistent due to continuous introduction to the environment.6 Endocrine disrupting chemicals impose significant impact in the environment but they have been less explored as compared to other harmful toxicant classes like carcinogens.7 The residues of pharmaceuticals are also categorized as “compounds of emerging concern” owing to their potential to cause considerable effect on ecosystems and human health.6 The presence of pharmaceuticals such as acetylsalicylic acid or aspirin (ASP) and acetaminophen or paracetamol (PCM) in household and hospital wastewater can be responsible for the emergence of drug-resistant bacteria.8,9 Additionally, the improper disposal or flushing of unused or expired medications can accumulate in groundwater sources.10 Most wastewater treatment plants are unable to remove pharmaceuticals efficiently via several treatment methods.11 One reason for the low pharmaceutical removal efficiency is the trapping effect of the urine matrix in wastewater.1 Consequently, the implementation of adequate wastewater treatment strategies, the adoption of responsible disposal practices or remediation techniques and exploring more efficacious water purification approaches are essential to improve the environmental difficulties.
In pursuit of the same objective, adsorption,12 photocatalysis,13 activated sludge processes,14 advanced oxidation processes (AOPs),15 chemical coagulation and flocculation,16 ozonation,17 membrane bioreactors (MBRs),18 reverse osmosis (RO), electrocoagulation19 and advanced membrane filtration20 emerge as promising technologies for the mitigation of emerging pollutant concentration in water and wastewater. Each method has its pros and cons; biological treatment involves expensive enzymes, bacteria, and fungi that are difficult to handle at the same time and needs proper storage and preservation systems.21 Other methods are expensive and need further chemicals to treat pharmaceuticals present in water.22
Adsorption is considered as a highly efficient and widely applied method in wastewater treatment.23–25 Its superiority lies in its remarkable removal efficiency, potential for regeneration and reusability, ease of implementation, cost-effectiveness, vast collection of available adsorbent materials, absence of chemical additives, adaptability to diverse conditions, and its ability to complement other treatment methods.26–28 Various adsorbent materials find application in wastewater treatment to proficiently eliminate contaminants. Among the frequently utilized ones are activated carbon,29 zeolites,30 clay minerals,31 activated alumina,32 biosorbents,33 carbon nanotubes,34 polymeric resins,35 hydrous iron oxides,36 silica gel,37 and nano-carbons.38 The chemical stability, high specific surface area, recyclability and high removal efficiency are the criteria for materials to be employed as adsorbents.39
In this context, carbon-based aerogels (CAs) are a suitable candidate as an adsorbent for wastewater treatment. The CA is a three-dimensional structure with interconnected graphite sheets and ultralight in weight.40 CAs possess properties such as large surface area, tunable porosity, high adsorption capacity, rapid adsorption kinetics and reusability.41–44 CAs were previously used for the removal of pollutant dyes, heavy metal ions, spill of petroleum products and organic solvents from wastewater.45–48 There are various processes available for the synthesis of CAs. Some are chemical vapour deposition,49 sol–gel method,50 biomass pyrolysis,51 hydrothermal treatment.49,52 Among them, the biomass pyrolysis method is an appropriate method for the synthesis of highly porous CAs in a single step. Besides this, most of the methods have a complex synthesis process and high cost. The selection of precursor materials for the synthesis of CAs is an essential factor to produce a sustainable and efficient adsorbent. Various precursors used for the synthesis of CAs were reported previously,53–55 however, these are not environmentally friendly and the cost is also high, so utilization of biomass waste as a precursor material is an appropriate approach to achieve sustainability and cost effectiveness in the synthesis procedures. Additionally, doping of heteroatoms (N, S and P) in CA improves the chemical reactivity of the material.56
Herein, an environmentally compatible, cost effective and highly efficient method for the synthesis of a nitrogen-doped carbonaceous aerogel (N-CA) in a simple and single step using waste jaggery as a carbon source is reported. The high active surface area and controlled pore size of the as-synthesized N-CA allow the effective adsorption of pharmaceutical pollutants from wastewater. The removal of ASP and PCM were investigated with the as-synthesized N-CA under various conditions. Further, treated water was explored for the growth of adzuki plants. The sustainable N-CA may also be helpful for several environmental remediation technologies.
2. Experimental section
2.1. Materials
Waste jaggery collected from jaggery mills was utilized as the precursor material. We employed ASP and PCM (target pollutants), hydrochloric acid (HCl) and sodium hydroxide (NaOH) for the pH study and they were purchased from Sigma Aldrich. Ammonium chloride (NH4Cl) was procured from EMPARTA, India. The adzuki beans utilized in plant growth experiments were purchased from a local market. No additional purification of the drugs and chemicals was required, they were used as received. All the investigations were conducted using distilled water (DI) as the solvent.
2.2. Synthesis of N-CA
The sustainable N-CA was synthesized through a simple process by utilizing waste jaggery as a carbon source.57,58 Initially, waste jaggery was thoroughly blended with NH4Cl in a Petri plate. Subsequently, the resulting mixture of waste jaggery and NH4Cl was placed in a 100 mL silica boat and then put in a hot air oven for heat treatment at 150 °C for a duration of 2 h. After this treatment, a black puffed solid material was produced. Following this, the obtained product was held for 2 h at 700 °C in an argon atmosphere, resulting in the formation of a black, highly porous N-CA. For the reproducibility of the synthesis process, an equal-mass mixture design was followed, wherein 2 grams of waste jaggery were thoroughly mixed with 2 grams of NH4Cl in a Petri plate. After the completion of the synthesis process, we obtain the final product (N-CA). The standard deviation in mass of N-CA from five batches was found to be ±0.191 gram.
2.3. Instrumentation
In order to gain understanding of the structural and chemical characteristics of the synthesized N-CA, various characterization techniques were employed. Field-emission scanning electron microscopy (FE-SEM) was conducted with a JSM-7500F instrument, operating at 20 kV. For an assessment of the internal morphology and microstructure, transmission electron microscopy (TEM) was performed. Furthermore, a high-resolution transmission electron microscope (HR-TEM) instrument, FEI Tecnai G2 F30 model, operated at 200 kV was utilized to analyse the internal structure of N-CA in detail. The X-ray diffraction (XRD) pattern of N-CA was obtained using a D8-Advance Bruker XRD diffractometer, employing Cu-Kα radiation. X-ray photoelectron spectroscopy (XPS) was employed to analyse the elements and composition of N-CA using an ESCA+ Omicron Nano Technology instrument from Oxford. The N2 adsorption isotherm data were noted using an ASiQwin automated gas sorption analyser, Quantachrome Instruments.
2.4. Adsorption experiments
To evaluate the adsorption performance of the synthesized N-CA under natural conditions, ASP and PCM were utilized as model pollutants. So, we first prepared a stock solution of ASP and PCM in DI water, each having a concentration of 1000 mg L−1. The adsorption studies for ASP and PCM were performed using three different parameters, pH value (2 to 12), varying dose (0.25 to 5 mg) and temperature (20 to 60 °C) for the optimization of parameters. Kinetic studies of ASP and PCM adsorption were carried out under optimized conditions, with the concentration of ASP and PCM being 20 mg L−1 and 15 mg L−1, respectively. ASP and PCM contaminated samples were stirred with N-CA throughout the adsorption experiment. For the investigation of adsorption isotherms, the contaminated samples of ASP and PCM were prepared having concentrations of 10 to 500 mg L−1. For all the experiments, at regular intervals of 5 minutes, 3 mL of the sample was taken out and a UV-visible spectrophotometer was utilized to measure the absorbance at wavelengths of 298 nm and 244 nm for ASP and PCM, respectively. The removal or adsorption efficiency was evaluated using eqn (1); similarly the ASP and PCM adsorption capacity of N-CA was assessed by using eqn (2).| |  | (1) |
| |  | (2) |
2.5. Spiked water analysis and recycling study
For the real-world applicability and reusability of N-CA, spiked wastewater analysis and recycling study were performed. For this purpose, each targeted pollutant drug was introduced into both tap water and seawater, keeping the conditions consistent with those optimized in DI for ASP and PCM. Following this, a dose of 15 mg of N-CA was supplemented to 10 mL of prepared samples and the previously mentioned procedure was followed (section 2.4). To conduct the recycling study of N-CA, the same adsorption experiments as those for ASP and PCM were performed. However, in the recycling process, the N-CA was collected and subjected to multiple washes with DI water. Afterward, the N-CA was dried at 60 °C and then reused for identical adsorption experiments. Recycling analysis demonstrates the reusability and stability of the adsorbent.
2.6. Ecological assessment of treated water
High quality adzuki beans (Vigna angularis) were purchased from the market then thoroughly washed to remove dust and subsequently soaked in five different solutions: DI water, water contaminated with ASP, water contaminated with PCM and treated water after adsorption of ASP and PCM. Afterward, the beans were placed in the same water samples (DI water, ASP-contaminated water, PCM-contaminated water and the treated water) for germination purposes over the course of one day. Then the germinated adzuki beans were allowed to grow in the same Petri plate each containing an equal number of seeds. On the 5th day of the growth period, the growth of adzuki bean plants was observed.
3. Results and discussion
N-CA was synthesized using a waste biomass-based material as shown in Scheme 1.57,58 This synthesis procedure involves pre-heat treatment followed by post-pyrolysis. In the pre-heat treatment step, a porous aerogel was formed by the process of bubbling. Moreover, during heating NH4Cl was completely fused with jaggery after undergoing standard cooling procedures and then a solid black product was obtained. Later, the pyrolysis process was conducted for proper carbonization in a split tube furnace and exposed to temperature of up to 700 °C under a regular flow of argon gas (maintaining an inert atmosphere) setting a ramp rate at 5 °C min−1. The pyrolysis process was sustained for 2 h to facilitate complete carbonization after this, allowing for natural cooling. Finally, a highly porous, black N-CA material was obtained and then employed as an adsorbent for ASP and PCM adsorption from wastewater.
 |
| | Scheme 1 Schematic of the synthesis of ultralight N-CA using waste jaggery and NH4Cl as precursors. | |
3.1. Characterization of the N-doped carbonaceous aerogel
FE-SEM was used to observe the exterior structure of the as-synthesized N-CA. The 3D nano-architecture of the N-CA exhibits an irregular and honeycomb-like highly porous structure (Fig. 1a and b).59 This interconnected hierarchical framework is composed of crumpled disordered carbon nanosheets as depicted in Fig. 1c. The TEM image displayed that N-CA consists of very thin transparent graphitic layers (Fig. 1d).60 The presence of folds and wrinkles in N-CA shows the 3D flexibility of the disordered carbon (Fig. 1e).61 The HR-TEM image shows the surface defects in the graphitic structure of N-CA.59 The interlayer spacing between two disordered graphitic layers was 0.32 nm with respect to the (002) plane shown in Fig. 1f.62
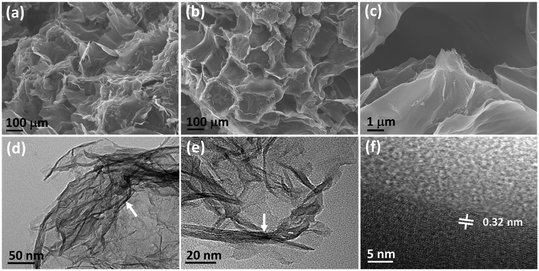 |
| | Fig. 1 (a–c) FE-SEM images of N-CA, (d and e) low-magnification TEM images (the white arrow indicates multilayer graphene) and (f) HR-TEM image of N-CA (the white line shows the inter layer distance). | |
In Fig. 2a, the XRD diffraction patterns of the N-CA reveal a prominent broad peak at 25.12°, indicating the presence of disordered graphitic carbon. Another less intense peak was observed at 43.76°, attributed to the graphitic pattern and interlayer formation.63 The XPS analysis of N-CA revealed the existence of carbon, nitrogen, and oxygen as shown in Fig. 2b. In the deconvoluted C 1s spectrum of N-CA (Fig. 2c), five distinct peaks emerged at binding energies of 284.14, 284.68, 285.43, 286.48 and 289.21 eV. These peaks were attributed to distinct carbon species: C![[double bond, length as m-dash]](https://www.rsc.org/images/entities/char_e001.gif) C sp2, C–C sp3, C–O/C
C sp2, C–C sp3, C–O/C![[double bond, length as m-dash]](https://www.rsc.org/images/entities/char_e001.gif) N, C
N, C![[double bond, length as m-dash]](https://www.rsc.org/images/entities/char_e001.gif) O/C–N and O
O/C–N and O![[double bond, length as m-dash]](https://www.rsc.org/images/entities/char_e001.gif) C–O−. The incorporation of nitrogen into the carbon framework resulted in the presence of C–N bonds. In the O 1s spectrum of N-CA, three distinctive peaks were detected, corresponding to the C
C–O−. The incorporation of nitrogen into the carbon framework resulted in the presence of C–N bonds. In the O 1s spectrum of N-CA, three distinctive peaks were detected, corresponding to the C![[double bond, length as m-dash]](https://www.rsc.org/images/entities/char_e001.gif) O, C–O and O
O, C–O and O![[double bond, length as m-dash]](https://www.rsc.org/images/entities/char_e001.gif) C–O− moieties with a binding energy of 530.72, 532.19 and 533.48 eV, respectively as depicted in Fig. 2d. Furthermore, Fig. 2e presents the high-resolution XPS spectra of N 1s, exhibiting different peaks having a binding energy of 398.20, 400.48 and 401.62 eV ascribed to pyridinic, pyrrolic and graphitic nitrogen present in N-CA, respectively.57,64 The Brunauer–Emmett–Teller (BET) surface area of N-CA was obtained by using N2 adsorption and desorption isotherms as shown in Fig. 3a. The specific surface area of N-CA was found to be 1178.18 m2 g−1 having a pore volume of 1.58 cc g−1. According to density functional theory (DFT), the pore size distribution in Fig. 3b indicates mesoporous pores (2.76 and 3.16 nm).65
C–O− moieties with a binding energy of 530.72, 532.19 and 533.48 eV, respectively as depicted in Fig. 2d. Furthermore, Fig. 2e presents the high-resolution XPS spectra of N 1s, exhibiting different peaks having a binding energy of 398.20, 400.48 and 401.62 eV ascribed to pyridinic, pyrrolic and graphitic nitrogen present in N-CA, respectively.57,64 The Brunauer–Emmett–Teller (BET) surface area of N-CA was obtained by using N2 adsorption and desorption isotherms as shown in Fig. 3a. The specific surface area of N-CA was found to be 1178.18 m2 g−1 having a pore volume of 1.58 cc g−1. According to density functional theory (DFT), the pore size distribution in Fig. 3b indicates mesoporous pores (2.76 and 3.16 nm).65
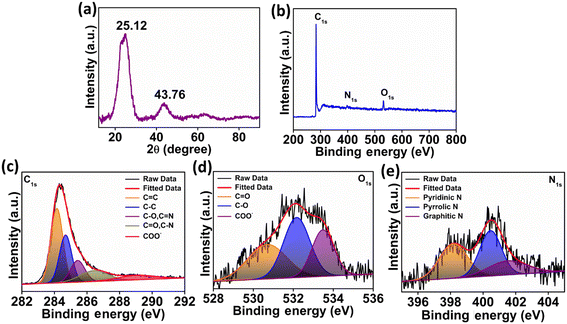 |
| | Fig. 2 (a) XRD spectrum of N-CA, (b) XPS survey scan of N-CA, (c) deconvoluted high resolution spectra of C 1s, (d) deconvoluted high resolution spectrum of O 1s and (e) deconvoluted high resolution spectrum of N 1s. | |
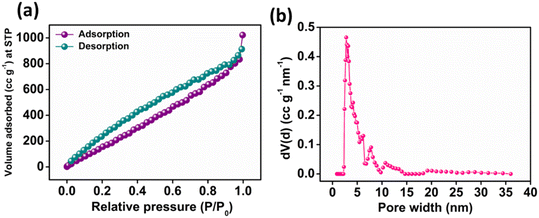 |
| | Fig. 3 (a) N2 adsorption–desorption plot and (b) pore size distribution curve of N-CA. | |
3.2. Analysis of the adsorption performance of N-CA
The adsorption of ASP and PCM onto N-CA was analysed under various conditions or parameters. The conditions included variation in pH value, dose, temperature, concentration and retention time.
The impact of the pH value on the adsorption of ASP and PCM is shown in Fig. 4a. First, slowly increasing the pH value brings a slight decline in the adsorption of both ASP and PCM by N-CA within the pH of 2 to 4. Afterward, as the pH gradually increased from 4 to 12, there was a consistent reduction in the adsorption of ASP and PCM.66 This decrease can be due to the diminishing π–π bonding between the drug and the N-CA (as an adsorbent). The influence of N-CA doses on the adsorption of ASP having a concentration of 20 mg L−1 and PCM with a 15 mg L−1 concentration was investigated. A dose of N-CA starting from 2.5 to 50 mg was added to 10 mL of sample. At first, as the N-CA dose was increased from 0.25 to 1.5 mg mL−1 there was a clear enhancement in the removal efficiency as shown in Fig. 4b. The enhancement can be accredited to the larger surface area and a high number of active sites are available for adsorption on the N-CA.67 Finally, the observations showed that the optimum N-CA dose for ASP and PCM adsorption was 1.5 mg mL−1. After a 1.5 mg mL−1 dose, the removal efficiency remains constant, which indicates that there is no rise in the removal of ASP and PCM. The effect of temperature on the adsorption of ASP and PCM was studied. Temperature is an essential factor in affecting the adsorption capacity of N-CA for pharmaceutical substances.66 The temperature-dependent removal efficiency is presented in Fig. 4c. As the temperature of the solution gradually increased from 20 to 60 °C, there was a minor reduction in the removal efficiency of both ASP and PCM. These temperature-dependent outcomes are used to calculate the thermodynamic parameters and isotherms of the adsorption process. A retention time investigation was conducted to analyse the adsorption of ASP and PCM on N-CA over time. It was observed that in the initial stage, there was a quick rise in the removal efficiency by N-CA, then reached a plateau after ∼40 min.68 This rapid adsorption at the initial stage can be because of the complete availability of the number of active sites on N-CA for the adsorption of ASP and PCM. However, after some time the number of available active sites on N-CA became gradually filled with ASP and PCM. Fig. 4d depicts the removal efficiency of N-CA over time for ASP and PCM.
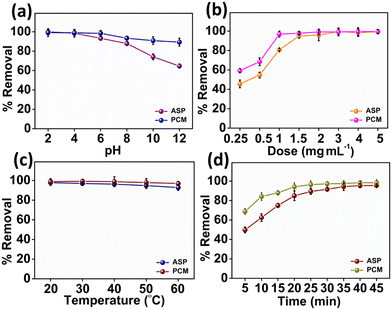 |
| | Fig. 4 Plot of the percentage removal/adsorption of ASP and PCM with parameters: (a) pH, (b) dose, (c) temperature and (d) time. | |
3.3. Kinetic studies
A comprehensive kinetic study was conducted to analyse the adsorption behaviour of ASP and PCM on the N-CA. The absorbance spectra (ASP and PCM) for the control and after 40 minutes of adsorption under optimized conditions are depicted in Fig. S1.† For the adsorption kinetics, two models were utilized, first is the pseudo-first-order (PFO) kinetics mathematically represented by eqn (3) and the other is the pseudo-second-order (PSO) kinetics expressed in eqn (4), respectively.69| | ln(qe − qt) = ln![[thin space (1/6-em)]](https://www.rsc.org/images/entities/char_2009.gif) qe − k1t qe − k1t | (3) |
| |  | (4) |
where k1 signifies the PFO rate constant, while k2 denotes the PSO rate constant. The determination of k1 and k2 was performed by plotting ln(qe − qt) against retention time, t and t/qt against t, respectively. The kinetic parameters (k1 and k2 values) obtained from the aforementioned kinetic models (eqn (3) and (4)) provide the insight of adsorption. The kinetic plots for ASP and PCM reveal R2 values of 0.8638 and 0.8837, respectively, for the PFO model (Fig. 5a). R2 values indicate that the experimental data do not fit into the PFO model. On the other hand, in Fig. 5b, the R2 values for the PSO kinetic model were calculated as 0.9975 for ASP and 0.9989 for PCM. This signifies the best linear fitting between the experimental results and the PSO model. Moreover, the calculated adsorption capacity (qe,cal) obtained from the PSO kinetic model closely matched with the experimental values (qe,exp), demonstrating the excellent fitting of this model to the experimental data. The kinetic parameters along with their respective R2 values are presented in Table S1.†
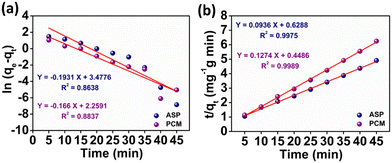 |
| | Fig. 5 Plot of the adsorption kinetics of ASP and PCM: (a) pseudo first order and (b) pseudo second order. | |
3.4. Adsorption isotherms
With the help of adsorption isotherms, we can express in which way an adsorbate is distributed between a solid surface and a liquid phase. The Langmuir isotherm suggests that the monolayer adsorption occurs on the uniform surface of the adsorbent, where a constant number of adsorption sites exist on the outer surface of any adsorbent material. The Langmuir equation,70 denoted in its linear form as eqn (5), can be expressed as follows:| |  | (5) |
where Ce (mg L−1) is the concentration of ASP and PCM at equilibrium, qm (mg g−1) indicates the maximum adsorption capacity for monolayer formation and KL (mg g−1) stands for the Langmuir constant.
Another isotherm model, the Freundlich isotherm model, was employed to define the adsorption phenomenon, which involves multilayer adsorption on the heterogeneous active sites of N-CA. The Freundlich model can be expressed in the following eqn (6).71
| |  | (6) |
where
qe (mg g
−1) is the amount of adsorbed ASP and PCM at equilibrium,
KF (mg g
−1) is the Freundlich constant,
n is the Freundlich exponent and
Ce (mg L
−1) is the equilibrium concentration of ASP and PCM.
The observed adsorption isotherm results for ASP and PCM were subjected to fitting with both Langmuir and Freundlich isotherm models. In Fig. 6a, the adsorption of ASP and PCM onto N-CA closely fitted to the Langmuir model as indicated by R2 values of 0.9842 for ASP and 0.9973 for PCM. However, when the experimental data subjected to fit into the Freundlich model, the obtained R2 values for ASP and PCM were 0.8305 and 0.9133, respectively (Fig. 6b). According to the observations, it is found that as the equilibrium concentration (Ce) increases, the equilibrium adsorption capacity (qe) increased as depicted in Fig. 7a. All parameters obtained from the Langmuir and Freundlich isotherms are mentioned in Table S2.† The maximum adsorption capacity (qm) of N-CA was determined as 138.6963 ± 7.8687 mg g−1 for ASP and 117.7856 ± 2.7219 mg g−1 for PCM. For the comparative study, another experiment was performed for the adsorption of ASP and PCM using commercially available graphene oxide (GO) under the same experimental conditions. The adsorption efficiencies of GO toward ASP and PCM were ∼71% and ∼74%, respectively, as shown in Fig. S2.† A comparison of the maximum adsorption capacity of N-CA with carbon-based and other adsorbents for ASP and PCM is given in Table 1.
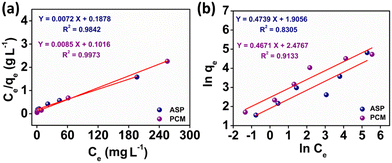 |
| | Fig. 6 Plot of the adsorption isotherms of ASP and PCM: (a) Langmuir and (b) Freundlich. | |
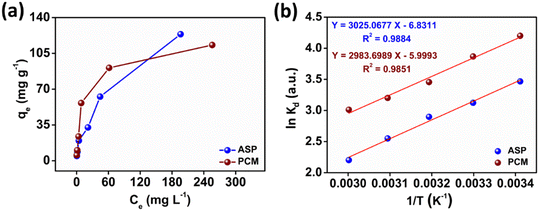 |
| | Fig. 7 The relationship between (a) qevs. Ce and (b) ln![[thin space (1/6-em)]](https://www.rsc.org/images/entities/char_2009.gif) Kdvs. 1/T. Kdvs. 1/T. | |
Table 1 Adsorption of ASP and PCM with the as-synthesized N-CA compared with various adsorbents
| Adsorbent |
Adsorbate |
q
m (mg g−1) |
Ref. |
| Reduced GO |
ASP |
21.41 |
72
|
| Graphitic-C3N4 |
ASP |
21.27 |
73
|
| Graphene nanoplates |
ASP |
12.98 |
74
|
| Pristine multiwall CNTs (PMCNT) |
ASP |
41.00 |
75
|
| Functionalized CNTs (FMCNT) |
ASP |
58.00 |
75
|
| AC from babassu coconut mesocarp |
ASP |
89.87 |
76
|
| Tannin and kraft black liquor (RFA) |
ASP |
50.17 |
77
|
| Tannin and kraft black liquor (RFC) |
ASP |
91.66 |
77
|
| N-CA |
ASP |
138.69 |
This work |
| Orange rind derived GO |
PCM |
0.542 |
78
|
| Palm kernel shell derived GO |
PCM |
0.584 |
78
|
| Graphene nanoplates |
PCM |
18.07 |
74
|
| AC from Butia capitata (high temp) |
PCM |
98.19 |
79
|
| AC from Butia capitata (low temp) |
PCM |
73.00 |
79
|
| AC from Cannabis sativa |
PCM |
16.18 |
80
|
| N-CNT-β-CD |
PCM |
41.00 |
81
|
| Fe/N-CNT-β-CD |
PCM |
75.2 |
81
|
| Tannin and kraft black liquor (RFA) |
PCM |
49.95 |
77
|
| Tannin and kraft black liquor (RFC) |
PCM |
73.58 |
77
|
| Spent tea leaves (STL-ACH) |
PCM |
59.2 |
82
|
| N-CA |
PCM |
117.78 |
This work |
The adsorption of ASP and PCM on N-CA follows the Langmuir adsorption isotherm. Further, the Langmuir separation factor (RL) is calculated using eqn (7),83 and can be expressed as follows:
| |  | (7) |
where
KL represents the Langmuir constant and
C0 denotes the initial concentrations of ASP and PCM. When the
RL values range from 0 to 1, it signifies a favourable adsorption process.
84 From
eqn (7), the calculated
RL values for ASP and PCM were 0.57 and 0.21, respectively. These outcomes indicate that the adsorption of ASP and PCM by N-CA was favourable.
3.5. Thermodynamic isotherms
The parameters of thermodynamics involved in adsorption of ASP and PCM onto N-CA were calculated using eqn (8)–(10).85–87| |  | (8) |
| |  | (9) |
where Kd represents the distribution coefficient, ΔS° denotes the entropy change (J mol−1 K−1), R signifies the universal gas constant (8.314 J mol−1 K−1), ΔH° stands for the enthalpy change (kJ mol−1), T corresponds to the temperature (Kelvin) and ΔG° represents the free energy change (kJ mol−1). Fig. 7b depicts a linear correlation between ln![[thin space (1/6-em)]](https://www.rsc.org/images/entities/char_2009.gif) Kd and 1/T and the ΔH° value was obtained from the slope and ΔS° was obtained from the intercept of the linearly fitted plot. The values of the thermodynamic parameters, ΔS°, ΔH° and ΔG°, are mentioned in Table 2. The positive values of ΔH° and ΔS° indicate the endothermic nature of ASP and PCM adsorption and increase in randomness throughout the adsorption. According to the obtained calculations of ΔH° and ΔS°, we found negative ΔG° values which signify the spontaneous adsorption of ASP and PCM on N-CA.
Kd and 1/T and the ΔH° value was obtained from the slope and ΔS° was obtained from the intercept of the linearly fitted plot. The values of the thermodynamic parameters, ΔS°, ΔH° and ΔG°, are mentioned in Table 2. The positive values of ΔH° and ΔS° indicate the endothermic nature of ASP and PCM adsorption and increase in randomness throughout the adsorption. According to the obtained calculations of ΔH° and ΔS°, we found negative ΔG° values which signify the spontaneous adsorption of ASP and PCM on N-CA.
Table 2 Thermodynamic parameters for the adsorption of ASP and PCM with N-CA
|
|
ΔS° (J mol−1 K−1) |
ΔH° (kJ mol−1) |
ΔG° (kJ mol−1) |
| 293.15 K |
303.15 K |
313.15 K |
323.15 K |
333.15 K |
| ASP |
56.79 |
25.15 |
−16.62 |
−17.19 |
−17.75 |
−18.32 |
−18.89 |
| PCM |
49.87 |
24.80 |
−14.60 |
−15.10 |
−15.59 |
−16.09 |
−16.59 |
4. Spiked sample analysis and recycle study
To evaluate the adsorption of ASP and PCM from the spiked water sample, we introduced ASP and PCM into tap water and seawater. The experiment was performed under previously mentioned optimized conditions. Herein, the N-CA demonstrated nearly identical removal efficiencies to DI water for ASP and PCM in both tap and seawater spiked samples as shown in Fig. 8a. The performance of N-CA in adsorption across different types of water highlights its promising practical applicability. Moreover, the reusability of N-CA for removal of ASP and PCM from wastewater was maintained up to ∼79% and ∼95% respectively until seven cycles as shown in Fig. 8b. After each adsorption cycle, the N-CA was collected, washed with DI water and later dried in an oven.
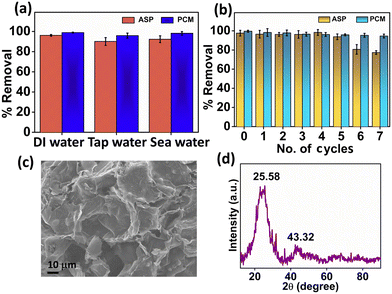 |
| | Fig. 8 (a) Percentage removal efficiency of ASP and PCM in spiked water and (b) recycling study of N-CA. Characterization of N-CA after adsorption studies. (c) FE-SEM image of N-CA and (d) XRD spectrum of N-CA after adsorption. | |
After adsorption studies, washing and drying were performed and then post-characterization (FE-SEM and XRD) was conducted to inspect the chemical and structural stability of the adsorbent material. The FE-SEM image (Fig. 8c) after adsorption of ASP shows that there are no changes in the morphology of N-CA and the pore structure is similar to that of the as-synthesized material. The XRD diffraction pattern of N-CA in Fig. 8d after the adsorption of ASP displays two peaks, which are the same as the synthesized material. This indicates that there is no change in the phase even after adsorption. These post-characterization findings clearly showed that the structural and chemical properties of N-CA (as an adsorbent) remain unchanged even after adsorption.
5. Assessment of the effect of treated water on adzuki bean growth
For the evaluation of the germination rate, adzuki beans were immersed in different water samples: DI water (used as a control), water contaminated with ASP and PCM solutions and ASP and PCM water treated with N-CA.88 In the case of the ASP contaminated water, the germination rate was ∼64%, while for the PCM contaminated water it was 0%, as depicted in Fig. 9a. There was a slight increase in the germination rate when treated water (after ASP adsorption with N-CA) reached ∼92% as compared to DI water (77%). After adsorption of PCM by N-CA, the treated water has a germination rate of ∼86%. For the growth profile analysis,89 germinated adzuki beans were cultivated in DI water, water contaminated with ASP and PCM and treated water after the adsorption of ASP and PCM with N-CA over the intervals of 5 days. The shoot and root length of the adzuki plant was obserbed to show a trend similar to the germination rate after 5 days of germination. In ASP and PCM contaminated water significantly shorter shoot and root lengths were observed as depicted in Fig. 9b. Both the shoot and root lengths were found to be shorter in the control as compared to treated water after the adsorption of ASP and PCM with N-CA. Observations revealed that ASP and PCM containing germinated seeds suppressed the growth of adzuki plants. In contrast, adzuki bean plants grown after the adsorption of ASP and PCM with N-CA exhibited improved growth compared to the DI water grown plants (Fig. 9c). The growth pattern of adzuki bean plants in DI water (control) is shown in Fig. 9d. The substantial growth enhancement in water treated with N-CA strongly supports its non-toxic impact on plant development. Furthermore, this approach holds promise for the reuse of treated wastewater.
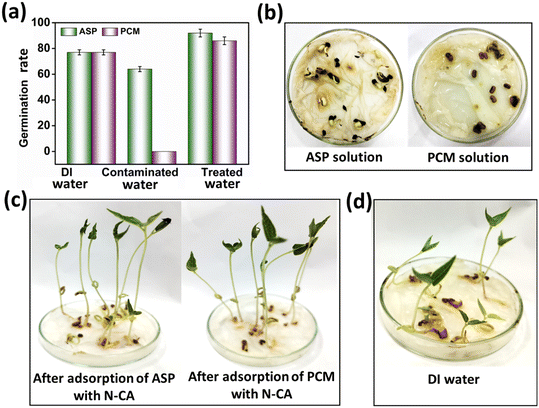 |
| | Fig. 9 The growth of adzuki plants after 5 days under different conditions: (a) germination rate, (b) ASP and PCM solutions, (c) after adsorption of ASP and PCM with N-CA and (d) DI water (control). | |
Conclusion
N-CA was successfully synthesized by using waste jaggery through a straightforward, one-step and facile pyrolysis process. The as-synthesized N-CA possesses a three-dimensional nanostructured arrangement with large surface area and high porosity, which is essential for any adsorbent. Herein, N-CA serves as an effective adsorbent for the removal of ASP and PCM drugs under natural environmental conditions. Within 40 minutes, the N-CA achieved an impressive adsorption rate of ∼96% of ASP and ∼99% of PCM. The adsorption kinetics of ASP and PCM follows the PSO kinetics model. In adsorption isotherm investigations, the obtained experimental data were more accurately fitted into the Langmuir isotherm adsorption model. The practical applicability of the N-CA was evaluated in tap water and seawater, revealing no significant change in the adsorption of ASP and PCM as compared to DI water. Furthermore, the N-CA revealed excellent reusability up to seven cycles and recovery of the adsorbent is easy without using the filtration process. The characterization of N-CA after the adsorption of ASP showed the excellent stability of the material after the seventh cycle. Later, the treated water was utilized for the germination of adzuki beans and growth of plants; the outcomes showed ∼92% germination rate for both ASP and PCM. These findings suggest that the treated water possesses significant potential for fulfilling water needs in construction sites, road side plantations and agricultural fields.
Conflicts of interest
There are no conflicts to declare.
Acknowledgements
H. A. is grateful to IIPE Visakhapatnam for the doctoral fellowship. R. M. thanks IIPE for funding (IIPE/DORD/IRG/10). K. M. T. concedes financial assistance from the Department of Biotechnology (DBT), India, through the RamalingaswamiFaculty Award (BT/RLF/Re-entry/45/2018). Authors acknowledge SBIF XRD analytical laboratory, IIPE for HR-XRD facility.
References
- C. Luo, M. Feng, V. K. Sharma and C.-H. Huang, Environ. Sci. Technol., 2019, 53, 5272–5281 CrossRef CAS PubMed.
- P. Regkouzas and E. Diamadopoulos, Chemosphere, 2019, 224, 840–851 CrossRef CAS PubMed.
- E. Nyankson, J. K. Efavi, B. Agyei-Tuffour and G. Manu, RSC Adv., 2021, 11, 17032–17045 RSC.
- S. K. Fanourakis, J. Peña-Bahamonde, P. C. Bandara and D. F. Rodrigues, npj Clean Water, 2020, 3, 1 CrossRef CAS.
- J. Sun, C. Jiang, Z. Wu, Y. Liu and S. Sun, Chemosphere, 2022, 308, 136107 CrossRef CAS PubMed.
- M. Patel, R. Kumar, K. Kishor, T. Mlsna, C. U. Pittman, Jr. and D. Mohan, Chem. Rev., 2019, 119, 3510–3673 CrossRef CAS PubMed.
- J. N'Diaye, S. Poorahong, O. Hmam, G. C. Jiménez, R. Izquierdo and M. Siaj, Membranes, 2020, 10, 340 CrossRef PubMed.
- L. Bírošová, K. Lépesová, R. Grabic and T. Mackuľak, Environ. Sci. Pollut. Res., 2020, 27, 13501–13511 CrossRef PubMed.
- M. F. Meyer, S. M. Powers and S. E. Hampton, Environ. Sci. Technol., 2019, 53, 12961–12973 CrossRef CAS PubMed.
- L. D. Freitas and G. Radis-Baptista, J. Xenobiot., 2021, 11, 61–76 CrossRef PubMed.
- L. F. Angeles, R. A. Mullen, I. J. Huang, C. Wilson, W. Khunjar, H. I. Sirotkin, A. E. McElroy and D. S. Aga, Environ. Sci.: Water Res. Technol., 2020, 6, 62–77 RSC.
- J. Mei, C. Wang, L. Kong, P. Sun, Q. Hu, H. Zhao, Y. Guo and S. Yang, J. Hazard. Mater., 2020, 381, 120967 CrossRef CAS PubMed.
- K. M. Lee, C. W. Lai, K. S. Ngai and J. C. Juan, Water Res., 2016, 88, 428–448 CrossRef CAS PubMed.
- X. Li, Z. Kuang, J. Zhang, X. Liu, J. Hu, Q. Xu, D. Wang, Y. Liu, Q. Wang, Q. Yang and H. Li, ACS Sustainable Chem. Eng., 2020, 8, 8681–8691 CrossRef CAS.
- N. Suzuki, A. Okazaki, H. Kuriyama, I. Serizawa, Y. Hirami, A. Hara, Y. Hirano, Y. Nakabayashi, N. Roy, C. Terashima, K. Nakata, K.-i. Katsumata, T. Kondo, M. Yuasa and A. Fujishima, RSC Adv., 2020, 10, 1793–1798 RSC.
- H. Cui, X. Huang, Z. Yu, P. Chen and X. Cao, RSC Adv., 2020, 10, 20231–20244 RSC.
- H. T. Van, V. H. Hoang, T. C. Luu, T. L. Vi, L. T. Q. Nga, G. S. I. J. Marcaida and T.-T. Pham, RSC Adv., 2023, 13, 28753–28766 RSC.
- F. Dolatkhah, T. Mohammadi and M. A. Tofighy, J. Water Process Eng., 2022, 50, 103222 CrossRef.
- K. Govindan, A. Angelin, M. Kalpana, M. Rangarajan, P. Shankar and A. Jang, ACS Appl. Mater. Interfaces, 2020, 12, 1775–1788 CrossRef CAS PubMed.
- B. Lee, Y. Baek, M. Lee, D. H. Jeong, H. H. Lee, J. Yoon and Y. H. Kim, Nat. Commun., 2015, 6, 7109 CrossRef CAS PubMed.
- J. K. H. Wong, H. K. Tan, S. Y. Lau, P.-S. Yap and M. K. Danquah, J. Environ. Chem. Eng., 2019, 7, 103261 CrossRef CAS.
- Y. Zeng, X. Zhan, B. Hong, Y. Xia, Y. Ding, T. Cai, K. Yin, X. Wang, L. Yang and S. Luo, Chem. Eng. J., 2023, 452, 139434 CrossRef CAS.
- R. Rashid, I. Shafiq, P. Akhter, M. J. Iqbal and M. Hussain, Environ. Sci. Pollut. Res., 2021, 28, 9050–9066 CrossRef CAS PubMed.
- A. E. Burakov, E. V. Galunin, I. V. Burakova, A. E. Kucherova, S. Agarwal, A. G. Tkachev and V. K. Gupta, Ecotoxicol. Environ. Saf., 2018, 148, 702–712 CrossRef CAS PubMed.
- J. R. de Andrade, M. F. Oliveira, M. G. C. da Silva and M. G. A. Vieira, Ind. Eng. Chem. Res., 2018, 57, 3103–3127 CrossRef CAS.
- Momina and K. Ahmad, J. Cleaner Prod., 2023, 388, 136014 CrossRef CAS.
- A. K. Badawi, M. Abd Elkodous and G. A. M. Ali, RSC Adv., 2021, 11, 36528–36553 RSC.
- A. Srivastava, B. Gupta, A. Majumder, A. K. Gupta and S. K. Nimbhorkar, J. Environ. Chem. Eng., 2021, 9, 106177 CrossRef CAS.
- R. M. C. Viegas, A. S. Mestre, E. Mesquita, M. Campinas, M. A. Andrade, A. P. Carvalho and M. J. Rosa, Sci. Total Environ., 2020, 743, 140791 CrossRef CAS PubMed.
- P. Arabkhani, H. Javadian, A. Asfaram and M. Ateia, Chemosphere, 2021, 271, 129610 CrossRef CAS PubMed.
- T. De Oliveira, E. Fernandez, L. Fougère, E. Destandau, M. Boussafir, M. Sohmiya, Y. Sugahara and R. Guégan, ACS Omega, 2018, 3, 15332–15342 CrossRef CAS PubMed.
- M. Alnajjar, A. Hethnawi, G. Nafie, A. Hassan, G. Vitale and N. N. Nassar, J. Environ. Chem. Eng., 2019, 7, 102994 CrossRef CAS.
- A. Jahanban-Esfahlan, R. Jahanban-Esfahlan, M. Tabibiazar, L. Roufegarinejad and R. Amarowicz, RSC Adv., 2020, 10, 7026–7047 RSC.
- Y. Wang, X. Wei, R. Zhang, Y. Wu, M. U. Farid and H. Huang, RSC Adv., 2017, 7, 52719–52728 RSC.
- J. Li, L. Wang, Y. Liu, P. Zeng, Y. Wang and Y. Zhang, ACS Omega, 2020, 5, 27962–27971 CrossRef CAS PubMed.
- Y. Chen, J. Shi, Q. Du, H. Zhang and Y. Cui, RSC Adv., 2019, 9, 14143–14153 RSC.
- F. Hokmabadi, R. Zadmard, M. R. Jalali and M. S. Abaee, RSC Adv., 2022, 12, 25123–25132 RSC.
- P. Kumari, K. M. Tripathi, K. Awasthi and R. Gupta, Environ. Sci. Pollut. Res., 2023, 30, 15480–15489 CrossRef CAS PubMed.
- M. J. Uddin and Y.-K. Jeong, Environ. Sci. Pollut. Res., 2020, 27, 39888–39912 CrossRef CAS PubMed.
- Y. Chen, L. Yang, S. Xu, S. Han, S. Chu, Z. Wang and C. Jiang, RSC Adv., 2019, 9, 22950–22956 RSC.
- K. Li, M. Zhou, L. Liang, L. Jiang and W. Wang, J. Colloid Interface Sci., 2019, 546, 333–343 CrossRef CAS PubMed.
- Y. Lv, Z. Liang, Y. Li, Y. Chen, K. Liu, G. Yang, Y. Liu, C. Lin, X. Ye, Y. Shi and M. Liu, Environ. Res., 2021, 194, 110652 CrossRef CAS PubMed.
- X. Liu, K. Pang, H. Yang and X. Guo, Carbon, 2020, 161, 146–152 CrossRef CAS.
- D. Zhao, Y. Wang, S. Zhao, M. Wakeel, Z. Wang, R. S. Shaikh, T. Hayat and C. Chen, Environ. Pollut., 2019, 251, 547–554 CrossRef CAS PubMed.
- T. H. Tu, P. T. N. Cam, L. V. T. Huy, M. T. Phong, H. M. Nam and N. H. Hieu, Mater. Lett., 2019, 238, 134–137 CrossRef CAS.
- Y. Zhang, L. Wu, H. Deng, N. Qiao, D. Zhang, H. Lin and Y. Chen, J. Environ. Chem. Eng., 2021, 9, 106008 CrossRef CAS.
- Y. Zhuang, S. Tang, W. Shen, F. Yang and H. K. Lee, TrAC, Trends Anal. Chem., 2023, 168, 117352 CrossRef CAS.
- M. Pan, C. Shan, X. Zhang, Y. Zhang, C. Zhu, G. Gao and B. Pan, Environ. Sci. Technol., 2018, 52, 739–746 CrossRef CAS PubMed.
- S. Long, H. Wang, K. He, C. Zhou, G. Zeng, Y. Lu, M. Cheng, B. Song, Y. Yang, Z. Wang, X. Luo and Q. Xie, Colloids Surf., A, 2020, 594, 124666 CrossRef.
- H. Yang, Z. Li, B. Lu, J. Gao, X. Jin, G. Sun, G. Zhang, P. Zhang and L. Qu, ACS Nano, 2018, 12, 11407–11416 CrossRef CAS PubMed.
- X. Kong, Y. Zhu, H. Lei, C. Wang, Y. Zhao, E. Huo, X. Lin, Q. Zhang, M. Qian, W. Mateo, R. Zou, Z. Fang and R. Ruan, J. Chem. Eng., 2020, 399, 125808 CrossRef CAS.
- K. Hu, T. Szkopek and M. Cerruti, J. Mater. Chem. A, 2017, 5, 23123–23130 RSC.
- S. Ye, Y. Liu and J. Feng, ACS Appl. Mater. Interfaces, 2017, 9, 22456–22464 CrossRef CAS PubMed.
- C. Chen, X. Zhu and B. Chen, Chem. Eng. J., 2018, 354, 896–904 CrossRef CAS.
- S. Yang, L. Zhang, Q. Yang, Z. Zhang, B. Chen, P. Lv, W. Zhu and G. Wang, J. Mater. Chem. A, 2015, 3, 7950–7958 RSC.
- Z. Li, J. Lin, B. Li, C. Yu, H. Wang and Q. Li, J. Energy Storage, 2021, 44, 103437 CrossRef.
- V. K. Bajpai, S. Shukla, I. Khan, S.-M. Kang, Y. Haldorai, K. M. Tripathi, S. Jung, L. Chen, T. Kim, Y. S. Huh and Y.-K. Han, ACS Appl. Mater. Interfaces, 2019, 11, 43949–43963 CrossRef CAS PubMed.
- H. Asati, R. Mondal and K. M. Tripathi, Environ. Sci.: Nano, 2024 10.1039/D3EN00752A.
- S. Shukla, I. Khan, V. K. Bajpai, H. Lee, T. Kim, A. Upadhyay, Y. S. Huh, Y.-K. Han and K. M. Tripathi, ACS Appl. Mater. Interfaces, 2019, 11, 18165–18177 CrossRef CAS PubMed.
- C. Maouche, Y. Zhou, J. Peng, S. Wang, X. Sun, N. Rahman, P. Yongphet, Q. Liu and J. Yang, RSC Adv., 2020, 10, 12423–12431 RSC.
- X. Shi, J. Zhu, Y. Zhang, S. He, Y. Bi and L. Zhang, RSC Adv., 2015, 5, 77130–77137 RSC.
- J. Kaushik, V. Kumar, A. K. Garg, P. Dubey, K. M. Tripathi and S. K. Sonkar, New J. Chem., 2021, 45, 9073–9083 RSC.
- T. Imboon, J. Khumphon, K. Yotkuna, I. M. Tang and S. Thongmee, SN Appl. Sci., 2021, 3, 653 CrossRef CAS.
- M. Park, A. Sharma, C. Kang, J. Han, K. M. Tripathi and H.-J. Lee, ACS Biomater. Sci. Eng., 2022, 8, 2131–2141 CrossRef CAS PubMed.
- Y. Myung, S. Jung, T. T. Tung, K. M. Tripathi and T. Kim, ACS Sustainable Chem. Eng., 2019, 7, 3772–3782 CrossRef CAS.
- T. Qiu, J.-G. Yang, X.-J. Bai and Y.-L. Wang, RSC Adv., 2019, 9, 12737–12746 RSC.
- H. Zhu, T. Chen, J. Liu and D. Li, RSC Adv., 2018, 8, 2616–2621 RSC.
- P. Kumari, K. M. Tripathi, K. Awasthi and R. Gupta, Ind. Eng. Chem. Res., 2023, 62, 13837–13847 CrossRef CAS.
- J. Zhao, L. Yu, F. Zhou, H. Ma, K. Yang and G. Wu, RSC Adv., 2021, 11, 8025–8032 RSC.
- W. Sun, W. Zhang, H. Li, Q. Su, P. Zhang and L. Chen, RSC Adv., 2020, 10, 8790–8799 RSC.
- T. L. Tan, P. A. P. Krusnamurthy, H. Nakajima and S. A. Rashid, RSC Adv., 2020, 10, 18740–18752 RSC.
- A. Zaka, T. Ibrahim and M. Khamis, Desalin. Water Treat., 2021, 212, 401–414 CrossRef CAS.
- M. Chegeni, Z. Mousavi, M. Soleymani and S. Dehdashtian, Diamond Relat. Mater., 2020, 101, 107621 CrossRef CAS.
- L. A. Al-Khateeb, S. Almotiry and M. A. Salam, J. Chem. Eng., 2014, 248, 191–199 CrossRef CAS.
- M. R. Elamin, B. Y. Abdulkhair and A. O. Elzupir, Sci. Rep., 2019, 9, 12795 CrossRef PubMed.
- M. I. Hoppen, K. Q. Carvalho, R. C. Ferreira, F. H. Passig, I. C. Pereira, R. C. P. Rizzo-Domingues, M. K. Lenzi and R. C. R. Bottini, J. Environ.
Chem. Eng., 2019, 7, 102862 CrossRef CAS.
- W. Martins Moreira, P. V. Viotti, M. G. A. Vieira, C. M. dos Santos Gaudêncio Baptista, M. H. Neves Olsen Scaliante and M. L. Gimenes, Colloids Surf., A, 2021, 608, 125597 CrossRef CAS.
- T. M. Osobamiro and A. Oladipo, Annals of Science and Technology, 2022, 7, 69–75 CrossRef.
- C. Yanan, Z. Srour, J. Ali, S. Guo, S. Taamalli, V. Fèvre-Nollet, K. da Boit Martinello, J. Georgin, D. S. P. Franco, L. F. O. Silva, G. L. Dotto, A. Erto, F. Louis, A. E. Bakali and L. Sellaoui, J. Chem. Eng., 2023, 454, 139943 CrossRef.
- M. Sajid, S. Bari, M. Saif Ur Rehman, M. Ashfaq, Y. Guoliang and G. Mustafa, Alexandria Eng. J., 2022, 61, 7203–7212 CrossRef.
- K. Mphahlele, M. S. Onyango and S. D. Mhlanga, J. Environ. Chem. Eng., 2015, 3, 2619–2630 CrossRef CAS.
- S. Wong, Y. Lim, N. Ngadi, R. Mat, O. Hassan, I. M. Inuwa, N. B. Mohamed and J. H. Low, Powder Technol., 2018, 338, 878–886 CrossRef CAS.
- R. Singh and R. Bhateria, ACS Omega, 2020, 5, 10826–10837 CrossRef CAS PubMed.
- Saruchi, M. Sharma, M. R. Hatshan, V. Kumar and A. Rana, J. Chem. Eng. Data, 2021, 66, 646–657 CrossRef CAS.
- S. A. Khan, M. F. Siddiqui and T. A. Khan, ACS Omega, 2020, 5, 2843–2855 CrossRef CAS PubMed.
- N. Mojoudi, N. Mirghaffari, M. Soleimani, H. Shariatmadari, C. Belver and J. Bedia, Sci. Rep., 2019, 9, 19352 CrossRef CAS PubMed.
- G. Özsin, M. Kılıç, E. Apaydın-Varol and A. E. Pütün, Appl. Water Sci., 2019, 9, 56 CrossRef.
- S. J. Park, G. S. Das, F. Schütt, R. Adelung, Y. K. Mishra, K. M. Tripathi and T. Kim, NPG Asia Mater., 2019, 11, 8 CrossRef CAS.
- Gunture, A. Singh, A. Bhati, P. Khare, K. M. Tripathi and S. K. Sonkar, Sci. Rep., 2019, 9, 2522 CrossRef CAS PubMed.
|
| This journal is © The Royal Society of Chemistry 2024 |
Click here to see how this site uses Cookies. View our privacy policy here.  Open Access Article
 a,
Raka
Mondal
b and
Kumud Malika
Tripathi
 *a
*a


![[double bond, length as m-dash]](https://www.rsc.org/images/entities/char_e001.gif) C sp2, C–C sp3, C–O/C
C sp2, C–C sp3, C–O/C![[double bond, length as m-dash]](https://www.rsc.org/images/entities/char_e001.gif) N, C
N, C![[double bond, length as m-dash]](https://www.rsc.org/images/entities/char_e001.gif) O/C–N and O
O/C–N and O![[double bond, length as m-dash]](https://www.rsc.org/images/entities/char_e001.gif) C–O−. The incorporation of nitrogen into the carbon framework resulted in the presence of C–N bonds. In the O 1s spectrum of N-CA, three distinctive peaks were detected, corresponding to the C
C–O−. The incorporation of nitrogen into the carbon framework resulted in the presence of C–N bonds. In the O 1s spectrum of N-CA, three distinctive peaks were detected, corresponding to the C![[double bond, length as m-dash]](https://www.rsc.org/images/entities/char_e001.gif) O, C–O and O
O, C–O and O![[double bond, length as m-dash]](https://www.rsc.org/images/entities/char_e001.gif) C–O− moieties with a binding energy of 530.72, 532.19 and 533.48 eV, respectively as depicted in Fig. 2d. Furthermore, Fig. 2e presents the high-resolution XPS spectra of N 1s, exhibiting different peaks having a binding energy of 398.20, 400.48 and 401.62 eV ascribed to pyridinic, pyrrolic and graphitic nitrogen present in N-CA, respectively.57,64 The Brunauer–Emmett–Teller (BET) surface area of N-CA was obtained by using N2 adsorption and desorption isotherms as shown in Fig. 3a. The specific surface area of N-CA was found to be 1178.18 m2 g−1 having a pore volume of 1.58 cc g−1. According to density functional theory (DFT), the pore size distribution in Fig. 3b indicates mesoporous pores (2.76 and 3.16 nm).65
C–O− moieties with a binding energy of 530.72, 532.19 and 533.48 eV, respectively as depicted in Fig. 2d. Furthermore, Fig. 2e presents the high-resolution XPS spectra of N 1s, exhibiting different peaks having a binding energy of 398.20, 400.48 and 401.62 eV ascribed to pyridinic, pyrrolic and graphitic nitrogen present in N-CA, respectively.57,64 The Brunauer–Emmett–Teller (BET) surface area of N-CA was obtained by using N2 adsorption and desorption isotherms as shown in Fig. 3a. The specific surface area of N-CA was found to be 1178.18 m2 g−1 having a pore volume of 1.58 cc g−1. According to density functional theory (DFT), the pore size distribution in Fig. 3b indicates mesoporous pores (2.76 and 3.16 nm).65
![[thin space (1/6-em)]](https://www.rsc.org/images/entities/char_2009.gif) qe − k1t
qe − k1t


![[thin space (1/6-em)]](https://www.rsc.org/images/entities/char_2009.gif) Kd and 1/T and the ΔH° value was obtained from the slope and ΔS° was obtained from the intercept of the linearly fitted plot. The values of the thermodynamic parameters, ΔS°, ΔH° and ΔG°, are mentioned in Table 2. The positive values of ΔH° and ΔS° indicate the endothermic nature of ASP and PCM adsorption and increase in randomness throughout the adsorption. According to the obtained calculations of ΔH° and ΔS°, we found negative ΔG° values which signify the spontaneous adsorption of ASP and PCM on N-CA.
Kd and 1/T and the ΔH° value was obtained from the slope and ΔS° was obtained from the intercept of the linearly fitted plot. The values of the thermodynamic parameters, ΔS°, ΔH° and ΔG°, are mentioned in Table 2. The positive values of ΔH° and ΔS° indicate the endothermic nature of ASP and PCM adsorption and increase in randomness throughout the adsorption. According to the obtained calculations of ΔH° and ΔS°, we found negative ΔG° values which signify the spontaneous adsorption of ASP and PCM on N-CA.


