
 Open Access Article
 This Open Access Article is licensed under a
 Creative Commons Attribution 3.0 Unported Licence
Impact of high conductivity on particle transport to liquid droplets for liquid marble formation†
Casey A.
Thomas
 *abc,
Benjamin T.
Lobel
bd,
Peter M.
Ireland
bc,
Erica J.
Wanless
bc,
Olivier J.
Cayre
d and
Grant B.
Webber
bc
*abc,
Benjamin T.
Lobel
bd,
Peter M.
Ireland
bc,
Erica J.
Wanless
bc,
Olivier J.
Cayre
d and
Grant B.
Webber
bc
aDepartment of Chemical Engineering, University of Melbourne, Parkville, VIC 3010, Australia. E-mail: casey.thomas@unimelb.edu.au
bCollege of Engineering, Science and Environment, University of Newcastle, Callaghan, NSW 2308, Australia
cAustralian Research Council Centre of Excellence for Enabling Eco-Efficient Beneficiation of Minerals, Australia
dSchool of Chemical and Process Engineering, University of Leeds, Leeds LS2 9JT, UK
First published on 11th December 2023
Abstract
This study investigates the influence of particle conductivity on the promotion of particle extraction and transport to a pendent liquid droplet in the presence of an electric field by applying a thin metal shell of nickel or gold onto polystyrene core particles. Despite significantly increasing the conductivity of the material, the addition of a metal shell to the core particles did not have a concomitant significant impact on initial particle extraction and transport behaviour. For the same applied potential, gold coated particles were extracted from a smaller separation distance than core polystyrene particles, while nickel coated particles were extracted from a slightly increased separation distance. Small separation distances correspond to a stronger electrostatic force required for extraction, so coating the polystyrene particles with gold made them more difficult to extract. Furthermore, these metal-coated particles were extracted from significantly smaller separation distances when compared to the same polystyrene core particles with conductive polymer shells. This is attributed more to increased inter-particle cohesion than from the increased particle mass as a result of the metal coating. In addition, the nickel and gold metal shell coated particles had differing particle hydrophobicity, impacting the final stability of the resultant liquid marble. Comparison is also made with glass core particles, to observe the impact of constant particle mass and changing conductivity and interparticle cohesion, highlighting that increasing conductivity is less significant than the opposing effect of cohesion. Herein, we conclude that the ability to form liquid marbles using an electrostatic extraction method is dependent on a complex interplay of fundamental particle properties of conductivity, density, and cohesion.
Introduction
The formation of a specific type of particle-stabilised liquid droplets, otherwise known as liquid marbles, has been increasingly studied since they first appeared in the literature in 2001.1,2 Liquid marbles consist of a small droplet of liquid coated in non-wetting particles, which allows the droplet to maintain sphericity and become mobile on solid surfaces. The simple, yet effective method of rolling a liquid drop over a bed of dry particles has led to the development of a new class of materials that exhibit notable properties, such as high mobility, low adhesion, reduced rate of evaporation of the internalised fluid and greater stability.3–5 The potential application for liquid marbles are diverse, ranging from microreactors for chemical reactions,6,7 to sensors for humidity, temperature and other external stimuli,8–13 and even carriers for drug delivery.14 Additionally, their unique properties have increased their applicability in fields such as microfluidics,15 environmental monitoring and energy harvesting, and other fields where alternate particle and liquid transport methods are required.4,16–18A novel method of liquid marble formation, utilising electrostatics, has been presented in the literature in recent years.19–21 The application of an external electric field to a bed of dry particles creates a static charge on the particle surface, and when in the presence of an earthed, pendent droplet, particles are able to be transported to the air–liquid interface. Previous studies using electrostatics for liquid marble formation have examined the influence of particle and liquid properties,19,20,22 and the mechanisms required for this kind of complex transportation method has much left to be understood.
The impact of insulating and moderately conductive particles has been previously studied,23 with the transfer of particles occurring more easily with materials of increasing conductivity, changing from polystyrene or glass,24 through to those with conductive polymer coatings.23 The impact of density and cohesion was also probed using these particles, both found to impact the ability of particles to be transferred to the liquid droplet surface.23 The range of particle size suitable for extraction from a particle bed was also investigated, using insulating core polystyrene or glass particles and moderately conductive polymer coated particles, showing a minimum suitable diameter of 20 μm.19,25 The lower size limit was reduced further in a study of highly conductive copper particles, whereby particles as small as 6 μm were extracted from the bed.26
This work extends the fundamental understanding of the impact of a broad range of particle conductivities on the interaction and transport of particles within an electric field for liquid marble formation. Previously, work in this area has investigated the impact of insulating core materials and moderately conductive polymer shells on particle transfer, and the subsequent formation and final stability of liquid marbles using electrostatics.23,24 Herein we examine the impact of the introduction of highly conductive metal shells to low-density, monodisperse polystyrene core particles, as an alternative to the polymeric shells previously examined.23,24 The method of Cayre et al. for liquid core encapsulation with thin metallic shells was adapted for the electroless deposition of thin films of nickel and gold on the core polystyrene particle surface.27–30 The impact of the significantly increased particle conductivity, and change in inter-particle cohesion, on the electrostatic extraction and transport of particles to a pendent liquid droplet has been elucidated. The separation distance between the dry particle bed and pendent droplet at which particles were first extracted, the amount of charge transferred to the drop by the attaching particles and the location of the metal-coated particles at the interface have been characterised. A simple model of the process has been used to further resolve the influence of cohesion on the threshold force required to extract a particle and the radial distance within the bed from which particles can be extracted. Comparison has been made to prior experiments of both low- and high-density polystyrene and silica glass core particles coated with a conductive polypyrrole polymer film23,31,32 in attempt to isolate the complex combined effects of particle density (mass), conductivity and cohesion.
Methods
Commercially available polystyrene (PS) particles of nominal manufacturer-quoted 80 μm diameter (Dynoseeds TS80; Microbeads, Norway) were used as core particles onto which metal shells were deposited. Electroless deposition of both nickel and gold was utilised to synthesise the PS core/metal shell particle samples, referred to as PS/Ni and PS/Au respectively.27,29,30,33 The methods for synthesis of various polypyrrole coatings (PPy) on both PS and silica glass core particles (Burwell Technologies; Australia) have been reported previously.23,24Particle size analysis
The diameter of the particles was determined using a particle size analyser (Malvern Mastersizer 2000) equipped with a small-volume sample dispersion unit (Hydro 2000SM; approximately 150 mL including the flow cell and tubing), a HeNe laser (633 nm) and a solid-state blue laser (466 nm). The stirring rate was adjusted to 2000 rpm. The raw data was analysed using the Malvern software. The mean particle diameter reported herein is the volume mean diameter (Dv). The errors reported are expressed as the standard deviations of the repeat measurements for each of the samples.Gold coated polystyrene – PS/Au
Gold coating of the core PS particles was achieved following the procedure outlined by Hitchcock et al., as shown schematically in Fig. 1.28 Synthesised platinum nanoparticles (Pt-NPs) were utilised to coat the PS particle first and acted as a seed layer to ensure the gold plating occurs exclusively at the PS surface. The Pt-NPs were synthesised using the following method. A 0.0067 wt% polyvinylpyrrolidone (PVP, 40 kDa, 99%, Sigma Aldrich), used as a stabilising agent for the nanoparticle sample, was dissolved in Milli-Q water (Merck Millipore, 18.2 MΩ cm at 25 °C) and stirred overnight. 0.23 g of chloroplatinic acid hydrate solid (99%, Sigma Aldrich) was added to 100 mL of the PVP solution in a conical flask and stirred vigorously for 5 hours. 2 mL of a reducing agent solution (1.12 M NaBH4, 99%, Sigma Aldrich) was then injected (without air) via a syringe into the platinum/PVP solution, under the air/liquid interface. After stirring for 5 minutes Pt-NPs were formed,28 subsequently filtered through a 0.2 μm syringe filter and immediately stored in the fridge at 4 °C until required, only being used less than a month after synthesis.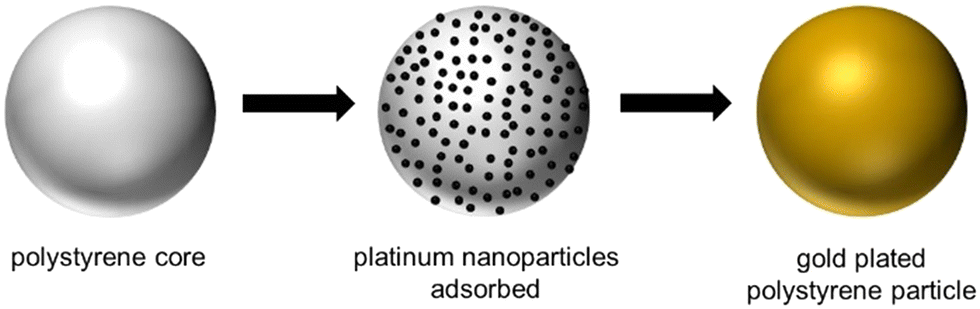 | ||
| Fig. 1 Graphical schematic depicting the synthetic steps of the addition of a gold shell to a polystyrene core particle. | ||
To adsorb the Pt-NPs onto the PS core particles, 1 g PS particles, 9 g H2O and 10 mL of the Pt-NP suspension was mixed on a stirrer table for 24 h, in a 40 mL glass vial. Following this, the nanoparticle laden PS particles (displayed as centre schematic in Fig. 1) were washed ten times with water (allowing the particles to settle under gravity between washes), and 5 g of the final wash left in the vial with the particles, ready to begin the gold coating process. To the same vial, 5 mL of 0.2 wt% PVP solution and 6 mL of 100 mM chloroauric acid solution (99.99%, Sigma Aldrich) was added while stirring at 1000 rpm, ensuring all particles were suspended. 16 mL of H2O2 (7%, Sigma Aldrich) was then quickly added, as a reducing agent, and stirring continued for 5 min. Gold coated PS particles were then rinsed gently twice with water and dried in an oven at 80 °C overnight. Fig. 1 shows an example schematic highlighting the core polystyrene particle (left), Pt-NP adsorption (middle) and metal plating (right) steps. From here on, these particles are referred to as PS/Au.
Nickel coated polystyrene – PS/Ni
Other NPs and metal combinations have been tested for metal shell deposition onto particle surfaces,34 and the use of palladium NPs for nickel reduction has been successful. The general approach to prepare the PS/Ni particles also follows the schematic in Fig. 1 with the specific details outlined here. In a 50 mL volumetric flask, 0.80 g of PVP was diluted in methanol (up to 50 mL), with overnight sonication to facilitate dissolution of the polymeric solid. 10 mL of this PVP/methanol solution was added to 0.003 g of palladium acetate (Pd(OAc)2) and sonicated to dissolve. 0.04 g of NaBH4 (reducing agent) was added to 10 mL of Milli-Q water and allowed to dissolve. Subsequently 0.18 g of this reducing solution was added to the PVP/methanol/Pd(OAc)2 solution and sonicated for 5 minutes until the complete reduction of the palladium salt into metal nanoparticles was completed. This palladium nanoparticle (Pd-NP) dispersion was kept refrigerated when not in use.Palladium nanoparticle adsorption onto the core PS particles was undertaken overnight by mixing 1.0 g PS particles, 19 g methanol and 5.0 mL of the Pd-NP solution on a shaker table. After 15 h, the sample was removed and washed once with methanol (the particles settled rapidly under gravity) followed by three times with distilled water, with as much of the liquid removed as possible on the final rinse. The 40 mL glass vial of particles, with 15 mL of Tifoo Nickel-Star™ added, was then placed into a stirred oil bath set to 80 °C for 15 minutes to reach thermal equilibrium. Stirring was set to 500 rpm to ensure the particles remained suspended in the vial. 1.2 mL of reducing agent, Tifoo Reduktor™,35 was added to initiate the nickel-plating reduction reaction, and the vial left until bubbling of the gaseous hydrogen product was concluded (approximately 5 min reaction time). The sample was removed from the oil bath and washed with Milli-Q water five times to remove any excess reagents and extraneous reduced nickel. The sample was then placed in an oven at 80 °C overnight to dry the particle sample. Subsequently these particles are referred to as PS/Ni.
The integrity of both metal shell coatings was assessed via scanning electron microscopy (SEM) (Zeiss VP Gemini, 2 kV, 4.8 mm WD, with samples Pt coated), and the thickness of the nickel layer was observed to be approximately 1.7 μm from visual measurement (Fig. 3). Calculation of the thickness of the gold coating was undertaken based on the amount of gold added to the coating process initially, and assuming complete conversion to a uniform solid gold coverage, the maximum thickness possible is 100 nm; the true thickness is likely less, on the order of 50 nm as previously reported.29
Electrostatic particle transport experiments
Particle transport and liquid marble formation experiments were completed following a methodology described in detail previously, depicted in Fig. 2 below.19,23 A concave glass slide with a prepared bed of particles was placed on a metal plate on top a motorised platform (Thorlabs). A constant negative potential was applied to the metal plate through the use of a high-voltage DC power supply (Spellman Bertan) throughout each experiment. An earthed metal needle of 1.2 mm outer diameter was positioned above the platform and particle bed to deliver a fresh 5 μL droplet of tap water via a syringe pump (Harvard Apparatus) for every experiment. The platform and particle bed were raised to a constant initial separation distance between the bed and droplet. The intended electrical potential, 1.0, 2.0 or 3.0 kV, was applied and the bed movement toward the pendent droplet at a rate of 50 μm s−1 initiated. These experiments were conducted in triplicate for the metal-shelled PS particles. All experiments were recorded by optical videography (Panasonic GH5 with MicroNikkor 105 mm f/2.8 lens) to be later analysed (Adobe Creative Cloud®).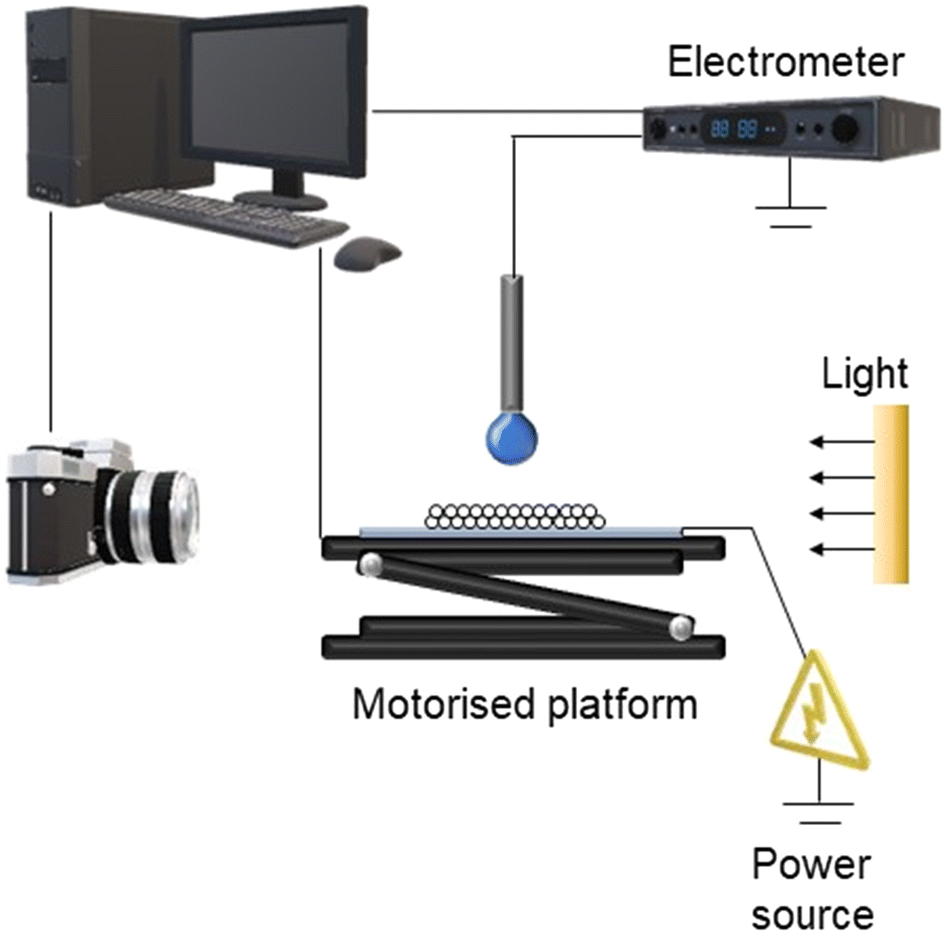 | ||
| Fig. 2 Schematic of the rig apparatus for electrostatic experiments. | ||
Post experiment analysis
From the video recordings, Adobe Creative Cloud® suite was used to measure the separation distance between the base of the droplet and the top of the particle bed at which particles were extracted and transferred to the pendent water droplet. Stills were taken from the videos at the time at which particles were initially observed to transfer from the bed, the subsequent frame (20 ms after), and the frame at which particle transfer was observed to occur from the maximum radial distance within the bed. Both the bed-droplet separation distance and the bed radial distance (furthest distance from the needle in an assumed symmetrical area) from which the particles were transferred were measured. These measurements are assumed to be representative of a circularly symmetric particle extraction footprint within the bed, enabling calculation for the charge per particle using a simple electrostatic model previously detailed.24Results and discussion
Previous work compared bare polystyrene (PS) core particles to those coated with a relatively conductive polymer shell, where core particles and coated particles had similar density, in terms of ease of extraction and formation of liquid marbles using electrostatics.23 That work highlighted that increasing the conductivity made particle transfer easier (that is, particles transferred from a greater separation distance), whilst increasing interparticle cohesion retarded particle extraction and transfer. In the current study, coating of the core PS particles with gold and nickel shells was undertaken to better understand the influence of a larger magnitude metal conductivity on the electrostatic particle transport and liquid marble formation process. Prior studies have also examined the transport behaviour of bare PS and glass particles to determine the impact of low particle conductivity and varying density.23,24 Subsequent studies investigated the impact of adding increasingly conductive coatings to the bare core particles, such as (PPy) with different dopants (PPy-dedoped, PPy-Cl, PPy-C8F).23 The metallic-coated particles presented in this study are designed to have significantly greater conductivity than those previously examined. This work aims to elucidate the interplay between particle conductivity, particle cohesion and particle density and the impact of these properties on particle extraction and transfer, and possible formation of liquid marbles, in the presence of an electric field. The integrity of the shells was assessed using SEM (Fig. 3), as incomplete coverage of the metal shell will change overall particle conductivity and impact the interparticle cohesion.36,37 | ||
| Fig. 3 Scanning electron micrographs of a) gold coated PS particles (PS/Au), b) nickel coated PS particles (PS/Ni), c) PS/Ni particle highlighting the nickel shell on the PS core, and d) the central PS/Ni particle from c) at higher magnification showing the thickness of the nickel shell. | ||
The density of the PS core particles (1.07 g cm−3) was previously measured,25 and the densities for the shells of nickel and gold are taken as that of the pure metals, i.e. 8.9 g cm−3 for nickel and 19.3 g cm−3 for gold.38 Using the thickness of the metal shell measured for nickel from Fig. 3d) and layer thickness calculated from the amount of precursor salt added for gold, the density and mass of a single metal-coated particle were calculated and are presented in Table 1; calculations are included in ESI.† All other coating thickness have been reported previously.23 While it would be ideal to prepare metal-coated particles of the same density as the PS-PPy, it is not synthetically possible to prepare a uniform and complete metal film of the required thickness (between ∼500 nm for Ni and ∼250 nm Au). The relative cohesion of the metal-coated particles was characterised via angle of repose, as described previously,25 and are shown in Table 1 with values of conductivity for each of the materials. Bare core and PPy coated particle properties are taken from previously measured values, with the same method used to measure the metal coated samples.23 Angle of repose measurements for the PS/Ni and PS/Au were 30 ± 2° and 43 ± 3° respectively and are ranked as shown in Table 1. For ease of comparison with previously studied particles we have used a comparative ranking of 1 to 4 for relative cohesion, as noted in Table 1, where the lower number represents a smaller angle of repose and a more free-flowing material. Additionally, the contact angle of the particles at the air–water interface of a sessile droplet were 43 ± 5° for PS/Ni and 38 ± 5° for PS/Au particles, indicating these are relatively hydrophilic materials. Details of both measurements are given in the ESI.†
| Particle core/shell | Particle diameter (μm) | Shell layer thickness (μm) | Relative cohesiona | Density (g cm−3) | Mass of single particle (×10−6 g) | Shell conductivity (S cm−1) | Contact anglea (°) |
|---|---|---|---|---|---|---|---|
| a Data for core PS and glass particles, along with PPy-coated particles, taken from Thomas et al., J. Colloid Interface Sci., 2018 and J. Phys. Chem. C., 2020.23,24 b Data taken as pure metal conductivities.38 | |||||||
| PS | 84 ± 21 | — | 1 | 1.07 | 0.33 | <10−14 | 41 ± 3 |
| Glass | 75 ± 20 | — | 1 | 2.2 | 0.49 | ∼10−13 | <20 |
| PS/PPy-dedoped | 85 ± 20 | 0.52 | 2 | 1.2 | 0.39 | 2.8 × 10⁻¹⁰ | 32 ± 2 |
| PS/PPy-Cl | 85 ± 20 | 0.52 | 2 | 1.2 | 0.39 | 1.2 | 52 ± 2 |
| Glass/PPy-Cl | 76 ± 20 | 1.01 | 2 | 2.2 | 0.51 | 1.2 | 52 ± 2 |
| PS/PPy-C8F | 86 ± 34 | 1.17 | 3 | 1.2 | 0.40 | 16.3 | 40 ± 1 |
| PS/Ni | 87 ± 36 | 1.7 | 3 | 1.6 | 0.53 | 1.4 × 10⁵b | 38 ± 5 |
| PS/Au | 84 ± 21 | 0.05 | 4 | 1.1 | 0.34 | 4.4 × 10⁵b | 43 ± 5 |
The data presented in Fig. 4 highlight the relationship between the separation distance (distance between the top of the dry particle bed and the base of the pendent droplet, y-axis) at which particles were first observed to be extracted during approach, and the magnitude of the voltage applied to the particle bed (x-axis). Considering the PS core particles (red triangles) initially, it is observed that as the applied voltage is increased the particles are extracted from a greater bed-droplet separation. It has been demonstrated previously that particles are extracted from a greater distance at higher applied potentials due to the increased strength of the vertical component of the applied electric field, and this is even more the case if the properties of the material (mass, conductivity, cohesion) are such that they make particle extraction easier.23–26 For a particle to be extracted the electrostatic force experienced by that particle must exceed gravity and inter-particle cohesion forces which, combined, act to keep the particle within the bed.
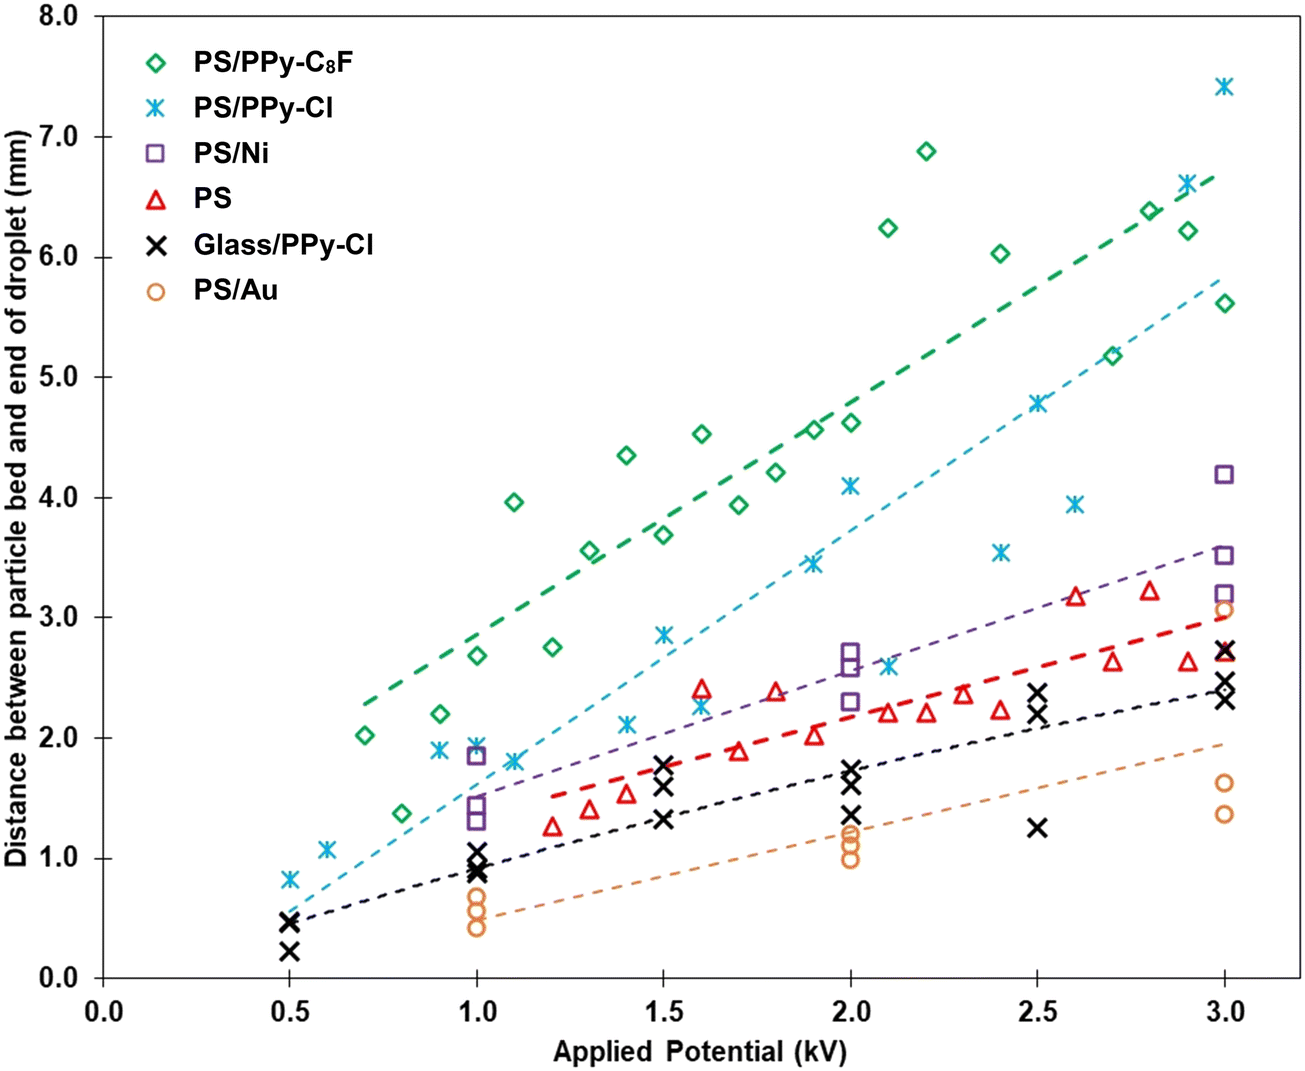 | ||
| Fig. 4 Separation distance between the base of the liquid droplet and the top of the particle bed, as a function of applied potential, when the initial transfer event is observed. A linear fit is added to each set of data points to guide the eye and are not a representative model of behaviour. Bare PS core, PS/PPy and glass/PPy data have been previously presented.23,24 | ||
When the PS particles are coated in a conductive PPy-Cl or PPy-C8F polymer shell (blue crosses and green diamonds respectively), the particles are observed to be extracted from increasingly greater separations than the bare PS particles, for the same applied voltage.23 It should be noted that the timescale of the experiment is such that all particles in the bed achieve charge saturation at a given electric field strength irrespective of material conductivity. As the bed of particles approaches the droplet, however, the electric field and the resulting gradient in potential changes. If a particle protrudes above the surface of the bed of particles, it moves to a region of lower potential than the particles in the remaining bed. Such a particle at lower potential will gain more charge via conduction from contact with the other particles in the bed, which also results in the surface potential being raised to that of the surrounding material.39,40 It is throughout this dynamic process, occurring whilst the bed is in motion toward the droplet, that the conductivity of the particle is critically important. Materials of greater conductivity acquire or lose charge at a much faster rate due to a gradient in potential as a result of the electric field. Consequently, a protruding particle of greater conductivity will increase charge more rapidly and experience a greater electrostatic attraction to the droplet. As the bed of particles continues to move closer to the droplet, the particles gain more charge and the process repeats. Thus, if all other particle properties are constant, the higher the conductivity of the particles, the easier they are to extract from a packed bed as they will more readily achieve the required threshold electrostatic force.
The previously developed model25 demonstrates that when the drop-bed separation distance is greater for the same applied voltage, the electrostatic force experienced by the particles in the same position in the bed is lower in magnitude. The impact of density on the electrostatic particle transfer process was observed by exchanging the PS core with a glass particle, as shown by the black crosses in Fig. 4.24 This change effectively doubled the density of the composite particle and significantly impacted their ability to be transferred from the particle bed to the droplet, as observed in Fig. 4.
Similar data measured for the PS/Au and PS/Ni particles are added to Fig. 4 for ease of comparison with the prior studies. Increasing the overall conductivity of the particles resulted in the increased particle bed-droplet separation from which they were extracted, when making comparisons between PS/Ni and bare PS at the same applied potentials. Nickel (purple squares) and gold (gold circles) coated PS particles clearly show a decreased distance required for initial extraction of particles compared to the most conductive PPy-coated sample (PS/PPy-C8F, green diamonds) at the same applied potential. A smaller distance between the droplet and the particles from which initial extraction can occur translates into a higher force required to initiate particle transport and means that such particles are more difficult to extract. Differences in particle extraction behaviour can be expressed in terms of particle property trends.
The addition of a nickel shell to the same core PS particles is seen to slightly increase the distance from which particles are extracted (i.e., making them easier to extract), compared to the bare PS cores. Whilst this follows the trend expected as demonstrated in the previous data obtained for the PS/PPy system, a greater impact was expected due to the significant increase in particle conductivity (Table 1) achieved by introducing a metal shell. Particles of higher conductivity should experience easier extraction from the bed (from a greater separation distance) as they are able to overcome the competitive interactions of cohesion and density/mass more easily. This is highlighted specifically when comparing the bare core particles to the metal coated particles (<10−14 S cm−1 for PS vs. 1.43 × 10⁵ S cm−1 for PS/Ni). The addition of the nickel shell, however, also increased the latter two material properties that inhibit extraction (cohesion and density/mass) and therefore the impact of the increased conductivity was diminished by the competitive interactions. At 2.0 kV applied potential, the difference observed between PS and PS/Ni samples is less than a 0.3 mm increase in distance between the base of the pendent droplet and the top of the particle bed. The inherent variability between repeats in the experimental data is such that this small difference in separation is considered negligible, and thus the behaviour of these two samples is essentially the same. Observing another large increase in material conductivity, between PS and PS/PPy-C8F, at 2.0 kV the difference in separation distance is more than 3.0 mm. Thus, significant increases in both cohesion and particle density (as highlighted in Table 1) are associated with very small bed-droplet separation distance differences for the PS/Ni sample.
A comparison can also be made between the glass/PPy-Cl and PS/Ni samples as the coated particle masses are similar (Table 1), yet their behaviour demonstrated in Fig. 4 is quite different. The differences noted between the PPy-Cl and Ni coatings include both conductivity and inter-particle cohesion. Whilst nickel is approximately five orders of magnitude more conductive than chloride doped PPy, there is not an equally significant difference in the separation distance for extraction over the entire range of applied potentials studied. Despite this large difference in conductivity, the relationship between conductivity and charge held by a particle is extremely non-linear, as is the relationship between the separation distance for transfer and the force experienced by the particles, thus the separation distances are on the same order of magnitude. There is also the impact of material cohesion on the extraction separation distance, as the PS/Ni particles are comparatively more cohesive than the PS/PPy-Cl sample. Examining the separation values at 2.0 kV, PS/Ni particles are transported at no more than 1.0 mm further away than glass/PPy-Cl, and thus it is hypothesised that there is a point where the effect of an increase in conductivity is less significant compared to the opposing effect of particle cohesion and/or weight in determining the bed-droplet separation distance for initial particle transfer. As discussed previously, for particles of the same density, increased conductivity encourages extraction, whilst inter-particle cohesion is a hindrance to the particle extraction process.23,24 When comparing the glass/PPy-Cl and PS/Ni samples, the varied cohesion is responsible for the changes in extraction behaviour. PS/Au particles are seen to be transferred at the closest separation distances of all the particles studied in Fig. 4. The interaction between all the properties of these particles, high conductivity, increased mass and high cohesion results in the highest force required for extraction, with only a 1 mm separation distance at 2 kV. The importance of cohesion in the extraction behaviour of the PS/Au particles aligns with the data in Table 1 that show these particles to be the most cohesive of those studied.
Fig. 5 illustrates the various stages of the transport and coating process throughout electrostatic liquid marble formation, at a 2.0 kV applied potential. Fig. 5a) and c) show the initial image when particles are first observed to be extracted from the particle bed for the PS/Au and PS/Ni particles respectively. In accord with the data in Fig. 4, the separation distance between the particles and the base of the droplet for the gold coated PS particles is less than that of nickel coated PS. Furthermore, the radial area of the particle bed, about the centre of the droplet, from which particles are extracted (i.e. extraction radius) appears to differ.24Fig. 5b) and d) show the final coating stages of PS/Au and PS/Ni respectively. More of the nickel particles transport to the droplet, thus stabilising the droplet more effectively, with Fig. 5e) showing the final PS/Ni stabilised droplet detached from the needle. The properties of the PS/Ni particles (Table 1) are such that sufficient particles are extracted and transported to the droplet to form a complete coating, and they are also sufficiently hydrophobic that the resultant marble is stable when in contact with a solid surface. The non-spherical shape of the detached liquid marble shown in Fig. 5e) results from a combination of droplet deformation during the experiment and particles jamming at the air–water interface of the droplet. This droplet deformation is due to the strong electric field, and resultant attraction between the droplet and particle bed.
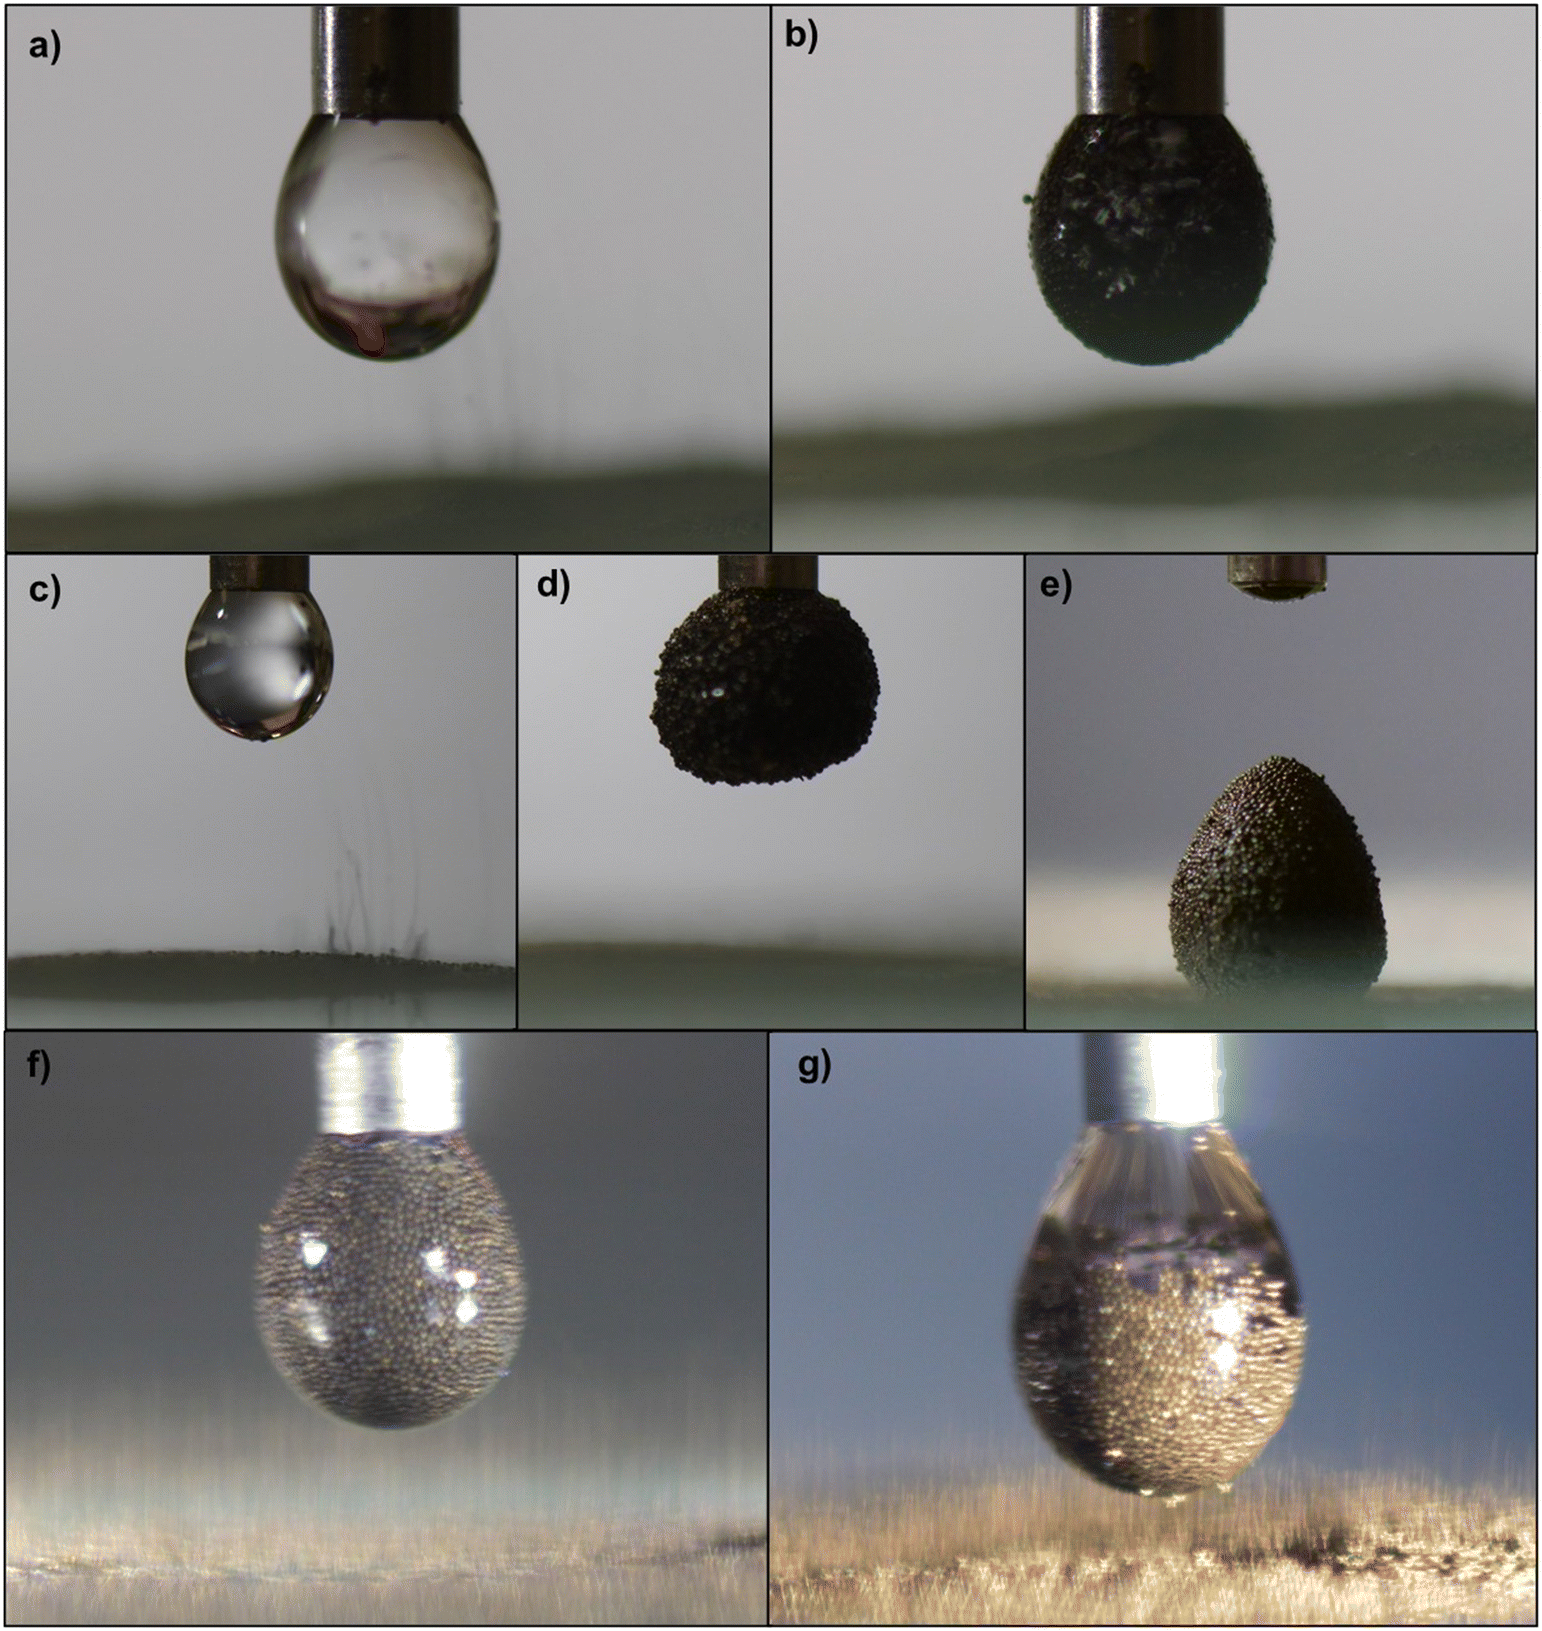 | ||
| Fig. 5 Images showing various stages of a water droplet being coated, at a 2.0 kV applied voltage, by gold [a), b) and g)] and nickel [c)–f)] coated polystyrene particles. The 1.2 mm width of the needle acts as scale bar in every image. Image a) is the initial PS/Au transfer and b) is the final coating step. Image c) is the initial PS/Ni transfer, d) the final coating step and e) the detached, stabilised resultant liquid marble of PS/Ni. Images f) and g) show the true colour of PS/Ni and PS/Au particles respectively, providing an indication of the depth at which the particles embed in the air–water interface. | ||
Fig. 5f) and g) show the true colours and droplet stabilisation throughout the transport process for the PS/Ni and PS/Au particles, respectively, and highlight the differences between the cohesion and hydrophobicity of these particles. The nickel coated particles exhibit a greater degree of hydrophobicity, as the PS/Ni stabilised droplet surface is somewhat rougher than the PS/Au stabilised droplet. The PS/Ni particles protrude from the interface into the air phase to minimise wetting with water and can stabilise the droplet, forming a liquid marble. The image of the droplet with the gold coated particles, conversely, shows the outer droplet interface is generally relatively smooth with the particles sitting more in the water, demonstrating the PS/Au particles are less hydrophobic compared to the PS/Ni, though some rougher zones are noted. These localised regions confirm the PS/Au are more cohesive (Table 1), as PS/Au is more likely to be transported as small aggregates, rather than single particles, since the significant attractive interparticle force make single particle extraction difficult. The differences in hydrophobicity can also be noted when comparing the photographic stills captured during the process, and the final particle coating image of each of the particles. Fig. 5g) shows the PS/Au particles during the coating process, and the resultant liquid marble is highlighted in Fig. 5b), whereby the smooth interface of the liquid is maintained, as the particles are less hydrophobic. Fig. 5f) shows the arrangement of the PS/Ni particles at the air–liquid interface during the transport process, and the resultant liquid marble in Fig. 5e) is very rough and non-spherical. This demonstrates the increased hydrophobicity of the material, as they sit proud of the interface. As the transported particles completely coat the droplet they begin to jam at the interface, introducing non-sphericity in the liquid marble as the water-air interface is not able to adopt its preferred spherical shape.
The particles in the bed are in direct physical contact with the electrically-biased plate and so develop a negative charge due to the influx of electrons. In a stationary bed, a greater magnitude of the applied potential will result in particles of greater negative charge, at the same constant drop-bed separation distance.40–42 As the negatively charged particles are extracted and attach at the air–liquid interface the charge is transferred to the liquid and moves through to the earthed needle. The total charge transferred through the system was measured as a function of time via the incorporation of an electrometer into the circuit; a selection of these data are presented in Fig. 6.23 Whilst the data presented in Fig. 6 are acquired simultaneously with those in Fig. 4, the electrometer data was measured during the entire particle transfer process and thus the various samples can be compared over the full experiment span. In Fig. 6 the x-axis describes duration of the particle transfer process with the “zero time” normalised to the same large separation distance between bed and droplet for each data set, while the y-axis shows the total charge transferred during an experiment. Recall the bed is moving toward the pendent droplet at a constant rate throughout the experiment, so increasing values on the x-axis also indicate decreasing droplet/bed separation distance and an increasing electric field strength. The charge developed at ∼0 time is due to the induction of image charge on the liquid droplet, which increases in magnitude as separation distance decreases. The time at which there is an initial spike in charge corresponds to the measurement of bed-droplet separation distance reported in Fig. 4, when the first significant extraction of particles from the bed occurs. Every subsequent increase in charge is correlated to more particles leaving the bed, transferring to the droplet, and contacting the air–water interface of the pendent droplet.
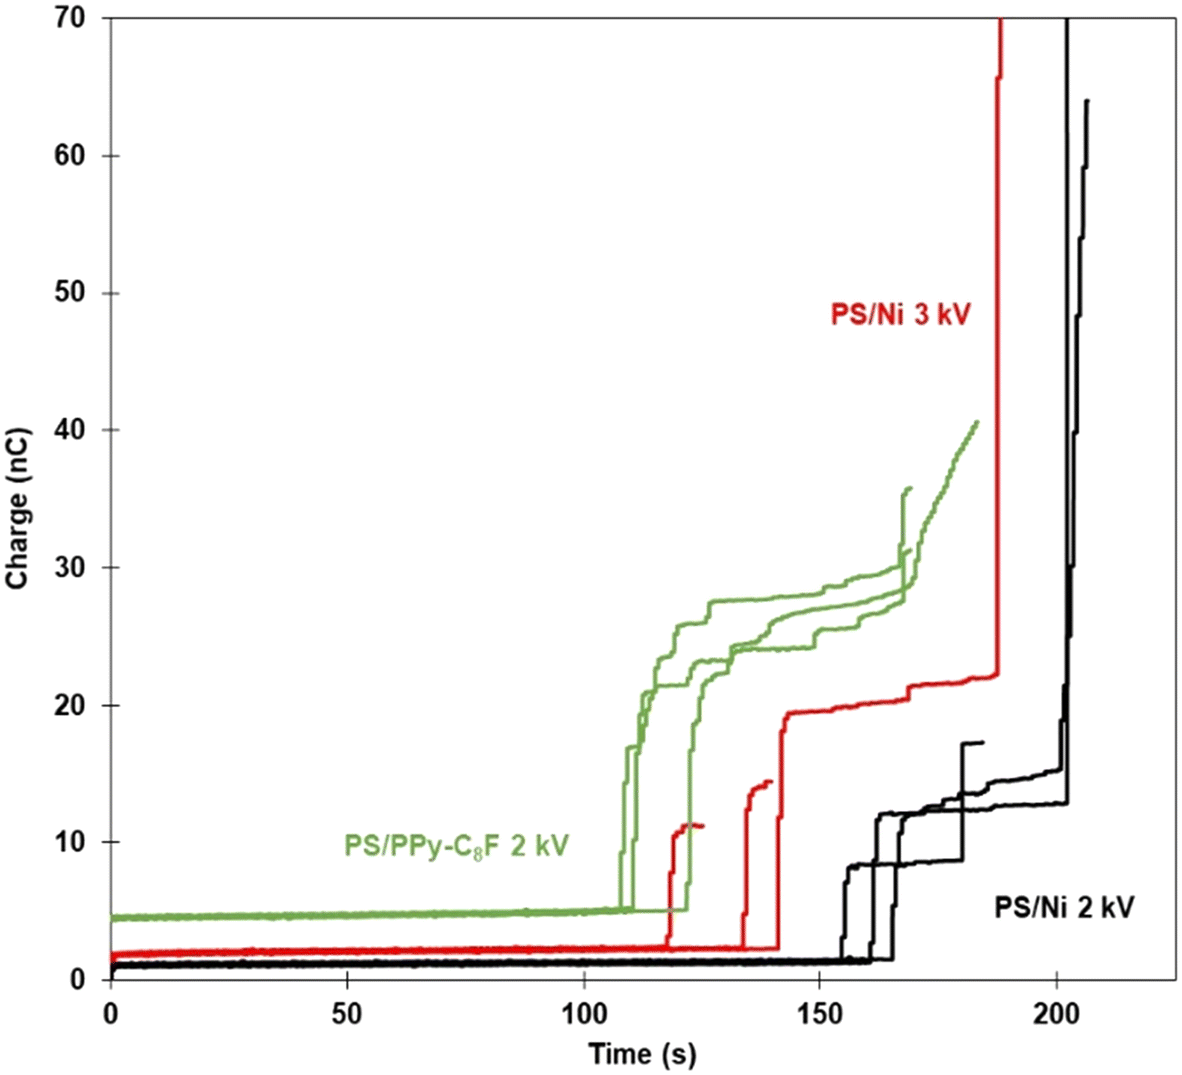 | ||
| Fig. 6 Electrometer traces showing total charge transferred as a function of time of PS/Ni samples at both 2.0 and 3.0 kV. Zero time represents the situation where the electrometer is taking measurements and the experiments have begun from a sufficient (but identical separation) distance, which ensures that there is no initial particle transport. Included for comparison are data for PS/PPy-C8F with an applied potential of 2.0 kV.25 | ||
The first vertical increase in charge encountered can be proportional to the number of particles transferred simultaneously, when comparing the same applied potential in Fig. 6, i.e., PS/PPy C8F and PS/Ni at 2 kV. Examining the two materials at 2 kV, there is a difference in the height and number of vertical rises in the electrometer traces. The lighter polymer coated (PPy-C8F) particles initially exhibit greater magnitude near-vertical increases in charge, compared to the nickel coated PS. This is attributed to the difference in particle mass between the two samples, with the PS/Ni being approximately twice as heavy as the solely polymeric PS/PPy-C8F sample (Table 1). Thus, the threshold extraction force required to extract a polymer particle from the bed is smaller, and at any force above this it is easier to transport a significant number of particles simultaneously. The threshold extraction force (force due to gravity) is also reached sooner for lighter particles, concordant with the greater distance at which these particles can be extracted.
More specifically, the comparison between the Ni and PPy-C8F coatings at 2 kV shows the polymer coated particles are observed to be transported to the droplet approximately 50 seconds earlier than the metal shell particles at the same applied potential. Furthermore, the PPy-C8F coated particles have approximately double the amount of charge transferred in the main particle transfer event. It must be reiterated here that the conductivity of all particles studied is sufficient for them to readily reach an equilibrium charge on the timescale of the experiment. Thus, it can be concluded that the changes in coating properties are responsible for the PPy-C8F coated PS particles leaving the bed earlier than PS/Ni. From Table 1, the differences between the two materials are increased mass and conductivity for the nickel shells. As discussed previously, for a heavier particle to be extracted from the particle bed, a greater force is required; increasing particle mass is a hindrance to the process. However, an increase in conductivity is hypothesised to have a more complex relationship with particle extraction and transport. Previously, a simplistic view was considered where particle mass was a dominant factor in particle transport and liquid marble formation using electrostatics.24 This sub-study highlights that, in addition to the mass-related issues, increasing the conductivity of the material is increasingly advantageous up to a certain point, beyond which there is no further positive impact. Furthermore, the cohesion is determined to be similar for both PS/PPy-C8F and PS/Ni particles (Table 1), and thus the difference in behaviour is attributed to the density and conductivity interplay.
Additionally, the increased cohesion (compared to PS) and decreased mass (compared to PS/Ni) for the PS/PPy-C8F can also be correlated to a significantly greater sudden rise in charge, as particles are more likely to be transported in aggregated clusters rather than individually. There are also several small increases in charge following the initial transport event, associated with increased interparticle cohesion, as summarised in Table 1. The increased tendency of particle clusters to be transported together, or in very close succession, could result in greater intervals between transfer events. Charge from particles within a cluster that are not directly contacting with the water interface will need to transfer via other particles prior to entering the water phase. The initial transport of particles to the interface (dynamic position) is a function of the interparticle cohesion, and a more cohesive material will result in aggregates being transferred, but upon arriving at the air–liquid interface, the wettability of the particles is dominant. Thus, the dynamics of particle rearrangement at the droplet interface is attributed to the hydrophobicity of the material, and not to the charge the particles carried. Upon particle contact with the droplet, the charge is transferred to earth, discharging these adsorbed particles.
The comparison of the PS/Ni data at 2 and 3 kV in Fig. 6 is not as simple as comparing particles at the same applied potential, since variance in total charge transferred could be due to both different total number of particles transferred and/or a different charge per particle at the air–liquid interface. It is not necessarily the case that a larger increase in charge transfer relates directly to more particles or aggregates being transferred at that instance but is more likely due to the fact that each of the particles held at the higher potential have a greater charge. This complication notwithstanding, it is interesting to observe the general behaviour in the 3 kV data when comparing to the two data sets recorded at the lower applied potential. As expected, the rapid increases in charge transferred for the 3 kV PS/Ni experiments occurred sooner than at 2 kV, i.e., the particles were extracted from a greater distance at the higher potential, see Fig. 4. Moreover, the electrometer data recorded at higher potential suggests it is more likely for a large number of particles to be extracted simultaneously, as there is typically only one vertical increase in charge in Fig. 6. In comparison, the PS/Ni 2 kV data shows multiple vertical increases in charge over the experiment lifetime. Thus, the higher the potential, along with greater cohesion, increases the likelihood that an avalanche event will occur,43 where large numbers of particles are extracted and transported to the air–liquid interface simultaneously, rather than via the more stepwise process observed for the lower applied potential.
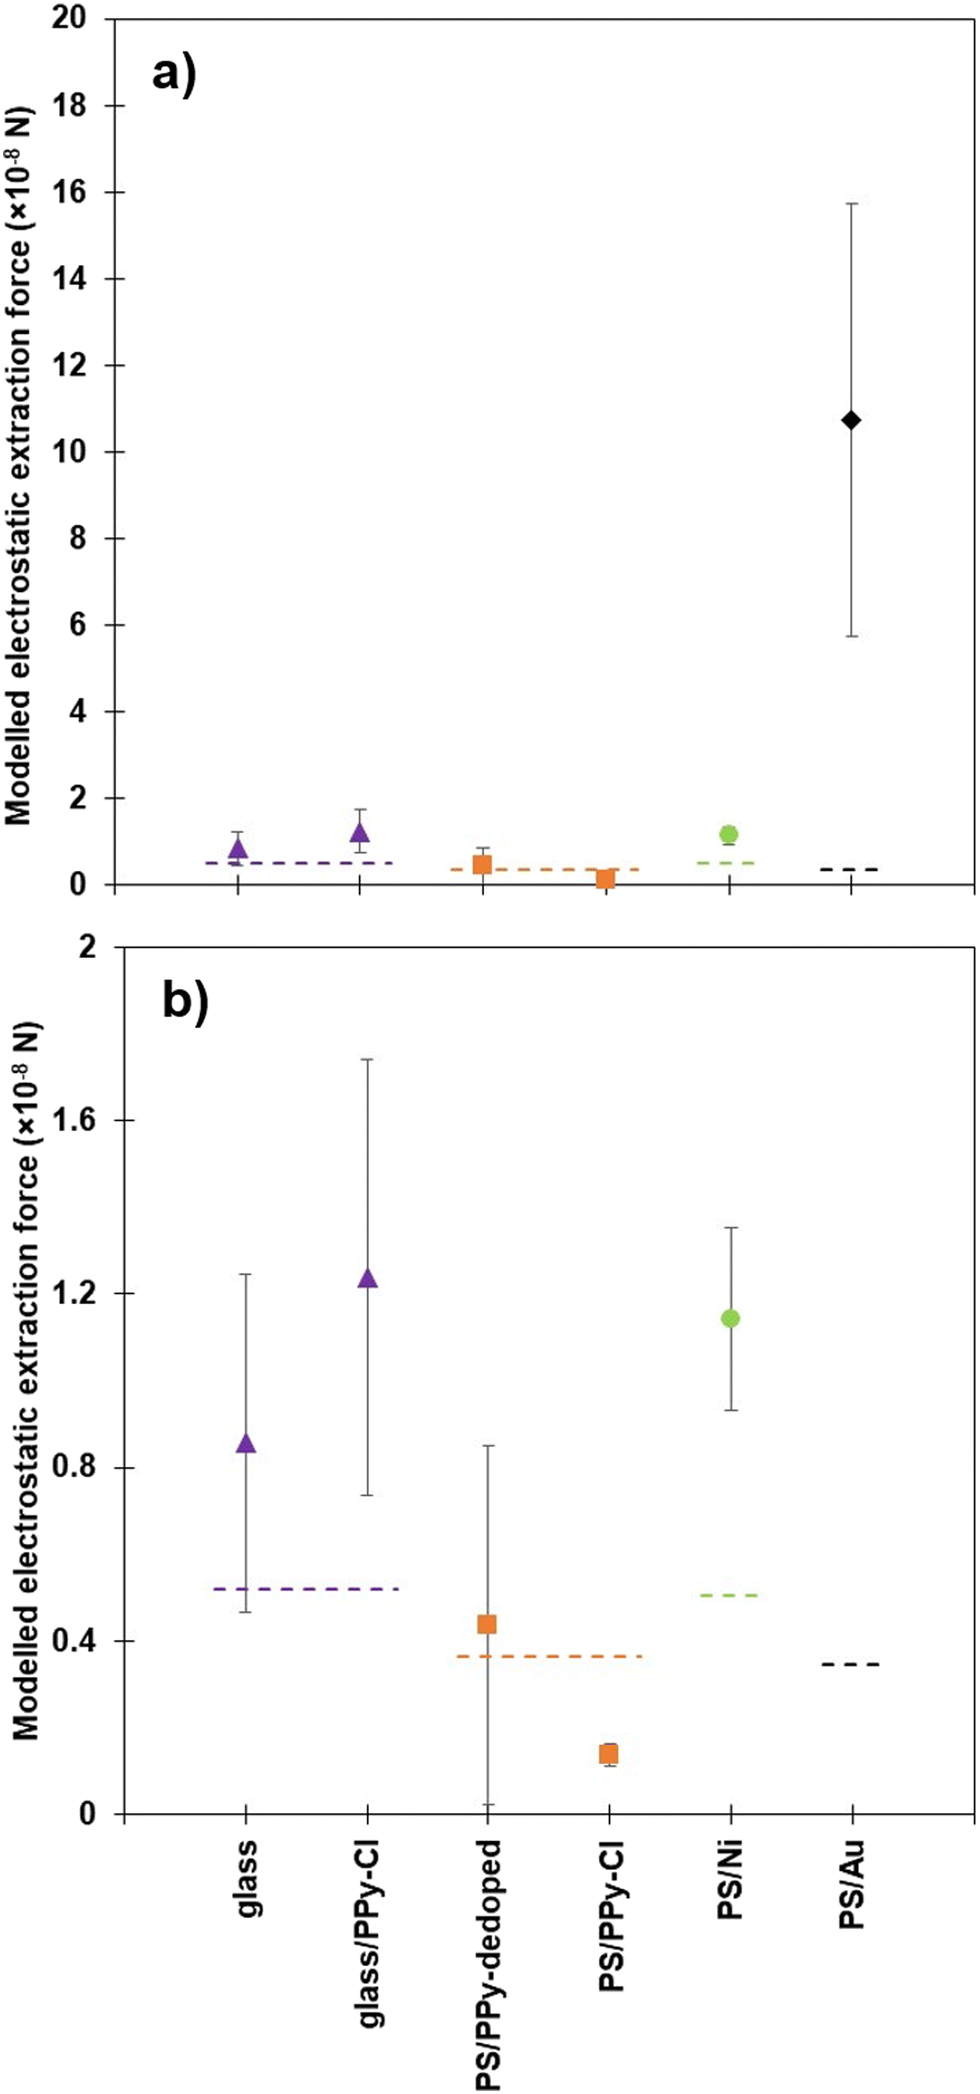
Much of the understanding of the ease of particle extraction has been previously based around the threshold electrostatic force, which is the minimum upward force a particle must experience to overcome gravity and particle–particle contact forces.24 Using a Morrison model to simulate a conducting sphere and plate to calculate the forces on particles,44,45Fig. 7 presents the threshold electrostatic force acting on the various particles, at the actual bed-droplet separation and radial distance within the bed from which particles were initially observed to be extracted. The radial distance from which particles were observed to be extracted was measured and assumed to represent a radially symmetric extraction region about the centre of the needle. The theoretical electrostatic forces are compared to the actual gravitational force acting on the particles, the latter indicated by dashed lines for each particle family.24
 | ||
| Fig. 7 a) Average modelled threshold extraction force for each particle sample, at 2.0 kV, where particles are first seen to be extracted from the bed. Dashed lines depict the calculated threshold force due to gravity for the glass cores (purple),24 PPy coated PS (orange),24 nickel coated PS (green) and gold coated PS (black). b) Showing a magnification of a) demonstrating the significant increase in force required for some samples. | ||
As discussed previously, data for PS core particles are deliberately omitted from Fig. 7 as the Morrison model is only valid for conductive materials.24,45 A more complex model would be required to account for the dielectrophoretic forces present within an insulating particle.46 As a general summary, the measured separation distances in Fig. 4 align with the model output above, as the larger the force displayed on the y-axis, the smaller the distance (closer) between the droplet and the particles required to initiate extraction. Additionally, the closer that the particle bed is to the base of the droplet, the more likely that the particles are extracted from directly beneath the centre of the droplet, as this is where the largest force is experienced, rather than radially out from the centre. The previous comparison between the coated PS samples and the equivalent glass core samples demonstrated that the PS particles required significantly less force to be extracted initially, and thus a hypothesis was developed, which concluded that the other material properties, such as conductivity and cohesion, also played a significant role in this process.24
Table 2 highlights, the various pure or coating material properties that enable the extraction and eventual transport of these specific particles from a particle bed, toward a droplet interface, in a relative manner. The tick indicates a property that is working cooperatively with the electric field, such that it is favourable to extraction. In other words, a tick means that if this property is increased, the corresponding data point in Fig. 7 moves back toward the dashed line representing the threshold force for extraction. The converse is also true, in that crosses in Table 2 are indicative of the material properties that would increase the force required for initial extraction from the particle bed and thus move these points further away from the calculated threshold value.
Table 2 also includes a comparison of copper particles, with respect to the properties which are advantageous or a hindrance to the extraction process. This work by Lobel et al. demonstrates an extreme situation as the pure copper particles studied had high conductivity and low mass as the particles were very small; less than 10 μm.26,47 Thus, particle extraction would be assumed to be readily achieved, as conductive materials promote extraction and there is only a small impeding influence from the particle mass. The small copper particles were shown, however, to be very difficult to extract, with similar behaviour to the PS/Au data presented in Fig. 4 above. This can be attributed to the high cohesion of the copper particle bed, with particles being in the range of 10 μm, resulting in large interparticle contact area per unit volume of the bed. Herein, lies contributing factors to the very high interparticle cohesion. Specifically, the large size distribution exhibits poor extractability due to the particles packing tightly within the bed, as the smaller particles can fit in the interstices between larger particles, and thus the inhibiting effect of cohesion is exacerbated.
Fig. 7b) replots the same data as Fig. 7a) on a smaller y-axis range, highlighting the difference between the nickel and gold coated PS particles and the comparative polymer coated PS particles. More specifically, the calculated force due to gravity for the nickel coated PS particles is similar to the glass core samples, as the density of the particles is comparable, yet there is a significant difference in force between the calculated, theoretical force due to gravity and the threshold force required for experimental extraction. The glass core particles are also approximately 10% smaller in diameter than samples with PS cores, therefore there is not a direct comparison between the density of the particles, but the comparison can be made on the mass of the particles as summarised in Table 1. The properties that can contribute to the difference in required force include particle-shell conductivity, material cohesion and particle size. Whilst directly measuring particle–particle cohesion is difficult,48 relative cohesion (i.e., the visual comparison of the powder behaviour) is described in this work (shown in ESI†), whereby the cohesion of the PPy coated glass samples is lower than that of the PS/Ni particles. Another variation between the two samples that merits discussion is the difference in conductivity. The most conductive of the glass series is glass/PPy-Cl, while the nickel shell is several orders of magnitude more conductive. Thus, there is still a large interplay between the conductivity of the coating material and the interparticle cohesion, with these properties acting against each other regarding particle extraction. The difference between the modelled threshold force and the force due to gravity is a result of the rest of the retarding forces, such as cohesion and friction.
Adding the gold shell to the polystyrene core particle only increases the mass slightly from the bare PS core, as the shell is very thin, and thus the calculated threshold force required for extraction is not much greater than for the PS core particles. The experimental values for PS/Au in Fig. 7 show that the actual force required to extract the gold coated particles is an order of magnitude higher than the threshold value. This is to counteract the significant increase in cohesion observed in this sample and highlighted in Table 2. Although the conductivity of this sample is high, and even higher than the PS/Ni particles, the cohesion is such that almost ten times the force is required to initiate individual particle extraction from the packed bed. Owing to significantly increased conductivity, and the resultant large forces required to induce extraction of gold coated PS, these particles were almost exclusively observed to be extracted from a central point beneath the liquid droplet. This is the area within the particle bed radius that has the greatest magnitude of the vertical electric field force component (initiating extraction upward toward the liquid), and the smallest radial force component. The radial component of the force compresses the bed inward at a tangent to its surface, and thus makes it more difficult for the particles to be extracted without a large vertical force component. Thus, the PS/Au particles are being extracted from almost directly beneath the drop (requiring very large vertical forces for extraction) during experiments conducted at 2.0 kV, in addition to very small separation distances, as demonstrated in Fig. 4. It is important to note that the force experienced by the PS/Au particles is significantly larger than that of the other particle samples as the relationship between separation distance and force is highly non-linear, i.e. the closer the droplet is to the particle bed, an exponentially greater force is placed on the particles. This is the case for the highly cohesive gold coated sample. The mass of the individual PS/Ni particles is among the lowest of the studied particles, Table 1, and the conductivity the greatest, both of which facilitate particle extraction. It is reasonable to hypothesise, therefore, that the higher extraction force required for the PS/Au particles is a result of interparticle cohesion; ranked highest in Table 1.
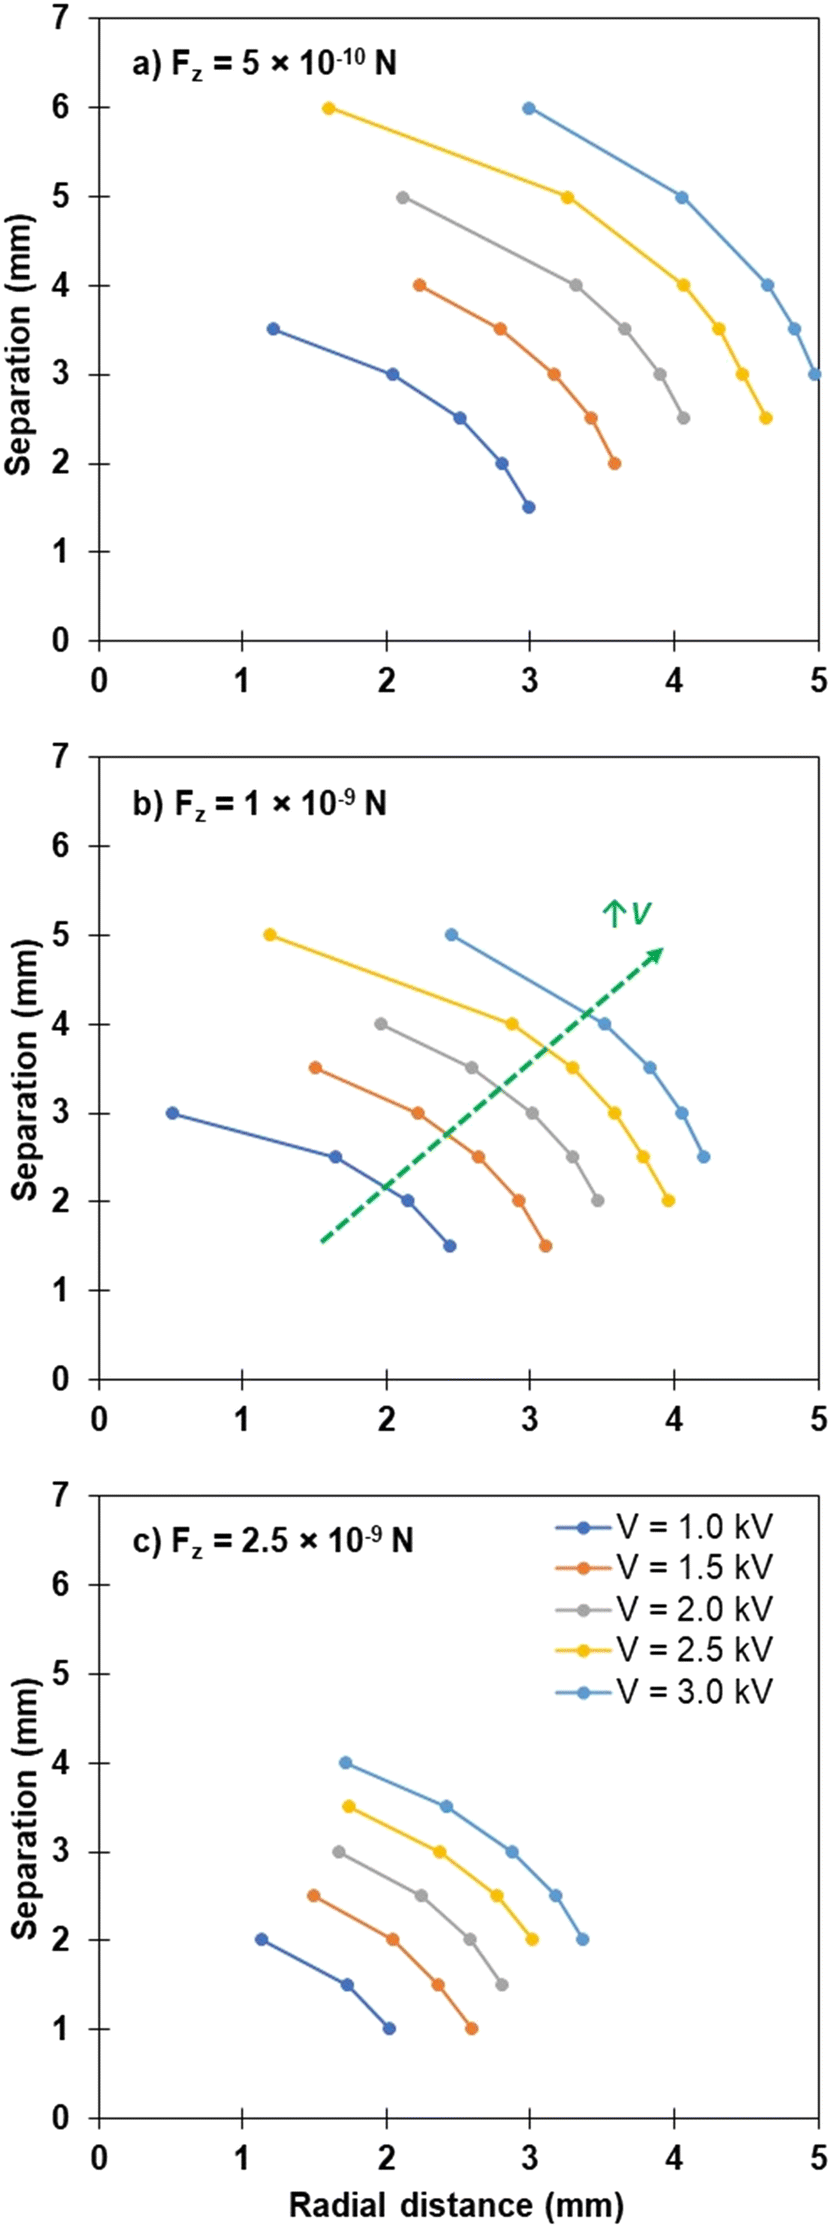
As mentioned, the assumed symmetric radial distance from the centre of the bed from which particles are extracted impacts on the vertical force that is experienced by particles, and thus on their eventual extraction and transport to the liquid droplet. Fig. 8 shows the combination of bed-droplet separation (y-axis) and radial distance in the bed (x-axis) that are able to achieve a particular threshold vertical component of the electrostatic force, Fz. Three threshold forces are investigated (Fz = 5 × 10⁻¹⁰ N, 1 × 10⁻⁹ N and 2.5 × 10⁻⁹ N) for applied voltages covering the experimental range (V = 1.0–3.0 kV). When interpreting the data in Fig. 8, consider that combinations of bed-drop separation and radial distance above and to the right of the presented curve will generate an electrostatic force less than Fz for that particular applied voltage. The converse is true for combinations to the left and below the curve. The data presented in Fig. 8 were modelled for particles of the same size, conductivity and density. When all other input variables to the Morrison model are kept constant, varying the threshold extraction force can be physically interpreted as a change in cohesion; lower cohesion requires lower threshold force for extraction. Thus, moving from Fig. 8a)–c) can be interpreted as modelling particles of increasing inter-particle cohesion. The values of Fz presented in Fig. 8 were chosen to encompass the values presented in Fig. 7 for ease of comparison.
 | ||
| Fig. 8 Simulated data using the Morrison model, highlighting the impact of particle cohesion on the separation distance and radius of extraction of particles with constant size, density and conductivity, over a range of applied potentials. a) Simulated least cohesive sample with a vertical force required for extraction of 5 × 10⁻¹⁰ N, b) a vertical force component of 1 × 10⁻⁹ N and c) the most cohesive modelled sample with a vertical force requirement of 2.5 × 10⁻⁹ N. | ||
Observing the single threshold force required to extract a particle, such as Fig. 8b), increasing the applied potential (changing coloured lines) for the same separation distance, the radial distance about the centre of the droplet from which particles can be extracted (the extraction radius) increases. For a separation distance of approximately 2 mm between the base of the droplet and the top of the particle bed, the radial distance from which particles are extracted for this threshold force value moves from 2 mm at 1 kV, through to approximately 4 mm from the centre of the droplet at 3 kV. This is schematically depicted in Fig. 9a) below. Thus, the increase in the field strength via the increased applied potential to the particles ensures that almost double the radius, ∼four times the area, of the particle bed is experiencing sufficient force for particles to be extracted and transported to the droplet. This is seen in Fig. 6, whereby the comparison of PS/Ni particles at 2 and 3 kV shows the difference in charge transferred as a result of applied potential. These particles will be charged similarly at the beginning of the experiment, and thus the difference highlighted in the charge transferred throughout the experiment is due to an increase of particles being extracted and transferred to the droplet. Fig. 9b) shows the same extraction radii for a larger separation distance of 3 mm, whereby the 1 kV example has less than one-third of the radial area from which particles can be extracted, compared to Fig. 9a). Overall, the total radial distance that is viable at the 3 kV applied potential is very similar for both conditions, with the increase in separation only slightly reducing the total area impacted.
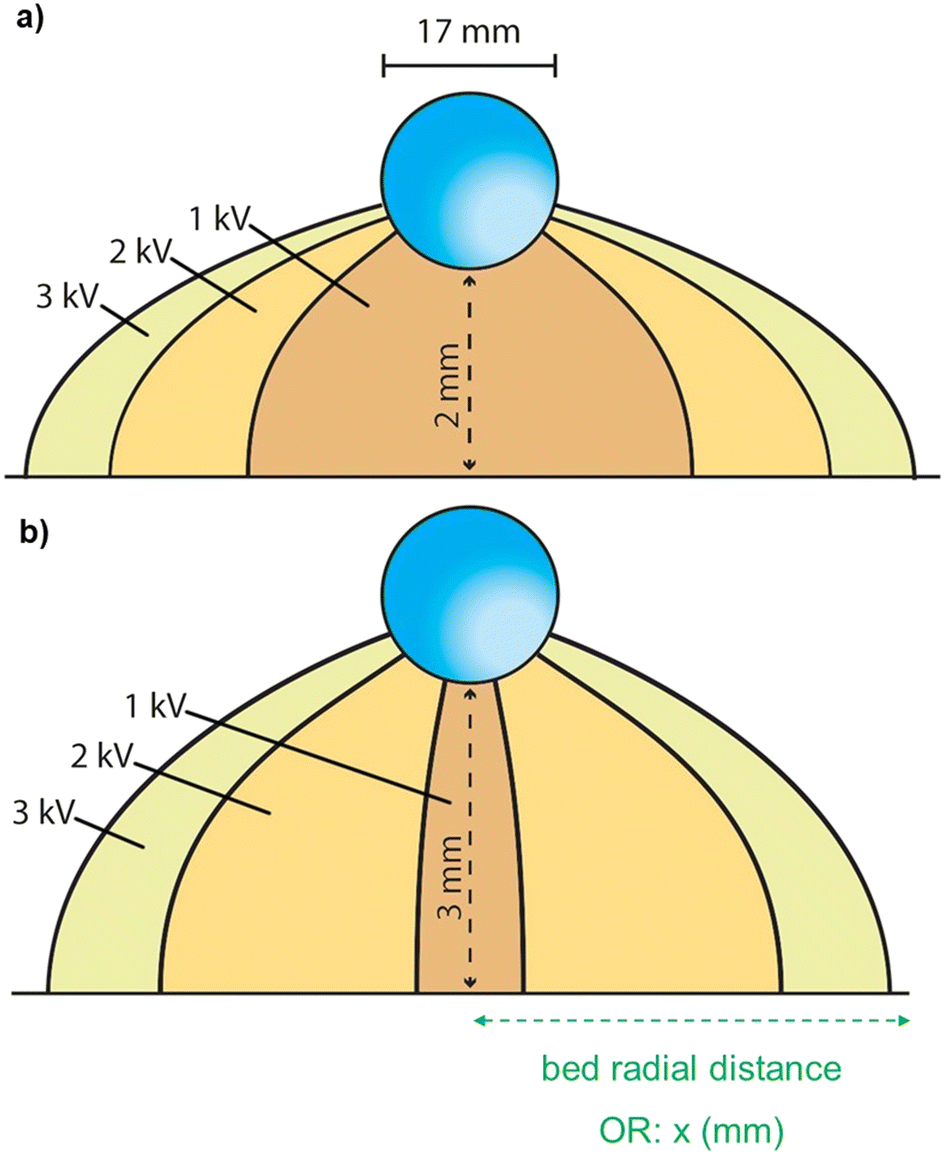 | ||
| Fig. 9 Schematic of the influence of applied potential on the area of possible particle extraction for a given threshold extraction force (1 × 10⁻⁹ N) with varying separation distance a) 2 mm and b) 3 mm. | ||
With an increase in the threshold force required to extract particles, a decrease in radial distance for the same separation distance is observed (Fig. 8). In general, the interplay between the applied potential, separation distance and threshold force requirement all contribute to the maximum radial distance from which the field is concentrated enough to initiate particle extraction. Fig. 10 depicts the experimental results of the modelled data and schematic in Fig. 8 and 9 above, for each of the particle samples discussed, which is a new analysis method for the samples presented in previous work.23,24
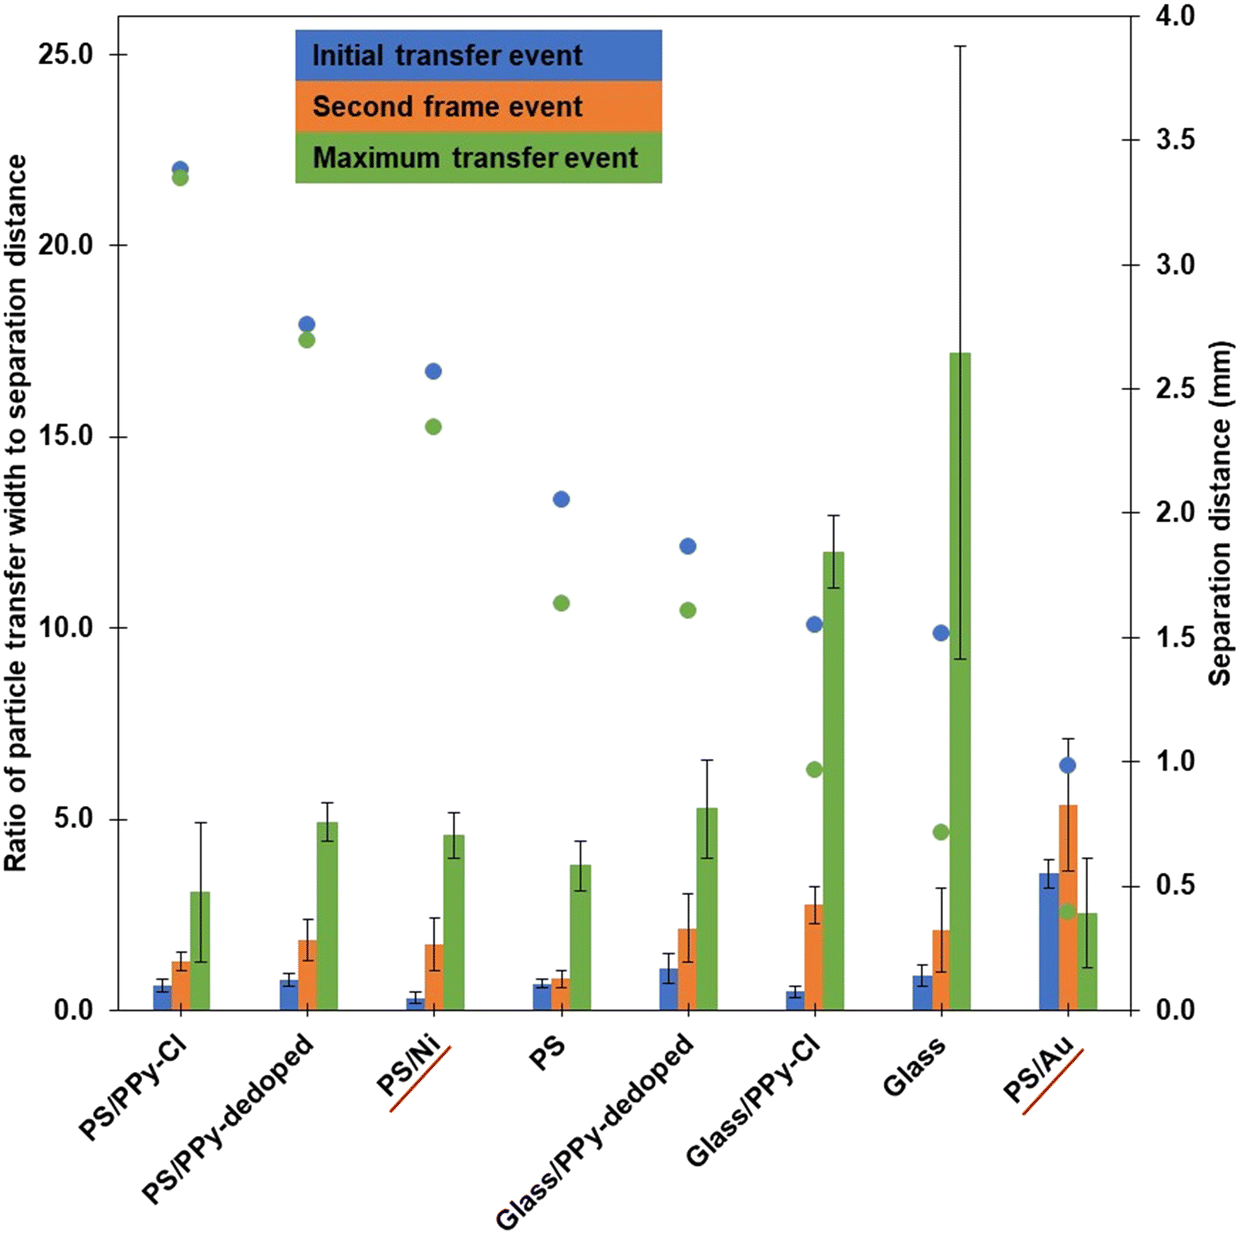 | ||
| Fig. 10 Comparison of particle samples with varying material properties for bed width to separation distance (height) ratios at certain time during the particle transfer events, at an applied potential of 2.0 kV. Primary y-axis represents values of radial distance to height ratio at the initial particle transfer event (blue, left bar), next frame in video (0.02 s, orange, middle bar) and the moment of maximum bed width of particle transfer (arbitrary time, green, right bar). Secondary y-axis shows the separation distance between the base of the droplet and the top of the particle bed at the point of initial transfer (blue data points) and maximum width of particle transfer (green dots). | ||
The order of the data presented on the x-axis in Fig. 10 is such that the initial separation distances when a particle is seen to be extracted from the bed (blue dots, secondary y-axis data) are in decreasing order, left-to-right. It is readily observed that the difference between the two separation distance measurements (initial – blue data points, final – green data points) increases as the initial observed separation distances decreases. More simply, as the distance between the base of the droplet and the top of the particle bed from which particles are first extracted gets smaller, the closer that the droplet needs to be to the particles to initiate further extraction. Further, as the particles are moving toward the droplet at a constant rate, the distance between the first and final events can be translated into a total time of particle transfer. Thus, the data in Fig. 10 shows that, as the initial separation distance becomes smaller, the time required for the completion of particle extraction and transport generally increases. Initially, with the low density, relatively conductive samples such as the PPy coated PS, there is very little difference in initial and final separation, and thus there is a corresponding negligible difference in the time taken for total particle extraction to occur. As the density and cohesion begin to dominate over the relative conductivity, such as observed for the bare and PPy coated glass samples, the particles must get much closer to the droplet to initiate transfer and the time required for particle extraction dramatically increases. Moreover, as depicted by the increasing magnitude of the green bars in Fig. 10, the width from which the particles can be extracted at the final separation (closer) distance has significantly increased.
The bare glass and glass/PPy-Cl particles seem to be the outliers in Fig. 10, as the ratio of width to separation distance for the maximum transfer event (green bars) are significantly larger than all other samples. The major difference between the bare glass and the glass/PPy-Cl samples is the conductivity of the particles, whilst there are also some competitive interactions introduced due to the addition of the PPy shell onto the glass particles, resulting in a higher cohesion. Compared to the PS core samples, the increased density of the glass core particles results in a larger force requirement for extraction (as shown in Fig. 7), thus the particles need to be closer to the droplet to initiate movement. The large radial extraction distance can be attributed to the very low cohesion of the sample, as the radial or compressive force experienced, specifically by the particles that are in the top layer of the bed (without as many particle-particle contacts), is much less than a sample with higher cohesion, such as glass/PPy-Cl. Whilst the area from which these two particle samples can be extracted is larger than the other materials studied, the time taken to complete the extraction/transfer process is longer. Specifically focussing on the data for the glass particles, the time required for the electric field to re-concentrate sufficiently to complete the transfer event is approximately 20 seconds, the longest process depicted in Fig. 10.
Additionally, the PS/Ni data follows the general trend mentioned previously, with the initial, second and maximum transfer events increasing in width to separation distance ratio. Specifically, PS/Ni behaves very similarly to the PS/PPy-dedoped sample, with only a small amount of extra time between the separation distance events. This observation readily displays the interplay between particle cohesion, conductivity and density of the materials. The cohesion of the samples are relatively similar, the difference lies within the density and the conductivity of the two shell materials. A small increase in density for the PS/Ni particles has slightly more impact than the large increase in conductivity a metal shell achieves over the PS/PPy-dedoped.
The one exception with the separation distance trend arises with the PS/Au data, whereby there is approximately a 0.6 mm difference in separation between the initial and final particle transfer events, less than that of the glass and glass/PPy-Cl samples. Here, the separation between the droplet and particles is only 1 mm in the first instance, and thus the particles are already experiencing a large vertical or lifting force. Whilst these gold coated PS particles have similar density to that of the polystyrene core samples (Table 1), the cohesion is significantly higher (Table 2) which is prohibitive to the initial extraction of particles. Thus, whilst the conductivity of the gold coated PS is high, this does not overcome the excessive cohesion and thus the width from which particles are extracted from beneath the droplet reverts to a very small area, such as that which is shown in Fig. 9b) for 1 kV applied potential. The green bar for PS/Au (ratio of particle transfer width to separation distance at maximum width of transfer) is also an outlier for this sample, such that it decreases compared to the second transfer event (orange bar) for the rest of the samples. Here, a ratio closer to one indicates a horizontal transfer area measurement is closer to equaling the vertical separation distance from which particles can be transferred across, to the droplet interface. In the case of PS/Au the maximum transfer width occurs at a separation distance between 1.0 and 0.4 mm (difference between blue and green data points on Fig. 10), and thus the radial area from which particles are seen to be extracted at the maximum event is around 1 mm. The decreasing value of the green bar for the PS/Au sample compared to the others can be attributed to the significant increase in particle cohesion, which restricts the initial distance from which particles can be transferred at the 2.0 kV condition. Therefore, during the transfer the particles are only coming closer to the droplet, as the particle bed is constantly approaching the liquid interface, and the maximum height from which particles can be extracted over the experiment is significantly reduced. This results in a decreasing width of particles that the applied electric field can effectively compensate for the overwhelming interparticle cohesion.
Conclusion
The influence and interplay of particle conductivity, cohesion and density on their electrostatically-driven extraction from a dry bed have been studied by synthesising a thin metal shell onto the same polystyrene core particles utilised in our previous work.23,25 Both a nickel and gold shell were examined and their influence on the initial particle extraction and thus transport to a suspended liquid droplet in regard to electrostatic liquid marble formation were elucidated.Previously it was noted that the extraction of particles in an electric field and transport toward a suspended liquid droplet was promoted by high conductivity, low cohesion and low density of the particulate material. Herein the introduction of metallic shells onto the same core polystyrene particles was undertaken to observe the differences when the conductivity of the material was significantly increased. The large increase in conductivity was achieved with the electroless deposition of nickel and gold shells onto the polystyrene core particles. The resultant impact on the extraction and transport behaviour for liquid marble formation was not simply a result of increasing the conductivity of the particle via the metal coating, as the coating also increased the cohesion and mass of the particles. Consequently, the nickel and gold coated particles behaved similarly (PS/Ni) or worse (PS/Au) when compared to the bare polystyrene particles. Furthermore, the addition of the metal shell resulted in differing particle hydrophobicity. The PS/Ni particles stabilised the water droplet and subsequent liquid marble when detached from the needle. Conversely, the PS/Au particles resulted in a smooth liquid droplet, indicating the particles were fully engulfed in the water droplet due to comparatively lower hydrophobicity. The PS/Au particle, therefore, had poor potential for final liquid marble stabilisation. Evidence of the transport small PS/Au aggregates instead of single particles further confirmed the highly cohesive nature of the gold coating. Comparison of the metallic coated particles was also made with glass-core particle samples, to observe the impact of controlling the particle mass and changing both the cohesion and conductivity of the sample. This highlighted that there is a point where the effect of increasing conductivity is less significant than the opposing effect of particle cohesion in changing the distance from which particles can be extracted from the bed initially.
Observing the charge transfer of the nickel coated particles at the same potential as the conductive polymer coated PS/PPy-C8F sample there is a difference in time, and thus separation distance, where the particles initially transport to the droplet. The nickel sample requires a closer separation for extraction events to occur and consequently a stronger electrostatic force for extraction, further evidence that the significantly increased conductivity does not overcome the competitive interactions of cohesion and mass. Increasing the applied potential increases the field intensity, and the force exerted on each particle is greater for the same separation distance. Modelling the threshold extraction force highlighted the impact of increased cohesion introduced by the gold shell particularly, as the threshold force required for extraction of these particles was significantly higher than the force required due to simply overcome gravity. Thus, overall, whilst the conductivity of a material promotes extraction and transport to a liquid droplet in the electrostatic formation of liquid marbles, both material density and cohesion impact the extraction of the particles, particularly the latter. It is clear, therefore, that the ability to form liquid marbles using electrostatic extraction method is dependent on a complex interplay of these fundamental particle properties.
Conflicts of interest
There are no conflicts to declare.Acknowledgements
This research was supported by the Australian Research Council (DP170100578), The Royal Society of Chemistry Researcher Mobility Grant (M19-7018) and EPSRC (EP/V027646/1). The authors also acknowledge the funding support from the Australian Research Council for the ARC Centre of Excellence for Enabling Eco-Efficient Beneficiation of Mineral, grant number CE200100009. C. A. T. and B. T. L. thank the Australian Government for a Research Training Program (RTP) Scholarship. Dr James Hitchcock is thanked for assistance with the metal coating techniques and Dr Yun Lin from the University of Newcastle EMX unit for assistance with SEM imaging.References
- P. Aussillous and D. Quéré, Nature, 2001, 411, 924–927 CrossRef CAS.
- P. Aussillous and D. Quéré, Proc. R. Soc. A, 2006, 462, 973–999 CrossRef CAS.
- G. McHale and M. I. Newton, Soft Matter, 2011, 7, 5473–5481 RSC.
- E. Bormashenko, Curr. Opin. Colloid Interface Sci., 2011, 16, 266–271 CrossRef CAS.
- E. Bormashenko, Soft Matter, 2012, 8, 11018–11021 RSC.
- R. K. Vadivelu, H. Kamble, A. Munaz and N.-T. Nguyen, Biomed. Microdevices, 2017, 19, 31 CrossRef PubMed.
- N.-K. Nguyen, C. H. Ooi, P. Singha, J. Jin, K. R. Sreejith, H.-P. Phan and N.-T. Nguyen, Processes, 2020, 8, 793 CrossRef CAS.
- Y. Tsumura, A.-L. Fameau, K. Matsui, T. Hirai, Y. Nakamura and S. Fujii, Langmuir, 2023, 39, 878–889 CrossRef CAS.
- S. Fujii, Langmuir, 2022, 38, 12757–12763 CrossRef CAS.
- F. Geyer, Y. Asaumi, D. Vollmer, H.-J. Butt, Y. Nakamura and S. Fujii, Adv. Funct. Mater., 2019, 29, 1808826 CrossRef.
- M. Paven, H. Mayama, T. Sekido, H.-J. Butt, Y. Nakamura and S. Fujii, Adv. Funct. Mater., 2016, 26, 3199–3206 CrossRef CAS.
- M. Anyfantakis, V. S. Jampani, R. Kizhakidathazhath, B. P. Binks and J. P. Lagerwall, Angew. Chem., 2020, 132, 19422–19429 CrossRef.
- K. Nakai, S. Fujii, Y. Nakamura and S.-I. Yusa, Chem. Lett., 2013, 42, 586–588 CrossRef.
- N. M. Oliveira, R. L. Reis and J. F. Mano, Adv. Healthcare Mater., 2017, 6, 1700192 CrossRef.
- C. Fullarton, T. C. Draper, N. Phillips, R. Mayne, B. P. J. de Lacy Costello and A. Adamatzky, Langmuir, 2018, 34, 2573–2580 CrossRef PubMed.
- S. Fujii, S. Sawada, S. Nakayama, M. Kappl, K. Ueno, K. Shitajima, H. J. Butt and Y. Nakamura, Mater. Horiz., 2016, 3, 47–52 RSC.
- R.-E. Avrămescu, M.-V. Ghica, C. Dinu-Pîrvu, D. I. Udeanu and L. Popa, Molecules, 2018, 23, 1120 CrossRef.
- G. McHale, D. L. Herbertson, S. J. Elliott, N. J. Shirtcliffe and M. I. Newton, Langmuir, 2007, 23, 918–924 CrossRef CAS PubMed.
- P. M. Ireland, M. Noda, E. D. Jarrett, S. Fujii, Y. Nakamura, E. J. Wanless and G. B. Webber, Powder Technol., 2016, 303, 55–58 CrossRef CAS.
- E. Jarrett, P. M. Ireland, G. B. Webber and E. J. Wanless, Powder Technol., 2016, 297, 1–7 CrossRef CAS.
- B. T. Lobel, C. A. Thomas, P. M. Ireland, E. J. Wanless and G. B. Webber, Adv. Powder Technol., 2021, 32, 1823–1832 CrossRef.
- P. M. Ireland, C. A. Thomas, B. T. Lobel, G. B. Webber, S. Fujii and E. J. Wanless, Front. Chem., 2018, 6, 280 CrossRef PubMed.
- C. A. Thomas, K. Kido, H. Kawashima, S. Fujii, P. M. Ireland, G. B. Webber and E. J. Wanless, J. Colloid Interface Sci., 2018, 529, 486–495 CrossRef CAS.
- C. A. Thomas, H. Munday, B. T. Lobel, Y. Asaumi, S. Fujii, P. M. Ireland, E. J. Wanless and G. B. Webber, J. Phys. Chem. C, 2020, 124, 26258–26267 CrossRef CAS.
- C. A. Thomas, M. Kasahara, Y. Asaumi, B. T. Lobel, S. Fujii, P. M. Ireland, G. B. Webber and E. J. Wanless, Soft Matter, 2019, 15, 7547–7556 RSC.
- B. T. Lobel, P. M. Ireland, L. M. Walsh, C. A. Thomas, G. B. Webber and E. J. Wanless, J. Phys. Chem. C, 2020, 124, 9947–9957 CrossRef CAS.
- J. P. Hitchcock, A. L. Tasker, E. A. Baxter, S. Biggs and O. J. Cayre, ACS Appl. Mater. Interfaces, 2015, 7, 14808–14815 CrossRef.
- J. P. Hitchcock, A. L. Tasker, K. Stark, A. Leeson, E. A. Baxter, S. Biggs and O. J. Cayre, Langmuir, 2018, 34, 1473–1480 CrossRef CAS.
- K. Stark, J. P. Hitchcock, A. Fiaz, A. L. White, E. A. Baxter, S. Biggs, J. R. McLaughlan, S. Freear and O. J. Cayre, ACS Appl. Mater. Interfaces, 2019, 11, 12272–12282 CrossRef CAS.
- A. L. Tasker, J. Hitchcock, E. A. Baxter, D. O. J. Cayre and S. Biggs, Chem. – Asian J., 2017, 12, 1641–1648 CrossRef CAS.
- J. R. Lovett, L. A. Fielding, S. P. Armes and R. Buxton, Adv. Funct. Mater., 2014, 24, 1290–1299 CrossRef CAS.
- S. F. Lascelles and S. P. Armes, J. Mater. Chem., 1997, 7, 1339–1347 RSC.
- S. Horiuchi and Y. Nakao, Surf. Coat. Technol., 2010, 204, 3811–3817 CrossRef CAS.
- T. C. Wang, M. F. Rubner and R. E. Cohen, Chem. Mater., 2003, 15, 299–304 CrossRef CAS.
- Tifoo, Tifoo Plating, https://www.tifoo-plating.com/media/pdf/f3/58/50/Instructions-Nickelstar-2-components-en.pdf, 2021 Search PubMed.
- B. T. Lobel, H. Robertson, G. B. Webber, P. M. Ireland and E. J. Wanless, J. Colloid Interface Sci., 2022, 611, 617–628 CrossRef CAS.
- B. T. Lobel, J. Fujiwara, S. Fujii, C. A. Thomas, P. M. Ireland, E. J. Wanless and G. B. Webber, Mater. Adv., 2020, 1, 3302–3313 RSC.
- G. H. Aylward and T. J. V. Findlay, SI Chemical Data, Wiley, 1974 Search PubMed.
- J. Cross, Electrostatics, Principles, Problems and Applications, Taylor & Francis, 1987 Search PubMed.
- G. M. Colver, J. Appl. Phys., 1976, 47, 4839–4849 CrossRef.
- L. Dascalescu, S. Vlad, A. Iuga and P. L. Levin, J. Phys. D: Appl. Phys., 2001, 34, 60–67 CrossRef.
- A. Y. H. Cho, J. Appl. Phys., 1964, 35, 2561–2564 CrossRef.
- K. R. Liyanaarachchi, P. M. Ireland, G. B. Webber and K. P. Galvin, Appl. Phys. Lett., 2013, 103(5), 054105 CrossRef.
- P. M. Ireland, C. A. Thomas, B. T. Lobel, G. B. Webber, S. Fujii and E. J. Wanless, J. Phys.: Conf. Ser., 2019, 1322, 012006 CrossRef.
- C. A. Morrison, The Potential and Electric Fields of a Conducting Sphere in the Presence of a Charged Conductiving Plane, Adelphi, MD, 1989 Search PubMed.
- B. T. Lobel, M. J. Hobson, P. M. Ireland, G. B. Webber, C. A. Thomas, H. Ogino, S. Fujii and E. J. Wanless, Langmuir, 2022, 38, 670–679 CrossRef CAS PubMed.
- S. Wu, Mater. Lett., 2007, 61, 1125–1129 CrossRef CAS.
- R. Jones, Granular Matter, 2003, 4, 191–204 CrossRef CAS.
Footnote |
| † Electronic supplementary information (ESI) available. See DOI: https://doi.org/10.1039/d3lf00182b |
| This journal is © The Royal Society of Chemistry 2024 |