 Open Access Article
Creative Commons Attribution 3.0 Unported Licence
Simulation studies of water adsorption on MIL-101(Cr) revealing the role of inhomogeneous potential field composed of open metal sites and organic linkers†
Shotaro
Hiraide
 *a,
Yu
Katayama
a,
Akira
Endo
b,
Ryotaro
Matsuda
c,
Minoru T.
Miyahara
a and
Satoshi
Watanabe
 *a
*a
aDepartment of Chemical Engineering, Kyoto University, Nishikyo, Kyoto 615-8510, Japan. E-mail: hiraide@cheme.kyoto-u.ac.jp; nabe@cheme.kyoto-u.ac.jp
bNational Institute of Advanced Industrial Science and Technology (AIST), 1-1-1 Higashi, Tsukuba Central 5-2, Tsukuba, Ibaraki 305-8565, Japan
cDepartment of Materials Chemistry, Graduate School of Engineering, Nagoya University, Furo-cho, Chikusa-ku, Nagoya, Aichi 464-8603, Japan
First published on 20th November 2023
Abstract
In response to the increasing demand for desiccant-type dehumidifiers, MIL-101(Cr), a metal–organic framework, has garnered attention as a promising adsorbent. This is primarily due to its high water capacity resulting from capillary condensation within its two cage-shaped mesopores, as well as its rapid water adsorption response. However, the exact origins of these characteristics are still not fully understood. In this study, we conducted two types of molecular simulations to investigate the water adsorption on MIL-101(Cr). Firstly, we developed an atomistic model of MIL-101(Cr) that specifically considers the interaction between open metal sites (OMSs) and water molecules. By performing grand canonical Monte Carlo simulations using this model, we discovered that capillary condensation occurs due to the formation of a liquid film that covers the hydrophobic pore surface, driven by the presence of OMSs. Subsequently, we constructed a simplified model that focuses solely on the potential field inhomogeneity of MIL-101(Cr) and conducted grand canonical molecular dynamics simulations to examine the progress of water adsorption. The simulation results indicated that the rapid water adsorption response of MIL-101(Cr) can be attributed to the inhomogeneity of the potential field consisting of hydrophilic OMSs distributed at appropriate intervals and hydrophobic organic linkers.
1 Introduction
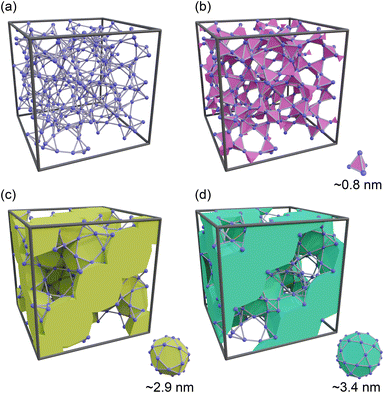
Controlling the humidity in buildings to a comfortable level is essential for enhancing the quality of life. Furthermore, dehumidification is crucial in environments that require high levels of sanitation, such as medical facilities, as harmful microorganisms and fungi thrive at high humidity.1 With the continued economic development of tropical regions and the exacerbation of climate change, the demand for dehumidification equipment is becoming increasingly significant. However, the widespread use of traditional dehumidifiers has resulted in excessive energy consumption owing to the operation of compressors and the utilization of ozone-depleting substances or their alternatives, such as hydrochlorofluorocarbon, which were phased out in the Montreal Protocol because of their strong greenhouse effect. As a result, there has been growing interest in the development of desiccant-type dehumidifiers, where water in the air is adsorbed by porous materials on a rotary filter.2–4 Although heat is required to desorb water and reactivate porous materials, the required temperature is approximately 70–80 °C5 and can be supplied by low-grade waste heat or solar energy.A major focus in the development of desiccant dehumidifiers is the search for porous materials that can efficiently adsorb and desorb water with low energy consumption. Over the past two decades, metal–organic frameworks (MOFs) have gained significant attention as potential alternatives to commonly used materials such as zeolites and silica gels.6–10 In particular, MIL-101(Cr),11 which consists of Cr3+ ions and terephthalic acid, has emerged as a leading candidate for next-generation dehumidifying agents.12 MIL-101(Cr) has a hierarchical porous structure comprising a tetrahedral micropore approximately 0.8 nm in size, as well as two mesopores of 2.9 and 3.4 nm (designated as small, middle, and large cages, respectively) (see Fig. 1). One of the most appealing features of MIL-101(Cr) is its stepwise water adsorption/desorption at a relative pressure (P/P0) of ∼0.5. This behavior is a result of capillary condensation/evaporation occurring within the middle and large cages, which leads to the highest adsorption capacity (∼1.4 g g−1) and easy water desorption compared to other existing adsorbents. Furthermore, Seo et al. demonstrated that MIL-101(Cr) exhibits higher thermal durability and a faster rate of water adsorption than silica gel and NaX zeolite.13 Yanagita et al. conducted a more detailed investigation of the water adsorption rate of MIL-101(Cr) and demonstrated that the amount of adsorbed water increased almost linearly with time without attenuation.14 They also concluded that water transport inside MIL-101(Cr) was faster than that in Zr-doped mesoporous silica.15,16
In spite of the promising results obtained for MIL-101(Cr),13,14,17–20 the mechanism of water adsorption in this material still remains unclear. Specifically, the carboxyl groups of terephthalic acid are used for coordination with the metal clusters, leaving only the aromatic rings exposed in the pore space, which makes the pore surface of MIL-101(Cr) essentially hydrophobic. Therefore, capillary condensation of water in MIL-101(Cr) is inherently unlikely because it requires the formation of a liquid film on the pore surface. The discrepancy between this expectation and observation can be attributed to the presence of coordinated unsaturated Cr ions, known as open metal sites (OMSs).21 However, to the best of our knowledge, no simulation studies have explicitly considered the interactions between OMS and water in MIL-101(Cr). In other words, although some simulation studies using a typical atomistic model (e.g., a combination of a generic force field such as UFF22 and DREIDING23 and the electrostatic potential charges calculated using density functional theory (DFT)) have been reported,24–28 the OMS–adsorbate interaction is known to be difficult to express using such a model; thereby a system-specific expression for the OMS–adsorbate interaction based on quantum calculations is required.29–36 Furthermore, research on the rapid water adsorption response of MIL-101(Cr) is lacking. Understanding the mechanism of water adsorption on MIL-101(Cr) and the origin of its rapid adsorption response is important for the development of more efficient materials for dehumidification.
In this study, we performed two types of molecular simulations to investigate the water adsorption on MIL-101(Cr). Initially, we developed an atomistic model of MIL-101(Cr), taking by considering the interactions between OMS and water. We conducted grand canonical Monte Carlo (GCMC) simulations to examine the influence of OMSs on the capillary condensation of MIL-101(Cr). Subsequently, we created a simplified model that focused solely on the non-uniformity of the potential field of MIL-101(Cr), comprising hydrophilic OMSs and hydrophobic organic linkers. We performed grand canonical molecular dynamics (GCMD) simulations to analyze the impact of the non-uniformity of the pore surface potential on the rate of water adsorption.
The remainder of this paper is organized as follows. In section 2.1.1, we introduce the reported atomistic structure of MIL-101(Cr) based on X-ray structural analysis,37 which has been used in existing simulation studies,24–28 has non-negligible atomic distortions, and perform structural optimization to obtain a more reliable atomistic structure. In section 2.1.2, we demonstrate that GCMC simulations without OMS interactions are unable to reproduce the experimental adsorption isotherm on MIL-101(Cr), which lead us to model the OMS interaction based on ab initio calculations for a cluster model of MIL-101(Cr) (section 2.1.3). In section 2.1.4, GCMC simulations with OMS interactions are conducted to reveal the mechanism of capillary condensation on MIL-101(Cr). Next, based on the results from the atomistic model, we construct a simplified model that extracts only the feature of inhomogeneity of the potential field from MIL-101(Cr) in section 2.2.1 and conduct GCMD simulations to examine the progress of water adsorption in section 2.2.2. Finally, the results are presented in section 3, and the details of the experimental and computational methods are provided in section 4.
2 Results and discussion
2.1 Simulation on atomistic model
![[thin space (1/6-em)]](https://www.rsc.org/images/entities/char_2009.gif) 000 atoms. Even in the primitive cell, which is the smallest unit cell, there are still ∼4000 atoms, making structural optimization using standard DFT calculations virtually impossible. Therefore, existing simulation studies have used reported structures without structural optimization.24–28 To overcome this difficulty, we employed the order-N DFT method, in which the computational cost is proportional to the system size, owing to the use of localized basis functions.38Fig. 2c and d show the coordinates of a terephthalic acid and a Cr cluster extracted from the optimized structure, respectively. The benzene ring of terephthalic acid has a planar structure, and the three Cr–O bond lengths are almost the same, with smaller distances than those in the reported structure.
000 atoms. Even in the primitive cell, which is the smallest unit cell, there are still ∼4000 atoms, making structural optimization using standard DFT calculations virtually impossible. Therefore, existing simulation studies have used reported structures without structural optimization.24–28 To overcome this difficulty, we employed the order-N DFT method, in which the computational cost is proportional to the system size, owing to the use of localized basis functions.38Fig. 2c and d show the coordinates of a terephthalic acid and a Cr cluster extracted from the optimized structure, respectively. The benzene ring of terephthalic acid has a planar structure, and the three Cr–O bond lengths are almost the same, with smaller distances than those in the reported structure.
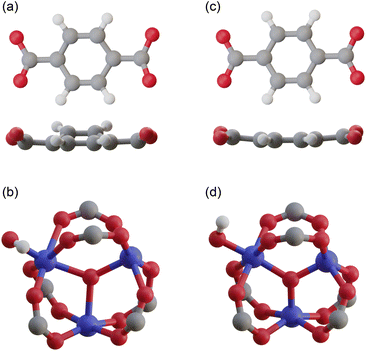 | ||
| Fig. 2 Atomic coordinates of (a) a terephthalic acid and (b) a Cr cluster extracted from the reported structure,37 and those of (c) a terephthalic acid and (d) a Cr cluster extracted from our optimized structure. | ||
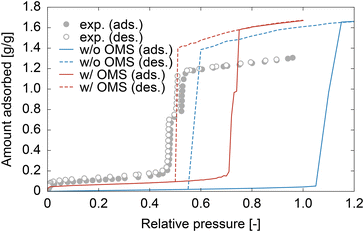
It is worth noting another difference between the experimental and simulation results is the saturated amount adsorbed. However, we believe that this difference can be attributed to experimental factors. The pore volume of MIL-101(Cr) was calculated to be 1.88 cm3 g−1 using iRASPA software,42 and assuming water molecules with the bulk water density (972 kg m−3 at 353 K) filled the pore, the ideal adsorbed amount was calculated to be 1.83 g g−1, which is closer to the simulation result. In addition, the experimental pore volume determined from the N2 adsorption isotherm (see Section S1, ESI†) was 1.51 cm3 g−1, which is smaller than the calculated value. The lower pore volume in the experiments could be due to impurities remaining in the pores of MIL-101(Cr), such as unreacted terephthalic acid. In fact, a previous report showed that an extensive purification process using hot water and NH4F aqueous solution increases the saturated amount of adsorption.43
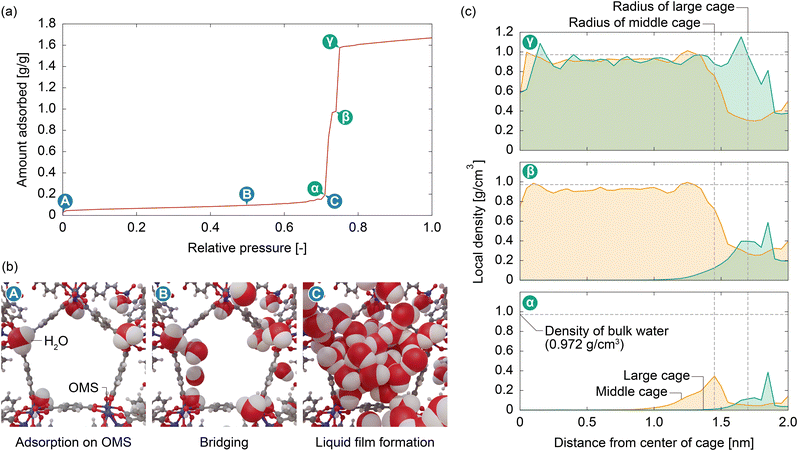
We then analyzed the adsorption mechanism based on the simulation results. Fig. 5 displays snapshots of the interior of MIL-101(Cr) and the local density distribution of water molecules within the middle and large cages at various points on the adsorption isotherm. At very low pressures (P/P0 = 0.01), water molecules were adsorbed onto the OMSs (Fig. 5b(A)). As the pressure increases, the adsorbed water molecules are bridged by other water molecules through hydrogen bonds (Fig. 5b(B)). When the pressure approaches a value just below the capillary condensation pressure (P/P0 = 0.25), the bridged water molecules form a liquid film that covers the hydrophobic pore surface of MIL-101(Cr) (Fig. 5b(C)). The formation of a liquid film on the pore surfaces of the middle and large cages was also confirmed by the local density distribution of the water molecules (Fig. 5c(α)). Similar to the experimental results (see Fig. 3), the calculated adsorption isotherm shows an abrupt increase in the amount adsorbed in two steps, and the local density distributions after the first and second steps (Fig. 5c(β) and (γ), respectively) indicate that these steps correspond to capillary condensation within the middle and large cages, respectively. From this atomistic insight, it is evident that the capillary condensation on MIL-101(Cr) is driven by OMSs, which function as strong hydrophilic sites. These serve as anchoring points for the water molecules to form a liquid film over the hydrophobic framework, enabling capillary condensation.
Finally, we note the discrepancy between our results and existing simulation results. Specifically, our simulation required consideration of OMS interactions to reproduce the experimental adsorption isotherm. In contrast, previous studies achieved successful simulations without considering specific OMS interactions.24–28 This can be attributed to the distorted atomic structure of MIL-101(Cr) used in the simulations. In fact, even in the absence of the OMS interaction modeled in section 2.1.3, GCMC simulations based on the original structure prior to geometrical optimization resulted in an adsorption isotherm similar to the experimental results, as shown in Fig. S3, ESI.† As shown in Fig. 2b and d, Cr atoms in the original structure were located farther away from the central O atom than those in the optimized structure. From the perspective of a water molecule, the Cr atom in the optimized structure is positioned further back than the four terephthalic acid O atoms bound to it. In contrast, the original structure exhibited exposed and accessible Cr atoms on its pore surface. This distorted structure, in which the Cr atoms protrude towards the surface, provides an overestimated Coulombic interaction between the Cr and O atoms of water (specifically, the L sites of TIP5PEw). As a result, it could function similarly to our OMS–water interactions. In other words, the negative element of the distorted structure had a positive effect on their studies. This finding highlights the sensitivity of atomistic simulation results to the structural model used.
2.2 Simulation on simplified model
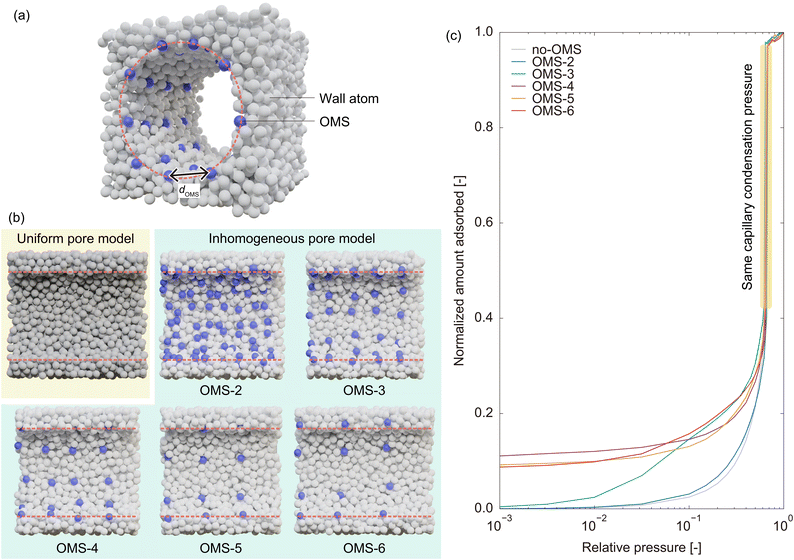
Section 2.1 reveals that OMSs are important for water adsorption on MIL-101(Cr). Specifically, GCMC simulations without OMS interactions indicated that MIL-101(Cr) was primarily hydrophobic. However, GCMC simulations with OMS interactions demonstrated that the OMSs acted as strong hydrophilic sites, where water molecules were adsorbed at low pressure. The OMSs were then connected by water molecules, resulting in the formation of a liquid film over the hydrophobic framework, enabling capillary condensation. Based on the mechanism of water adsorption on MIL-101(Cr), in which OMSs play a key role, it is also expected that the rapid water adsorption on MIL-101(Cr) can be attributed to OMSs. Specifically, we assumed that a heterogeneous potential field composed of OMSs and hydrophobic ligands was the source of the rapid response. This is because strong hydrophilic sites are expected to assist water molecules in forming a liquid film, functioning as anchors for the growth of the liquid film and the subsequent capillary condensation. In this section, we verify this hypothesis by constructing a simplified model system that captures only the characteristics of potential field inhomogeneity in MIL-101(Cr).![[small sigma, Greek, tilde]](https://www.rsc.org/images/entities/i_char_e10d.gif) (= 0.341 nm) and εff =
(= 0.341 nm) and εff = ![[small epsilon, Greek, tilde]](https://www.rsc.org/images/entities/i_char_e0de.gif) (= 119.8 K). The adsorbent adopts the form of a cylindrical structure created by the removal of atoms from the condensed phase of the LJ fluid. This pore model has the same potential parameters as the adsorbate atoms (i.e., σwall =
(= 119.8 K). The adsorbent adopts the form of a cylindrical structure created by the removal of atoms from the condensed phase of the LJ fluid. This pore model has the same potential parameters as the adsorbate atoms (i.e., σwall = ![[small sigma, Greek, tilde]](https://www.rsc.org/images/entities/i_char_e10d.gif) and εwall =
and εwall = ![[small epsilon, Greek, tilde]](https://www.rsc.org/images/entities/i_char_e0de.gif) ) and is referred to as the uniform pore model (Fig. 6b). To construct a pore model with an inhomogeneous potential field, we substituted some of the wall atoms with sites exhibiting strong interactions as OMSs; namely, the potential parameters for OMSs were set to σOMS =
) and is referred to as the uniform pore model (Fig. 6b). To construct a pore model with an inhomogeneous potential field, we substituted some of the wall atoms with sites exhibiting strong interactions as OMSs; namely, the potential parameters for OMSs were set to σOMS = ![[small sigma, Greek, tilde]](https://www.rsc.org/images/entities/i_char_e10d.gif) and εOMS = k
and εOMS = k![[small epsilon, Greek, tilde]](https://www.rsc.org/images/entities/i_char_e0de.gif) (k >1). The OMS atoms were selected from the inner wall surface to form a square array with average intervals of 2, 3, 4, 5, and 6
(k >1). The OMS atoms were selected from the inner wall surface to form a square array with average intervals of 2, 3, 4, 5, and 6![[small sigma, Greek, tilde]](https://www.rsc.org/images/entities/i_char_e10d.gif) , and these inhomogeneous pore models are referred to as OMS-2, OMS-3, OMS-4, OMS-5, and OMS-6, respectively (Fig. 6b). However, constructing an inhomogeneous pore model in this manner hinders a fair comparison of the adsorption rates between uniform and inhomogeneous pore models. This is because capillary condensation occurs at a lower pressure in the inhomogeneous pore model owing to the inherently stronger average potential field present in the pores. To address this disparity, the potential well depth of the wall atoms of the inhomogeneous pore model was reduced such that the interaction potential between the adsorbate and wall atoms was half that in the uniform pore model (εwall = 0.25
, and these inhomogeneous pore models are referred to as OMS-2, OMS-3, OMS-4, OMS-5, and OMS-6, respectively (Fig. 6b). However, constructing an inhomogeneous pore model in this manner hinders a fair comparison of the adsorption rates between uniform and inhomogeneous pore models. This is because capillary condensation occurs at a lower pressure in the inhomogeneous pore model owing to the inherently stronger average potential field present in the pores. To address this disparity, the potential well depth of the wall atoms of the inhomogeneous pore model was reduced such that the interaction potential between the adsorbate and wall atoms was half that in the uniform pore model (εwall = 0.25![[small epsilon, Greek, tilde]](https://www.rsc.org/images/entities/i_char_e0de.gif) , as the Lorentz–Berthelot mixing rules were used to calculate the cross parameters). We then used a trial-and-error approach to determine the potential well depth of OMSs (i.e., the coefficient k), such that the capillary condensation pressure obtained from the GCMC simulations matched that of the uniform pore model because the capillary condensation pressure reflects the average strength of the potential field in the pore.
, as the Lorentz–Berthelot mixing rules were used to calculate the cross parameters). We then used a trial-and-error approach to determine the potential well depth of OMSs (i.e., the coefficient k), such that the capillary condensation pressure obtained from the GCMC simulations matched that of the uniform pore model because the capillary condensation pressure reflects the average strength of the potential field in the pore.
Fig. 6c and Table 1 show the adsorption isotherms of the uniform and inhomogeneous pore models and the resulting potential parameters, respectively. As the intervals between OMSs increased, that is, as the density of OMSs decreased, the potential well depth of OMSs increased to maintain the same average potential field in the pores. Moreover, OMSs with higher potential well depths exhibit an increase in the amount of adsorption at low pressures while maintaining the capillary condensation pressure. This behavior, which involves an almost constant amount of adsorption from very low pressure to the capillary condensation pressure, is similar to the behavior observed for MIL-101(Cr), as shown in Fig. 3. This indicated that the simplified model successfully captured the features of MIL-101(Cr). It should be noted that the adsorption isotherm on OMS-2 does not differ significantly from that on the uniform pore model. This can be attributed to the fact that in OMS-2, OMSs with less significant potential depths are widely distributed, resulting in a nearly uniform potential field within the pore, which is not considerably different from that of the uniform pore model. Therefore, we excluded OMS-2 from the subsequent analysis.
| Model | d OMS | ε OMS | ε wall |
|---|---|---|---|
| The numbers in parentheses indicate the multiplier of the fluid–OMS or fluid–wall interaction potential relative to the fluid–fluid interaction potential after applying the Lorenz–Berthelot mixing rules. | |||
| Uniform pore | — | — |
![[small epsilon, Greek, tilde]](https://www.rsc.org/images/entities/i_char_e0de.gif) (1) (1) |
| OMS-2 | 2.02![[small sigma, Greek, tilde]](https://www.rsc.org/images/entities/i_char_e10d.gif) |
5.76![[small epsilon, Greek, tilde]](https://www.rsc.org/images/entities/i_char_e0de.gif) (2.4) (2.4) |
0.25![[small epsilon, Greek, tilde]](https://www.rsc.org/images/entities/i_char_e0de.gif) (0.5) (0.5) |
| OMS-3 | 3.03![[small sigma, Greek, tilde]](https://www.rsc.org/images/entities/i_char_e10d.gif) |
30.25![[small epsilon, Greek, tilde]](https://www.rsc.org/images/entities/i_char_e0de.gif) (5.5) (5.5) |
0.25![[small epsilon, Greek, tilde]](https://www.rsc.org/images/entities/i_char_e0de.gif) (0.5) (0.5) |
| OMS-4 | 4.05![[small sigma, Greek, tilde]](https://www.rsc.org/images/entities/i_char_e10d.gif) |
196![[small epsilon, Greek, tilde]](https://www.rsc.org/images/entities/i_char_e0de.gif) (14) (14) |
0.25![[small epsilon, Greek, tilde]](https://www.rsc.org/images/entities/i_char_e0de.gif) (0.5) (0.5) |
| OMS-5 | 5.20![[small sigma, Greek, tilde]](https://www.rsc.org/images/entities/i_char_e10d.gif) |
1089![[small epsilon, Greek, tilde]](https://www.rsc.org/images/entities/i_char_e0de.gif) (33) (33) |
0.25![[small epsilon, Greek, tilde]](https://www.rsc.org/images/entities/i_char_e0de.gif) (0.5) (0.5) |
| OMS-6 | 6.07![[small sigma, Greek, tilde]](https://www.rsc.org/images/entities/i_char_e10d.gif) |
2304![[small epsilon, Greek, tilde]](https://www.rsc.org/images/entities/i_char_e0de.gif) (48) (48) |
0.25![[small epsilon, Greek, tilde]](https://www.rsc.org/images/entities/i_char_e0de.gif) (0.5) (0.5) |
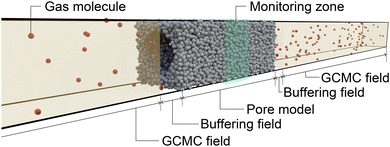
![[small sigma, Greek, tilde]](https://www.rsc.org/images/entities/i_char_e10d.gif) was placed at the center of the simulation box with GCMC regions to control the gas pressure and buffer regions located at both ends of the pore model, as shown in Fig. 7. While GCMD simulations are usually conducted to investigate molecular diffusion in a porous material by setting a high chemical potential to one GCMC field and a low chemical potential to the other,46 we set the same chemical potential to both GCMC fields to investigate the process of reaching adsorption equilibrium in the pore model. To eliminate the effect of the edge of the pore model, we counted the number of atoms within the region 10
was placed at the center of the simulation box with GCMC regions to control the gas pressure and buffer regions located at both ends of the pore model, as shown in Fig. 7. While GCMD simulations are usually conducted to investigate molecular diffusion in a porous material by setting a high chemical potential to one GCMC field and a low chemical potential to the other,46 we set the same chemical potential to both GCMC fields to investigate the process of reaching adsorption equilibrium in the pore model. To eliminate the effect of the edge of the pore model, we counted the number of atoms within the region 10![[small sigma, Greek, tilde]](https://www.rsc.org/images/entities/i_char_e10d.gif) from the center of the pore model to evaluate the time evolution of the amount adsorbed.
from the center of the pore model to evaluate the time evolution of the amount adsorbed.
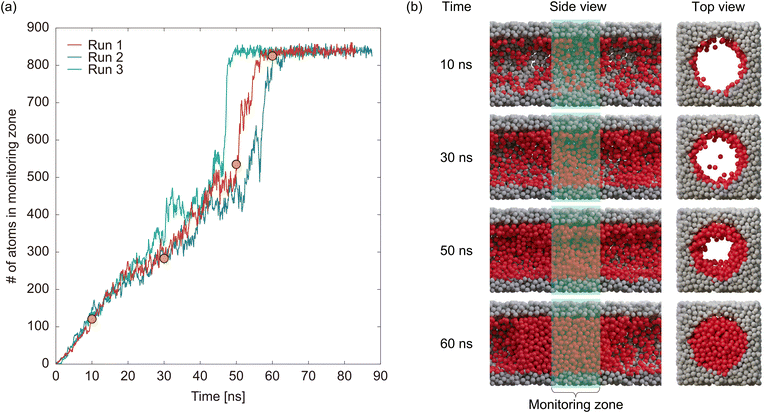
The red line in Fig. 8a shows the time evolution of the number of atoms in the monitoring zone for the uniform pore model. Snapshots of the model at 10, 30, 50, and 60 ns after the start of the simulation (points depicted as orange circles) are shown in Fig. 8b. Until 50 ns, the number of atoms in the monitoring zone increased almost linearly with time, corresponding to liquid film formation and growth, as depicted by the snapshots. The amount adsorbed then increases abruptly at 50–60 ns and becomes saturated with ∼840 atoms after 60 ns. The snapshots at 50 and 60 ns clearly showed that the abrupt increase in the adsorbed amount was caused by capillary condensation. The blue and green lines in Fig. 8a represent the results obtained under the same conditions as the red line, but with a different seed for the random number sequence, demonstrating that capillary condensation occurred at a different time for each simulation. This suggests that the capillary condensation is a complex and unpredictable process that cannot be accurately evaluated using a single simulation. One potential solution to handle this stochasticity is to conduct numerous simulations and analyze the results statistically. However, this approach is not feasible for GCMD simulations owing to its high computational cost. Therefore, a different approach was adopted to assess the timing of capillary condensation, as described below. As shown in Fig. 8a, although capillary condensation occurred randomly, the temporal evolution of the amount adsorbed before capillary condensation was nearly identical in the three simulations. This suggests that the formation and growth of the liquid film followed deterministic processes. Considering that capillary condensation is a stochastic event that occurs once the liquid film has fully formed, the timing of capillary condensation can be evaluated by examining the time required for the liquid film to grow. Consequently, we analyzed the temporal evolution of the amount adsorbed, specifically focusing on values below 500 atoms, which represent the completion of liquid film growth, to compare the uniform and inhomogeneous pore models.
Fig. 9a shows the comparison of the time development of the liquid film growth for the uniform pore model and OMS-4. We also conducted GCMD simulations for OMS-4 with three different seeds for the random number sequence and confirmed that the time progress of liquid film growth was almost the same for the three simulations (see Fig. S4, ESI†). While the growth of the liquid film in the uniform pore model exhibited almost linear behavior, the growth in OMS-4 followed a distinct curve with three stages, as shown in Fig. 9a. That is, the liquid film growth in OMS-4 initially progressed slowly (stage I), then accelerated (stage II), and finally reached a magnitude similar to that of the uniform pore model (stage III). These processes can be explained by examining snapshots of OMS-4 shown in Fig. 9b. In the snapshots taken at 5 and 10 ns, clustering of the adsorbate atoms around the OMSs was observed. However, if focusing only on the monitoring zone, clustering has not yet occurred at 5 ns. This indicated that the adsorbate atoms, under the influence of strong interactions with OMSs, became trapped and formed clusters around the OMSs. However, this process primarily occurred near the entrance of the pore, leading to a delay in cluster formation in the monitoring zone. Consequently, the adsorbed amount gradually increased during stage I. In the snapshot at 20 ns, a liquid film was observed on the pore surface, indicating that stage II involved the formation of a liquid film by bridging the clusters around the OMSs. Interestingly, the rate of increase in the amount adsorbed in stage II of OMS-4 was approximately twice that in the uniform pore model. This fact makes the completion of film formation in OMS-4 faster than that in the uniform pore model, even when considering the delay in stage I. This acceleration can be attributed to the anchoring effect of OMSs, as hypothesized. Finally, a comparison of the snapshots at 20 and 45 ns reveals an increase in the liquid film thickness, demonstrating that stage III corresponds to the liquid film growth process. Because OMSs do not influence the growth of the liquid film because their potential field does not reach the center of the pore, the rate of increase in the amount adsorbed in stage III is almost the same as that of the uniform pore model.
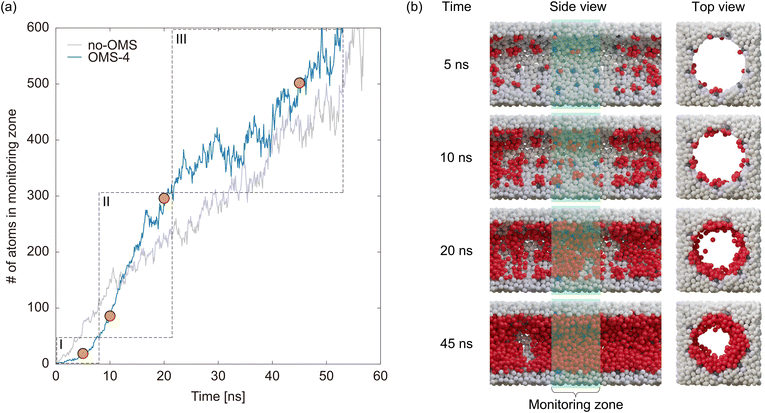 | ||
| Fig. 9 (a) Time evolution of the number of atoms in the monitoring zone and (b) snapshots at 5, 10, 20, and 45 ns after the start of the simulation for OMS-4. | ||
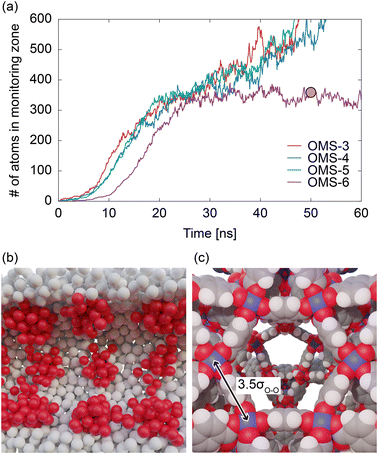
Fig. 10a compares the results for OMS-3, OMS-4, OMS-5, and OMS-6. Whereas the temporal developments of the liquid film growth for OMS-3 and OMS-5 are similar to those of OMS-4, showing a curve consisting of three stages, noticeable differences are observed in OMS-6. Specifically, the increase in the number of atoms was slower than that of the other models, and the number of particles remained steady at ∼350. Fig. 10b shows the snapshot of OMS-6 at 50 ns, revealing the presence of large clusters around the OMSs that are independent of each other. In OMS-6, OMSs with significant potential depths were sparsely distributed. These stronger OMSs exerted a higher trapping force on the adsorbate atoms, resulting in a further delay in diffusion towards the center of the pore. In addition, because of the larger intervals between OMSs in OMS-6 compared to the other models, the clusters around the OMSs cannot be bridged, thereby preventing the formation of a continuous liquid film. These results indicate that an inhomogeneous potential field is just a sufficient condition for rapid capillary condensation. In other words, it is crucial for strongly interacting sites to be distributed at appropriate intervals, preferably within 3–5 times the size of the adsorbate molecule, as determined from the simulation results. Here, the OMS distance of MIL-101(Cr) is measured to be 1.08 nm as shown in Fig. 10c, which is 3.5 times larger than the size of a water molecule based on the LJ parameter of TIP5PEw. This measurement satisfied the conditions for rapid capillary condensation, indicating that the presence of an inhomogeneous potential field created by the OMSs and hydrophobic ligands contributed to the fast adsorption response observed in MIL-101(Cr).
3 Conclusions
In this study, we investigated the adsorption mechanism of water on MIL-101(Cr) using GCMC simulations with an atomistic model consisting of an optimized structure based on order-N DFT calculations and a refined force field that considers OMS interactions. The simulation results revealed that the OMSs acted as strong hydrophilic sites, where water molecules were adsorbed at low pressures. The OMSs then connect to each other via water molecules through hydrogen bonds, resulting in the formation of a liquid film over the hydrophobic framework and enabling two-stage capillary condensation within the middle and large cages. This atomistic insight into the adsorption mechanism provided a new perspective on the rapid adsorption response for water of MIL-101(Cr). Specifically, we hypothesized that a heterogeneous potential field composed of OMSs and hydrophobic ligands was the source of this rapid response. To verify this hypothesis, we constructed a simplified model system that captured only the characteristics of the potential field inhomogeneity in MIL-101(Cr). GCMD simulations using the simplified model revealed that the diffusion of adsorbate atoms inside the pores was first delayed owing to the clustering formed around the OMSs. However, the anchoring effect of the OMSs accelerates the formation of a liquid film if the OMSs are distributed at appropriate intervals, resulting in faster capillary condensation than in a pore with a uniform potential field. The appropriate interval between OMSs was found to be 3–5 times the size of the adsorbate, which was satisfied by the OMS distance of MIL-101(Cr). Therefore, we conclude that the presence of an inhomogeneous potential field created by the OMSs and hydrophobic ligands is one of the factors contributing to the fast adsorption response observed for MIL-101(Cr). The findings of this study indicate that using a longer organic linker as the building block of MOFs is not necessarily an effective strategy for improving the water adsorption performance of MOFs because the interval between OMSs is expected to increase, which should be a useful guideline for the design of MOFs for dehumidifiers.4 Experimental and computational methods
4.1 Materials
MIL-101(Cr) was synthesized according to the method reported by Akiyama et al.18 Terephthalic acid (1.32 g, 8.00 mmol), Cr(NO3)3·9H2O (3.20 g, 8.00 mmol), 1 mol L−1 aqueous solution of HCl (4 g, 3.95 mmol), and additional water (38 g) were combined in a Teflon-lined stainless-steel autoclave. The resulting mixture was heated at 493 K for 8 h and cooled to room temperature (approximately 298 K). To remove any residual terephthalic acid, the precipitate was filtered through a glass filter (100–200 μm). The filtrate suspension was centrifuged, and the resulting solids were washed multiple times with methanol and water. Finally, the solid microcrystalline MIL-101(Cr) was vacuum-dried. The material characterization, incorporating X-ray powder diffraction, scanning electron microscopy, thermogravimetric analysis, and N2 adsorption isotherm measurements, is detailed in Section S1, ESI.†4.2 Water adsorption isotherm measurement
Water adsorption on MIL-101(Cr) was measured at 353 K using a BELSORP-maxHT instrument (MicrotracBEL Corp.). Before the adsorption measurements, MIL-101(Cr) was heated to 373 K for 6 h under a vacuum.4.3 Atomistic structure and geometry optimization
The atomic coordinates of MIL-101(Cr) were obtained from a report by Férey's group.37 After some modifications, including adding hydrogen atoms, converting to the primitive cell, and placing a OH− group per metal cluster consisting of three Cr ions, structural relaxation was conducted by order-N DFT calculations with the Open MX software38 to remove atomic distortion stemming from errors in the X-ray structural analysis. In the order-N DFT calculations, the PBE pseudopotential, Cr6.0s3p2d1, O6.0-s2p2d1, H6.0-s2p1, and C6.0-s2p2d1 basis sets, and DFT-D3(BJ) dispersion correction were used. A cutoff energy was set to 600 Ry. The convergence condition for energy calculations was set to less than 10−4 hartree, and the structural optimization was continued until the maximum force on the atoms was less than 0.005 hartree bohr−1.4.4 GCMC simulation
The adsorption isotherms of water on MIL-101(Cr) were obtained using laboratory-made GCMC code.47–50 The framework atoms were fixed during the simulations, and four trials for water (displacement, rotation, creation, and deletion) were performed with the same probabilities. Typically, the system is equilibrated with 1 × 10⁷ steps, after which the data are sampled for the other 1 × 10⁷ steps. However, for the conditions around capillary condensation/evaporation, the system was equilibrated with 5 × 10⁸ steps and the data were sampled for another 1 × 10⁸ step.The guest–guest and guest–host interaction potentials U were assumed to be the sum of the Coulombic and LJ potentials:
| U = UCoulombic + ULJ | (1) |
 | (2) |
 | (3) |
4.5 Ab initio calculations for OMS–water interaction
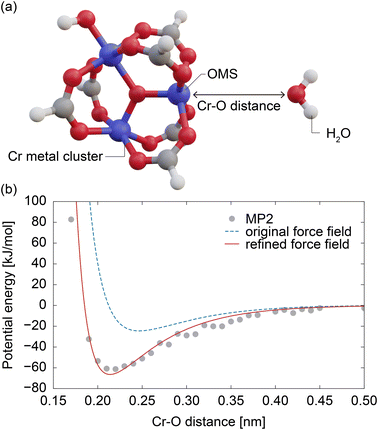
Quantum chemical calculations were performed by constructing a metal cluster structure containing OMSs and placing a water molecule in close proximity, as shown in Fig. 4a. Initially, the metal cluster was extracted from the atomic coordinates of MIL-101(Cr),37 and to achieve an electroneutrality condition, the connecting portion of terephthalic acid was capped with a hydrogen atom, as illustrated in Fig. 4a. The structure of this metal cluster was optimized using Gaussian 09 (ref. 52) under DFT (PBE, 6-31g(d,p)) level. A water molecule was then placed at a certain distance from an OMS of the optimized metal cluster in such a way that all water atoms (O, H1, and H2) and the OMS were on the same plane and the distance between the atom i and the OMS, Di, satisfies the condition DO < DH1 = DH2 (see Fig. 4a). Using this model, the MP2 method (6-31g(d,p)) in Gaussian16 (ref. 53) was employed to calculate the OMS–water interaction, and the basis set superposition error was corrected using the counterpoise method.54 This calculation was performed for OMS–water intermolecular distances (DO) ranging from 0.15 to 0.5 nm in increments of 0.01 nm. In each point of the calculations, the atomic positions of the metal cluster and water molecule were fixed. Due to the high computational cost, the OMS–water interaction potential was modeled based on data for the water molecule in a fixed orientation. The accuracy of this model is discussed in Section S2, ESI.†4.6 Construction of simplified model
In the simplified model prepared for GCMD simulations, the adsorbate was represented by LJ Argon fluid with potential parameters of σff =![[small sigma, Greek, tilde]](https://www.rsc.org/images/entities/i_char_e10d.gif) = 0.341 nm and εff =
= 0.341 nm and εff = ![[small epsilon, Greek, tilde]](https://www.rsc.org/images/entities/i_char_e0de.gif) = 119.8 K, and the pore model was constructed based on the condensed phase of Ar. To construct the pore model, we first prepared a 5.66 nm × 5.66 nm × 5.37 nm of condensed phase of Ar with a molar density of 1.49 kg cm−3. Subsequently, we removed a cylindrical pore with a diameter of 3.95 nm from the condensed phase along the z-axis. In this system, all the wall atoms have the same potential parameters as Ar (εwall =
= 119.8 K, and the pore model was constructed based on the condensed phase of Ar. To construct the pore model, we first prepared a 5.66 nm × 5.66 nm × 5.37 nm of condensed phase of Ar with a molar density of 1.49 kg cm−3. Subsequently, we removed a cylindrical pore with a diameter of 3.95 nm from the condensed phase along the z-axis. In this system, all the wall atoms have the same potential parameters as Ar (εwall = ![[small epsilon, Greek, tilde]](https://www.rsc.org/images/entities/i_char_e0de.gif) and σwall =
and σwall = ![[small sigma, Greek, tilde]](https://www.rsc.org/images/entities/i_char_e10d.gif) ), which is referred to as a uniform pore model. Subsequently, we constructed inhomogeneous pore models by introducing strongly adsorbing sites (i.e., OMSs) with potentials different from those of other wall atoms. Following a similar procedure to the uniform pore model, we created condensed phases with a cylindrical pore and selected atoms on the inner wall surface in a square shape at average intervals of 2, 3, 4, 5, and 6
), which is referred to as a uniform pore model. Subsequently, we constructed inhomogeneous pore models by introducing strongly adsorbing sites (i.e., OMSs) with potentials different from those of other wall atoms. Following a similar procedure to the uniform pore model, we created condensed phases with a cylindrical pore and selected atoms on the inner wall surface in a square shape at average intervals of 2, 3, 4, 5, and 6![[small sigma, Greek, tilde]](https://www.rsc.org/images/entities/i_char_e10d.gif) , where a strong potential (εOMS = k
, where a strong potential (εOMS = k![[small epsilon, Greek, tilde]](https://www.rsc.org/images/entities/i_char_e0de.gif) and σOMS =
and σOMS = ![[small sigma, Greek, tilde]](https://www.rsc.org/images/entities/i_char_e10d.gif) ) (k > 1) was assigned, while the other wall atoms were assigned a weak potential (εwall = 0.25
) (k > 1) was assigned, while the other wall atoms were assigned a weak potential (εwall = 0.25![[small epsilon, Greek, tilde]](https://www.rsc.org/images/entities/i_char_e0de.gif) and σwall =
and σwall = ![[small sigma, Greek, tilde]](https://www.rsc.org/images/entities/i_char_e10d.gif) ). The z-directional lengths of the inhomogeneous pore models were almost the same as those of the uniform pore model; however, each was adjusted such that the OMSs were regularly aligned under periodic boundary conditions. To align the average potential fields of the inhomogeneous pore models, we conducted GCMC simulations to determine the values of k where the computed condensation pressure for Ar matched that of the uniform pore model. These GCMC simulations were performed at 87.3 K with periodic boundary conditions in all directions. The cross-interaction parameters were evaluated using the Lorentz–Berthelot mixing rules.
). The z-directional lengths of the inhomogeneous pore models were almost the same as those of the uniform pore model; however, each was adjusted such that the OMSs were regularly aligned under periodic boundary conditions. To align the average potential fields of the inhomogeneous pore models, we conducted GCMC simulations to determine the values of k where the computed condensation pressure for Ar matched that of the uniform pore model. These GCMC simulations were performed at 87.3 K with periodic boundary conditions in all directions. The cross-interaction parameters were evaluated using the Lorentz–Berthelot mixing rules.
4.7 GCMD simulation
We conducted GCMD simulations for the uniform and inhomogeneous pore models using the Lammps55 software. A 1 × 1 × 3 supercell of the pore model constructed in section 4.6 was placed at the center of the simulation box, where a 50 nm GCMC field (gas phase region) and a 1.9 nm of buffer region were placed at both ends of the pore model (see Fig. 7). In the simulations, GCMC simulations were initially conducted to insert Ar atoms into the gas-phase region. Subsequently, NVT-MD simulations were performed for the entire cell, where the wall atoms were fixed. This series of simulations was repeated. The time step for NVT-MD was set to 1 fs. The GCMC simulation included 1600 transfer trials and 2400 insertion–deletion trials every 1000 MD steps. The temperature was set to 87.3 K, and the chemical potential at the GCMC fields was set to a value corresponding to a relative pressure of 0.9, which is sufficiently higher than the condensation pressure, as shown in Fig. 6c. Periodic boundary conditions were applied in all directions during the simulations.Author contributions
Shotaro Hiraide: conceptualization, methodology, software, writing – original draft, visualization, supervision Yu Katayama: software, formal analysis, investigation, writing – original draft, visualization Akira Endo: investigation, writing – review & editing Ryotaro Matsuda: resources, writing – review & editing Minoru T. Miyahara: conceptualization, supervision Satoshi Watanabe: conceptualization, writing – review & editing, supervision.Conflicts of interest
The authors declare no conflict of interest.Acknowledgements
This study was financially supported by JST CREST grant no. JPMJCR17I3, Japan.References
- T. Sookchaiya, V. Monyakul and S. Thepa, Energy Build., 2010, 42, 1692–1702 CrossRef.
- M. Sultan, I. I. El-Sharkawy, T. Miyazaki, B. B. Saha and S. Koyama, Renewable Sustainable Energy Rev., 2015, 46, 16–29 CrossRef.
- K. Daou, R. Wang and Z. Xia, Renewable Sustainable Energy Rev., 2006, 10, 55–77 CrossRef CAS.
- D. Jani, M. Mishra and P. Sahoo, Renewable Sustainable Energy Rev., 2016, 60, 1451–1469 CrossRef CAS.
- N. Enteria, H. Yoshino, A. Satake, A. Mochida, R. Takaki, R. Yoshie and S. Baba, Appl. Energy, 2010, 87, 478–486 CrossRef.
- N. C. Burtch, H. Jasuja and K. S. Walton, Chem. Rev., 2014, 114, 10575–10612 CrossRef CAS PubMed.
- H. Furukawa, F. Gándara, Y.-B. Zhang, J. Jiang, W. L. Queen, M. R. Hudson and O. M. Yaghi, J. Am. Chem. Soc., 2014, 136, 4369–4381 CrossRef CAS PubMed.
- C. Wang, X. Liu, N. Keser Demir, J. P. Chen and K. Li, Chem. Soc. Rev., 2016, 45, 5107–5134 RSC.
- M. J. Kalmutzki, C. S. Diercks and O. M. Yaghi, Adv. Mater., 2018, 30, 1704304 CrossRef.
- X. Liu, X. Wang and F. Kapteijn, Chem. Rev., 2020, 120, 8303–8377 CrossRef CAS.
- G. Férey, C. Mellot-Draznieks, C. Serre, F. Millange, J. Dutour, S. Surblé and I. Margiolaki, Science, 2005, 309, 2040–2042 CrossRef.
- X. Zheng, T. Ge and R. Wang, Energy, 2014, 74, 280–294 CrossRef.
- Y.-K. Seo, J. W. Yoon, J. S. Lee, Y. K. Hwang, C.-H. Jun, J.-S. Chang, S. Wuttke, P. Bazin, A. Vimont, M. Daturi, S. Bourrelly, P. L. Llewellyn, P. Horcajada, C. Serre and G. Férey, Adv. Mater., 2012, 24, 806–810 CrossRef CAS.
- K. Yanagita, J. Hwang, J. A. Shamim, W.-L. Hsu, R. Matsuda, A. Endo, J.-J. Delaunay and H. Daiguji, J. Phys. Chem. C, 2019, 123, 387–398 CrossRef CAS.
- A. Endo, T. Yamaura, K. Yamashita, F. Matsuoka, E. Hihara and H. Daiguji, J. Colloid Interface Sci., 2012, 367, 409–414 CrossRef CAS PubMed.
- H. Yanagihara, K. Yamashita, A. Endo and H. Daiguji, J. Phys. Chem. C, 2013, 117, 21795–21802 CrossRef CAS.
- P. Küsgens, M. Rose, I. Senkovska, H. Fröde, A. Henschel, S. Siegle and S. Kaskel, Microporous Mesoporous Mater., 2009, 120, 325–330 CrossRef.
- G. Akiyama, R. Matsuda, H. Sato, A. Hori, M. Takata and S. Kitagawa, Microporous Mesoporous Mater., 2012, 157, 89–93 CrossRef CAS.
- N. Ko, P. G. Choi, J. Hong, M. Yeo, S. Sung, K. E. Cordova, H. J. Park, J. K. Yang and J. Kim, J. Mater. Chem. A, 2015, 3, 2057–2064 RSC.
- J. Yan, Y. Yu, C. Ma, J. Xiao, Q. Xia, Y. Li and Z. Li, Appl. Therm. Eng., 2015, 84, 118–125 CrossRef CAS.
- Ü. Kökçam-Demir, A. Goldman, L. Esrafili, M. Gharib, A. Morsali, O. Weingart and C. Janiak, Chem. Soc. Rev., 2020, 49, 2751–2798 RSC.
- A. K. Rappe, C. J. Casewit, K. S. Colwell, W. A. Goddard and W. M. Skiff, J. Am. Chem. Soc., 1992, 114, 10024–10035 CrossRef CAS.
- S. L. Mayo, B. D. Olafson and W. A. Goddard, J. Phys. Chem., 1990, 94, 8897–8909 CrossRef CAS.
- M. F. De Lange, J.-J. Gutierrez-Sevillano, S. Hamad, T. J. H. Vlugt, S. Calero, J. Gascon and F. Kapteijn, J. Phys. Chem. C, 2013, 117, 7613–7622 CrossRef CAS.
- S. Fei, W.-L. Hsu, J.-J. Delaunay and H. Daiguji, J. Chem. Phys., 2021, 154, 144503 CrossRef CAS.
- S. Fei, A. Alizadeh, W.-L. Hsu, J.-J. Delaunay and H. Daiguji, J. Phys. Chem. C, 2021, 125, 26755–26769 CrossRef CAS.
- J. Gao, S. Fei, Y.-L. Ho, R. Matsuda, H. Daiguji and J.-J. Delaunay, J. Phys. Chem. C, 2021, 125, 17786–17795 CrossRef CAS.
- S. Fei, J. Gao, R. Matsuda, A. Endo, W.-L. Hsu, J.-J. Delaunay and H. Daiguji, J. Phys. Chem. C, 2022, 126, 15538–15546 CrossRef CAS.
- L. Grajciar, O. Bludský and P. Nachtigall, J. Phys. Chem. Lett., 2010, 1, 3354–3359 CrossRef CAS.
- L. Chen, L. Grajciar, P. Nachtigall and T. Düren, J. Phys. Chem. C, 2011, 115, 23074–23080 CrossRef CAS.
- L. Chen, C. A. Morrison and T. Düren, J. Phys. Chem. C, 2012, 116, 18899–18909 CrossRef CAS.
- J. R. G. M. Fischer and M. Jorge, Mol. Simul., 2014, 40, 537–556 CrossRef.
- E. Haldoupis, J. Borycz, H. Shi, K. D. Vogiatzis, P. Bai, W. L. Queen, L. Gagliardi and J. I. Siepmann, J. Phys. Chem. C, 2015, 119, 16058–16071 CrossRef CAS.
- A. R. Kulkarni and D. S. Sholl, J. Phys. Chem. C, 2016, 120, 23044–23054 CrossRef CAS.
- C. Campbell, C. A. Ferreiro-Rangel, M. Fischer, J. R. B. Gomes and M. Jorge, J. Phys. Chem. C, 2017, 121, 441–458 CrossRef CAS.
- P. G. M. Mileo, K. H. Cho, J. Park, S. Devautour-Vinot, J.-S. Chang and G. Maurin, J. Phys. Chem. C, 2019, 123, 23014–23025 CrossRef CAS.
- O. I. Lebedev, F. Millange, C. Serre, G. Van Tendeloo and G. Férey, Chem. Mater., 2005, 17, 6525–6527 CrossRef CAS.
- M. C. Neale, M. D. Hunter, J. N. Pritikin, M. Zahery, T. R. Brick, R. M. Kirkpatrick, R. Estabrook, T. C. Bates, H. H. Maes and S. M. Boker, Psychometrika, 2016, 81, 535–549 CrossRef PubMed.
- S. W. Rick, J. Chem. Phys., 2004, 120, 6085–6093 CrossRef CAS.
- H. J. C. Berendsen, J. R. Grigera and T. P. Straatsma, J. Phys. Chem., 1987, 91, 6269–6271 CrossRef CAS.
- H. W. Horn, W. C. Swope, J. W. Pitera, J. D. Madura, T. J. Dick, G. L. Hura and T. Head-Gordon, J. Chem. Phys., 2004, 120, 9665–9678 CrossRef CAS PubMed.
- D. Dubbeldam, S. Calero and T. J. Vlugt, Mol. Simul., 2018, 44, 653–676 CrossRef CAS.
- D.-Y. Hong, Y. K. Hwang, C. Serre, G. Férey and J.-S. Chang, Adv. Funct. Mater., 2009, 19, 1537–1552 CrossRef CAS.
- T. Hiratsuka, H. Tanaka and M. T. Miyahara, ACS Nano, 2017, 11, 269–276 CrossRef CAS PubMed.
- T. Hiratsuka, H. Tanaka and M. T. Miyahara, J. Phys. Chem. C, 2017, 121, 26877–26886 CrossRef CAS.
- R. Krishna, J. Van Baten, E. García-Pérez and S. Calero, Chem. Phys. Lett., 2006, 429, 219–224 CrossRef CAS.
- H. Tanaka, S. Hiraide, A. Kondo and M. T. Miyahara, J. Phys. Chem. C, 2015, 119, 11533–11543 CrossRef CAS.
- S. Hiraide, H. Tanaka and M. T. Miyahara, Dalton Trans., 2016, 45, 4193–4202 RSC.
- S. Hiraide, H. Tanaka, N. Ishikawa and M. T. Miyahara, ACS Appl. Mater. Interfaces, 2017, 9, 41066–41077 CrossRef CAS PubMed.
- M. Shivanna, K.-I. Otake, S. Hiraide, T. Fujikawa, P. Wang, Y. Gu, H. Ashitani, S. Kawaguchi, Y. Kubota, M. T. Miyahara and S. Kitagawa, Angew. Chem., Int. Ed., 2023, 62, e202308438 CrossRef CAS PubMed.
- M. Lísal, I. Nezbeda and W. R. Smith, J. Phys. Chem. B, 2004, 108, 7412–7414 CrossRef.
- M. J. Frisch, G. W. Trucks, H. B. Schlegel, G. E. Scuseria, M. A. Robb, J. R. Cheeseman, G. Scalmani, V. Barone, B. Mennucci, G. A. Petersson, H. Nakatsuji, M. Caricato, X. Li, H. P. Hratchian, A. F. Izmaylov, J. Bloino, G. Zheng, J. L. Sonnenberg, M. Hada, M. Ehara, K. Toyota, R. Fukuda, J. Hasegawa, M. Ishida, T. Nakajima, Y. Honda, O. Kitao, H. Nakai, T. Vreven, J. A. Montgomery Jr. , J. E. Peralta, F. Ogliaro, M. Bearpark, J. J. Heyd, E. Brothers, K. N. Kudin, V. N. Staroverov, R. Kobayashi, J. Normand, K. Raghavachari, A. Rendell, J. C. Burant, S. S. Iyengar, J. Tomasi, M. Cossi, N. Rega, J. M. Millam, M. Klene, J. E. Knox, J. B. Cross, V. Bakken, C. Adamo, J. Jaramillo, R. Gomperts, R. E. Stratmann, O. Yazyev, A. J. Austin, R. Cammi, C. Pomelli, J. W. Ochterski, R. L. Martin, K. Morokuma, V. G. Zakrzewski, G. A. Voth, P. Salvador, J. J. Dannenberg, S. Dapprich, A. D. Daniels, O. Farkas, J. B. Foresman, J. V. Ortiz, J. Cioslowski and D. J. Fox, Gaussian09 Revision E.01, Gaussian Inc., Wallingford CT, 2009 Search PubMed.
- M. J. Frisch, G. W. Trucks, H. B. Schlegel, G. E. Scuseria, M. A. Robb, J. R. Cheeseman, G. Scalmani, V. Barone, G. A. Petersson, H. Nakatsuji, X. Li, M. Caricato, A. V. Marenich, J. Bloino, B. G. Janesko, R. Gomperts, B. Mennucci, H. P. Hratchian, J. V. Ortiz, A. F. Izmaylov, J. L. Sonnenberg, D. Williams-Young, F. Ding, F. Lipparini, F. Egidi, J. Goings, B. Peng, A. Petrone, T. Henderson, D. Ranasinghe, V. G. Zakrzewski, J. Gao, N. Rega, G. Zheng, W. Liang, M. Hada, M. Ehara, K. Toyota, R. Fukuda, J. Hasegawa, M. Ishida, T. Nakajima, Y. Honda, O. Kitao, H. Nakai, T. Vreven, K. Throssell, J. A. Montgomery Jr. , J. E. Peralta, F. Ogliaro, M. J. Bearpark, J. J. Heyd, E. N. Brothers, K. N. Kudin, V. N. Staroverov, T. A. Keith, R. Kobayashi, J. Normand, K. Raghavachari, A. P. Rendell, J. C. Burant, S. S. Iyengar, J. Tomasi, M. Cossi, J. M. Millam, M. Klene, C. Adamo, R. Cammi, J. W. Ochterski, R. L. Martin, K. Morokuma, O. Farkas, J. B. Foresman and D. J. Fox, Gaussian16 Revision C.01, Gaussian Inc., Wallingford CT, 2016 Search PubMed.
- S. Simon, M. Duran and J. J. Dannenberg, J. Chem. Phys., 1996, 105, 11024–11031 CrossRef CAS.
- A. P. Thompson, H. M. Aktulga, R. Berger, D. S. Bolintineanu, W. M. Brown, P. S. Crozier, P. J. In'T Veld, A. Kohlmeyer, S. G. Moore, T. D. Nguyen, R. Shan, M. J. Stevens, J. Tranchida, C. Trott and S. J. Plimpton, Comput. Phys. Commun., 2022, 271, 108171 CrossRef CAS.
Footnote |
| † Electronic supplementary information (ESI) available: Force fields of MIL-101(Cr) with and without OMS interactions. Comparison of water models including SPC/E, TIP4PEw, and TIP5PEw. Comparison of adsorption isotherms of water on MIL-101(Cr) obtained from GCMC simulations using the original and optimized structures. GCMD simulation results for simplified pore models with three different seeds for random number sequences. The saturated pressures of TIP5PEw. Material characterization of MIL-101(Cr). Validation of the OMS–water interaction potential. See DOI: https://doi.org/10.1039/d3lf00179b |
| This journal is © The Royal Society of Chemistry 2024 |

