
 Open Access Article
 This Open Access Article is licensed under a Creative Commons Attribution-Non Commercial 3.0 Unported Licence
Roll-to-roll manufacturing of large surface area PDMS devices, and application to a microfluidic artificial lung†
Andrew
Zhang
 ab,
Kartik
Tharwani
a,
Jennifer
Wang
a,
Gabriele K.
Seilo
a,
Michael A.
Atie
ab and
Joseph A.
Potkay
*ab
ab,
Kartik
Tharwani
a,
Jennifer
Wang
a,
Gabriele K.
Seilo
a,
Michael A.
Atie
ab and
Joseph A.
Potkay
*ab
aECLS Laboratory, Department of Surgery, University of Michigan, Ann Arbor, MI 48109, USA. E-mail: jpotkay@umich.edu
bAnn Arbor Veteran Affairs Healthcare System, Ann Arbor, MI 48105, USA
First published on 24th July 2024
Abstract
The ability to cost-effectively produce large surface area microfluidic devices would bring many small-scale technologies such as microfluidic artificial lungs (μALs) from the realm of research to clinical and commercial applications. However, efforts to scale up these devices, such as by stacking multiple flat μALs have been labor intensive and resulted in bulky devices. Here, we report an automated manufacturing system, and a series of cylindrical multi-layer lungs manufactured with the system and tested for fluidic fidelity and function. A roll-to-roll (R2R) system to engrave multiple-layer devices was assembled. Unlike typical applications of R2R, the rolling process is synchronized to achieve consistent radial positioning. This allows the fluidics in the final device to be accessed without being unwrapped. To demonstrate the capabilities of the R2R manufacturing system, this method was used to manufacture multi-layer μALs. Gas and blood are engraved in alternating layers and routed orthogonally to each other. The proximity of gas and blood separated by gas permeable PDMS permits CO2 and O2 exchange via diffusion. After manufacturing, they were evaluated using water for pressure drop and CO2 gas exchange. The best performing device was tested with fresh whole bovine blood for O2 exchange. Three μALs were successfully manufactured and passed leak testing. The top performing device had 15 alternating blood and gas layers. It oxygenated blood from 70% saturation to 95% saturation at a blood flow of 3 mL min−1 and blood side pressure drop of 234 mmHg. This new roll-to-roll manufacturing system is suitable for the automated construction of multi-layer microfluidic devices that are difficult to manufacture by conventional means. With some upgrades and improvements, this technology should allow for the automatic creation of large surface area microfluidic devices that can be employed for various applications including large-scale membrane gas exchange such as clinical-scale microfluidic artificial lungs.
Introduction
Microfluidic devices leverage small scale structures and advantages at the micron scale for efficiently processing fluids. In particular, microfluidic technology has seen extensive use in biomedicine and in lab-on-a-chip devices which can efficiently process and measure small quantities of fluids.1 Microfluidic devices have been predominantly formed from polydimethylsiloxane (PDMS) or silicone elastomer.2 PDMS is a popular material used in implantable and microfluidic devices, known for its biocompatibility, chemical inertness, mechanical compliance, and optical transparency.1PDMS microfluidic devices are traditionally formed using the process of soft lithography,3 where silicon-based molds or more recently 3D printed molds,4 are used to form microfluidic structures in a single layer of PDMS. To bring some of these technologies to clinical and commercial applications, the industry has turned to automation, and specifically roll-to-roll (R2R) manufacturing. R2R processing is an established industrial and research manufacturing process used to create large areas of flexible devices.5–8 It unrolls material from a source spool, processes it, and then rerolls it onto an output spool. This convenient application has recently begun to be applied to PDMS and microfluidics.1,9,10 However, these implementations have been restricted to large quantities of individual small surface area devices, greatly limiting potential applications. Current R2R systems do not allow the creation of a single large surface area device, which would be required for cost-effective implementation in efficient, large-scale fluid processing applications. The ability to manufacture such a large-area device would allow microfluidic technologies meant to process large volumes of fluids to also be brought to practical applications.
One application requiring a large surface area microfluidic device is the microfluidic artificial lung (μAL). Artificial lungs (ALs) are used to replace or assist lung function for recovery from severe heart and lung disease.11 Compared to current clinical technology, μALs have smaller features with excellent gas exchange efficiency and more natural shapes closer to those in their natural counterpart.12–20 However, much like other microfluidic devices, most μALs to date have only been able to process a very small amount of fluid or blood. This is because they are formed using soft lithography and are limited to a single layer of fluidics. Efforts to parallelize these devices have resulted in higher blood flow ratings, but also in bulky devices with complex blood distribution networks that require intensive manual labor.12,14,15,17,20–25 As such, a major limitation to advancing μALs toward the clinic is manufacturing a single clinically usable device in a simple and cost-effective manner. The same is true of other microfluidic technologies such as other organ-on-a-chip devices and debubblers.26,27
Previous work by our laboratory demonstrated a rolled-membrane μAL suitable for adaptation to a R2R method.28 All layers are contained in a single PDMS sheet and the multi-layer device is formed when this sheet is manually rolled onto and bonded to a cylindrical PDMS substrate. Each revolution of the rolling process forms a new, overlapping layer. Layers are plasma activated to form an irreversible bond. This resulted in a single-layer device with one gas-exchange interface consisting of one blood layer, a gas diffusion membrane, and one air layer.
Here, we report an automated manufacturing system capable of manufacturing a large area, cylindrical, multilayer PDMS microfluidic device, and use it to manufacture a series of μALs which were tested to ensure fluidic fidelity, pressure drop, and gas exchange.
Methods
R2R system overview and design
The R2R system (Fig. 1) begins with a roll of biocompatible PDMS rubber (Fig. 2A), which is unraveled to expose the sheet (also known as a “web” in R2R terminology). A CO2 laser engraver creates patterns in the PDMS sheet (Fig. 2B). The sheet is then plasma activated (Fig. 2C) to permit bonding the PDMS to itself in the next step. Finally, it is rerolled into a processed device around a PDMS core (Fig. 2D). This entire process from unrolling to rerolling is performed simultaneously and synchronously, removing processing space as a limitation to device size. The entire process is synchronized by an Arduino Mega. Most steps are automated to minimize human error over this repetitive process. | ||
| Fig. 1 Conceptual diagram of the R2R system. A) START: roll of 100 μm thick biocompatible and gas-permeable PDMS (on a protective PETG carrier) B) the laser engraver engraves channels into PDMS C) protective backing is removed by a “waste” roll D) cold plasma wands allow PDMS layers to adhere to each other E) END: finished cylindrical PDMS roll. | ||
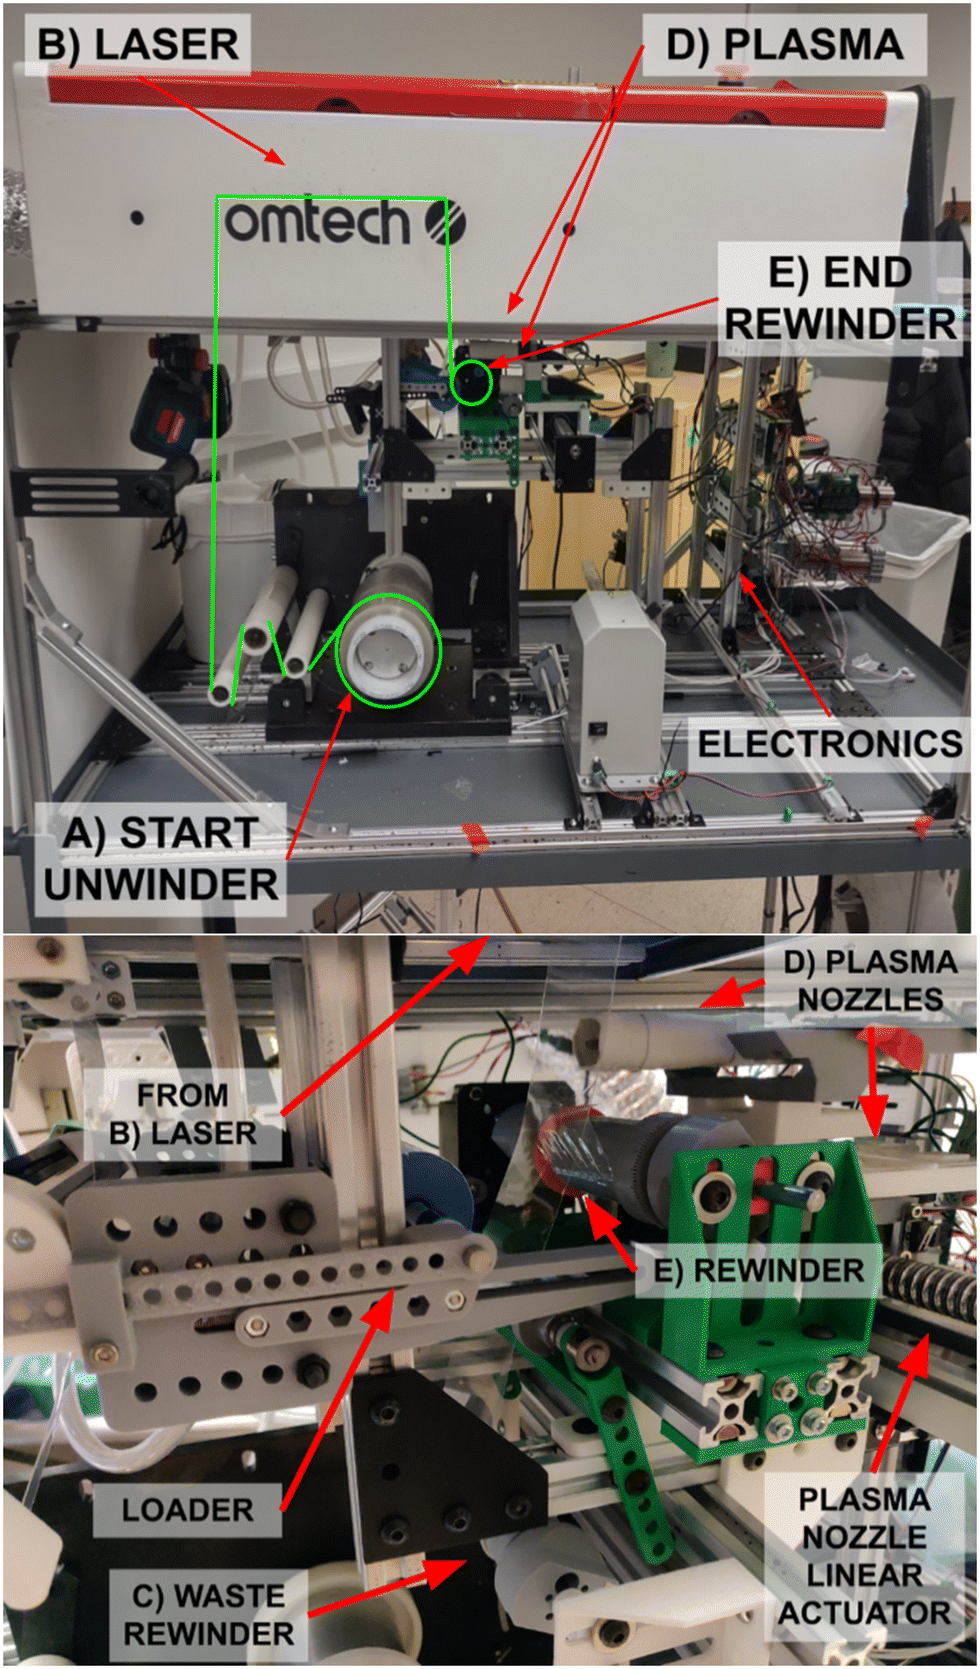 | ||
| Fig. 2 Physical construction of the R2R system, with zoom in of the plasma nozzle, waste rewinder, and rewinder. | ||
Use of radial positioning
This R2R system is unique compared to previous R2R systems in that the final processed roll is used as a single device in its rolled-up state, and not unrolled again. The layer-to-layer radial position of the engravings must be fixed, so that the patterns on each layer line up radially, permitting access to the channels through vias (Fig. 3A). The length of PDMS engraved and used on each layer must increase to match the circumference of each successive layer. This differs from most other R2R systems, in which the processed roll must be unrolled again to access and/or separate the many individual small-scale devices. On these other R2R systems, the radial position of the pattern on the processed roll does not matter (Fig. 3B). | ||
| Fig. 3 A: A cross-section with radially fixed positioning of each layer. There are clear regions where each fluid can be accessed in bulk. B: A cross-section with linearly fixed engraving length and spacing. Because the diameter changes as more layers are added, the positioning appears random. There is no way to access a particular feature without unrolling the processed material. | ||
Unwinder
The unwinder (industrial automation specialists) uses a capstan friction system to passively (i.e. no motors or feedback systems) maintain a fixed tension as the PDMS is unwound and consumed.The source PDMS used is 100 μm-thick Silpuran 2030 mounted on a 100 μm-thick polyethylene terephthalate glycol (PETG) backing (discussed in the next section). The PDMS source roll is cut into 60 mm-wide sections to match the width of all the guide rods and final rewinder in the R2R system. (A cutting rig is pictured in ESI,† Fig. S1).
Laser engraving
The laser engraver is a heavily modified Omtech K40 (Fig. 4). First, its motherboard has been removed and replaced with a custom programmed Arduino Uno for more precise control and synchronization with the Arduino Mega (which synchronizes all aspects of the R2R process). Second, the bottom of the laser engraver has been cut out, allowing continuous pass-through of the film for engraving. The engraving table has been replaced with an adjustable vacuum table. When turned on, it sucks the PDMS flat against it to hold it still for engraving. This permits a fixed focal length for the laser and ensures a uniform engraving depth. Several other adjustments including linear rail and hall-effect limit switches (for increased mechanical accuracy), and compressed air-assist and custom fan shroud for cooling and debris removal improve the overall engraving quality to be sufficient for this application. Finally, after each engraving, Scotch Magic tape (which was observed to not leave residual adhesive upon removal) is used to remove any excess engraving debris. The final step of removing the excess engraving debris is manual in this iteration of the system but can be automated in the future. | ||
| Fig. 4 A: The adjustable laser engraving vacuum table. The laser engraver can be opened during the plasma adhesion phase. This allows observation of the PDMS before it is rerolled, as well as using Scotch Magic tape to remove excess engraving debris. B: The laser is capable of engraving rounded triangular channels. These were measured by an Olympus OLS 4000 LEXT confocal microscope at 180 μm across, and 60 μm deep. This leaves 40 μm as the membrane for the 100 μm-thick PDMS source roll. | ||
Protective backing and synchronization
When purchased, the PDMS comes on a protective PETG backing. This backing must be removed from the PDMS before the PDMS is combined into the finished device. As such, it is pulled by its own PETG waste motor which operates in sync with the rewinder.This backing, unlike the PDMS, is not elastic and so can be relied on to maintain a fixed length. Therefore, the waste motor controls the movement of the PDMS film through the system.
Plasma activation
Both sides of the PDMS are plasma activated using two CeraPlas F-series cold-plasma wands (Fig. 5A). In a preliminary test, two neat sections of PDMS film were activated in this method then brought into contact where they bonded. When the two bonded PDMS films were then pulled apart, the individual sheets broke before the plasma-activated adhesion was undone. | ||
| Fig. 5 A: Plasma activation is depicted in red (engraved side) and green (non-engraved side). By plasma-activating the outer, non-engraved side of the PDMS film (gray) after it is incorporated into the rewinder (blue), the length of PDMS film without the PETG backing (purple) is minimized (not to scale). B: A method which separates plasma integration and rewinding into two separate steps involves plasma-activating both sides of the PDMS at once. There is a long distance where the PDMS film is without its PETG backing before it reaches the rewinder. This causes difficulty in the rerolling process due to stretching and wrinkling of the film (not to scale). | ||
Both wands are attached to a single linear actuator (RATTMMOTOR EBX1605-400 mm) which moves back and forth to ensure coverage across the entire width of the PDMS sheet. One plasma wand activates the engraved side of the PDMS while it is still attached to the PETG carrier. The other wand activates the back (i.e. non-engraved) side of the PDMS film after it has been integrated with the output roll on the rewinder (Fig. 5A). This configuration minimizes the distance between where the PETG backing is removed and where the PDMS film is bonded onto the output roll. If too long (see Fig. 5B for an example alternate configuration), the unbacked PDMS film can act unpredictably resulting in wrinkling and inconsistent tension. The alternate configuration shown in Fig. 5B would also require separate linear actuators for each plasma wand, increasing the overall size and complexity of the plasma mechanism.
PDMS tensioning
By using the PETG backing to control movement through the system, potential error due to PDMS stretching is minimized.Since the progress of the PETG backing serves as a measure of how much PDMS is being consumed, adjusting how much the waste motor spins relative to the rewinder motor allows adjustment of the tension on the final roll/device. Normally, backing spins slightly slower than the rewinder, meaning that there is always a small amount of tension on the PDMS to avoid wrinkles when rerolling.
Rewinder
The PDMS is then rolled into the rewinder, with the engraved side face-down, facing the center of the output roll. The rewinder is custom built around a NEMA-42 stepper motor (Fig. 2). It clamps around a custom core assembly which can be easily installed for setup and removed once the machine has finished rolling the device. The rewinder rotates 360° to wrap a single layer of PDMS around each cycle. Since it spins exactly one circle each cycle, slight desynchronizations between where the patterns are engraved and where they end up on the finished core do not accumulate layer-to-layer.Device layers and engraving phases
To begin the R2R process, a cylindrical substrate or core is placed on the (output) rewinder motor consisting of a two-layer structure. The internal layer is 3D printed ABS plastic for mechanical integrity. Fused (cured) to it is an outer layer of smooth, molded PDMS (MasterBond MasterSil 323l). This PDMS-coated core and beginning of the PDMS sheet are then plasma activated. After plasma activation, a spring-loaded roller pushes the beginning of the PDMS sheet onto the PDMS core to bond/fuse them. The roller is released after the machine runs for one core rotation, completing the process of bonding a single, unengraved layer of the PDMS film to the core.Ten additional buffer layers of blank or non-engraved PDMS film allow the system to reach a steady state before the laser begins engraving the fluidic channels in subsequent layers. The laser engraves indexers (i.e. alignment markers) at the same position on each buffer layer. Based on the layer-to-layer error in the indexers on each buffer layer, the tension in the system is manually adjusted until there is negligible error in layer-to-layer alignment.
The laser engraving phase follows, alternating between gas and blood layers, with the engraving pattern length being equivalent to the current circumference of the rewinder output roll. Drawings of the gas and blood layers are shown in Fig. 6, where the blood (red) layers are engraved in one rotation, then the gas (blue) layers are engraved in the next rotation. These engravings result in orthogonally oriented blood and gas channels on alternating layers, as depicted in Fig. 7. The width of the drawing in Fig. 6 represents the current circumference of the output roll.
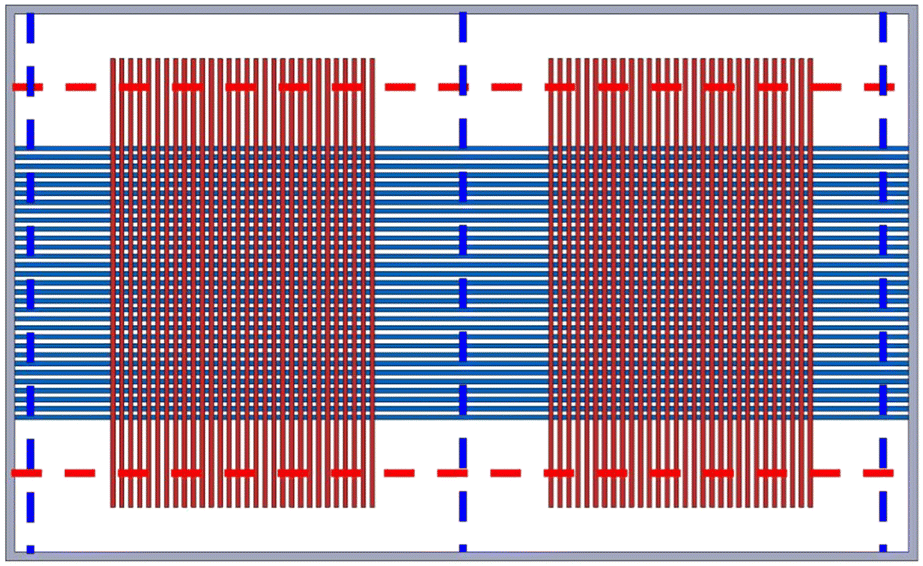 | ||
| Fig. 6 A gas layer and blood layer overlaid on each other. Red lines denote blood channel engravings, blue lines denote gas channel engravings. The dotted red lines denote where the core is cut through (with the scalpels on the device shown in Fig. 8B) after completion of the R2R process to expose the blood channels. The dotted blue lines denote where the completed core is cut through to expose the gas channels (with scalpel) (not to scale). | ||
 | ||
| Fig. 7 A drawing of a device showing alternating blood and gas layers. Since each blood layer has a gas layer both above and below it, gas can diffuse in two directions, greatly increasing the gas exchange capability. Blood travels axially, while gas travels circumferentially (not to scale). | ||
 | ||
| Fig. 8 A: Red lines show where the core is cut to expose the blood channels. The blue line shows one location where the core is cut to expose the gas channels, with the second being on the other side. B: A cutting rig for cutting the processed output roll to the desired width. C: A cut output roll. On the inside surface of the plastic inner core, teeth can be seen that provide friction to keep the side and main pieces together during processing. | ||
When all engraved layers are completed, fifteen non-engraved cover layers are added to the output roll to protect the engraved layers prior to post processing (device manifolding and assembly). By intentionally slowing down the PETG rewinder, the PDMS is stretched as it is wrapped around the main rewinder. 24 mmHg of additional pressure resistance is added per layer, or 360 mmHg over 15 layers. This compression of the final layers supplements the plasma adhesion in keeping the completed core secure.
Device design
The primary metric under which the devices were evaluated is oxygenation capability. Since this study is a proof-of-concept study, design characteristics were chosen to prioritize manufacturing success while still maintaining a reasonable oxygenation rate.The device design has various parameters. More layers will take longer to manufacture, but will increase the number of parallel channels.
The inter-channel space (PDMS that is not engraved) is required to maintain mechanical integrity. Blood channels that are more closely spaced increase the number of parallel capillaries, but spacing them too closely together results in a reduction in inter-channel space. Gas channels that are more closely spaced result in more gas exchange per blood channel, but again also results in a reduction in inter-channel space.
A wider device has longer blood channels, improving gas exchange, but increasing pressure drop across the device. The unengraved space on the sides of the gas exchange area can be shrunk for a similar effect, but risks leaks.
Device assembly
Upon completion of the R2R process, the core is removed from the machine. This completed core is cut to expose the blood channels using a specialized cutter (Fig. 8). To assist this process, the internal layer of the core made of plastic is split into a middle main piece, and 2 side pieces. After the outer PDMS layer is cut to expose the blood layers, the two side pieces fall off and are discarded.Fluidic & structural housing
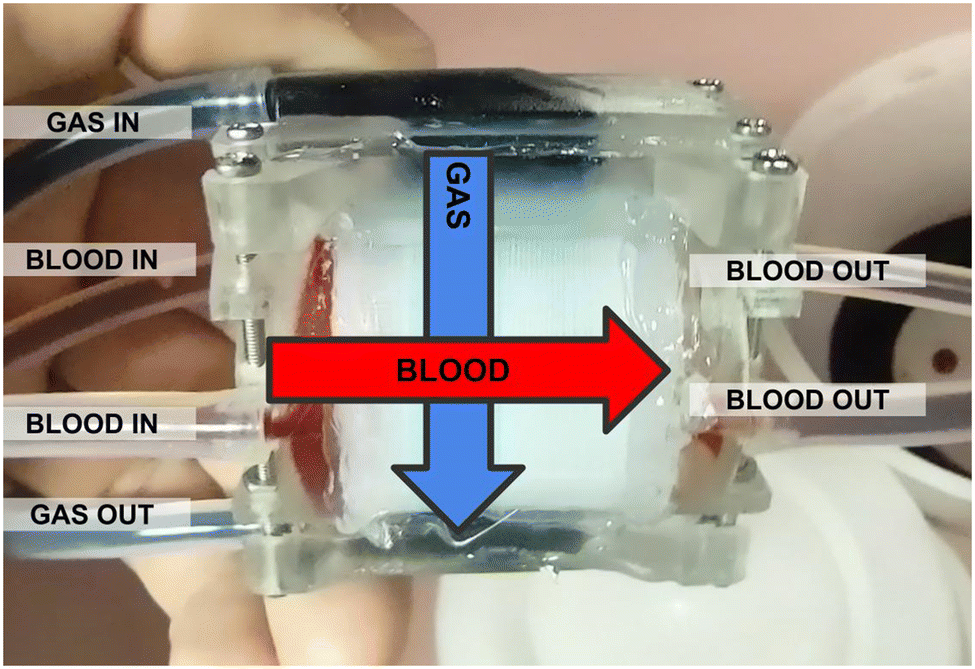
After cutting, the core is placed into a custom 3d-printed housing (form 3 printer, RS-F2-GPCL-04 clear resin) sealed with silicone caulking. A more detailed housing model and caulking methodology is shown in ESI,† Fig. S3. This housing serves to route gas and blood into their respective engraved flow channels. It also provides mechanical support for the core when it is cut along the blue lines in Fig. 8A to expose the gas channels. Note that there are two separate blood capillary sections, each comprising half the circumference of the rolled device, and with their own blood inlet and outlet (Fig. 9). | ||
| Fig. 9 A: A computer model of the device, labeled with relevant fluidic features. B: A computational fluid simulation was used to confirm relative flow velocities and distribution. | ||
Leak testing and visualization method
To visualize channel patency and check for leaks, each device was first filled with red (blood flowpath) and blue (gas flowpath) food coloring dissolved in water at a pressure of 100 mmHg (Fig. 11). This served to confirm that the device was properly constructed. Devices could fail this test if dye flowed out of the device from either the blood or gas phase, or between the blood and gas phases.Water resistance testing method
The in vitro tests used a specialized μAL-testing setup shown in Fig. 10.29 In this circuit, water travels from a 100 mL reservoir through a peristaltic pump (Kamoer KPST-N14-C), through the blood side of the μAL, and back to the reservoir. Simultaneously, another peristaltic pump controls the sweep gas through the gas side of the μAL. Two pressure sensors (Panasonic ADP5140) before and after the μAL determine the blood-side pressure drop across the μAL, and a third pressure sensor before the μAL determines the gas-side pressure drop. A pH sensor (Atlas Scientific Gravity pH Sensor) in the reservoir can detect changes in CO2 concentration in the water. | ||
| Fig. 10 The μAL-testing setup used to test the devices. | ||
To evaluate pressure drop, the blood-side flow rate of the system is gradually increased, while measuring the blood-side pressure drop. Each flow rate is maintained for 2 min, with the average pressure drop over the second minute being taken as the pressure drop at that flow rate. To avoid the risk of damaging devices before they reach the later tests, the pressure drop testing is terminated at approximately 200 mmHg.
Water PH testing method
CO2 was exchanged in water to qualitatively test the device's ability to perform gas exchange as a surrogate and precursor to blood testing. First, the water in the reservoir (Fig. 10) is conditioned‡ by supplying compressed air (0% CO2) through the gas side of the μAL and water through the blood CO2. This removes any dissolved CO2 present in the water. Then, the sweep gas through the μAL is changed to 100% CO2 while the CO2 content of the water reservoir is monitored via the pH sensor. Finally, the CO2 is removed from the water by supplying compressed air to the gas side of the μAL again. A pre-calibration and post-calibration step‡ at the beginning and end of the test is performed using pH 7 and pH 4 buffer solutions. Sweep gas to water flow ratio was set to 0.5![[thin space (1/6-em)]](https://www.rsc.org/images/entities/char_2009.gif) :1.0 to ensure that gas side pressure is less than water side pressure. Quantitative analysis cannot be performed‡ due to the inconsistency in water solutes, but the relative change in pH in a single run indicates successful CO2 exchange.
:1.0 to ensure that gas side pressure is less than water side pressure. Quantitative analysis cannot be performed‡ due to the inconsistency in water solutes, but the relative change in pH in a single run indicates successful CO2 exchange.
Blood testing method
Blood testing was performed following the FDA Cardiopulmonary Bypass Oxygenators 510(k) submissions, published November 13, 2000. This test determined the maximum flow rate at which blood entering the device at venous levels (65 ± 5% O2 saturation) would exit 95% saturated. To perform this test, the water in the reservoir was replaced with 250 mL of blood that was pre-conditioned (65 ± 5% O2 saturation, hemoglobin concentration 12 ± 1 g dL−1, pCO2 45 ± 5 mmHg, base excess 0 ± 5 mmol L−1, temperature 37 ± 2 °C, and pH 7.4 ± 0.1) and anticoagulated (active clotting time >1000 s).30 A blood parameter monitoring system (Terumo CDI-500) was placed on the blood output of the μAL. This allowed monitoring of O2 saturation. Blood flow varied between 0.4 and 4 mL min−1 with a sweep gas to blood flow ratio of 0.5:1.0 and outlet blood oxygenation was recorded. Each blood flow rate was allowed to settle over 1 minute, and the last 30 seconds was taken as the blood saturation value. The processed blood was then discarded and not returned to the reservoir.
Results
Automated manufacturing system performance
A group of three engraved channels, 1.8 mm long, were profiled on an Olympus OLS 4000 LEXT confocal microscope. This is depicted in Fig. 4B, an overhead view is shown in Fig. 11A, cross-section view in Fig. 11B, and additional images in ESI† Fig. S2. They were analyzed for surface roughness, debris, and dimensional consistency. | ||
| Fig. 11 A: 3D-profile of a channel on an Olympus OLS 4000 LEXT confocal microscope. The full image is shown in ESI† Fig. S2A. The height profile has been converted to greyscale, with darker pixels being deeper and lighter pixels being shallower. Black pixels represent a height of 20 μm and white pixels represent a height of 140 μm. B: Cross-section view of a channel at 4 arbitrary points. Units are in μm. | ||
Surface roughness was computationally analyzed at 20 random points in the channels. With a subsample diameter of 20 μm, maximum protrusion was measured to be 4.1 ± 6.5 μm. More significantly, large pieces of debris were observed. On the 1.8 mm long sections of 3 channels, there were roughly 11 protrusions ∼20 μm into the channel, and two protrusions ∼40 μm into the channel. This would add up to approximately 61 pieces of debris ∼20 μm, and 11 pieces of debris ∼40 μm per 30 mm channel, and very likely even larger debris.
To analyze consistency along the length of channels, 10 cross-section samples from 3 channels were taken. Channel depth was 66 ± 9 μm, and channel width was 156 ± 29 μm. The channel positioning varied laterally; statistically the standard deviation of the lateral position was calculated to be 5.5 ± 3.1 μm; visually this took a sinusoidal-like pattern whose amplitude varied by 10–20 μm, and had a period of 1.4 mm. The channels also had a higher ridge on one side.
Layer-to-layer registration after base layers varied by approximately ±1.5 mm across 15 engraved layers. This was largely dependent on how well the waste rewinder was synchronized with the rewinder. A sample cross-section is shown in ESI† Fig. S2B.
Manufacturing results
Three successful devices that passed leak testing were manufactured using the R2R system, each improving on the last. Design parameters are shown in Table 1.| Device | A | B | C |
|---|---|---|---|
| Base layer count | 10 | 10 | 10 |
| Covering layer count | 15 | 15 | 15 |
| Theoretical blood layer count | 7 | 7 | 12 |
| Gas layer count | 8 | 8 | 13 |
| Total surface area of engraved layers (cm2) | 600 | 450 | 750 |
| Total length of film (meters) | 3.0 | 3.0 | 4.0 |
| Gas spacing (mm) | 1.0 | 0.5 | 0.4 |
| Engravings per gas layer | 40 | 40 | 50 |
| Blood spacing (mm) | 1.0 | 0.5 | 0.3 |
| Engravings per blood layer | 75 | 155 | 268 |
| Total blood engravings | 1125 | 2325 | 6700 |
| Theoretical total gas exchange surface area (cm2) | 10.75 | 28.49 | 106.1 |
Device A was the first successfully manufactured device. It contained a total of 1125 blood channels at a density of 10 channels per cm. The assembly procedure involved squeezing the silicone caulking between the housing and core.
Device B improved upon device A by containing a greater density of engraved channels. The device width, and thus the engraved blood channel length, was decreased to reduce device resistance and pressure drop, at the cost of a smaller increase in gas exchange surface area. Finally, it employed a newer housing and silicone caulking procedure in which the housing was squeezed against the core using bolts, and then sealed with silicone afterwards (Fig. S3 in ESI† illustrates this newer caulking procedure).
Device C built on the experience of previous runs, increasing the device layer count and engraved channel density.
Leak testing and visualization results
For device A, the food coloring failed to reveal flow in large sections of the device. Further, a leak between the blood and gas phase was observed in one side of the blood flowpath and thus only half of the blood flowpath was functional for further testing.For device B and device C, no leaks were detected, and most observable channels were open (Fig. 12).
 | ||
| Fig. 12 Device C filled with food coloring for visualization, labeled, to show the major features. | ||
Additional images are shown in ESI† Fig. S4. Devices which failed leak testing were not reported.
Water resistance testing results
Fig. 13 shows the liquid side pressure drop and resistance for all devices. Device A exhibited a pressure drop of 200 mmHg at 0.4 mL min−1. Higher flows were not tested. Device B exhibited a pressure drop of 167 mmHg at 4 mL min−1. Device C exhibited a pressure drop of 223 mmHg at 4 mL min−1. For all devices, the fluidic resistance (pressure/flow rate) decreased as flow rate increased. | ||
| Fig. 13 A: Pressure drop of each device with water, and device B with blood. B: Resistance as a function of flow rate. | ||
Water pH testing results
The ability of device A to add CO2 to water at a water flow rate of 0.050 mL min−1 is shown in Fig. 14A; pH of the water reservoir exponentially decreased from 5.2 to 4.8 over ∼3 h. | ||
| Fig. 14 A: Water testing with device A. Gas flow was 0.025 mL min−1. This is a simplified test which only tested CO2 addition; 100% CO2 was applied for the full duration of the test. The pH sensor was not calibrated, the water was not conditioned beforehand to remove existing CO2, and CO2 removal was not tested for this device. Nevertheless, the sharp decrease in pH indicates the addition of CO2. B: ‡Water testing with device B. The area between the two orange lines represents when the CO2 is set to 100% for 3 hours, and a corresponding drop and then rise in pH can be seen. Gas flow was set to 0.5 mL min−1. The full 46 hour test including calibration and conditioning is shown in ESI,† Fig. S5B. | ||
The capability of device B to add and remove CO2 to/from water (at a water flow rate of 1 mL min−1) is shown in Fig. 13B. When the sweep gas of the μAL was changed to 100% CO2, pH dropped from 4.7 to 4.0 in ∼1 h. This change in pH reversed when the sweep gas was changed back to compressed air, again demonstrating successful qualitative CO2 exchange.
Comparing device A and device B, both were capable of exchanging CO2 in water. Although the testing method varied between them, device B was much more effective due to its ability to process larger volumes of water at a time.
Device C was accidentally damaged during setup for pH testing, and thus did not undergo pH or any further testing.
Blood testing results
To further validate device functionality, the ability to add O2 to blood was tested for device B.Pre-conditioned blood had a pH of 7.441, pCO2 of 42 mmHg, pO2 of 37.3 mmHg, SaO2 of 69.3%, and Hb of 12 g dL−1 (0.1608 mL of O2 per mL of blood) to match typical venous conditions. Outlet blood oxygen saturation vs. blood flow rate plot for device B is shown in Fig. 14, exhibiting the characteristic shape for blood oxygenators. At small flow rates, blood residence time in the device is large, permitting nearly full saturation of blood with O2. As flow rate increases, residence time and blood oxygen saturation both decrease. Fig. 14 reveals a rated blood flow of 3.1 mL min−1 (outlet SO2 of 95%) for this device.
Oxygen exchange per flow rate is shown in Fig. 16. Total O2 exchange by flow rate was calculated11,30 using saturation values from Fig. 15. 100% saturation was estimated to correspond with 0.1608 mL of O2 per mL of blood based on the hemoglobin content of 12 g dL−1 and 1.34 mL per O2 per g dL−1 of hemoglobin.31 Maximum O2 exchange of 0.14 mL min−1 occurred at 3.3 mL min−1 blood flow.
 | ||
| Fig. 15 Outlet blood saturation as a function of flow rate during blood testing for device B. Error bars represent 95% confidence intervals, based on the standard deviation from the last 30s of O2 saturation readings. | ||
 | ||
| Fig. 16 Gas exchange by flow rate, calculated using saturation values from Fig. 15. Error bars represent 95% confidence intervals, based on the standard deviation from the last 30s of O2 saturation readings. | ||
Below its rated flow, the O2 exchange rate of a typical AL increases linearly with increased flow. This is because the flow rate is increasing while outlet O2 saturation is fixed at ∼100%. Starting from about the rated flow, the O2 saturation begins to drop from 100%. This causes the O2 exchange rate to deviate from this linear trend. Then it reaches an asymptote as each increase in blood flow is counteracted by a proportional decrease in outlet blood SO2. Eventually, it reaches an asymptote with maximum oxygen exchange that does not increase with blood flow rate.
For device B, below 3.3 mL min−1, the O2 exchange rate seems to go up linearly as with other ALs. However, instead of gradually tapering into an asymptote, the O2 exchange rate drops sharply at 4.0 mL min−1.
According to FDA guidelines, the device has a rated flow of 3.1 mL min−1. However, the total O2 exchange decreases as flow increases between 3.3 mL min−1 and 4.0 mL min−1 (and presumably continues beyond 4.0 mL min−1), which is unusual for oxygenators.11 A possible explanation is that the increase in pressure dilates the channels, increasing the distance that O2 must diffuse across blood to reach unbound hemoglobin molecules.
Destructive assay of channels
To investigate the unusually high resistance in Fig. 13, device B was cut open with a scalpel to expose the channel cross section, and then imaged with a LEXT OLS4000 confocal microscope (Fig. 17). 95% confidence intervals of channel heights were 61 ± 22 μm, channel widths were 221±73 μm, channel spacing was 520 ± 57 μm, and layer height was 103 ± 28 μm. Average values for channel widths and heights were roughly as expected. However, they had significantly more variation than expected. | ||
| Fig. 17 Confocal image of device B cut open. 7 layers of blood channels can be clearly observed, along with the other layers of the device. The image in the lower right indicates the section of the device where this confocal image is taken. | ||
Discussion
Overall, this work demonstrates a promising approach for the automated creation of large area microfluidic devices. A custom roll-to-roll manufacturing system was designed, assembled, and programmed to construct functional, many layer microfluidic artificial lungs. Detailed discussions of various aspects of the system are provided below.Future studies are aimed at improving consistency to achieve clinically relevant rated blood flows (1 L min−1).
Manufacturing, leak testing, and visualization
Device A demonstrated the milestone of having a multilayer R2R device with functional blood and gas channels in close proximity to each other, the prerequisites of micro-scale gas exchange. The device suffered from several shortcomings that were addressed in subsequent devices. First, based on visual inspection that food coloring was not seen in large sections of the lung, the amount of open blood capillaries was estimated to be equivalent to half of one blood layer. It is believed that this was due to the way the devices were sealed. When the silicone caulking was squeezed between the housing and the core, it spread laterally over the interface and occluded the channel openings. Secondly, the leak in one half of the device also exposed additional shortcomings in the quality of sealing. Finally, channel density was low (10 channels per cm) to maximize intermediate surface area for bonding. Although this increased the chance of success in this initial device, it resulted in both a lower number of capillaries and number of gas channels servicing the capillaries.Device B and device C both had successive improvements in the channel density and/or layer count compared to device A. They additionally utilized a redesigned housing where the caulking was applied after the core was installed into the housing, such that the caulking was not squeezed over channel openings. Instead, 0.5 ± 0.2 mm (equivalent to 5 blood layers) was intentionally occluded by the housing design to compensate for mechanical tolerance and misalignment.
Estimated device parameters taking into account the occluded channels are shown in Table 2. The estimated blood layer count (after caulking) in device A is extremely crude, and based on the visibility of dyed channels. This value in device B and C is estimated based on occlusion in the design (graphically presented in Fig. S3B in the ESI†). Other factors such as air trapped in the channels that can lead to incomplete filling were not considered.
| Device | A | B | C |
|---|---|---|---|
| Theoretical blood layer count | 7 | 7 | 12 |
| Estimated actual blood layer count (after caulking) | 0.5 (7%) | 2 (29%) | 7 (58%) |
| Estimated open engraved blood channels | 37.5 | 775 | 2680 |
| Predicted resistance (mmHg mL−1 min−1) | 367.8 | 13.35 | 3.86 |
Water resistance testing and channel patency
All three devices exhibited pressure drops that increased with water flow rate, but which exhibited some unexpected properties.First, pressure drops were significantly higher than theoretical calculations (Fig. 13). It was initially suspected that the channels were shallower than expected, or that they were compressed by the pressure of the stretched covering layers. However, the investigation in Fig. 17 precluded these theories. One explanation for the increased resistance is that laser engraving depth was inconsistent along the length of the channels, causing some shallow regions. In this case, the resistance from the shallow areas would dominate.§ Alternatively, debris or air in the channels could have reduced their patency, either increasing the resistance of individual channels or blocking them off entirely.
Second, the rate of change of the pressure drop vs. flow rate (i.e. the slope of the curve or fluidic resistance) of each device decreased with increasing pressure. This was unusual as pressure drop of microfluidic channels is typically proportional to flow rate (i.e. fluidic resistance is independent of flow rate).11 One likely explanation is that pressure from the liquid dilated the flow channels, reducing channel resistance as the flow rate increased (Fig. 13B). Although unusual, this may be beneficial for biocompatibility. Typically, low flows are associated with low shear and coagulation, and high flows with high shear and hemolysis. However, if the channels expand as flow increases, the change in shear between different flow rates would reduce. Although PDMS μALs are known to be mechanically compliant,11 to date, these are the only reported μALs which demonstrate the phenomenon to such an extent. This mechanical compliance would need to be investigated via a dedicated study in the future.¶
Finally, device C exhibited similar (water side) fluidic resistance to that of device B despite having many more capillaries. After manufacturing device C, the laser was inspected. It was determined that the laser's cooling pump had stopped, likely causing a gradual deterioration in laser power and thus engraved channel depth over time. After this revelation, the R2R system was decommissioned for repairs and upgrades.
Gas exchange capability
Both device A and device B demonstrated the ability to change pH in water through CO2 exchange, and device B demonstrated the ability to oxygenate blood. This indicates that both devices bring liquid and gas in close enough contact over a significant enough surface area to achieve gas exchange across the PDMS membrane.Comparison with current R2R micromolding technology
Soft lithography, or micromolding, has recently been applied to R2R systems to simultaneously create numerous single PDMS devices with micron-scale features.4 This approach makes use of a heated mold on a roller to imprint and cure PDMS as it travels through the R2R system. Curing times are typically <1 min for each imprint. Compared to the presented system, these micromold R2R systems offer accurate and smooth micron-scale features. However, these micromold R2R systems are only well suited for the creation of many, identical, small surface area PDMS devices. That is, the pattern on the imprinting roll in these systems is fixed. Without being able to change the diameter of the imprinting roll (and with it the length of the pattern) or the positioning of the patterns on the imprinting roll, there is no way to ensure the patterns consistently line up layer-to-layer to manufacture a single, large area device. The rolled nature of the processed fluidics is primarily a space-efficient storage method.By contrast, the presented laser engraving based R2R method can create patterns that vary layer to layer and can be designed to match the current circumference of the output roll. This allows overlapping layers to align to each other, and by extension, the multi-layer fluidics to be accessed without unwrapping the processed output roll. These unique properties result in the first R2R method capable of manufacturing large area microfluidic devices.
The drawbacks of this laser based R2R process include: 1) relatively rough engraved patterns (compared to soft lithography/imprinting), 2) debris from laser engraving that is deposited on the PDMS surface, and 3) limitations in the engraved channel cross-sections (primarily triangular as opposed to rectangular). Solutions to drawbacks 1 and 2 are the focus of ongoing studies and drawback 3 might be fixed by actively changing laser power, focal depth, and spot size.
Impact of reduced blood channel count due to interference with housing
0.5 mm of channels was covered by overlap with the housing. This is estimated to reduce the number of available layers by 10, 5 of which are blood layers. This represents a significant portion of the layers in device B with 7 blood layers, or device C with 12 blood layers. However, this is expected to become increasingly negligible as the layer count reaches higher orders of magnitude. Further, because the device is manufactured using an automated system, adding 10 additional layers to compensate for this does not represent a significant effort.Study limitations
This is a proof-of-concept study, meant to demonstrate a system. Therefore, there were no attempts to make multiple devices of the same design to evaluate repeatability. Further, only one device reached blood testing. A more detailed characterization with multiple devices of each design would take place after achieving a device with far more layers that can achieve a clinically relevant rated blood flow (>100 mL min−1).Another limitation of this study is due to the combination of the small device size and the housing and caulking procedure. In particular, the caulking procedure required to seal the cores in the housing blocked a fixed number of layers, which represented a large portion of the active layers in devices A and B. Future larger devices with more channels and layers are expected to have less device-to-device variance, making them easier to characterize. This is because the effect of blocked channels will be amortized across a larger number of channels.
Insufficiency of laser engraving and cleaning
After each laser engraving step, there is significant debris on the PDMS surface, particularly at the sides of each channel. This is despite the use of an air assist and a custom exhaust fan. The use of Scotch Magic tape to remove debris from PDMS removes much, but not all this debris.While the plasma adhesion forms an extremely strong bond when there are no engravings, areas with gas or blood engravings had residual debris that decreased the bond strength resulting in a non-uniform and generally weak layer-to-layer bond. To compensate for this, the final PDMS capping layers (i.e. without engravings) were tensioned so that the tension from the PDMS assisted in preventing the active engraved layers from separating when the ends were cut. When these capping layers were not tensioned, the layers would separate with negligible force. A more thorough removal of debris on engraved layers would ensure a more effective plasma activation and increased layer-to-layer bond strength while reducing/eliminating the need for layer tensioning. Potential methods to remove debris generation include optimizing the laser power and air assist, air assist direction, changing the gas used for air assist to a more inert nitrogen, or adding removable sacrificial cover layer that would absorb the debris and keep the bonding surface clean.
A higher quality and more consistent laser is another upgrade to consider. This would reduce imperfections and fluctuations inside the channels, in addition to reducing the debris that must be removed. Removing imperfections inside the channels would also reduce areas of recirculation and thrombosis risk, and make the pressure drop across the channels more predictable.
Toward full automation
In the presented R2R system, only two processes require manual labor: 1) adjustment of the tensioning of the PETG carrier film and the PDMS film, and 2) the use of Scotch Magic tape to remove laser engraving debris from the PDMS surface.For 1), this intervention is only required during the base and covering layers, which is not expected to increase when scaling up to higher flow rates.
For 2), the manual removal of engraving debris would increase linearly when scaling up to larger surface area devices and would thus benefit from automation. It should be noted that this operation of removing debris is a relatively simple and risk-free process. During this research, there were no incidents of this process damaging a device. Therefore, although it prevents the machine from being left unattended during operation, it does not significantly add to the risk of failure from human error.
Toward larger area microfluidic devices
As this is the first iteration of the system and thus a proof of concept, the main goal of the work was to demonstrate an automated method to manufacture a multi-layer microfluidic device. This was achieved via the three prototype artificial lungs, culminating in device C with 25 total active microfluidic layers. As currently designed, the R2R manufacturing system is likely only capable of making microfluidic devices with a maximum of 100 layers. Firstly, at ∼100 layers, the diameter of the output roll would cause it to contact other components in the system including the plasma wands. Secondly, after approximately 100 layers, the engraved pattern for each layer would be larger than the surface area of the engraver table. Thus, to be able to create devices with more than 100 active layers, the system will need to be rebuilt and reprogrammed to both permit a larger output roll and to enable layers that are larger than the engraver table.More complex engraving patterns
During this proof-of-concept run, engravings were limited to straight lines in the X and Y direction for simplicity. However, these engraved lines do not take full advantage of the abilities of the laser engraver, which can theoretically engrave diagonal lines, lines of varying depth, lines which intersect, and even rasterize a surface, thereby permitting the creation of microfluidic devices with many design topologies. A study to evaluate the feasibility of these features would reveal the full capability of this method.Conclusions
This manuscript presents a new, semi-automated roll-to-roll manufacturing method aimed at, for the first time, manufacturing large area microfluidic devices. The custom, integrated R2R system simultaneously and synchronically unrolls a PDMS film, engraves gas and blood channels into it, then rerolls and bonds the PDMS film into a cylindrical output roll. The resulting output roll, or core, is sealed into a custom housing to route gas and blood flowpaths. Three proof of concept μAL devices were manufactured to demonstrate the successful operation of the system. The μALs were tested with water and blood to verify flow patency and gas exchange. The best performing device had 15 active layers, for a total length of 3.0 m of PDMS and a total engraved surface area of 450 cm2. This gave it a rated blood flow of 3.1 mL min−1.Data availability
Data for this article, including in vitro and confocal microscope data are available at: https://drive.google.com/open?id=13wg5tb5gbu4DEqQONmj-XRMLsHlC_4QP&usp=drive_fs.Author contributions
Conceptualization, A. Z., J. P.; hardware design assembly and programming, A. Z., J. W.; device design and analysis, A. Z., M. A.; testing methodology, A. Z., K. T., G. S., J. P.; testing, K. T., G. S., A. Z.; analysis, K. T., A. Z.; funding acquisition, J. P., A. Z.; project administration, J. P., A. Z.; writing, A. Z., J. P., K. T., G. S., M. A., J. W.;Conflicts of interest
There are no conflicts to declare.Acknowledgements
Thanks to Hannah Matich for conditioning the blood for the blood test, and Laura Brubacher for writing and proof-reading support. Additionally, thanks to the Lurie Nanofabrication Center for assisting in nano-scale measurements, and the Duderstadt Fabrication Center and GRM3D for 3D-printing support. This work was supported by the U.S. National Institutes of Health (NIH) NHLBI Grant R01HL144660 and NIH CTSA Grant T32 TR004371. The contents do not represent the views of the U.S. Government or the NIH.Notes and references
- M. Smolka, S. Ruttloff, D. Nees, C. Prietl, V. Satzinger, B. Lamprecht, P. Hütter, J. Hesse, G. Kokkinis, G. Kriechhammer, D. Scheidl and B. Wilfing, Proceedings, 2018, 2, 1054 Search PubMed.
- K. Raj M and S. Chakraborty, J. Appl. Polym. Sci., 2020, 137, 48958 CrossRef CAS.
- Y. Xia and G. M. Whitesides, Angew. Chem., Int. Ed., 1998, 37, 550–575 CrossRef CAS PubMed.
- N. Bhattacharjee, A. Urrios, S. Kang and A. Folch, Lab Chip, 2016, 16, 1720–1742 RSC.
- K. Jain, M. Klosner, M. Zemel and S. Raghunandan, Proc. IEEE, 2005, 93, 1500–1510 CAS.
- R. Liedert, L. K. Amundsen, A. Hokkanen, M. Mäki, A. Aittakorpi, M. Pakanen, J. R. Scherer, R. A. Mathies, M. Kurkinen, S. Uusitalo, L. Hakalahti, T. K. Nevanen, H. Siitari and H. Söderlund, Lab Chip, 2011, 12, 333–339 RSC.
- R. Søndergaard, M. Hösel, D. Angmo, T. T. Larsen-Olsen and F. C. Krebs, Mater. Today, 2012, 15, 36–49 CrossRef.
- R. R. Søndergaard, M. Hösel and F. C. Krebs, J. Polym. Sci., Part B: Polym. Phys., 2013, 51, 16–34 CrossRef.
- J. Hiltunen, C. Liedert, M. Hiltunen, O.-H. Huttunen, J. Hiitola-Keinänen, S. Aikio, M. Harjanne, M. Kurkinen, L. Hakalahti and L. P. Lee, Lab Chip, 2018, 18, 1552–1559 RSC.
- A. L. Vig, T. Mäkelä, P. Majander, V. Lambertini, J. Ahopelto and A. Kristensen, J. Micromech. Microeng., 2011, 21, 035006 CrossRef.
- J. A. Potkay, Lab Chip, 2014, 14, 4122–4138 RSC.
- A. A. Gimbel, E. Flores, A. Koo, G. García-Cardeña and J. T. Borenstein, Lab Chip, 2016, 16, 3227–3234 RSC.
- D. M. Hoganson, H. I. P. Ii, E. K. Bassett, I. D. Spool and J. P. Vacanti, Lab Chip, 2011, 11, 700–707 RSC.
- B. C. Isenberg, E. M. Vedula, J. Santos, D. J. Lewis, T. R. Roberts, G. Harea, D. Sutherland, B. Landis, S. Blumenstiel, J. Urban, D. Lang, B. Teece, W. Lai, R. Keating, D. Chiang, A. I. Batchinsky and J. T. Borenstein, Adv. Sci., 2023, 10, e2207455 CrossRef PubMed.
- T. Kniazeva, A. A. Epshteyn, J. C. Hsiao, E. S. Kim, V. B. Kolachalama, J. L. Charest and J. T. Borenstein, Lab Chip, 2012, 12, 1686–1695 RSC.
- T. Kniazeva, J. C. Hsiao, J. L. Charest and J. T. Borenstein, Biomed. Microdevices, 2011, 13, 315–323 CrossRef CAS PubMed.
- K. M. Kovach, M. A. LaBarbera, M. C. Moyer, B. L. Cmolik, E. van Lunteren, A. S. Gupta, J. R. Capadona and J. A. Potkay, Lab Chip, 2015, 15, 1366–1375 RSC.
- J. A. Potkay, M. Magnetta, A. Vinson and B. Cmolik, Lab Chip, 2011, 11, 2901–2909 RSC.
- J. A. Santos, A. A. Gimbel, A. Peppas, J. G. Truslow, D. A. Lang, S. Sukavaneshvar, D. Solt, T. J. Mulhern, A. Markoski, E. S. Kim, J. C.-M. Hsiao, D. J. Lewis, D. I. Harjes, C. DiBiasio, J. L. Charest and J. T. Borenstein, Lab Chip, 2021, 21, 4637–4651 RSC.
- E. M. Vedula, B. C. Isenberg, J. Santos, W. Lai, D. J. Lewis, D. Sutherland, T. R. Roberts, G. T. Harea, C. Wells, B. Teece, J. Urban, T. Risoleo, D. Solt, S. Leazer, K. Chung, S. Sukavaneshvar, A. I. Batchinsky and J. T. Borenstein, ASAIO J., 2022, 68, 1312 CrossRef PubMed.
- M. Dabaghi, G. Fusch, N. Saraei, N. Rochow, J. L. Brash, C. Fusch and P. Ravi Selvaganapathy, Biomicrofluidics, 2018, 12, 044101 CrossRef PubMed.
- A. A. Gimbel, J. C. Hsiao, E. S. Kim, D. J. Lewis, T. F. Risoleo, J. N. Urban and J. T. Borenstein, Artif. Organs, 2021, 45, E247–E264 CrossRef CAS PubMed.
- H. Matharoo, M. Dabaghi, N. Rochow, G. Fusch, N. Saraei, M. Tauhiduzzaman, S. Veldhuis, J. Brash, C. Fusch and P. R. Selvaganapathy, Biomicrofluidics, 2018, 12, 014107 CrossRef PubMed.
- T. Rieper, C. Müller and H. Reinecke, Biomed. Microdevices, 2015, 17, 86 CrossRef PubMed.
- N. Rochow, A. Manan, W.-I. Wu, G. Fusch, S. Monkman, J. Leung, E. Chan, D. Nagpal, D. Predescu, J. Brash, P. R. Selvaganapathy and C. Fusch, Artif. Organs, 2014, 38, 856–866 CrossRef CAS PubMed.
- C. M. Leung, P. de Haan, K. Ronaldson-Bouchard, G.-A. Kim, J. Ko, H. S. Rho, Z. Chen, P. Habibovic, N. L. Jeon, S. Takayama, M. L. Shuler, G. Vunjak-Novakovic, O. Frey, E. Verpoorte and Y.-C. Toh, Nat. Rev. Methods Primers, 2022, 2, 1–29 CrossRef.
- M. Yang, N. Sun, Y. Luo, X. Lai, P. Li and Z. Zhang, Biomicrofluidics, 2022, 16, 031503 CrossRef CAS PubMed.
- A. J. Thompson, L. H. Marks, M. J. Goudie, A. Rojas-Pena, H. Handa and J. A. Potkay, Biomicrofluidics, 2017, 11, 024113 CrossRef CAS PubMed.
- K. Tharwani, G. K. Seilo, J. Wang, A. Zhang and J. A. Potkay, A System for Measuring pH in Water as a Qualitative Analog of Blood Testing of Microfluidic Artificial Lungs, Int. J. Eng. Technol., 2024 Search PubMed , accepted.
- K. M. Kovach, J. R. Capadona, A. S. Gupta and J. A. Potkay, J. Biomed. Mater. Res., Part A, 2014, 102, 4195–4205 Search PubMed.
- Cardiopulmonary Bypass Oxygenators 510(k) Submissions - Final Guidance for Industry and FDA Staff, 2021 Search PubMed.
Footnotes |
| † Electronic supplementary information (ESI) available. See DOI: https://doi.org/10.1039/d4lc00339j |
| ‡ Due to the inconsistency in water solutes, the pH values vary greatly from run to run which prevents quantitative analysis. Pre and post calibration, as well as a 24 h period in which ambient air is used to remove CO2 were part of an unsuccessful attempt to address this issue, hence the difference in testing methodology between the three devices. |
| § Channel resistance is inversely proportional to the third power of the hydraulic radius, and additive along its length. The result is that even a short section with smaller channel can significantly increase the resistance, to the point where it would render the resistance from remaining sections negligible. Alternatively phrased, a channel with varying channel size would have a significantly higher resistance than another channel with homogenous dimensions, even if they had the same average hydraulic radius. |
| ¶ The possibility was considered that the channels remained dilated after experiencing higher pressures. Pressure drop testing for device B with water and then blood suggests this is not occurring. While blood should have a proportionally higher resistance than water due to its viscosity, if the channels remained diluted from the water test, then this proportion would be smaller for lower flows and greater for higher flows. However, the opposite was the case. |
| This journal is © The Royal Society of Chemistry 2024 |