
 Open Access Article
 This Open Access Article is licensed under a
 Creative Commons Attribution 3.0 Unported Licence
Optoelectronic microfluidic device for point-of-care blood plasma viscosity measurement
Somayyeh
Bakhtiaridoost
 a,
Cristian
Musuroi
b,
Marius
Volmer
*b and
Monica
Florescu
*a
a,
Cristian
Musuroi
b,
Marius
Volmer
*b and
Monica
Florescu
*a
aDepartment of Fundamental, Prophylactic and Clinical Disciplines, Faculty of Medicine, Transilvania University of Brasov, Brasov, Romania. E-mail: florescum@unitbv.ro
bDepartment of Electrical Engineering and Applied Physics, Transilvania University of Brasov, Brasov, Romania. E-mail: volmerm@unitbv.ro
First published on 13th June 2024
Abstract
Physical properties of blood plasma, such as viscosity, serve as crucial indicators of disease. The inherent capillary effect of paper microchannels, coupled with minimal sample requirement, stimulated the advancement of paper-based viscometers. This study presents a precise, non-contact optoelectronic system using a microfluidic platform for the measurement of blood plasma viscosity. Microchannels were defined onto the filter paper using an available and inexpensive wax crayon, without the need for conventional wax printing equipment. The time required for the 5 μL sample to pass a specific distance was measured using two pairs of infrared sensors. Subsequently, this data was sent to the microcontroller, which automatically calculated the viscosity. Throughout the measurements, sample temperature was maintained at a constant 37 °C through an integrated heater with automated control. The microfluidic platform successfully processed real samples, yielding viscosity measurements in under three minutes. Evaluation with fetal bovine serum, spiked with varying protein concentrations in both native and denatured states, demonstrated a precision exceeding 96% compared to conventional Ostwald viscometer readings. For human subjects exhibiting pathologies affecting serum and plasma viscosity compared to physiological norms, strong correlations were observed between resultant values and clinical diagnoses. The proposed device aims to replace expensive and complex optical equipment, offering a safer alternative for measuring plasma viscosity. Unlike similar devices, it eliminates the risk of component deformation due to chemical contact or unsafe irradiation.
1. Introduction
Plasma is the liquid component of human blood. It represents 55% of the blood volume and contains important components such as antibodies, clotting factors, and proteins.1 In addition to concentration, the shape, weight and molecular structure of the proteins and protein–protein interactions have a direct effect on plasma viscosity.2 Changes in plasma viscosity level have high sensitivity and low specificity. It can change for several reasons, including inflammation, infection, and paraprotein-producing diseases such as cancer.3 Diseases such as lupus, inflammatory bowel disease (IBD) and rheumatoid arthritis can be monitored by studying the viscosity of plasma. It also helps doctors to assess the effectiveness of treatment for infectious and inflammatory diseases. Plasma viscosity is often measured in people suspected of having hyperviscosity, myeloma and macroglobulinemia.4Clinically, the acute phase response assesses the presence, intensity or extent of inflammation or infection. Plasma viscosity, erythrocyte sedimentation rate (ESR) and C-reactive protein (CRP) are the indicators used to study the acute phase response.
Unlike the ESR, plasma viscosity is influenced by fewer variables such as hematocrit and erythrocyte size, leading to fewer false-normal results and greater consistency with clinical conditions, especially in detecting early changes. The superior sensitivity and reliability of plasma viscometry have established it as the preferred method over the ESR test.5 Although CRP measurement serves as a valuable early marker of bacterial infection, it rises earlier and has a shorter lifespan compared to plasma viscosity. However, the CRP test is more expensive, necessitates sequential recording of values, and may experience delays in results due to batch processing.6,7
The viscosity of a liquid, according to the science of rheology, refers to its resistance to flow. Thus, determining viscosity involves measuring the force required for the liquid to flow at a specified rate. Capillary tube viscometers are simple instruments capable of accurately measuring the viscosity of Newtonian fluids, which is strongly temperature dependent and decreases with increasing temperature.8 Therefore, keeping the temperature constant during the viscometry process is a critical parameter. The required sample volume, instrument cleaning, ease of use and accuracy are other important parameters to consider for clinical viscometers.9 Unlike whole blood, plasma behaves as a Newtonian fluid, meaning its viscosity remains independent of the shear rate. The normal range of human blood plasma viscosity is reported to be between 1.10 to 1.30 mPa s at a temperature of 37 °C.3
Commercially available viscometers require a few millilitres of sample volume and a trained operator. The large footprint, high price, and periodic calibration are some of the difficulties in using of these instruments.10,11 Lab-on-a-chip (LOC) technology, a promising tool for integrating fluid analysis on a single chip, has been considered as an alternative to conventional laboratory instruments. Over the last few decades, much effort has been put into developing this technology to perform point-of-care (POC) tests close to the patient, without the need for a trained operator.12 The microfluidic platform used in LOC technology enables the integrated analysis of a minimal volume of fluid on a low-cost chip with dimensions ranging from a few millimetres to several centimetres. High accuracy and sensitivity, high speed and reduced human intervention are some of the benefits offered by LOC.13
Viscosity measurement has been increasingly integrated with lab-on-a-chip (LOC) technology, with various devices emerging that utilize novel mechanisms, often mimicking conventional viscometers. A falling ball viscometer has been implemented in a microfluidic platform using a photo-interrupter by Kim et al.14 More recently, acoustic techniques have attracted the attention of researchers.15,16 Electromechanical17 and optical18,19 methods are other mechanisms that have been used to measure the fluid viscosity. The complexity of fabrication, instrument adjustment and the need to use external pumps and expensive transducers are some of the drawbacks of these studies. Micro paper-based analytical devices (μPADs) are being developed to overcome some of the difficulties of conventional polymer microchips. The substrate of μPADs, which consists of inexpensive and widely accessible chromatographic filter paper, presents an opportunity for the affordable production of disposable microchips, particularly for applications in biological analysis. The primary advantage of these devices lies in the paper's capillary action, obviating the requirement for an external pump. Paper viscometers function by timing the liquid's travel over a specified distance.20,21 Rayaprolu et al. employed μPADs to investigate the viscosity of biological solutions, using a mathematical model similar to the Ostwald viscometer and conducting manual measurements.22 Puneeth et al. integrated electrodes using a silver pen to automate time measurement by the microcontroller.23,24 The main drawbacks of these works were the time-consuming preparation of the microchannel and the tedious process of connecting the electrode to the microcontroller for each viscometry. In another study, an image processing technique was used to measure time in a paper microfluidic viscometer.25 A microprocessor and on-board camera were used to detect the velocity of the fluid. In addition to the required equipment, the sequential capture to monitor the flow was the complexity of this work. Kang et al. used the colorimetric approach for blood plasma viscometry.26 The need for a camera and the complex process of image processing could be one of the disadvantages of this work. In addition, the contact of a biological fluid such as plasma with a reagent used in the colorimetric process makes it virtually impossible to use plasma in downstream processes where it can be integrated on a single chip.
Here we present a cost-effective, disposable, pocket-sized μPAD for use in blood plasma viscometry. In the proposed system, the time taken for the plasma to travel a certain distance was measured using a non-contact optical method, and the plasma viscosity was automatically calculated by the microcontroller. The optical setup used for time measurement consisted of two pairs of infrared sensors that do not affect the plasma in the selected wavelength range. The plasma viscometry process was performed without any contact or alteration of the plasma sample, facilitating further investigation for integrated diagnosis in subsequent analyses. This is the first time that the ability to change the amount of infrared radiation passing through the paper substrate due to the passage of liquid has been used for automatic time measurement in the paper viscometer. This study overcomes the limitations of previous research, including issues with electrode connection to the microcontroller, data acquisition and image processing, complexity and cost of the required tools, and plasma contact with reactive materials. To ensure accurate measurements reflective of real physiological conditions, an integrated heater maintained a constant temperature of 37 °C. The paper microchannel was crafted using inexpensive and easily accessible wax crayons, eliminating the need for sophisticated conventional mechanisms and equipment. The device presented is a non-contact, fast and accurate viscometer designed for blood plasma viscometry from a small sample volume without any manipulation and alteration. This low-cost device facilitates downstream plasma protein analysis for potential applications in point-of-care diagnostics.
2. Materials and methods
2.1 Equipment
The device comprised a 15 × 2 × 0.15 mm paper microchannel positioned between two pairs of photodiodes and infrared radiation (IR) emitters placed at points A and B, with a separation of 10 mm from each other (Fig. 1). When the paper microchannel obstructed the IR from reaching the photodiode, the output voltage of the reverse-biased photodiode was set to the highest level. Subsequently, as the blood plasma flowed through the microchannel, the photodiode's output voltage decreased due to the increased IR transmission through wet paper compared to dry paper. The voltage drop was detected by the microcontroller, which triggers the timer to measure the passage time of the plasma from point A to point B. The plasma viscosity was calculated using the Lucas–Washburn equation. | ||
| Fig. 1 Fabricated μPAD. (a) Schematic diagram of the device for measuring the viscosity of blood plasma. (b) Manufactured viscometer in different views. | ||
As temperature plays an important role in viscosity variation, an integrated printed heater with a constant controlled temperature was used to heat the plasma to 37 °C, like human body temperature. The measurement of blood plasma viscosity without any manipulation or contact with chemicals offers the possibility for downstream studies that can be integrated with paper microchannels. To our knowledge, this study represents the first use of IR sensors in relation to the change in filter paper transparency due to wetting for viscometry purposes. Due to the μPAD capillary effect, the device proposed in this study does not require an external pump to move the plasma within the channel. The use of inexpensive and readily available tools such as filter paper and infrared sensors has made this device easy to manufacture and affordable. One of the advantages of this device is its ability to easily replace the paper microchannel for each test without requiring additional tasks such as electrode connection.
2.2 Theoretical background
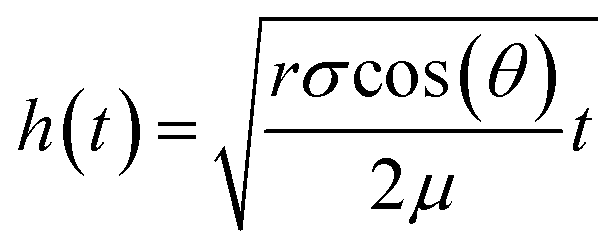
The dynamics of capillary flow within the microchannels have been extensively studied for viscometry applications.27,28 In the case of porous substrates, the Lucas–Washburn equation is widely used. A good agreement in the answers was observed in the conditions where the basic assumptions of the equation were respected.29 The Lucas–Washburn equation assumes that a Newtonian fluid is moving in one direction in a tube of constant width. One side of the tube must be completely wet, and the other side must be completely dry.30Using this equation, the relationship between time and liquid imbibition length in the horizontal tube is eqn (1):29
 | (1) |
 | (2) |
 | (3) |
| μp = α·tp | (4) |
2.3 IR sensors
Two 3 mm silicon PIN photodiodes (PD204-6B/L3, Taiwan) and two IR emitting LEDs were used to detect the passage of liquid through the paper microchannel. The UV-vis spectrophotometer was employed to analyse the absorption spectra of fetal bovine serum diluted with PBS, aiding in the selection of suitable wavelengths for illumination (Fig. 2). A range of 850 to 1000 nm was selected for the IR sensors, with a peak sensitivity of 940 nm. In this selected range, no absorbance peak was observed, indicating that exposure of the serum to radiation did not induce any change in its constituents. Also, due to the lack of plasma absorption in this wavelength range, the sensitivity of the proposed device has not been affected by changes in sample constituents. | ||
| Fig. 2 Absorption spectra of fetal bovine serum diluted in 20-, 10-, 5- and 0-fold in the wavelength range from 350 nm to 1000 nm. | ||
2.4 Heater
A symmetrical, planar heater was printed with silver ink on the 40 × 60 mm fiber glass substrate (FR4 board) using a PCB printer (Voltera V-One, Canada) to maintain the plasma sample at a constant temperature of 37 °C. The heater design, which included lines 0.5 mm wide and 0.5 mm apart, was drawn in CorelDraw (2020) software. Two 3 mm diameter holes, 10 mm apart, were drilled in the center of the heater to accommodate the photodiodes (Fig. 3-a). The silver ink (Voltera Conductor 3 Ink) was injected through the 230 μm diameter nozzle attached to the printing head. The printed heater was cured on a hot plate at 90 °C for 5 minutes and 120 °C for 20 minutes to remove the solvent and obtain the best electrical conductivity. The thickness of the lines was set at 80 μm and the electrical resistance of the printed heater was measured to be around 6 ohms. The insulator spray (DUE-CI, V-66) was used to protect the silver lines from any moisture leakage. As the final step in the heater's fabrication, the LM335 (TO92) temperature sensor was fixed next to the paper microchannel using thermal paste (TTG-S104, TITAN) for temperature measurement. | ||
| Fig. 3 Heater fabrication. (a) The printed heater on the fiberglass board. (b) The printed heater operating profile with a maximum passing current of 400 mA. | ||
2.5 Electronics
The available and easy-to-use Arduino UNO R3 board was used as the control and computing section. The program was written in the Arduino environment (IDE) and uploaded via USB connection. The IR photodiodes and LM335 output voltages were read through the analogue input pins. All the read voltages were checked and adjusted using a Keithley multimeter. The heater temperature was controlled by the pulse width modulation (PWM) technique using a standard NPN switching transistor (2N2222A, 800 mA). The 5 V input power was reduced to 3 V by a LM2596 robust voltage regulator to power the heater. The maximum electrical current through the heater was measured to be 400 mA, which is below the tolerable current for the switching transistor. Fig. 4 shows the block diagram of the electronic part. | ||
| Fig. 4 Block diagram of the electronic sections. | ||
To integrate the electronic section and the paper microchannel, a perfboard was placed vertically next to the fiberglass substrate containing the printed heater and the paper microchannel. The IR emitters and photodiodes were placed on the top and bottom of the fiberglass substrate, respectively, and connected to the power supply and other electronic components through the perfboard (Fig. 1-b).
2.6 Microchannel drawing
Sartorius 391 filter paper with a particle retention of 2–3 μm was used to implement the microchannels with the wax crayons. Regular wax crayons were acquired from a local shop. A set-up was established to apply uniform pressure on the wax crayon while drawing the hydrophobic lines (microchannel walls). A weight of 520 g was fixed on the wax crayon with a diameter of 7 mm to produce a constant pressure of 132.574 kPa. The crayon remained stationary and the filter paper, mounted on a glass substrate, was moved at a uniform speed according to the microchannel design. Subsequently, the drawn microchannel was then heated on a hot plate to facilitate the formation of the hydrophobic barriers through wax diffusion. Throughout experimentation, challenges arose, thus at higher pressures, excessive wax on the paper led to problematic wax oil spread, while at lower pressures, insufficient wax resulted in poorly formed hydrophobic walls. Despite these initial hurdles, optimal drawing conditions were eventually determined through repeated trials.2.7 Sample preparation
Fetal bovine serum (FBS) (sterile-filtered, F7524) was purchased from Sigma Aldrich. It was diluted at different dilution factors with phosphate buffer saline (PBS) (10 mM, pH: 7.4). Fetal bovine serum was stored at −22 °C and a portion was thawed for each use and discarded after use.Bovine serum albumin (BSA) (A7906-10G, US) purchased from Sigma-Aldrich Company and sorted in a 2 °C refrigerator was used to increase the viscosity of the serum samples. A given weight of BSA was added to a given volume of FBS to obtain concentration of 5 mg ml−1, 10 mg ml−1 and 15 mg ml−1 and discarded after measurements.
Human serum and blood plasma were provided by the Analytical Laboratory of the Emergency County Clinical Hospital (SCJU), Braşov, Romania. Notification with number 44/11.03.2024 was granted by the Ethics Committee for Clinical Studies of Braşov County Emergency Clinical Hospital. All experiments were performed in accordance with the rules of good practice, Romanian and European Union legislation, and data confidentiality was respected. Standard laboratory centrifugation methods were used to prepare the samples. Tubes with citrate anticoagulant (0/109 M (i.e. 3.2%) trisodium citrate) and tubes without anticoagulant, clot activator and separating gel were used for plasma and serum preparation, respectively.
3. Results and discussion
3.1 Temperature control
Prior to assembly, the temperature sensor output was calibrated in a stable temperature bath with an electronic thermometer as a reference. The temperature of the printed heater was controlled to remain constant at approximately 37 °C by the program written for the PWM output. The time constant of the heater was calculated to be 33.56 seconds using the curve fitting method. As the results show (Fig. 3-b), after about 160 seconds the heater temperature reached 37 °C and varied in the range of 36.65 °C to 37.1 °C, which could be considered as 37 °C.The distance of the starting point of the measurement (point A) from the beginning of the microchannel was chosen so that the 25 °C sample loaded into the source reached a temperature of 37 °C when passing through point A. The temperature profile of the heater was designed to ensure that it did not exceed the melting point of the wax, which is approximately 50 °C. This precaution was taken to prevent the remelting of the hydrophobic wax and altering the width of the microchannel.
3.2 Paper microchannel optimization
The conical shape of the microchannel source was selected for its ability to minimize sample volume waste and ensure proper orientation of the sample towards the main channel (Fig. 1-a). The uniform width along the main channel was strongly dependent on the temperature and duration of the wax curing stage. To optimize the curing process, different time durations and temperatures were investigated (Fig. 5-a). Following fabrication, 5 μL of distilled water was introduced into the microchannel to observe its behaviour and characteristics. Subsequently, the microchannel was photographed to assess the changes in channel width resulting from the spread of the heated wax oil in comparison to the original width. Accurate measurements were taken using graphical software. During the curing time of less than 15 seconds, the hydrophobic walls of the microchannel did not form adequately, leading to leakage at certain points. At temperatures of 100 °C and 80 °C, with curing times exceeding than 25 and 35 seconds, respectively, the microchannel became completely obstructed due to wax spreading. However, at a temperature of 60 °C, the probability of channel formation was calculated to be 60% for curing times of 15, 25 and 35 seconds, while it increased to 80% for curing times of 45 and 55 seconds, based on up to 10 trials. As a result, a reproducible 2 mm wide microchannel was produced at a temperature of 80 °C with a curing time of 15 s (Fig. 5-b). | ||
| Fig. 5 Microchannel formation. (a) Channel width variations after the curing process at temperatures of 60 °C, 80 °C and 100 °C and time durations of 15 s to 55 s. Data points are the mean of 10 trials and the error bars represent the standard deviation. (b) The fabricated microchannel and its dimensions. | ||
3.3 Viscosity measurement using μPAD
To prevent sample leakage resulting from contact with the substrate, four pieces of 500 μm copper foil were used as spacers. The temperature sensor was placed on one of these spacers, mounted on a piece of paper, to ensure it remained at the same distance from the heater as the microchannel. The positions of the infrared emitters were adjusted to avoid contact with the paper microchannel, while maximizing visibility for the photodiodes. Finally, the paper microchannel was loaded onto the device in such manner that its borders rested on the spacers, with the starting point (point A) 2 mm away from the beginning of the channel.The Ostwald viscometer (Cannon Instrument, Size: 0C) was used as the reference viscometer. The kinematic viscosity of distilled water at different temperatures was measured with the Ostwald viscometer and compared to the reference values31 using the curve-fitting algorithm.
The microcontroller program used eqn (4) to calculate the sample viscosity. Contact angle measurements were achieved using a graphics editor software, analysing images taken by a fixed horizontal camera at 20× magnification (Bresser USB microscope, Germany). Six trials yielded contact angles of 18.87° ± 0.1617° for distilled water and 35.17° ± 0.2059° for FBS. The surface tension of FBS, determined via stalagmometry across 6 trials, was found to be 63.0841 mN m−1 ± 0.2604 mN m−1, considering the distilled water's surface tension at 70.01 mN m−1 (ref. 32) used as a reference. All measurements were done at a temperature of 37 °C.
To obtain the time needed for the reference liquid to travel the specified distance between the two pairs of IR sensors, 5 μL of room temperature distilled water was dropped onto the source of the paper microchannel, which was maintained at 37 °C. The measurement was performed on 6 microchannels, with each trial repeated 6 times (Fig. 6). The average value obtained from the measurements was incorporated into the microcontroller program as the time required for distilled water, with a viscosity of 0.6913 mPa s, to traverse the specified distance at 37 °C.
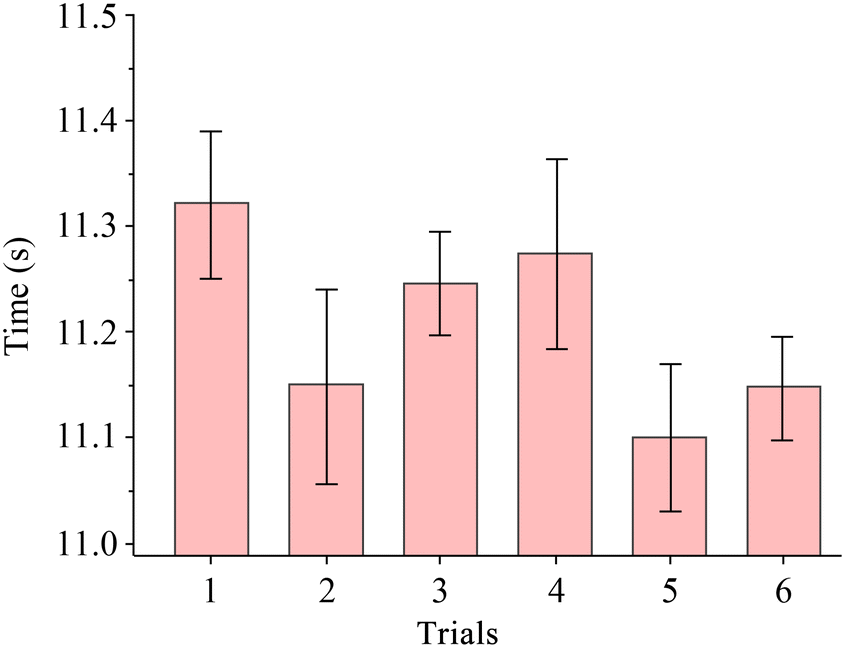 | ||
| Fig. 6 The time taken for distilled water to travel the distance between two pairs of infrared sensors through a paper microchannel. Error bars represent the standard deviation from the mean of 6 measurements. | ||
Fetal bovine serum diluted 0-, 5- and 10-fold within PBS was examined using both the Ostwald viscometer and our device. Ostwald viscometer measurements were conducted at a constant temperature bath set to 37 °C, with each sample allowed approximately 20 minutes to equilibrate to the bath temperature. For measurements with the μPAD, the paper microchannel was loaded, and the heater was activated, taking around 2 minutes to stabilize the temperature at 37 °C. The measurements were repeated 7 times for each sample, resulting in average viscosity values of 0.95 mPa s, 0.704 mPa s and 0.69 mPa s for 0, 5 and 10 times diluted FBS.
Further, we added bovine serum albumin (BSA) to FBS to increase its viscosity, and subsequently, we replicated the experiments. The viscosity of FBS supplemented with 5 mg ml−1, 10 mg ml−1 and 15 mg ml−1 of BSA was determined to be 1.193 mPa s, 1.35 mPa s and 1.52 mPa s respectively. To further increase the viscosity, we heated the FBS supplemented with 10 mg ml−1 and 15 mg ml−1 BSA at 80 °C using a constant temperature bath for 30 minutes to induce the denaturation of the proteins. After denaturation, the samples were cooled to 37 °C and the viscosity was assessed. Using the fabricated μPAD, the viscosity measurements post-denaturation yielded values of 2.795 mPa s and 3.09 mPa s for FBS supplemented with 10 mg ml−1 and 15 mg ml−1 of BSA, respectively.
Contact angle and surface tension were measured for all samples; however, changes in these parameters were insignificant and had no impact on the calculated viscosity. The results are given in Table 1.
| Sample | Status | Ostwald (mPa s) | Ostwald SD (mPa s) | μPAD (mPa s) | μPAD SD (mPa s) | Error (%) | Average time (s) |
|---|---|---|---|---|---|---|---|
| FBS (0-fold diluted) | Normal | 0.980 | 0.007 | 0.950 | 0.049 | ±3.06 | 20.85 ± 1.07 |
| FBS (5-fold diluted) | Normal | 0.731 | 0.003 | 0.704 | 0.032 | ±3.69 | 15.47 ± 0.7 |
| FBS (10-fold diluted) | Normal | 0.680 | 0.004 | 0.690 | 0.025 | ±1.47 | 15.14 ± 0.55 |
| FBS + BSA (5 mg ml−1) | Normal | 1.220 | 0.009 | 1.1930 | 0.058 | ±2.21 | 26.22 ± 1.26 |
| FBS + BSA (10 mg ml−1) | Normal | 1.390 | 0.005 | 1.350 | 0.076 | ± 2.87 | 29.64 ± 1.67 |
| FBS + BSA (10 mg ml−1) | Denatured | 2.778 | 0.008 | 2.795 | 0.023 | ± 0.61 | 61.43 ± 0.5 |
| FBS + BSA (15 mg ml−1) | Normal | 1.470 | 0.006 | 1.520 | 0.081 | ± 3.40 | 33.53 ± 1.76 |
| FBS + BSA (15 mg ml−1) | Denatured | 3.010 | 0.007 | 3.090 | 0.014 | ± 2.66 | 67.99 ± 0.3 |
Following the calibration of the instrument using FBS and determination of the α constant in eqn (4), the instrument's performance was validated with human samples. Five liquid samples obtained from volunteer blood donors were analysed for this purpose. These samples were chosen based on their representation of healthy conditions: sample S1 and S2: from a healthy subject, clinically characterized by a physiological level of viscosity. Sample S3: from a subject clinically characterized by elevated viscosity, attributed to high fibrinogen concentration in plasma. Sample S4: from a subject with inflammation syndrome. Sample S5: from a subject with Waldenstrom macroglobulinemia. The results obtained by measuring the viscosity of the samples with the μPAD showed an acceptable agreement with the clinical characterization of mentioned diseases (Table 2) and compared to ref. 33 and 34. The measurements were repeated 6 times for each sample. The averages were taken as the measured value. Only significant differences in the viscosity value of the different samples according to the disease were taken into account for the results and, as with other commercially available laboratory instruments, further testing is required to determine the reference range of this instrument.
| Sample | Health status | Plasma viscosity (mPa s) | Serum viscosity (mPa s) | SD (mPa s) | Average time (s) |
|---|---|---|---|---|---|
| S1 | Normal | 1.26 | — | 0.038 | 27.73 ± 0.85 |
| S2 | Normal | — | 1.16 | 0.074 | 25.42 ± 1.63 |
| S3 | High fibrinogen | 1.95 | — | 0.110 | 42.9 ± 2.3 |
| S4 | Inflammation | — | 1.62 | 0. 091 | 35.06 ± 2 |
| S5 | Waldenstrom | 2.96 | — | 0. 160 | 65.23 ± 3.5 |
This viscometer is specialized to measure the viscosity of blood plasma in the range of 0.5 mPa s to 5 mPa s. The device consists of the main body and the disposable microchannel. The cost of the main body is around US$ 8, which can be reduced by replacing the Arduino board with a single programmed microcontroller. The cost of each test is estimated to be less than US$ 0.01. Development time was about two hours for the main body and about five minutes for each microchannel, which can be reduced in mass production.
This device can be developed and used without the need for complex and expensive equipment. By eliminating the need for preparation steps such as electrode deposition and connection to the electronic circuit board, disposable paper microchannels can be changed and used quickly and easily. The sample volume required by this viscometer is approximately 5 μL, which can be obtained from a few drops of blood using the least invasive finger-prick technique. Due to the non-contact and unchanged plasma viscometry, this viscometer is a suitable option for the development of biochips to investigate the causes of hyper-viscosity by studying the constituents of the sample in the integrated downstream sections.
Conclusions
An abnormal increase (hyper-viscosity) or decrease (hypo-viscosity) of blood plasma can serve as an indication of various health disorders. Plasma viscosity is an important biomarker for both diagnosis and treatment. We discussed the challenges associated with plasma viscometry using commercially available viscometers as well as LOC-based systems. We introduced a highly accurate, fully automated, non-contact viscometer that leaves the sample intact for downstream analysis. The device consisted of a readily available and easily fabricated paper microchannel drawn on filter paper with a wax crayon. The process of fabricating and utilizing disposable paper microchannels for each test was very simple and fast, eliminating the need to use complex and expensive equipment or time-consuming processes such as electrode deposition and connection to the microcontroller. Two pairs of infrared sensors were employed to detect the passage of the sample by the change in the rays passing through the filter paper. The wavelength of the optical component was select to ensure that the radiation did not affect the sample structure. Additionally, the fabricated device operated at a constant temperature of 37 °C, produced by an integrated heater, thereby enhancing the accuracy and validity of the results. A microcontroller was used for calculations related to viscometry and temperature control. The study investigated the viscosity of different concentrations of fetal bovine serum, as well as fetal bovine serum supplemented with albumin protein in both its native and denatured forms. All results obtained were compared with those from an Ostwald viscometer, with the instrument error measured to be ±4%. Subsequently, human plasma and serum samples with different viscosities caused by different diseases were examined. The results obtained showed a significant difference between the samples according to the mentioned diseases. The required sample volume of the device was 5 μL and the entire process of viscometry was completed in less than three minutes. The viscometry process was carried out without the need for expensive, bulky and complex optical detection equipment used in similar articles.In this article, we introduced an accurate, compact, cost-effective viscometer with fast and convenient manufacturing steps, enabling easy integration with downstream components for determining the level of sample constituents through a contactless procedure. The rapid and affordable manufacturing process makes it suitable for deployment in research centers worldwide without the need for complex laboratory equipment.
Author contributions
Somayyeh Bakhtiaridoost: conceptualization, methodology, software, validation, visualization, and writing – original draft. Monica Florescu: methodology, validation, writing – review & editing, visualization, and supervision. Marius Volmer: methodology, validation, writing – review & editing, visualization, and supervision. Cristian Musuroi: heater printing and assembling process.Conflicts of interest
The authors declare no competing interest.Acknowledgements
This research was conducted under the fellowship program of Transilvania University of Brasov. The authors are thankful to Dr. Anca Ilea, affiliated with the Brasov County Clinical Hospital, for her assistance with medical sample preparation. Additionally, the authors thank Dr. Melinda David at Transilvania University of Brasov for her help with chemical preparation.References
- J. Mathew, P. Sankar and M. Varacallo, Physiology, Blood Plasma, StatPearls, Treasure Island, FL, 2023, Updated 2023 Apr 24, available: 29/09/2023 https://www.ncbi.nlm.nih.gov/books/NBK531504 Search PubMed.
- T. Somer, 4 Rheology of paraproteinaemias and the plasma hyperviscosity syndrome, Baillieres Clin. Haematol., 1987, 1(3), 695–723, DOI:10.1016/S0950-3536(87)80021-5.
- G. Késmárky, P. Kenyeres, M. Rábai and K. Tóth, Plasma viscosity: A forgotten variable, in Clinical Hemorheology and Microcirculation, 2008, pp. 243–246, DOI:10.3233/CH-2008-1088.
- A. Osei-Bimpong and J. Burthem, Supplementary Techniques Including Blood Parasite Diagnosis, in Dacie and Lewis Practical Haematology, Elsevier, 11th edn, 2017, pp. 93–111, DOI:10.1016/B978-0-7020-6696-2.00006-0.
- R. M. Hutchinson and R. D. Eastham, A comparison of the erythrocyte sedimentation rate and plasma viscosity in detecting changes in plasma proteins, J. Clin. Pathol., 1977, 30, 345–349, DOI:10.1136/jcp.30.4.345.
- M. Largman-Chalamish, et al., Differentiating between bacterial and viral infections by estimated CRP velocity, PLoS One, 2022, 17(12), e0277401, DOI:10.1371/journal.pone.0277401.
- M. L. Brigden, Clinical utility of the erythrocyte sedimentation rate, Am. Fam. Physician, 1999, 60(5), 1443–1450 CAS.
- A. K. Doolittle, Studies in Newtonian Flow, I. The Dependence of the Viscosity of Liquids on Temperature, J. Appl. Phys., 1951, 22(8), 1031–1035, DOI:10.1063/1.1700096.
- R. Rosencranz and S. A. Bogen, Clinical laboratory measurement of serum, plasma, and blood viscosity, Am. J. Clin. Pathol., 2006, 125 Suppl, S78–S86, DOI:10.1309/fff7u8rrpk26vapy.
- B.-B. Tzeng and Y.-S. Sun, Design and Fabrication of a Microfluidic Viscometer Based on Electrofluidic Circuits, Micromachines, 2018, 9(8), 375, DOI:10.3390/mi9080375.
- B. A. Inman, et al., The impact of temperature and urinary constituents on urine viscosity and its relevance to bladder hyperthermia treatment, Int. J. Hyperthermia, 2013, 29(3), 206–210, DOI:10.3109/02656736.2013.775355.
- S. Arshavsky-Graham and E. Segal, Lab-on-a-Chip Devices for Point-of-Care Medical Diagnostics, in Advances in Biochemical Engineering/Biotechnology, ed. J. Bahnemann and A. Grünberger, Springer Nature, Switzerland, AG, 2020, vol. 179, pp. 247–265, DOI:10.1007/10_2020_127.
- L. R. Volpatti and A. K. Yetisen, Commercialization of microfluidic devices, Trends Biotechnol., 2014, 32(7), 347–350, DOI:10.1016/j.tibtech.2014.04.010.
- W.-J. Kim, S. Kim, C. Huh, B. K. Kim and Y. J. Kim, A novel hand-held viscometer applicable for point-of-care, Sens. Actuators, B, 2016, 234, 239–246, DOI:10.1016/j.snb.2016.04.126.
- Z. Xiang, Q. Liu, F. Huang, T. Wang and W. Zhang, A responsive viscosity sensing system with a flow channel based on a one-port resonator, Sens. Actuators, A, 2024, 365, 114873, DOI:10.1016/j.sna.2023.114873.
- R. Jiang, et al., Microfluidic viscometer by acoustic streaming transducers, Lab Chip, 2023, 23(11), 2577–2585, 10.1039/D3LC00101F.
- K. Shiba, G. Li, E. Virot, G. Yoshikawa and D. A. Weitz, Microchannel measurements of viscosity for both gases and liquids, Lab Chip, 2021, 21(14), 2805–2811, 10.1039/D1LC00202C.
- M. Yunus and A. Arifin, Design of Oil Viscosity Sensor Based on Plastic Optical Fiber, J. Phys.: Conf. Ser., 2018, 979, 012083, DOI:10.1088/1742-6596/979/1/012083.
- A. Bamshad, A. Nikfarjam and M. H. Sabour, Capillary-based micro-optofluidic viscometer, Meas. Sci. Technol., 2018, 29(9), 095901, DOI:10.1088/1361-6501/aace7d.
- H. Li, D. Han, G. M. Pauletti and A. J. Steckl, Blood coagulation screening using a paper-based microfluidic lateral flow device, Lab Chip, 2014, 14(20), 4035–4041, 10.1039/C4LC00716F.
- E. Elizalde, R. Urteaga and C. L. A. Berli, Precise capillary flow for paper-based viscometry, Microfluid. Nanofluid., 2016, 20(10), 135, DOI:10.1007/s10404-016-1800-8.
- A. Rayaprolu, S. K. Srivastava, K. Anand, L. Bhati, A. Asthana and C. M. Rao, Fabrication of cost-effective and efficient paper-based device for viscosity measurement, Anal. Chim. Acta, 2018, 1044, 86–92, DOI:10.1016/j.aca.2018.05.036.
- S. B. Puneeth and S. Goel, Amperometric Automation and Optimization Paper Microfluidic Viscometer, IEEE Sens. Lett., 2019, 3(3), 1–4, DOI:10.1109/LSENS.2019.2894623.
- S. B. Puneeth and S. Goel, Handheld and ‘Turnkey’ 3D printed paper-microfluidic viscometer with on-board microcontroller for smartphone based biosensing applications, Anal. Chim. Acta, 2021, 1153, 338303, DOI:10.1016/j.aca.2021.338303.
- S. B. Puneeth, N. Munigela, S. A. Puranam and S. Goel, Automated Mini-Platform With 3-D Printed Paper Microstrips for Image Processing-Based Viscosity Measurement of Biological Samples, IEEE Trans. Electron Devices, 2020, 67(6), 2559–2565, DOI:10.1109/TED.2020.2989727.
- H. Kang, I. Jang, S. Song and S.-C. Bae, Development of a Paper-Based Viscometer for Blood Plasma Using Colorimetric Analysis, Anal. Chem., 2019, 91(7), 4868–4875, DOI:10.1021/acs.analchem.9b00624.
- C. Meffan, J. Menges, D. Mak, F. Dolamore, C. Fee, V. Nock and R. C. J. Dobson, A versatile capillaric circuits microfluidic viscometer, Sens. Actuators, A, 2023, 359, 114497, DOI:10.1016/j.sna.2023.114497.
- S. Hassan, et al., Capillary-Driven Flow Microfluidics Combined with Smartphone Detection: An Emerging Tool for Point-of-Care Diagnostics, Diagnostics, 2020, 10(8), 509, DOI:10.3390/diagnostics10080509.
- J. Cai, T. Jin, J. Kou, S. Zou, J. Xiao and Q. Meng, Lucas-Washburn Equation-Based Modelling of Capillary-Driven Flow in Porous Systems, Langmuir, 2021, 37(5), 1623–1636, DOI:10.1021/acs.langmuir.0c03134.
- Y. V. Zaccardi, N. Alderete and N. De Belie, Lucas-Washburn vs Richard's equation for the modelling of water absorption in cementitious materials, International Conference on Concrete Repair, Rehabilitation and Retrofitting (ICCRRR 2018), 2018, vol. 199, DOI:10.1051/matecconf/201819902019.
- M. L. Huber, et al., New International Formulation for the Viscosity of H2O, J. Phys. Chem. Ref. Data, 2009, 38(2), 101–125, DOI:10.1063/1.3088050.
- N. B. Vargaftik, B. N. Volkov and L. D. Voljak, International Tables of the Surface Tension of Water, J. Phys. Chem. Ref. Data, 1983, 12(3), 817–820, DOI:10.1063/1.555688.
- J. P. Abeykoon, et al., Predictors of symptomatic hyper viscosity in Waldenström macroglobulinemia, Am. J. Hematol., 2018, 93(11), 1384–1393, DOI:10.1002/ajh.25254.
- C. Otto, W. O. Richter and P. Schwandt, Contribution of fibrinogen and lipoproteins to plasma viscosity in hypercholesterolemia and hypertriglyceridemia: Evaluation by selective depletion of low-density lipoproteins or fibrinogen, Metabolism, 2000, 49(6), 810–813, DOI:10.1053/meta.2000.6264.
| This journal is © The Royal Society of Chemistry 2024 |