
 Open Access Article
 This Open Access Article is licensed under a
 Creative Commons Attribution 3.0 Unported Licence
Revolutionizing sample preparation: a novel autonomous microfluidic platform for serial dilution†
Dries
Vloemans
 ,
Alexander
Pieters
,
Francesco
Dal Dosso
and
Jeroen
Lammertyn
*
,
Alexander
Pieters
,
Francesco
Dal Dosso
and
Jeroen
Lammertyn
*
KU Leuven, Department of Biosystems, Biosensors Group, Willem de Croylaan 42, box 2428, 3001 Leuven, Belgium. E-mail: jeroen.lammertyn@kuleuven.be
First published on 25th April 2024
Abstract
Dilution is a standard fluid operation widely employed in the sample preparation process of many bio(chemical) assays. It serves multiple essential functions such as sample mixing with certain reagents at specific dilution ratios, reducing sample matrix effects, bringing target analytes within the linear assay detection range, among many others. Traditionally, sample processing is performed in laboratory settings through manual or automated pipetting. When working in resource-limited settings, however, neither trained personnel nor proper laboratory equipment are available limiting the accessibility to high-quality diagnostic tests. In this work, we present a novel standalone and fully automated microfluidic platform for the stepwise preparation of serial dilutions without the need for any active elements. Stepwise dilution is achieved using the coordinated burst action of hydrophobic burst valves to first isolate a precisely metered volume from an applied sample drop and subsequently merge it with a prefilled diluent liquid. Downstream, expansion chambers are used to mix both reagents into a homogeneous solution. The dilution module was characterized to generate accurate and reproducible (CV < 7%) dilutions for targeted dilution factors of 2, 5 and 10×, respectively. Three dilution modules were coupled in series to generate three-fold logarithmic (log5 or log10) dilutions, with excellent linearity (R2 > 0.99). Its compatibility with whole blood was furthermore illustrated, proving its applicability for automating and downscaling bioassays with complex biological matrices. Finally, autonomous on-chip serial dilution was demonstrated by incorporating the self-powered (i)SIMPLE technology as a passive driving source for liquid manipulation. We believe that the simplicity and modularity of the presented autonomous dilution platform are of interest to many point-of-care applications in which sample dilution and reagent mixing are of importance.
Introduction
In many chemical and biological assays, dilution is a common fluid operation during sample pre-processing, which involves repetitive manual or automated pipetting steps. Preparing a range of concentration standards, performing sample dilutions to extend the dynamic range of immunological assays and reducing matrix effects when working with crude samples (i.e., whole blood) all require multiple consecutive iterations of reagent metering and mixing.1 When having access to proper laboratory equipment (e.g., micropipettes) and trained personnel this is a straightforward and routine procedure. However, in contamination-prone resource-limited point-of-care (POC) settings (e.g., at home), where neither the knowledge nor equipment is available, an automated standalone platform for sample dilution would be of huge interest.1,2To realize this, the use of microfluidics has been of enormous interest because of its capability to downscale and automate complex liquid handling. Three main microfluidic approaches have been explored to automate and integrate the dilution process within miniaturized microfluidic chips. First, controlled diffusive mixing between two or more parallel laminar flows is used to generate concentration gradients along the length of a microchannel.3,4 This approach is typically exploited to study the effects of chemical and drug concentrations on cell behaviour and toxicity.5–7 By repeated splitting and recombination of these flows within a branched microfluidic channel network, a variety of linear, parabolic or even periodical concentration profiles can be generated.4,8 Kim et al. proposed an alternative design based on the same diffusion principle to realize stepwise linear and logarithmic serial dilutions.9–11 Although diffusion-based diluters can generate complex concentration profiles, their continuous flow operation requires a constant supply of multiple reagents with external pumping equipment, which is not ideal for operation in resource-limited settings.
To avoid continuous reagent consumption, microfluidic dilution systems with integrated valves were developed to first meter and subsequently mix discrete reagent volumes in a stepwise manner. Paegel et al. used the peristaltic action of five pneumatic valves to mix a metered sample volume (400 nL) with a diluent through a microfluidic ring-shaped structure.12 By using a ladder-shaped microfluidic design, this system enabled some of the liquid to be stored after each dilution step, which remained available for further analysis.13 In an alternative mechanism, oscillatory microfluidics was used to execute stepwise serial dilution via coordinated operation of pneumatic valves to first meter both the sample and diluent in separate microfluidic chambers and afterwards mix them through oscillatory liquid manipulation.14 This process was then repeated to prepare a 6-fold dilution series of a hydrogen peroxide solution and study the oxidative stress in C. elegans nematodes. The main drawback of this approach is the need to control each valve individually with an external control unit which makes the device bulky and not compatible with POC applications.
More recently, centrifugal microfluidics has been used to create serial multistep dilutions without the need for multiple external pumps. Here, the liquid manipulation is driven via rotational centrifugal forces. Precise control over the disc rotation speed and direction combined with the successful integration of active15–19 or passive20–26 valving techniques enabled the execution of fluidic operations such as metering, merging and mixing. A variety of microfluidic designs have been demonstrated to generate both linear21 and logarithmic27 dilution series on-chip. Due to the flexibility of the technology, the microfluidic disc design is easily adaptable to meet the dilution and liquid handling requirements of a variety of multistep bioassays.28–30 The lab-on-a-disc approach, therefore, offers a user-friendly and integrated solution, however, still requires active elements for disc spinning and in some cases valve actuation, limiting their use for POC applications.31
To completely overcome the need for any active elements, several capillary-driven microfluidic systems have been developed that enable the sequential delivery of multiple reagents to automate multistep bioassays. For instance, Yafia et al. introduced the microfluidic chain reaction concept within a 3D-printed capillary circuit, thereby, automating the sequential reagent delivery accommodating a sandwich enzyme-linked immune detection assay for SARS-CoV-2 antibodies in saliva specimen.32 Similarly, the research group of Charles Henry established a capillary-driven immunoassay (CaDI) system, which allows the automation of serological assays, among many others, by sequentially delivering reagents to a detection zone.33,34 In their system, all assay reagents are pre-stored in dried form on the microfluidic device within glass fiber reagent pads which are reconstituted in solution at particular concentrations after sample/buffer application. Despite being extremely promising for automating complex multistep bioassay, these capillary flow-based systems only allow successive delivery of different reagents to a particular detection region. As they always rely on a continuous liquid flow, they do not allow discrete liquid volumes (i.e., liquid slugs) to be diluted and mixed with secondary reagents in a successive manner. More specifically, it is not possible to physically separate the different dilution operations one after the other.
To tackle this, we introduce in this paper another category in which, to our knowledge, for the first time automated and programmable stepwise serial dilution is achieved without the need for any active elements. In particular, a novel passive dilution concept, continuing on the previously developed on-chip metering principle,35 is presented which allows a discrete sample drop of unknown volume size to be exactly metered and diluted with a dilution factor (DF) between 1 and 10× (and potentially even higher). The module consists of 3 connected microfluidic units in which the structurally encoded fluidic operations of metering, merging and mixing are executed in a stepwise manner by using the coordinated burst action of hydrophobic burst valves (HBVs) (Fig. 1a and b). First, the required number of expansion chambers in the mixing unit (i.e., mixing efficiency) to generate homogeneous solutions is determined for different DFs of 2, 5 and 10×. Next, the dilution accuracy of the microfluidic system is evaluated for each DF by comparing on-chip diluted fluorescent solutions with manually off-chip prepared dilutions. To underpin the modularity and flexibility of the system, three dilution modules are coupled in series to generate log5 and log10 serial dilutions from which the dilutional linearity (accuracy) is evaluated using fluorescence measurements. Furthermore, the ability of the system to handle low surface tension and crude sample matrices is illustrated to validate its potential for real bioassay sample processing. Finally, fully automated and autonomous serial dilution is achieved by coupling the serially coupled dilution modules to our in-house developed self-powered microfluidic pumping technology (Fig. 1c).36–39 The results reported in this work demonstrate the advanced sample processing capability of our self-powered microfluidic platform, which now can be further developed towards a variety of (bio)chemical applications.
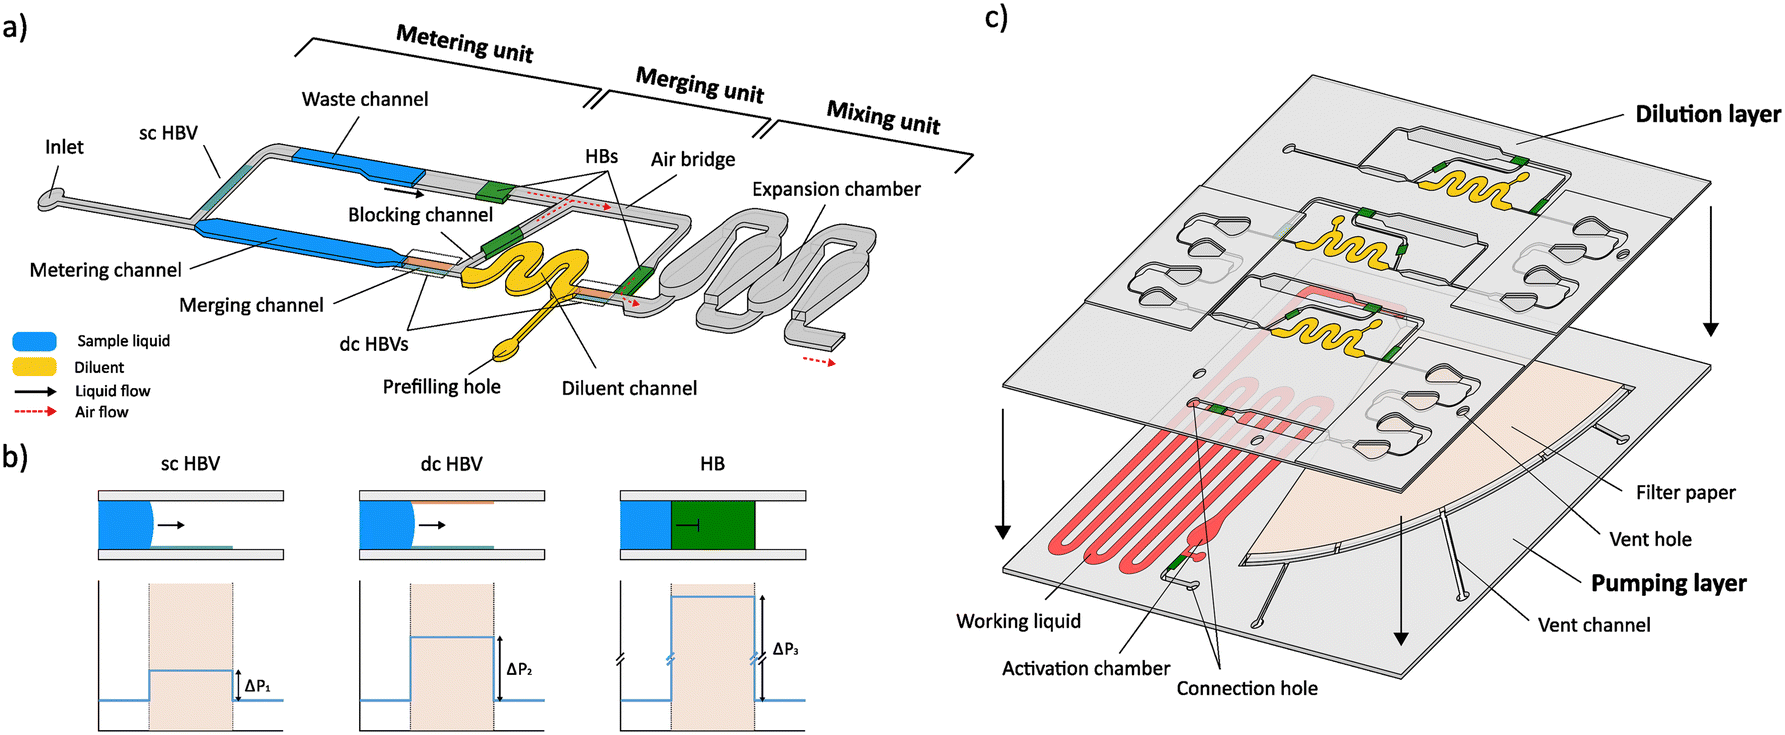 | ||
| Fig. 1 a) Conceptual design of the dilution module illustrating the 3 microfluidic units that are used for plug metering, merging and mixing, and the positions of the different valving elements (single-coated (sc) and double-coated (dc) HBVs, and hydrophobic barrier (HB)). b) Configuration and working principle of the different valves with their respective theoretical burst pressure profiles. The sc HBV contains a hydrophobic coating at the bottom channel wall while the dc HBV is treated hydrophobic at both the top and bottom walls, resulting in varying burst pressures. The HB comprises a hydrophobic-treated filter paper, which allows air passage but forms a physical barrier for the liquid, hence, inducing a very high burst pressure. c) Conceptual exploded view of the integrated microfluidic device for autonomous multistep serial dilution illustrating the top ‘dilution’ and bottom ‘pumping’ layer. The top dilution layer comprises 3 serially coupled dilution modules (5× DF), connected with a connection hole to the bottom pumping layer, holding the prefilled working liquid and wedge-shaped filter paper (Whatman grade 598) of the SIMPLE pump unit. | ||
Materials and methods
Reagents and materials
Polyvinyl chloride (PVC) films of 180 μm thickness were bought at Delbo (Maldegem, Belgium). Double-sided pressure-sensitive adhesive (PSA) tape (200 MP 7956MP) and transfer tape (467MP) with respective thicknesses of 153 and 50 μm were acquired from 3M (Minnesota, USA). Microfluidic dyes were obtained from Darwin Microfluidics (Paris, France). Hydrophobic solutions Aquapel and Fluoropel 800 M were purchased at Aquapel (Pennsylvania, USA) and Cytonix (Maryland, USA), respectively. Whatman quantitative filter paper of grades 43 and 598, fluorescein, bovine serum albumin (BSA) and phosphate buffer saline (PBS) were all obtained from Sigma-Aldrich (Overijse, Belgium). Tween 20 was purchased at Promega (Madison, USA). Left-over EDTA whole blood samples were obtained from the Red Cross Flanders and used within 48 h after receipt.Microfluidic chip fabrication
![[thin space (1/6-em)]](https://www.rsc.org/images/entities/char_2009.gif) :50 diluted) working liquid and yellow-colored (1:20 diluted) diluent were prefilled in the respective working liquid and diluent channels via the prefilling holes which were sealed afterward. Both pumping and dilution layers were connected through a connection hole.
:50 diluted) working liquid and yellow-colored (1:20 diluted) diluent were prefilled in the respective working liquid and diluent channels via the prefilling holes which were sealed afterward. Both pumping and dilution layers were connected through a connection hole.
The same procedure was executed to determine the performance of the 3-fold logarithmic serial dilution chips. Similar to the mixing efficiency characterization experiments, both the single and multistep dilution systems were run with a syringe pump set at a constant flow rate of 10 μL min−1. Both serial dilutions were plotted as a base-5 or base-10 logarithm of the fluorescence intensity and the accuracy was quantified by linear regression.
Results and discussion
Working principle
The general working principle of the dilution system is shown in Fig. 2a and Video S1,† which illustrate the different fluidic operations (driven by a syringe pump) that are performed within a dilution module with a 5× DF. First, a precisely metered volume is isolated from the incoming sample liquid by using the coordinated burst action of HBVs with different burst strengths.35 As is illustrated in Fig. 2a (i and ii), a sc HBV directs the sample liquid into the metering channel until the liquid front reaches the dc HBV. Due to its higher burst pressure, the dc HBV forces the excess of the sample liquid to burst through the sc HBV and flow into the storage channel after which the liquid in the metering channel becomes isolated. Depending on the desired DF (2, 5 or 10×), the length of the metering channel was adjusted to isolate volumes of 5, 2 or 1 μL (plus the volume of the downstream blocking channel). Evaluating the accuracy of this particular metering step was not part of this paper as it was already studied and confirmed (CV < 3%) in previous work.32 Downstream, the metering channel is in connection with a diluent channel, here holding 8 μL of diluent liquid (5 or 9 μL for DFs of 2 or 10×, respectively). The diluent channel is bridged by a microfluidic channel, which diverts the airflow around the diluent liquid and this way prevents it to be manipulated downstream during the first metering step (P1 = P2) as is explained in Fig. 2b. Only when the sample excess reaches the HB at the end of the storage channel, the metered sample plug is pulled through the dc HBV and merges with the diluent (Fig. 2a (iii) and b). During the bursting of the dc HBV, a small portion of the metered sample volume enters the blocking channel to prevent any airflow to enter the air bridge after plug merging (Fig. 2a (iv) and b). This is an important feature as otherwise only a fraction of the merged plug will be manipulated downstream from the moment the receding liquid front passes the HB (Fig. 2b (bottom)).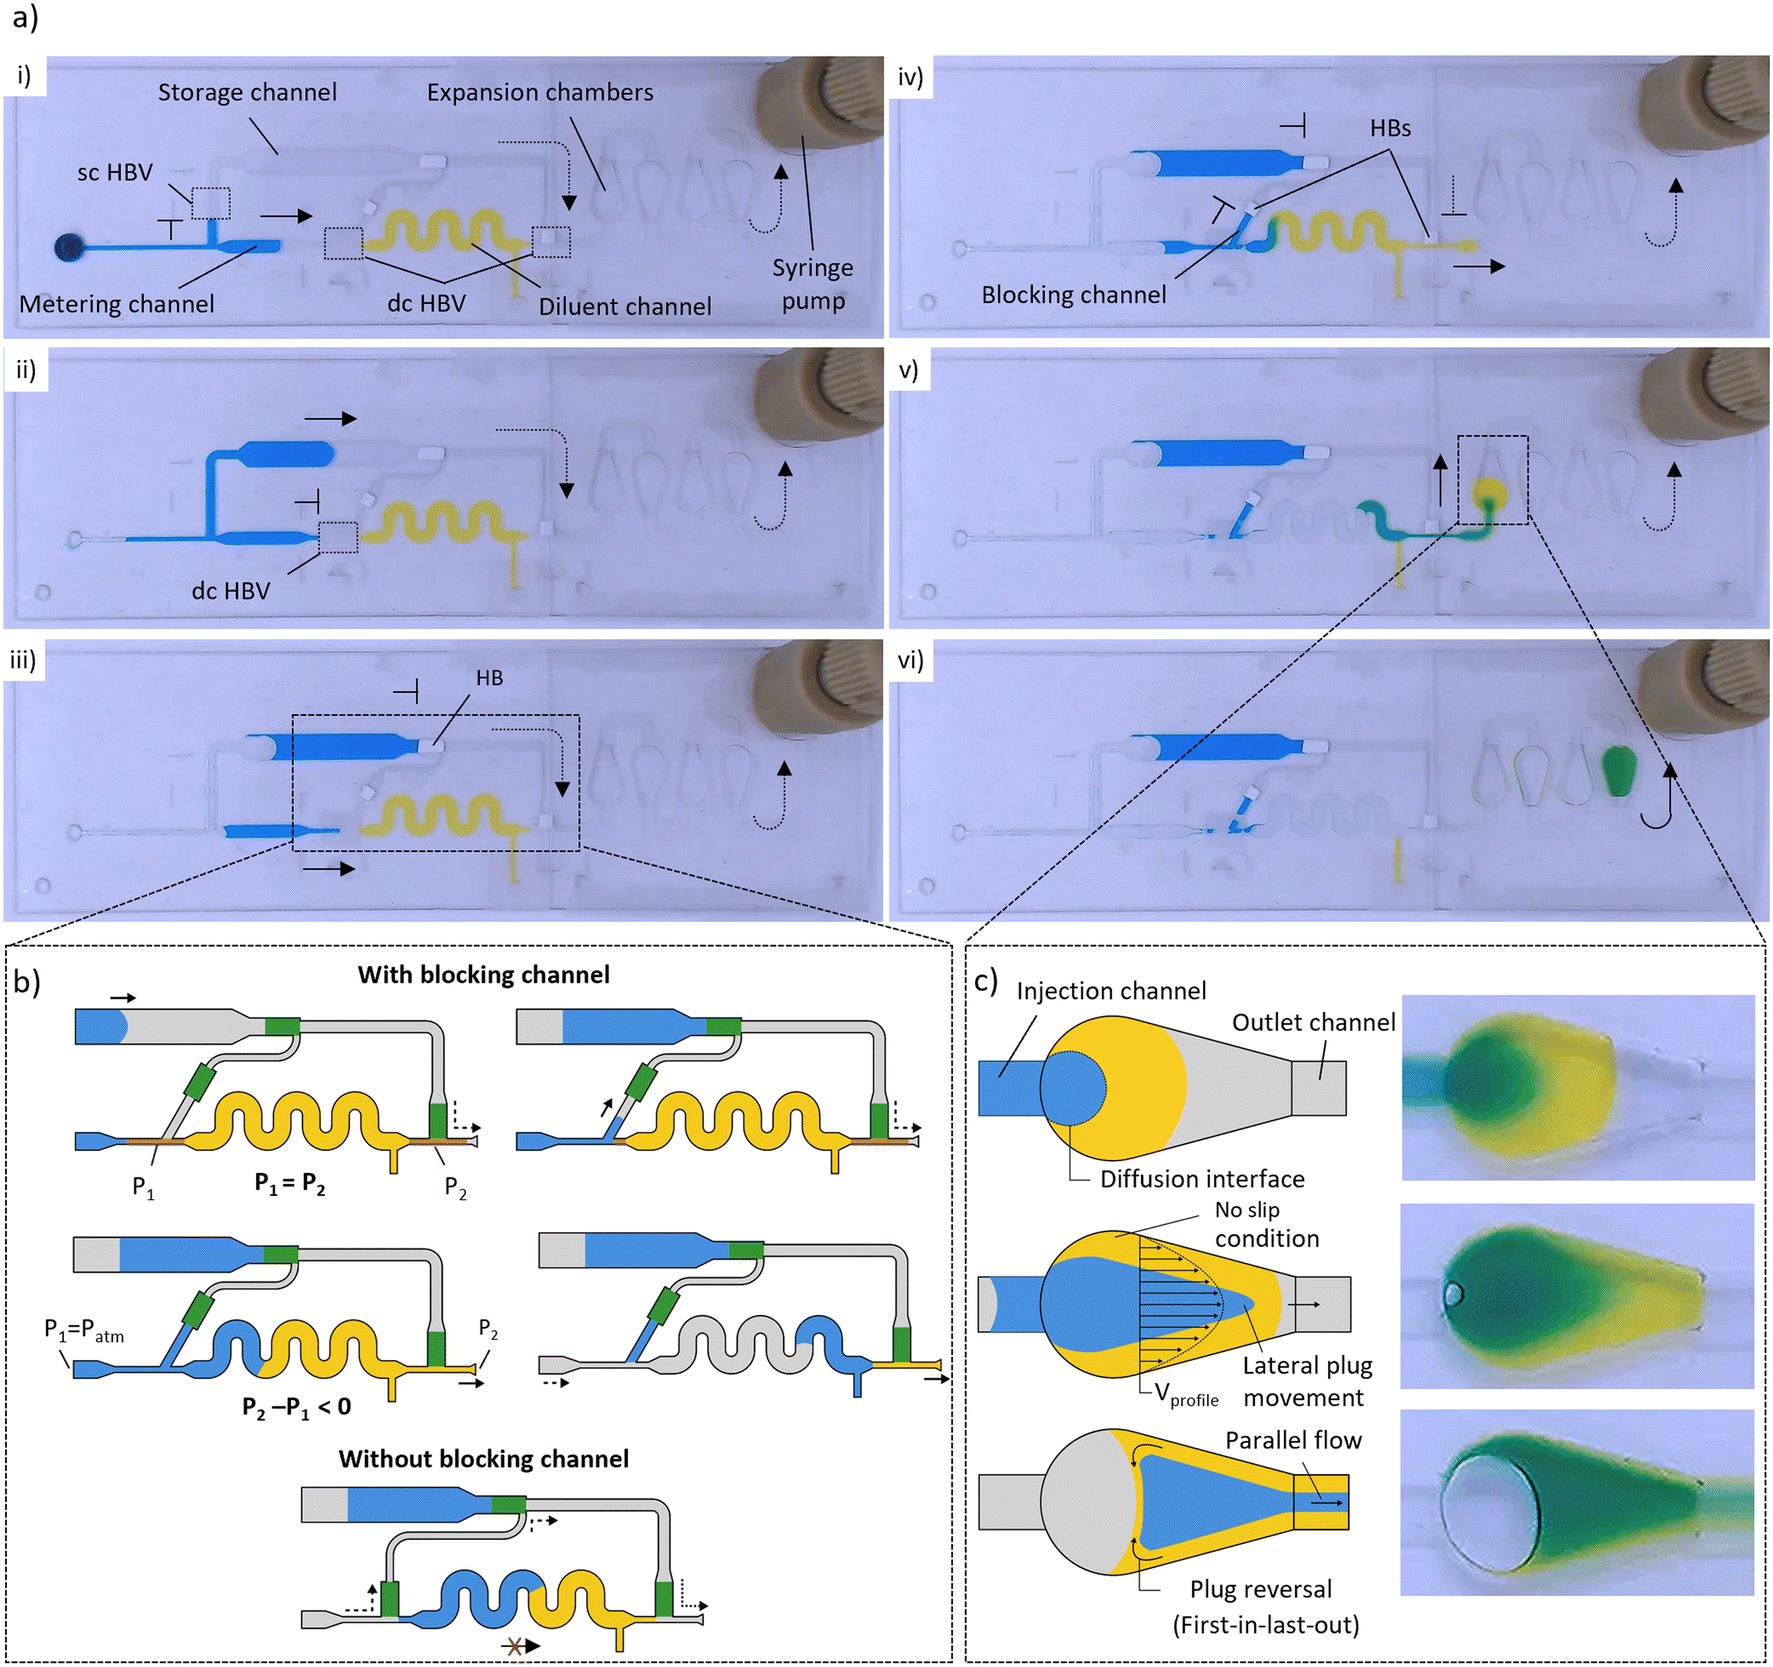 | ||
| Fig. 2 a) Snapshots of the different liquid manipulations within a dilution module (DF = 5×) illustrating the working principle. (i and ii) The coordinated burst action of HBVs with different burst strengths is used to first isolate a precisely metered sample liquid (2 μL, blue), after which the excess is removed to the storage channel. (iii and iv) The metered sample liquid is next merged with a prefilled diluent (8 μL, yellow) after which (v and vi) the combined plug is sent through a sequence of expansion chambers in which it is mixed into a homogeneous solution. b) Detailed schematics of plug merging, and working principle of the microfluidic air bridge (top). Illustration of failed downstream plug manipulation when no blocking channel is used due to air intake via the microfluidic air bridge (bottom). c) Close-up of the expansion chambers, illustrating the three ongoing principles that are used within the mixing process: increase of diffusion interface, parabolic flow profile and lateral plug distribution. Dashed and full arrows indicate air and liquid flow, respectively. | ||
The merged sample and diluent plugs are finally manipulated (P2 − P1 < 0) towards the mixing unit where expansion chambers are used to mix them into a homogeneous solution (Fig. 2a (v and vi)). Like in most passive micromixers, mixing relies mostly on passive diffusion processes, which are generally very slow. To speed up the process, liquids are often flowed side-by-side through microchannels to increase the diffusion interface while simultaneously reducing the diffusion distances.41 In our system, however, the liquid plugs are positioned one after another that makes the mixing much more complicated as the interface through which diffusion can occur is very limited. The droplet-shaped design of the expansion chambers was selected to be compatible with the layer-by-layer chip assembly process (enabling simple alignment) while enhancing the mixing process through three microfluidic phenomena which are illustrated in Fig. 2c: i) an increased diffusion interface between the plugs due to the 3D expansion in the chamber (height and width, ii) a large flow velocity gradient between the centre (high velocity) and the walls (no-slip condition, low velocity) of the chamber as a result of the parabolic flow profile, and iii) confinement of the merged sample–diluent liquid volume within the expansion chamber to avoid reagent separation. In combination with the parabolic flow profile, a strong lateral plug redistribution is generated which eventually leads to a parallel sample–diluent flow profile in the outgoing channel. Additionally, upon emptying of the expansion chamber, plug reversal is observed as the diluent at the chamber walls is pulled out of the chamber lastly. Therefore, the liquid redistribution within the expansion chamber follows a first-in-last-out flow behaviour. This process is repeated within each chamber until a homogeneous solution is obtained.
Evaluation of mixing efficiency
The mixing of the sample and diluent liquids within the expansion chambers relies mostly on passive diffusion processes as described in the previous section. To determine the number of required chambers to obtain a homogeneous reagent mixture and get more insight into how both liquids are redistributed through them, the fluorescence profile of a fluorescein (1 μg mL−1) plug (diluted in 1× PBS) was recorded over time at 5 different chip positions (Fig. 3a), using an inverted fluorescence microscope (see Video S2† for an example of recording). As shown in Fig. 3b, similar dynamics were observed for dilution modules with DFs of 2, 5 and 10×. At position 1 (Pos-1), the 1× PBS and fluorescein solution can clearly be distinguished over the plug length whereas the large error zones indicate a large fluorescence gradient along the channel width. The fluorescence profile becomes much more stretched and flattened after passing through the first 2 expansion chambers (Pos-2 and Pos-3). This indicates that after 2 chambers, already a significant lateral distribution of the fluorescein solution and diluent has occurred. In chambers 3 and 4 the fluorescence profile is further developed towards a well-defined flat curve with minimal error zones implying a homogeneous mixture over both the whole length and width of the liquid plug (Pos-4 and Pos-5).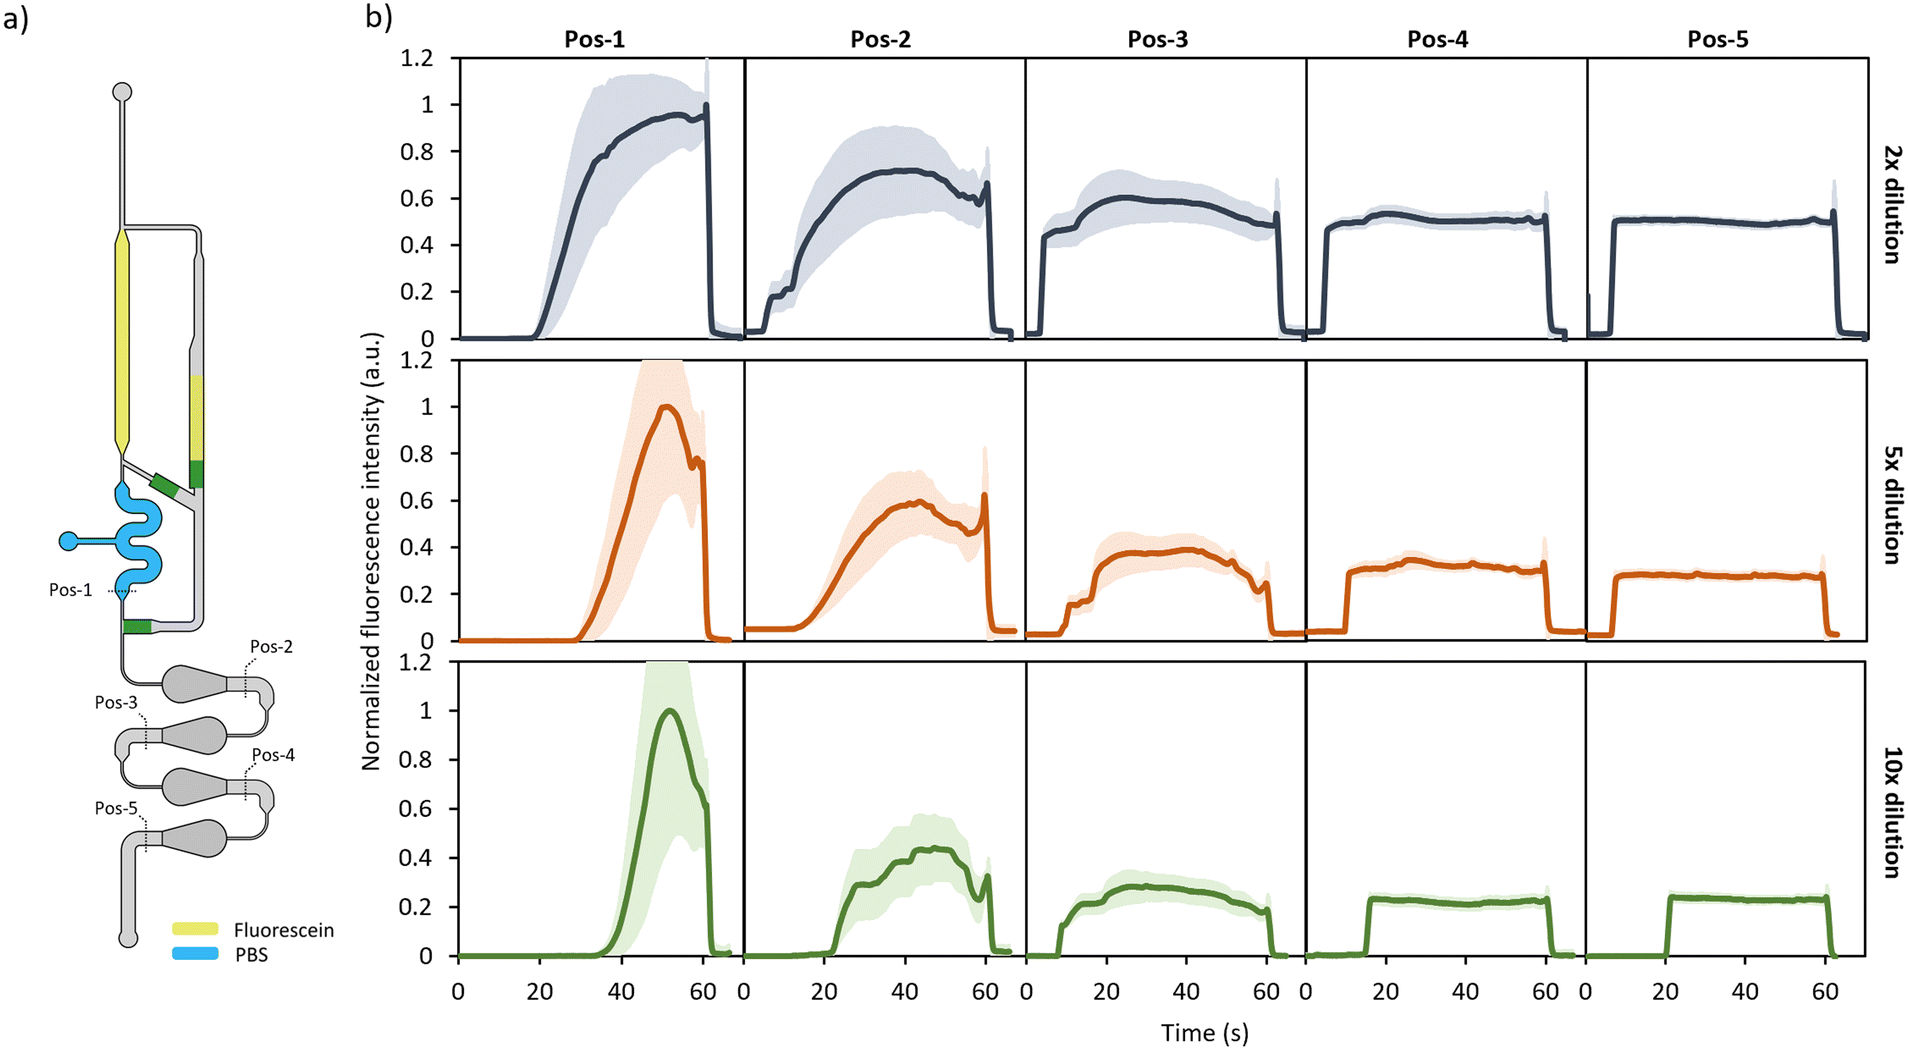 | ||
| Fig. 3 a) Schematic illustration of the experimental setup for the dilution module (DF = 2×). The dotted lines illustrate the 5 different locations where the fluorescence profile was recorded. b) Evolution of the normalized fluorescence profile of the sample-diluent plug at the different recording positions for dilutions modules with respective DFs of 2, 5 and 10×. The error zones represent the fluorescence intensity distribution (one standard deviation) along the channel width of the measured fluorescence profile. | ||
These results show that at least 3 expansion chambers are required to obtain a homogeneous sample–diluent mixture. To always ensure proper mixing, 4 chambers were integrated in the final design of the dilution module. These results are in line with the colorimetric measurements (see Section S1, ESI†) that were performed to evaluate the evolution of the colour distribution within each expansion chamber.
Evaluation of dilution accuracy
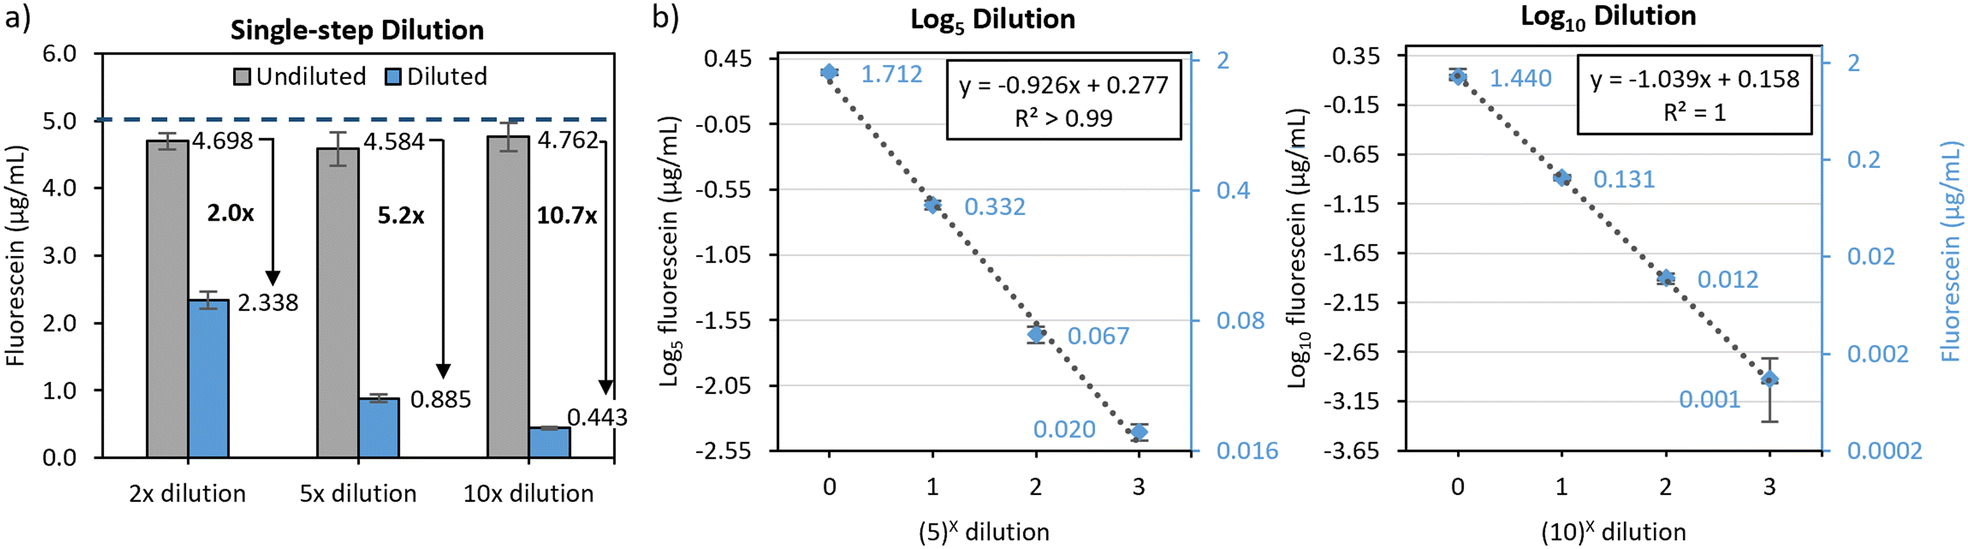 | ||
| Fig. 4 a) Measured fluorescein concentrations of the undiluted and diluted 5 μg mL−1 fluorescein–PBS solution for single-step dilution modules with DFs of 2, 5 and 10×. The blue dashed line indicates the reference concentration of 5 μg mL−1 while the error bars represent one standard deviation (n ≥ 3). b) Calibration curves of the on-chip prepared log5 and log10 dilution series of the stock fluorescein solution (2 μg mL−1) in function of the dilution step (X). Secondary Y-axis (blue) represents logarithmically scaled fluorescein concentrations with base 5 and 10 on the left and right graph, respectively. Grey dotted lines represent the linear fits (R2 > 0.99) to the log5 or log10 transformed fluorescein concentrations. Values of the measured fluorescein concentrations are added next to the data bars/points. Error bars represent one standard deviation on the measured fluorescein concentration, represented on the secondary Y-axis (n ≥ 3). All fluorescein intensity values were converted to concentrations by using a fluorescein standard curve which was run in parallel to each experiment (n = 4). | ||
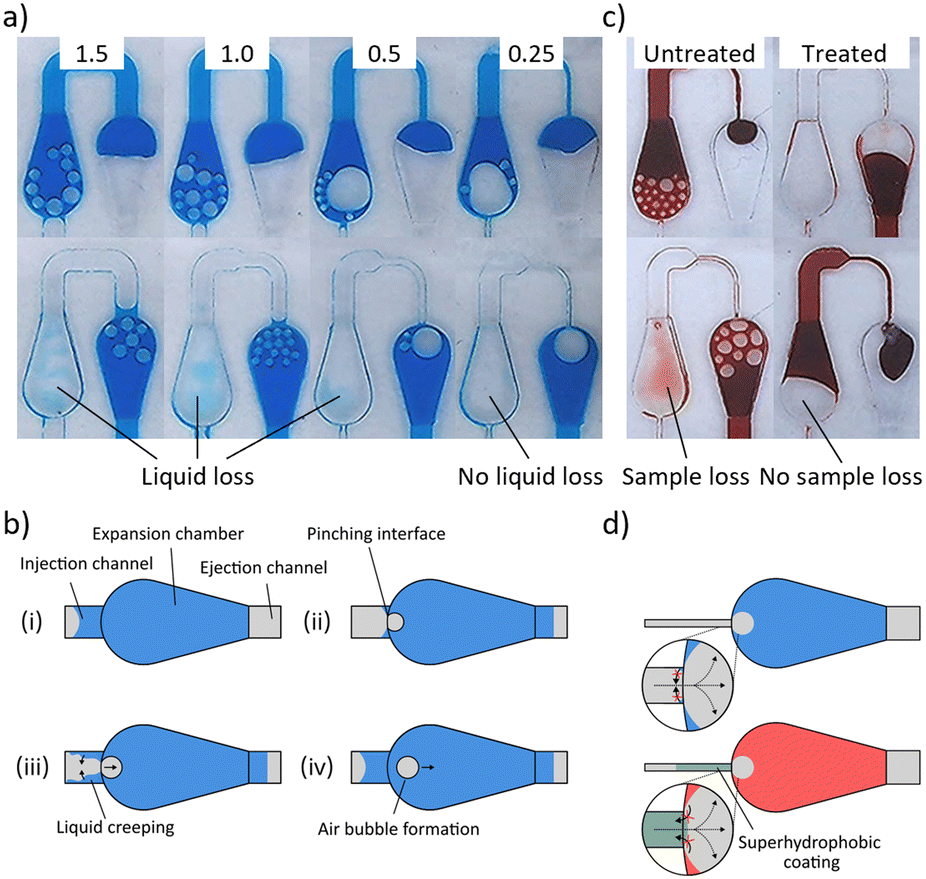 | ||
| Fig. 5 a) Snapshots of air bubble formation and liquid loss in expansion chambers with injection channels of different widths (1.5, 1.0, 0.5 and 0.25 mm), using PBS–1% BSA–0.5% Tween 20 as a low surface tension sample liquid. b) Schematic illustration of the air bubble formation process within the expansion chambers for low surface tension liquids. c) Snapshots of air bubble formation and liquid loss in expansion chambers with untreated and superhydrophobic treated injection channels (0.25 mm width), using EDTA-stabilized blood as sample liquid. d) Conceptual drawings of implemented strategies to prevent backflow of the sample liquid into the injection channel; (top) channel width reduction and (bottom) superhydrophobic treatment of the injection channel. | ||
The system was also evaluated for EDTA-stabilized blood, being an even more challenging matrix due to its non-Newtonian and viscous properties. Again, air bubble formation and liquid loss within the chambers are observed which could not be resolved by channel width reduction (Fig. 5c). To prevent any backflow of the blood into the injection channel, the latter was partly treated superhydrophobic (Fig. 5c right and d bottom). As a consequence, no air bubble formation and liquid loss is present within the chambers as can be seen in Fig. 5c (Video S4†). Additionally, the whole dilution system, including the sample metering and plug merging steps was also validated on whole blood samples as can be seen in Video S5 of the ESI.†
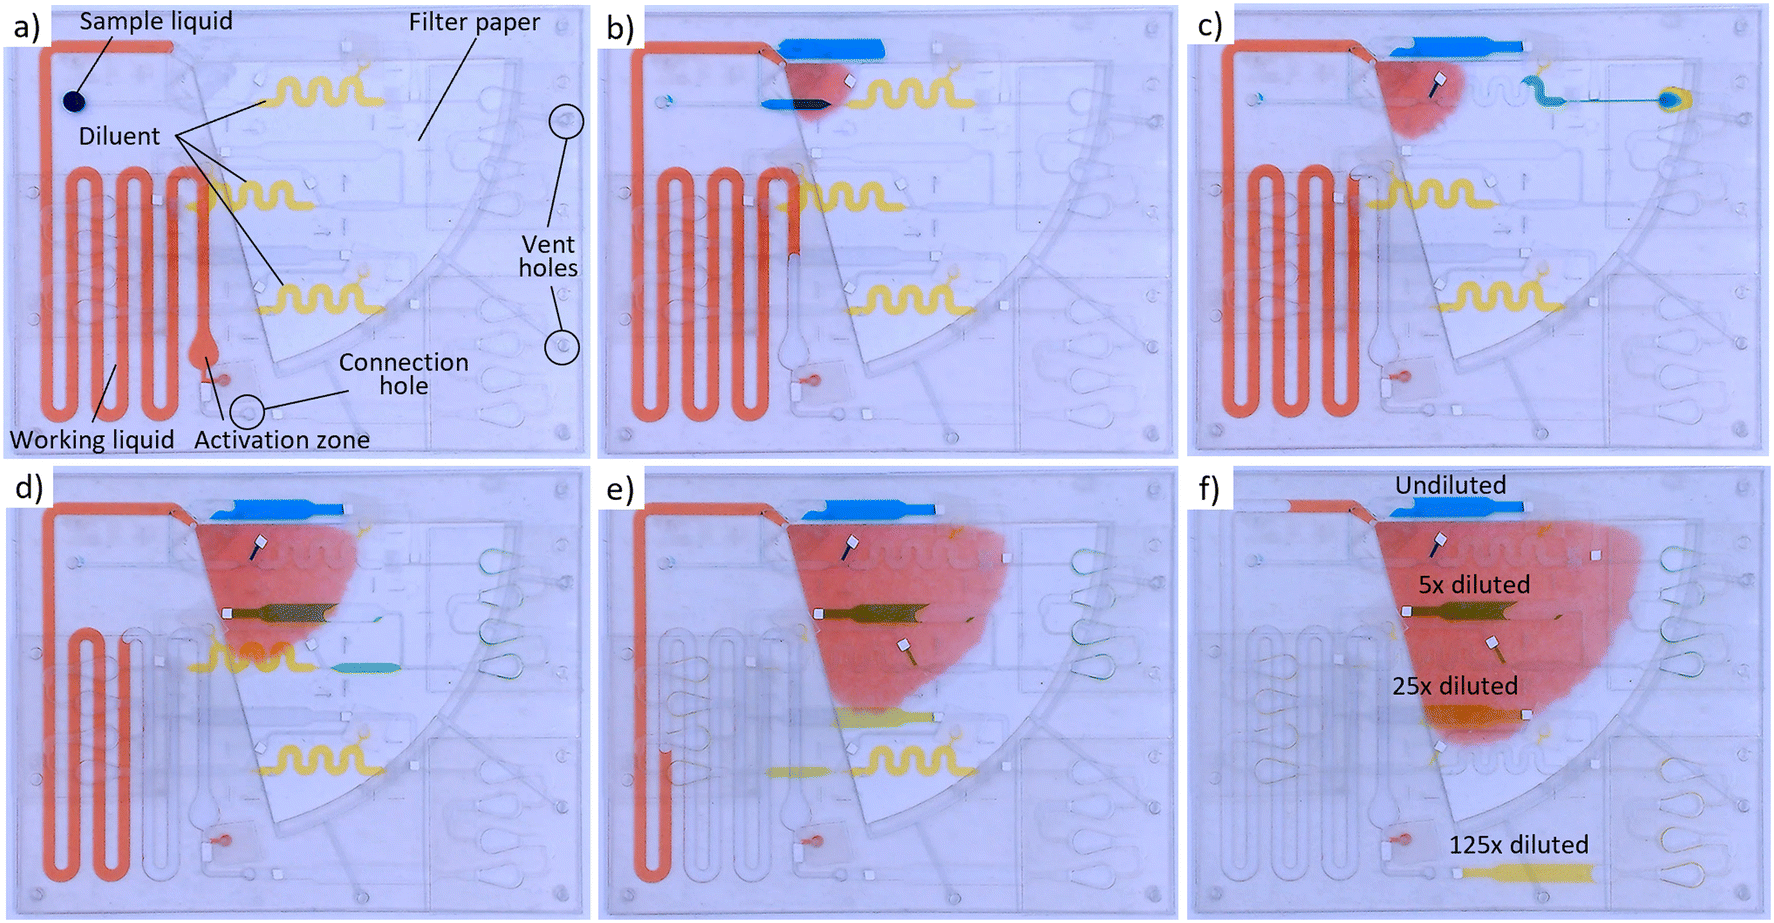 | ||
| Fig. 6 a) Configuration of the autonomous log5 serial dilution chip with a prefilled diluent and working liquid, and the applied sample liquid drop at the inlet. Snapshots b–f show the different steps of the chip operation where first b) the SIMPLE pump is activated by a finger-press on the activation chamber. After activation, the working liquid is absorbed by the porous paper substrate generating a negative pressure in the dilution layer. As a consequence, the sample liquid is drawn through the different dilution modules (DF = 5×) where consecutive steps of metering and mixing (c–f) are performed. After each dilution step, some of the undiluted, 5×, 25× and 125× diluted solutions are stored in the storage channel. | ||
Conclusions
In this paper, we present a novel microfluidic dilution module that can generate multistep serial dilutions in a fully autonomous and programmable way. The mixing efficiency and behaviour of the sample and diluent reagent within the mixing unit were evaluated using dynamic fluorescence measurements, which showed that after 4 expansion chambers a homogeneous reagent mixture was obtained. Comparison of on-chip with manual off-chip dilutions showed good accuracy and reproducibility of the single-step dilution module up to a DF of 10×. Three-fold logarithmic serial dilution (log5 or log10) was next achieved by coupling 3 dilution modules in series from which the dilution performance was characterized to show excellent linearity (R2 > 0.99) and reproducibility. The compatibility of the system with complex sample matrices was also validated, clearly illustrating its potential for advanced single- or multi-step sample processing applications. Finally, the self-powered SIMPLE technology was successfully integrated as a passive driving source to manipulate the liquid through the microfluidic network and this way makes the dilution system completely independent of active external equipment.The ability of the presented microfluidic technology to manipulate discrete sample volumes and consecutively mix them with various liquid reagents in a fully autonomous and programmable way is unprecedented in the field of passive microfluidics. Moreover, its modularity and plug-and-play principle allow the configuration of the microfluidic circuit to be programmed (in terms of the number of dilution steps and DFs) towards tailored applications with great ease. We, therefore, strongly believe that the advances presented in this work contribute significantly to the development of next-generation lab-on-a-chip devices with integrated complex multistep sample processing capability. The latter being a critical aspect hampering the widespread adoption and implementation of POC diagnostic tests in real world settings. The performance of nucleic acid amplification assays, for example, is mostly still restricted to laboratory environments as a consequence of their complex sample processing requirements (i.e., sample lysis, post-dilution, mixing with amplification reagents, etc.). In our opinion, these steps can all be integrated and automated on the presented platform, which will be the objective of our future research.
Author contributions
Dries Vloemans: conceptualization, experimental design and planning, characterization, validation, formal analysis, investigation, writing – original draft, visualization. Alexander Pieters: characterization, validation, formal analysis, investigation. Francesco Dal Dosso: conceptualisation, experimental design and planning, writing – review & editing, supervision, funding acquisition, project administration. Jeroen Lammertyn: conceptualization, resources, writing – review & editing, supervision, funding acquisition, project administration.Conflicts of interest
The authors declare the following competing financial interest(s): D. V., F. D. D., and J. L. are inventors of a pending patent application for the microfluidic dilution device. The remaining authors have no conflicts of interest to declare.Acknowledgements
This work was funded by the Research Foundations – Flanders (SB project 1S33618N, SBO S003923N), the KU Leuven (C3 project C32/17/007, C3 project C3/21/014, C2 project C24/16/022, ID-N project IDN/20/011, IOF mandate 3E160311), Flanders Innovation & Entrepreneurship – VLAIO (HBC.2022.0710) and the European Union (FORTIFIEDx). Views and opinions expressed are however those of the author(s) only and do not necessarily reflect those of the European Union or the granting authority European Union's Horizon Europe research and innovation programme. Neither the European Union nor the granting authority can be held responsible for them. The FORTIFIEDx project has received funding under the Horizon Europe research and innovation programme (the grant agreement No 101092049).Notes and references
- J. Park, D. H. Han and J. K. Park, Lab Chip, 2020, 20, 1191–1203 RSC.
- M. Urdea, L. A. Penny, S. S. Olmsted, M. Y. Giovanni, P. Kaspar, A. Shepherd, P. Wilson, C. A. Dahl, S. Buchsbaum, G. Moeller and D. C. Hay Burgess, Nature, 2006, 444, 73–79 CrossRef PubMed.
- N. L. Jeon, S. K. W. Dertinger, D. T. Chiu, I. S. Choi, A. D. Stroock and G. M. Whitesides, Langmuir, 2000, 16, 8311–8316 CrossRef CAS.
- S. K. W. Dertinger, D. T. Chiu, N. L. Jeon and G. M. Whitesides, Anal. Chem., 2001, 73, 1240–1246 CrossRef CAS.
- C. W. Chang, Y. J. Cheng, M. Tu, Y. H. Chen, C. C. Peng, W. H. Liao and Y. C. Tung, Lab Chip, 2014, 14, 3762–3772 RSC.
- E. Jastrzebska, S. Flis, A. Rakowska, M. Chudy, Z. Jastrzebski, A. Dybko and Z. Brzozka, Microchim. Acta, 2013, 180, 895–901 CrossRef CAS PubMed.
- M. Hosokawa, T. Hayashi, T. Mori, T. Yoshino, S. Nakasono and T. Matsunaga, Anal. Chem., 2011, 83, 3648–3654 CrossRef CAS PubMed.
- F. Lin, W. Saadi, S. W. Rhee, S. J. Wang, S. Mittal and N. L. Jeon, Lab Chip, 2004, 4, 164–167 RSC.
- C. Kim, K. Lee, J. H. Kim, K. S. Shin, K. J. Lee, T. S. Kim and J. Y. Kang, Lab Chip, 2008, 8, 473–479 RSC.
- K. Lee, C. Kim, B. Ahn, R. Panchapakesan, A. R. Full, L. Nordee, J. Y. Kang and K. W. Oh, Lab Chip, 2009, 9, 709–717 RSC.
- N. Vasilakis, K. I. Papadimitriou, H. Morgan and T. Prodromakis, Sensors, 2019, 19, 911 CrossRef PubMed.
- B. M. Paegel, W. H. Grover, A. M. Skelley, R. A. Mathies and G. F. Joyce, Anal. Chem., 2006, 78, 7522–7527 CrossRef CAS PubMed.
- S. Ahrar, M. Hwang, P. N. Duncan and E. E. Hui, Analyst, 2014, 139, 187–190 RSC.
- C. Wang, S. Zhao, X. Zhao, L. Chen, Z. Tian, X. Chen and S. Qin, Biomicrofluidics, 2019, 13, 024105 CrossRef PubMed.
- T. H. Kim, C. J. Kim, Y. Kim and Y. K. Cho, Sens. Actuators, B, 2018, 256, 310–317 CrossRef CAS.
- K. Abi-Samra, R. Hanson, M. Madou and R. A. Gorkin, Lab Chip, 2011, 11, 723–726 RSC.
- J. M. Park, Y. K. Cho, B. S. Lee, J. G. Lee and C. Ko, Lab Chip, 2007, 7, 557–564 RSC.
- T. Kawai, N. Naruishi, H. Nagai, Y. Tanaka, Y. Hagihara and Y. Yoshida, 17th Int. Conf. Miniaturized Syst. Chem. Life Sci. MicroTAS, 2013, vol. 2, pp. 961–963 Search PubMed.
- H. Hwang, Y. Kim, J. Cho, J. Lee, M. S. Choi and Y. K. Cho, Anal. Chem., 2013, 85, 2954–2960 CrossRef CAS PubMed.
- D. J. Kinahan, S. M. Kearney, O. P. Faneuil, M. T. Glynn, N. Dimov and J. Ducrée, RSC Adv., 2015, 5, 1818–1826 RSC.
- M. Tang, X Huang, Q. Chu, X. Ning, Y. Wang, S. Kong, X. Zhang, G. Wang and H. Ho, Lab Chip, 2018, 18, 1452–1460 RSC.
- T. H. G. Thio, S. Soroori, F. Ibrahim, W. Al-Faqheri, N. Soin, L. Kulinsky and M. Madou, Med. Biol. Eng. Comput., 2013, 51, 525–535 CrossRef PubMed.
- M. Bauer, M. Ataei, M. Caicedo, K. Jackson, M. Madou and L. Bousse, Microfluid. Nanofluid., 2019, 23, 1–12 CrossRef.
- R. Gorkin, C. E. Nwankire, J. Gaughran, X. Zhang, G. G. Donohoe, M. Rook, R. O'Kennedy and J. Ducrée, Lab Chip, 2012, 12, 2894–2902 RSC.
- H. Hwang, H. H. Kim and Y. K. Cho, Lab Chip, 2011, 11, 1434–1436 RSC.
- D. J. Kinahan, S. M. Kearney, N. Dimov, M. T. Glynn and J. Ducrée, Lab Chip, 2014, 14, 2249–2258 RSC.
- P. Juelg, M. Specht, E. Kiphf, M. Lehnert, C. Eckert, T. Hutzenlaub, F. von Stetten, R. Zengerle and N. Paust, Lab Chip, 2019, 19, 2205–2219 RSC.
- B. S. Lee, Y. U. Lee, T. h. Kim, J. Park, J. G. Lee, J. Kim, H. Kim, W. G. Lee and Y. K. Cho, Lab Chip, 2011, 11, 70–78 RSC.
- T. Abe, S. Okamoto, A. Taniguchi, M. Fukui, A. Yamaguchi, Y. Utsumi and Y. Ukita, Anal. Methods, 2020, 12, 4858–4866 RSC.
- B. D. Henderson, D. J. Kinahan, J. Rio, R. Mishra, D. King, S. M. Torres-Delgado, D. Mager, J. G. Korvink and J. Ducrée, Biosensors, 2021, 11, 73 CrossRef CAS PubMed.
- I. J. Michael, T. H. Kim, V. Sunkara and Y. K. Cho, Micromachines, 2016, 7, 32 CrossRef PubMed.
- M. Yafia, O. Ymbern, A. O. Olanrewaju, A. Parandakh, A. S. Kashani, J. Renault, Z. Jin, G. Kim, A. Ng and D. Juncker, Nature, 2022, 605, 644–649 CrossRef PubMed.
- C. Carrell, I. Jang, J. Link, J. S. Terry, Z. Call, Y. Panraksa, O. Chailapakul, D. S. Dandy, B. J. Geiss and C. S. Henry, Anal. Methods, 2023, 15, 2721 RSC.
- J. S. Link, C. S. Carell, I. Jang, E. J. O. Barstis, Z. D. Call, R. A. Bellows, J. J. O'Donnell-Sloan, J. S. Terry, L. B. R. Anderson, Y. Panraksa, B. J. Geiss, D. S. Dandy and C. S. Henry, Anal. Chim. Acta, 2023, 1277, 311634 CrossRef PubMed.
- D. Vloemans, L. Van Hileghem, W. Verbist, D. Thomas, F. Dal Dosso and J. Lammertyn, Lab Chip, 2021, 21, 4445–4454 RSC.
- F. Dal Dosso, T. Kokalj, D. Spasic and J. Lammertyn, in Proceedings of the 20th International Conference on Miniaturized systems for Chemistry and Life Sciences. μTAS, 2016, pp. 990–991 Search PubMed.
- F. Dal Dosso, Y. Bondarenko, T. Kokalj and J. Lammertyn, Sens. Actuators, A, 2019, 287, 131–137 CrossRef CAS.
- F. Dal Dosso, T. Kokalj, J. Belotserkovsky, D. Spasic and J. Lammertyn, Biomed. Microdevices, 2018, 20, 44 CrossRef PubMed.
- F. Dal Dosso, L. Tripodi, D. Spasic, T. Kokalj and J. Lammertyn, ACS Sens., 2019, 4, 694–703 CrossRef CAS PubMed.
- P. K. Yuen and V. N. Goral, Lab Chip, 2010, 10, 384–387 RSC.
- K. Ward and Z. H. Fan, J. Micromech. Microeng., 2015, 25, 094001 CrossRef PubMed.
- J. Y. Lichtenberg, Y. Ling and S. Kim, Sensors, 2019, 19, 2488 CrossRef CAS PubMed.
- A. O. Olanrewaju, A. Robillard, M. Dagher and D. Juncker, Lab Chip, 2016, 16, 3804–3814 RSC.
Footnote |
| † Electronic supplementary information (ESI) available: Word document (.docx) with additional information on colorimetric characterization experiments on the dilution accuracy and non-specific binding behaviour of fluorescein in the microfluidic circuit. Video S1 illustrates the general working principle of the dilution module. Video S2 illustrates the fluorescence microscopy videos used for the assessment of the mixing efficiency in the mixing unit. Videos S3 and S4 show the reagent compatibility experiments with low surface tension liquids and whole blood samples. Video S5 shows the dilution process with whole blood sample. Video S6 illustrates the automated serial dilution process in the fully-integrated microfluidic chip driven by the SIMPLE pump. See DOI: https://doi.org/10.1039/d4lc00195h |
| This journal is © The Royal Society of Chemistry 2024 |