 Open Access Article
Creative Commons Attribution 3.0 Unported Licence
Novel fabrication of mixed wettability micromodels for pore-scale studies of fluid–rock interactions
Abdullah
AlOmier
 a,
Dongkyu
Cha
b,
Subhash
Ayirala
b,
Ali
Al-Yousef
b and
Hussein
Hoteit
 *a
*a
aPhysical Science and Engineering Division, King Abdullah University of Science and Technology (KAUST), Thuwal, Saudi Arabia. E-mail: Hussein.Hoteit@kaust.edu.sa
bEXPEC Advanced Research Center, Saudi Aramco, Dhahran, Saudi Arabia
First published on 23rd January 2024
Abstract
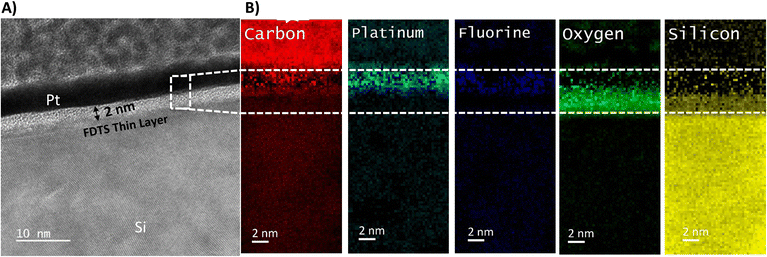
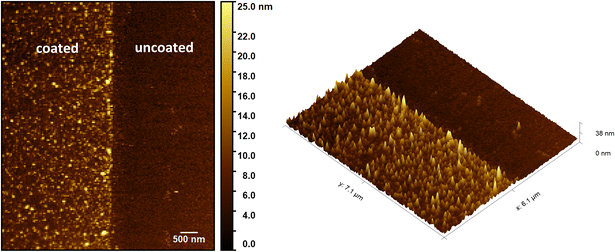
Wettability plays a crucial role in multiphase fluid flow in porous media, impacting various geological applications such as hydrocarbon extraction, aquifer remediation, and carbon dioxide sequestration. Microfluidic methods have attracted interest for their capacity to explore and visualize essential multiphase flow dynamics at the pore level, mimicking actual rock pore structures. However, creating micromodels with representative mixed wettability is currently a challenge. Existing technology is limited to producing micromodels with a singular wettability, either water-wet or oil-wet, leaving a gap in representing mixed-wet scenarios. In this study, we introduce a novel method to fabricate microfluidic devices with controlled spatial distribution of wettability at the micro-scale, mimicking actual configurations of mixed-wet rocks arising from varied mineralogy and pore structures. The proposed method combines the soft lithography process with thin film deposition techniques. The micromodels were designed to mimic the pore network of actual reservoir rocks, and a silicon substrate served as the foundation for the photolithography process optimization and wettability alteration methodology. Perfluorodecyltrichlorosilane coating was applied using molecular vapor deposition technology for surface wettability modification. The coated parts of the microdevice substrate altered the localized wetting state of the silicon towards hydrophobic, while the wettability remained unchanged in the non-coated areas. We utilized surface measurements, including contact angle, X-ray photoelectron spectroscopy, transmission electron microscopy, scanning electron microscopy, and atomic force microscopy, to assess the wettability, composition, thickness, shape, roughness, and overall quality of the coating. Our fabrication process successfully produced a microfluidics device with tailored mixed-wet attributes at the micro-scale, which is, to our best knowledge, the first achievement in the field. This method enables the replication of mixed-wet characteristics commonly seen in various applications, such as carbonates and shales within underground rocks, providing a more accurate examination of fundamental multiphase fluid dynamics and rock interactions at the pore level.
Introduction
Wettability is a critical rock–fluid property that exerts a substantial influence on multiphase flow dynamics, influencing a spectrum of geological applications, such as oil recovery,1,2 water infiltration processes,3 and carbon underground storage,4 among others. It plays a substantial role in rock–fluid interaction, impacting fundamental mechanisms like capillary pressures, relative permeabilities, residual saturations, and imbibition processes.5–7 These mechanisms drive the dynamics of fluid displacement, distribution, and capillary trapping.8,9 Therefore, understanding the complexity of rock wettability and fluid behavior at the pore level and alteration in the wettability of a solid surface is of broad interest.10,11Wettability refers to the relative affinity of a solid surface towards a fluid, which determines the ability of the fluid to spread over or adhere to the surface in the presence of other immiscible fluids.12 In porous media with uniform wettability and the presence of at least two immiscible fluids, the wetting fluid exhibits a stronger inclination to adhere to the surface. This preference dictates the interaction of the wetting and nonwetting fluids at the rock surface.13 The solid's affinity for a fluid undergoes significant variations depending on the fluid and rock properties within the reservoir. These variations occur at both microscopic and macroscopic scales, which pose limitations when attempting to categorize reservoirs as either strictly hydrophilic (water-wet) or hydrophobic (oil-wet).14 In the case of homogeneous wettability, the entire rock surface exhibits a uniform affinity for either water or oil. On the other hand, heterogeneous wettability (commonly referred to mixed, fractional, or spotted wettability) indicates the presence of distinct water and oil-wet regions coexisting on the surface of the porous media.15
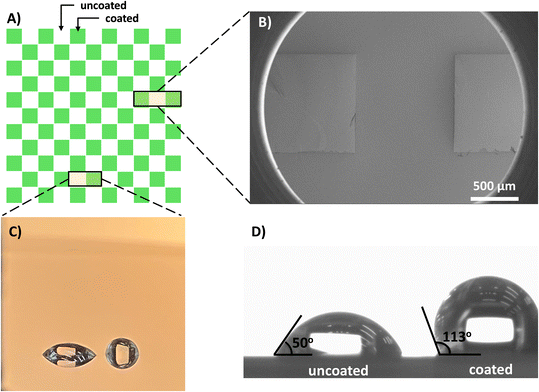
Numerous studies indicated that the majority of reservoir rocks tend to exhibit a mixed-wet nature.16 Rock wettability can be altered by the deposition of adsorbable organic components, such as asphaltenes.17–19 Therefore, different regions of the rock can have varying wettability properties caused by the presence of certain surface-active components, which can alter the surface chemistry of the rock. Furthermore, the rock's pore composed of multiple minerals can possess different surface chemistry and adsorption properties, leading to heterogeneous wettability.20,21Fig. 1 shows a thin section of a rock with different mineral compositions. Different organic (e.g., kerogen) and non-organic (e.g., calcite, quartz, clay) matters coexist within the core sample, leading to spatial variations in the rock surface affinity toward different fluids.
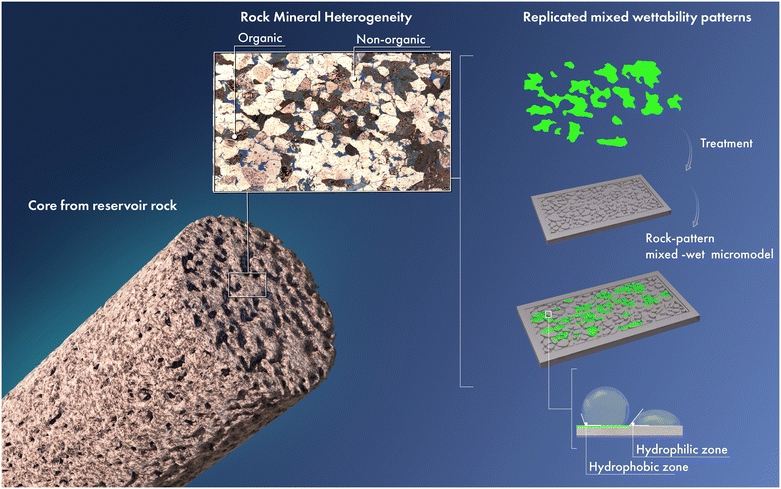 | ||
| Fig. 1 Schematic illustration of a micromodel with spatial wettability variation mimicking a thin section of a reservoir rock with heterogeneous mineralogy. | ||
The presence of heterogeneous (mixed) wettability distribution within natural rock formations introduces complexity to fluid flow dynamics, particularly in multiphase flow scenarios. While the existence of mixed wettability is known in the literature, its pore-scale effects on fluid flow are not fully understood.23 Recent studies on multiphase fluid flow in porous formations with mixed wettability have shown a significant impact on capillary pressure and saturation distribution,24–29 which may lead to variations in reservoir performance. The complexity of mixed wettability makes it challenging to accurately assess its impact, as it may get confused with single water-wet and oil-wet scenarios.32 Therefore, incorporating mixed wettability into pore network models, supported by representative experiments, is key to reducing uncertainties and improving predictions of pore-scale models.29–31 Establishing a robust platform that allows for pore-scale observation and studies under representative conditions of mixed wettability systems is of broad interest.22
Core-flood experiments, traditionally used to study mixed wettability effects on subsurface rock flow, face limitations. These experiments are time-intensive, and the core material's opaqueness prevents direct observation, leading to reliance on core outlet data which could miss key flow physics within the core. Although 3D X-ray microtomography has improved our understanding of multiphase flow in porous media,33–35 core-scale experiments remain costly, time-intensive, and interpretation is limited by X-ray imaging constraints.
Microfluidics, on the other hand, has emerged as a promising technology to study various aspects of multiphase fluid flow at the pore scale. It has gained attention due to its ability to mimic representative pore-size models and capture detailed observations of fluid dynamics within the porous network of rocks at high spatial resolution.36–39 Microfluidics also enables rapid, precise, and real-time analysis of fluid transport and phase behavior.40–44 Micromodel substrates are utilized as 2D proxies to represent the complex 3D porous structures found in rocks, simplifying the analysis of pore-scale mechanisms. These 2D models, despite not completely replicating 3D flow and transport effects like the percolation threshold, offer a controlled environment with precise pore geometries. This control reduces the uncertainties present in natural 3D media and enables direct observation of fluid behaviors at the pore level.45 Furthermore, the ability to produce identical models enhances the reproducibility of experiments, allowing for more consistent and reliable comparisons between different studies.
Standard microfluidic devices are primarily fabricated using materials like silicon, glass, and polymers, which may not fully replicate the physical and geochemical properties of natural rocks.46 Several studies reported diverse approaches and materials employed to modify the surface wettability of micromodels, aiming to replicate the properties and behavior of reservoir rocks.47 On the other hand, the establishment of micromodels with precisely controlled mixed wettability properties remains an unresolved challenge. Limited literature has documented efforts to construct micromodels with engineered materials to achieve mixed-wet characteristics. Zhao et al. introduced a technique to tune the wettability of photocurable thiolene-based microfluidic devices by adjusting the ultraviolet (UV) exposure, creating a uniform wetting state.48 Lee et al. introduced a technique using UV-initiated polymer grafting to copolymerize hydrophilic and oleophilic microstructures through a bottom-up fabrication approach.49 However, this technique is not fully representative of mixed wettability where different water-wet and oil-wet regions coexist on the same pore surface. In another study, Chang et al. employed octadecyl-trichlorosilane dissolved in hexane as an invading fluid to alter the wettability of an ethylene glycol-saturated micromodel. This process yielded heterogeneous micromodel systems with partially coated surfaces exhibiting mixed-wet properties.50 However, a notable limitation of this work lies in the lack of precise control over the location of wettability alteration and the reproducibility of data. In recent work, Irannezhad et al. made improvements by employing UV-ozone treatment to generate distinct water-wet clusters within oil-wet porous media. This work offered valuable insights into the characteristics and intricacies of mixed-wet porous media.51 The challenge of attaining precise, selective mixed-wet properties, particularly on complex and irregular surfaces, remains an ongoing challenge. This entails careful selection of material, deposition methodologies, and surface treatment processes to establish the desired mixed-wet conditions.
This study introduces a new advanced method for fabricating microfluidic models with customized mixed-wettability surfaces, enabling precise spatial control over mixed wettability distribution. The proposed technique integrates the photolithography process and thin film deposition as part of a nanofabrication approach. Perfluorodecyltrichlorosilane (FDTS) was chosen for deposition due to its effective reduction of adhesion on micro/nanostructures, creating hydrophobic coatings on silicon surfaces.52 This work marks the first instance of fabricating a mixed-wet micromodel system, holding promise for replicating the actual wettability configuration of an oil reservoir at the pore scale. The unique aspect of this work is the ability to precise control the size, shape, and location of both hydrophilic and hydrophobic regions on the surface of complex micromodel patterns, achieving high resolution down to 1 μm. The technique relies on highly reliable and controlled nanofabrication, positioning it as an integrable method for microfluidics nanofabrication. It accommodates various wettability alteration designs, fostering a broad spectrum of studies on two-phase flow under controlled conditions. Such a comprehensive workflow is pivotal for gaining insights into wettability-dependent phenomena at both microscopic and macroscopic levels. Moreover, its applications extend beyond multiphase fluid flow in porous media to encompass fluid–surface interactions in biology, biomedical research, and electronics.
Background
Wettability
Contact angle measurements are commonly employed to evaluate surface wettability, involving the quantification of angles formed at the interface between the solid surface and coexisting fluids. These measurements offer insights into the interfacial tensions between the fluids and the solid, facilitating the assessment of surface wettability. The contact angle is typically determined based on the denser phase, often water, and is governed by Young's equation, which establishes a relationship between the contact angle and interfacial tensions:53 | (1) |
Surface silanization
Among numerous surface coating and modification methods, self-assembled monolayer (SAM), composed of organosilanes, exhibit significant potential for wettability alteration. Their notable attributes include excellent bonding strength, low surface energy, minimal friction forces, and high thermal stability, rendering them highly attractive for various applications.54 Organosilane SAM is an organic thin film of molecular assemblies, typically a few nanometers thick, formed by the spontaneous adsorption of molecules onto a substrate surface.55 Organosilane SAM can be deposited from either liquid or vapor processes. Although liquid-phase SAM growth is more commonly employed, it is associated with notable drawbacks, including complexity in process control, the potential for influent solution contamination, and reduced deposition efficiency.56In contrast, vapor-phase deposition, which eliminates the need for solvents, addresses the limitations of liquid-based processes. Vapor-phase deposition offers precise control over precursor chemistry, ensuring the desired hydrophobic properties. It facilitates efficient mass transport, leading to optimal coating uniformity and excellent coverage, even on high-aspect-ratio structures. Additionally, self-limiting surface reactions in vapor-phase deposition result in durable and conformal monolayer coverage.57 Consequently, the vapor-phase deposition has been chosen as the preferred deposition technique in this study.
FDTS deposition mechanism
FDTS, an organosilane precursor, possesses a trichlorosilane-based head group and an aliphatic fluorinated tail. The FDTS SAM deposition process starts with a hydrated silicon surface, where the presence of hydroxyl (OH) groups on the oxidized surface provides reactive sites for the formation of the chlorosilane SAM. In the initial step, the active trichlorosilane head groups (–SiCl3) undergo hydrolysis via water vapor (H2O) to form silanol groups (Si–OH). Subsequently, in the second step, the molecules' chains anchor and chemically bond to the substrate surface through the reaction of (–SiOH) groups with (–OH) groups on the hydrated silicon substrate, forming a highly stable covalent bond. The adsorbed molecules assemble and organize spontaneously on the surface. Assembled chains on the surface pack tightly with each other by lateral bonding due to van der Waals forces. The FDTS SAM film continues to grow until the substrate is fully covered by the single monolayer, as illustrated in Fig. 2.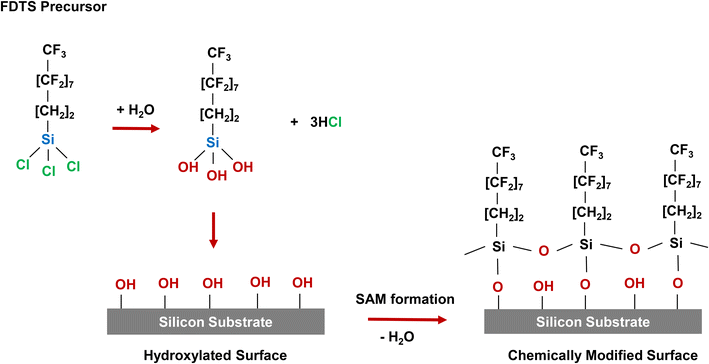 | ||
| Fig. 2 Illustration of surface modification by FDTS and formation of FDTS SAM film on a silicon surface. FDTS precursors hydrolyze and chemically bond to the hydrated silicon surface. The adsorbed molecules assemble spontaneously on the surface and continues to grow until FDTS SAM film fully covering the surface (modified from ref. 58). | ||
Materials and experimental procedure
Materials
Deionized water (DI) was acquired from the Milli-Q water purification system provided by MilliporeSigma Company. The substrate used as a base for fabrication consisted of a 4-inch P-type (B-doped) prime-grade silicon wafer with a thickness of 525 ± 20 μm and an ohmic resistance of 10–20 ohm cm. The light-sensitive materials (AZ nLOF 2070 photoresists) were provided by Microchemicals. Hexamethyldisilazane (HMDS) was used as an adhesion promoter of photoresist to the silicon surface. AZ 726 MIF photoresist developer for fast and homogeneous substrate wetting and photoresist removal was obtained from Merck. The silicon substrate underwent cleaning using a Piranha acidic solution, composed of a mixture of 3 parts 96% vol. sulfuric acid (H2SO4) and 1 part 30% vol. hydrogen peroxide (H2O2). Additionally, a buffered oxide etch (BOE) was employed, which consists of a blend of hydrofluoric acid (HF) and ammonium fluoride (NH4F). Perfluorodecyltrichlorosilane (FDTS) obtained from Gelest was employed for coating. The n-methyl-2-pyrrolidone (NMP) and isopropyl alcohol (IPA) solvents were used for photoresist lift-off.Mixed wettability coating and fabrication methodology
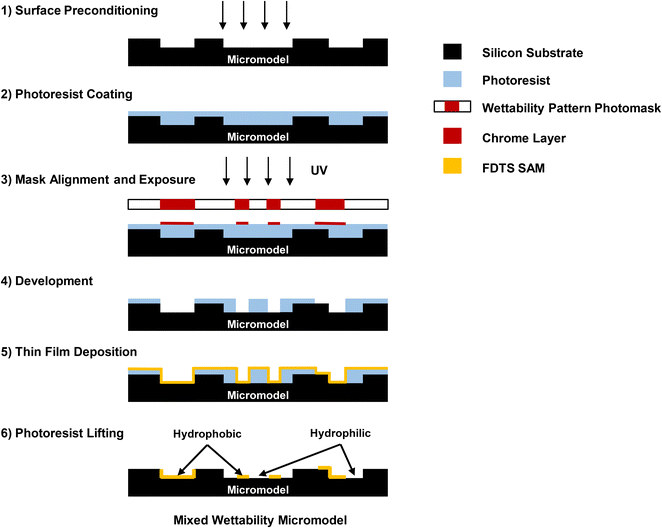
The proposed methodology presents a novel approach to fabricating micromodels with mixed wettability. It combines both the photolithography process and thin film deposition technique, utilizing a nanofabrication approach. A silicon substrate served as the foundation for the photolithography process optimization and wettability alteration methodology. This method allows for the creation of hydrophobic surfaces in specific regions by modifying the original wetting surface properties of the silicon substrate. The alteration of surface wettability is achieved by selectively applying a hydrophobic FDTS SAM on top of the micromodel surface. The shape, size, and placement of the deposited layer are precisely controlled using a wettability pattern control photomask, which guides the deposition process by replicating the provided patterns. To induce the wettability alteration on the surface, predefined wettability patterns are initially designed on a photomask using CleWin5 software. The physical photomask is created by directly writing the digital design and performing high-resolution laser patterning on a five-inch glass plate coated with a 100 nm-chrome layer using the Heidelberg DWL 2000 laser lithography system. The fabricated wettability photomask is transparent, with chrome patterns defining the wettability distribution. This allows the light to shine only through unmasked transparent areas while being blocked in the covered areas with chrome, which controls the required wettability features. Fig. 3 provides a detailed description of the workflow employed to establish the selective surface coating and fabricate the mixed wettability micromodel surface.The workflow consists of six main steps:
- In the first step, the surface of micromodel is preconditioned by cleaning the substrate using a piranha solution at T = 115 °C for 10 minutes to remove contamination. Additionally, it is an effective method to create an OH-terminated surface. This oxidation process is essential for achieving a high-quality SAM coating.54 The substrate is then dehydrated by baking at T = 150 °C for 10 minutes on direct contact hotplate to eliminate surface moisture. To facilitate photoresist adhesion to the substrate surface, the surface is activated with an HMDS adhesion promoter at T = 150 °C in vacuum chamber.
- In the second step, the surface is spin-coated with a 7 μm layer of AZ-nLOF 2070 negative photoresist at 2500 rpm spinning speed. The thickness of the photoresist is optimized based on the viscosity of the photoresist and the spinning speed to ensure that the photoresist evenly covers the micromodel patterns, allowing for controlled lithography fabrication. The substrate is soft baked at T = 110 °C for 90 seconds on a direct contact hotplate to remove volatile solvents from the photoresist after coating.
- In the third step, precise alignment of the wettability photomask onto the substrate is achieved using high resolution EVG 6200 Double-side Mask Aligner. Alignment marks are applied to ensure that the wettability patterns are placed accurately on the desired location of the micromodel surface. UV light is subsequently applied to the photoresist-coated wafer through the chrome mask (exposure dose 200 mJ cm−2, hard mask contact mode, 80 μm mask/wafer separation gap). This exposure selectively exposes the photoresist not covered by the chrome in the mask, facilitating the transfer of wettability geometric patterns from the photomask to the photoresist material on the substrate. The exposed photoresist under the transparent pattern of the photomask remains undegraded and insoluble to a photoresist developer, while the unexposed photoresist shield by chrome patterns becomes degraded and soluble to the developer. The substrate is placed on a direct contact hotplate for post-exposed baking at T = 110 °C for 90 seconds.
- In the fourth step, a bath of AZ-726 photoresist developer is used to selectively remove the photoresist material from the unexposed areas. This selective removal of the unexposed photoresist exposes targeted areas on the substrate surface for hydrophobic coating with precise size, shape, and location.
- The fifth step involves applying a non-selective hydrophobic coating to the entire surface, encompassing both cleared and uncleared regions of the photoresist, using the molecular vapor deposition (MVD) technique. FDTS deposition is conducted utilizing ASMT MVD 100E, a microprocessor-controlled sequential depositor. This process occurs within a controlled gaseous phase, maintained in a precisely regulated environment, ensuring thorough and uniform coverage of the surface. The substrate is placed inside a vacuum chamber and purged multiple times with nitrogen gas. The surface is first activated by O2 plasma treatment, and then water vapor is introduced as a catalytic agent. The substrate surface is hydrated by quick adsorption of a water film to promote the attachment of FDTS precursor. FDTS precursors are introduced into the chamber, where a reaction occurs between the activated surface and the reactive precursors. The coating process is carried out at a controlled pressure, which is related to the vapor pressure of the FDTS precursor. The chamber temperature is maintained at T = 35 °C, slightly higher than the ambient temperature to prevent condensation of reactants. The concentrations of the precursors, as well as the reaction time, are carefully controlled to ensure a saturated and fully coated surface. In this process, the photoresist layer acts as a protective barrier to the remaining surface during the coating process.
- In the last step, the photoresist layer is removed by immersing the substrate in a bath of NMP solvent bath at T = 80 °C to lift off the remaining photoresist. Then the substrate cleaned in IPA bath and rinsed with DI water. This step reinstates the original hydrophilic nature of the silicon surface beneath the photoresist layer, preserving the sections directly coated with FDTS. Consequently, a mixed wettability model is established, where the regions coated with FDTS exhibit hydrophobic properties, while the areas without FDTS deposition retain hydrophilicity.
Results and discussion
The proposed fabrication method was applied to establish mixed wettability micromodel surfaces at the microscale on both plane and pattern surfaces with etched features. The methodology was evaluated using several characterization techniques to investigate the quality and characteristics of the deposited FDTS SAM to alter the substrate wettability.Contact angle measurements and wettability assessments
The wettability of the unaltered silicon substrates was initially evaluated to establish the measurement baseline. Sessile drop contact angle measurements using Kruss DSA100 Drop Shape Analyzer system were conducted under ambient conditions to assess the surface and coating macroscopic properties. The average measured contact angle between water and air for a typical sessile droplet with volume of V ≈ 3 μL on a non-treated silicon substrate was θ = 50°, confirming that the silicon substrate is originally hydrophilic. The silicon surface wettability might differ slightly depending on the surface finishing and treatment. The surface hydrophilicity is a result of the thin native oxide layer (SiO2) covering the surface created by oxidation reaction in the air.59As the chemistry of the silicon substrate could have an influence on the thin film deposition and growth process, an investigation was carried out to assess the effect of the cleaning method on the wettability of the silicon surface. The surface cleaned with piranha solution exhibited a lower contact angle of θ = 3°. This increased hydrophilicity was attributed to surface oxidation and the formation of individual and linked (–OH) groups on the surface, as reported by ref. 60. However, it is important to note that this enhanced surface wettability was not enduring, as the contact angle increased over time due to carbon contamination when exposed to the atmosphere.59
Applying an FDTS SAM coating to the silicon surface transformed it into a permanent hydrophobic surface, as evidenced by a measured contact angle of θ = 113°. This marked a substantial change from the original hydrophilic silicon surface, which had a contact angle of θ = 50°. The observed decrease in silicon surface energy is attributed to the presence of a strongly fluorinated tail within the FDTS monolayer.
Sensitivity of coating to pre-treatment
Several experiments were conducted to assess the sensitivity of the deposited FDTS thin layer to surface pre-treatment with piranha, BOE, oxygen plasma, and HDMS, which are commonly used surface conditioning steps during any lithography process. The results of these experiments are summarized in Table 1, confirming a robust FDTS coating. Both piranha and oxygen plasma treatments used to enrich the surface with oxides did not cause further improvement of FDTS SAM deposition. On the other hand, the removal of surface oxides with BOE had no impact on FDTS SAM deposition as surface hydroxylation is already induced by water vapor, the second precursor, during the deposition process. Furthermore, the surface treatment with HDMS, which is usually used to activate the surface during the lithography process, did not affect FDTS adhesion to the silicon substrate.| Sample | Contact angle (degree) |
|---|---|
| FDTS | 113 |
| Piranha + FDTS | 109 |
| BOE + FDTS | 112 |
| Oxygen plasma + FDTS | 113 |
| HDMS + FDTS | 110 |
Preservation of the wettability alteration
The FDTS-coated surfaces were exposed to ambient conditions in a clean environment for over a month. Results revealed no significant change in the hydrophobicity of the coated surface, where consistent contact angles were obtained, as shown in Fig. 4. This indicates that the chemical stability of the coating is well established through strong bonding with the surface. The stability observed over several months can be attributed to the absence of substrate oxidation in the surrounding atmosphere, providing clear evidence of the terminated functionality of the grafted FDTS chains. Notably, even with water immersion, there was no detachment due to the penetration of polar molecules through the film, which could disrupt the bonding between the coating and the target surface. Additionally, the film exhibited robust stability when exposed to NMP and IPA solvents, commonly used in the photolithography fabrication process to remove residual photoresist. The results align with previously reported findings for similar coatings.52,57,61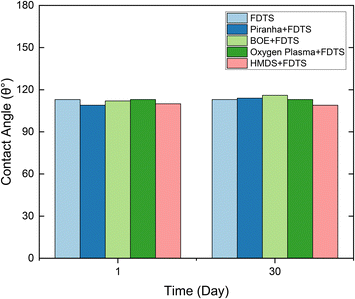 | ||
| Fig. 4 Water/air contact angles on FDTS coating aged over 30 days at ambient conditions, which revealed stable wettability with different pretreatments. | ||
Surface characterization
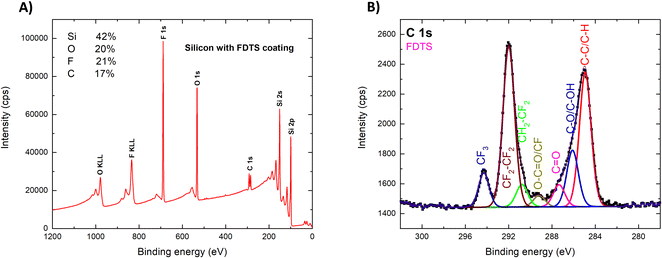
Fig. 5B displays a detailed compositional analysis of the C 1s peak. The XPS spectrum of C 1s confirms the presence of various carbon-related functional groups on the surface. The intense C–C/C–H peak indicates the presence of aliphatic bonds, characteristic of the backbone of the FDTS film. However, it should be noted that there is an additional carbon-related signal present in the spectrum due to hydrocarbon contamination resulting from exposure to air. This contamination is responsible for the appearance of peaks associated with C–O, carbonyl, and carboxyl groups. In addition to the aliphatic bonds and hydrocarbon contamination, the spectrum exhibits peaks corresponding to carbon–fluorine (C–F) bonds. A CF2 peak indicates the presence of the CF2 functional backbone group, while the CF3 peak suggests the presence of a tail group with three fluorine atoms. The high intensity of the CF2 peak is due to the deposition of long fluorine chains on the surface. The observed peaks in the XPS spectrum are indicators of the completion of the chemical reaction. The present elements on the surface are consistent with the expected chemical composition of the deposited FDTS film, confirming the presence of carbon, oxygen, silicon, and fluorine elements on the surface.
Assessment of mixed wettability
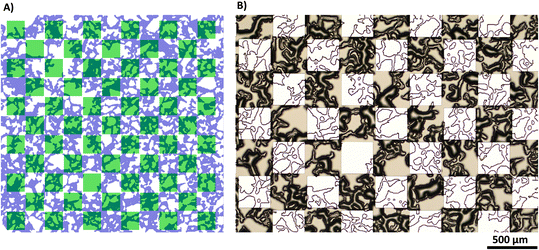
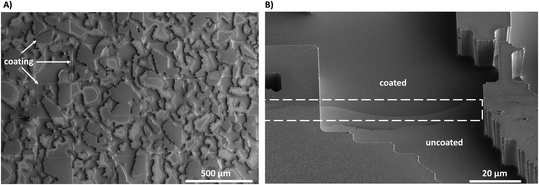
To validate the effectiveness of the proposed method for achieving mixed wettability, we conducted tests on both a flat surface and a more complex micro-model.Fig. 10A shows a top-view image of the fabricated mixed-wet system using SEM. The image highlights the accurate placement of the selected coated zones on the top of the micromodel at the microscale. The size, shape, and location of these regions precisely match the predetermined design of wettability patterns. Fig. 10B displays a zoomed image of a narrow channel within the micromodel, which demonstrates the coating of all small features with an average depth dimension of 14.5 μm. This included the precise coating of all surfaces positioned beneath the wettability patterned shadow. The image illustrates the distinction between the coated and uncoated areas, affirming the successful achievement of a conformal coating with uniform coverage along the edges for both the body and wall surfaces of the channels.
Flow in single mixed-wet channel
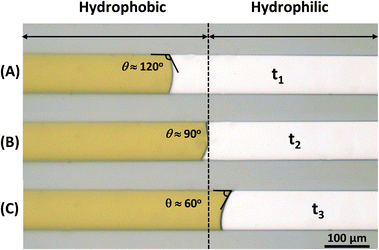
To assess the efficacy of the introduced coating method in microfluidics, a basic flow-through experiment was conducted to observe the influence on fluid behavior and dynamic contact angle. A 100 μm capillary channel with two wettability configurations was prepared following the proposed fabrication protocol. Fig. 11 displays the microscale model, divided into two distinct regions: one half, on the left side, exhibits hydrophobic properties, while the other is hydrophilic. DI water, colored for visualization clarity, was introduced into the channels. Observations were made at different time intervals (t1, t2, and t3) to monitor the fluid's progression. At t1, the fluid is still within the hydrophobic region (Fig. 11A). At t2, the fluid is approximately at the interface between the hydrophobic and hydrophilic regions (Fig. 11B), and at t3, the fluid is within the hydrophilic region (Fig. 11C). During these three stages, the water's meniscus undergoes transitions from a convex shape (θ = 120°) in the hydrophobic region, almost neutral (θ = 90°) at the interface, to a concave shape (θ = 60°) in the hydrophilic region. While the meniscus displays a transient shape at the interface between the hydrophobic and hydrophilic regions due to changes in the wetting state, the noticeable variation in the apparent contact angle of water signifies a clear influence of distinct surface wettability on the behavior of the fluid displacement front in the meniscus. These observations underscore the efficacy of the method in precisely controlling the wettability of the micromodel.Conclusions
The work introduces a novel methodology for creating microfluidic devices with mixed-wettability surfaces. This technology allows for precise placement of hydrophilic and hydrophobic zones at the pore scale, effectively representing the complex mixed wettability observed in reservoir rocks. In contrast to other surface modified manufacturing method of micromodels, our approach provides several notable advantages, including stable, controlled, reliable, and reproducible fabrication. This ensures the execution of robust experiments with precise control over wettability. Our method integrates soft lithography with thin-film deposition techniques. Using a silicon substrate, we optimized the photolithography process and altered wettability through perfluorodecyltrichlorosilane coating via molecular vapor deposition. This process made specific microdevice areas hydrophobic while keeping others unchanged. To evaluate the coating's effectiveness, we measured contact angle, X-ray photoelectron spectroscopy, and various microscopy techniques, which confirmed the effectiveness of the proposed method. While the current work focuses on altering wettability within reported ranges of contact angles, the technology holds the potential for extension to achieve customized contact angles by employing different coating materials while following the same methodology. Finally, this work serves as a demonstration of the technique's capabilities and highlights its potential for various applications, such as microfluidics, lab-on-a-chip devices, and biomimetic systems. Future work will focus on applying this method in varied contexts, such as multiphase fluid flow and CO2 sequestration.Abbreviations
| FDTS | Perfluorodecyl-trichlorosilane |
| UV | Ultraviolet |
| SAM | Self-assembly monolayer |
| DI | Deionized water |
| HMDS | Hexamethyldisilazane |
| BOE | Buffered oxide etch |
| NMP | n-Methyl-2-pyrrolidone solvent |
| IPA | Isopropyl alcohol |
| XPS | X-ray photoelectron spectroscopy |
| TEM | Transmission electron microscopy |
| AFM | Atomic force microscopy |
| SEM | Scanning electron microscopy |
| RMS | Root mean square roughness |
Author contributions
Abdullah AlOmier: methodology, investigation, fabrication, experiments, visualization, data analysis, writing – original draft. Dongkyu Cha: conceptualization, methodology, data analysis, writing – review & editing. Subhash C. Ayirala: data analysis, verification, writing – review & editing. Ali Al-Yousef: verification, supervision, editing and review. Hussein Hoteit: supervision, methodology, verification, writing – review & editing.Conflicts of interest
There are no conflicts of interest to declare.Acknowledgements
The authors express their gratitude to KAUST Core Labs for their support and provision of essential facilities for conducting this research. Special thanks to KAUST Communication and Publication Services, and to Ana Bigio, for the excellent support in drafting the artwork in Fig. 1.References
- D. W. Green and G. P. Willhite, Enhanced Oil Recovery, Society of Petroleum Engineers, 2018 Search PubMed.
- A. C. Lowe, M. C. Phillips and A. C. Riddiford, On the Wetting of Carbonate Surfaces by Oil and Water, J. Can. Pet. Technol., 1973, 12 DOI:10.2118/73-02-04.
- Z. Wang, J. Feyen, D. R. Nielsen and M. T. Van Genuchten, Two-phase Flow Infiltration Equations Accounting for Air Entrapment Effects, Water Resour. Res., 1997, 33, 2759–2767 CrossRef.
- A. S. Al-Menhali and S. Krevor, Capillary Trapping of CO2 in Oil Reservoirs: Observations in a Mixed-Wet Carbonate Rock, Environ. Sci. Technol., 2016, 50, 2727–2734 CrossRef CAS PubMed.
- W. G. Anderson, Wettability Literature Survey- Part 6: The Effects of Wettability on Waterflooding, JPT, J. Pet. Technol., 1987, 39, 1605–1622 CrossRef CAS.
- W. G. Anderson, Wettability Literature Survey - Part 5: The Effects of Wettability on Relative Permeability, JPT, J. Pet. Technol., 1987, 39, 1453–1468 CrossRef CAS.
- W. G. Anderson, Wettability Literature Survey - Part 4: Effects of Wettability on Capillary Pressure, JPT, J. Pet. Technol., 1987, 39, 1283–1300 CrossRef CAS.
- W. G. Anderson, Wettability Literature Survey - Part 1: Rock/Oil/Brine interactions and the Effects of Core Handling on Wettability, JPT, J. Pet. Technol., 1986, 38, 1125–1144 CrossRef CAS.
- Y. Tanino and M. J. Blunt, Laboratory Investigation of Capillary Trapping Under Mixed-wet Conditions, Water Resour. Res., 2013, 49, 4311–4319 CrossRef.
- L. Lake, R. Johns, B. Rossen and P. Gary, Fundamentals of Enhanced Oil Recovery, Society of Petroleum Engineers, Richardson, TX, 1st edn, 2014 Search PubMed.
- C. Liang, L. Xiao, Z. Jia, L. Guo, S. Luo and Z. Wang, Mixed Wettability Modeling and Nuclear Magnetic Resonance Characterization in Tight Sandstone, Energy Fuels, 2023, 37, 1962–1974 CrossRef CAS.
- P. G. De Gennes, Wetting: Statics and Dynamics, Rev. Mod. Phys., 1985, 57, 827–863 CrossRef CAS.
- J. C. Parker, Rev. Geophys., 1989, 27, 311–328 CrossRef.
- N. R. Morrow, Wettability and its effect on oil recovery, JPT, J. Pet. Technol., 1990, 42, 1476–1484 CrossRef CAS.
- C. J. Radke, A. R. Kovscek and H. Wong, A Pore-Level Scenario for the Development of Mixed Wettability in Oil Reservoirs, SPE Annual Technical Conference and Exhibition, 1992 Search PubMed.
- R. A. Salathiel, Oil Recovery by Surface Film Drainage in Mixed-Wettability Rocks, JPT, J. Pet. Technol., 1973, 25, 1216–1224 CrossRef.
- M. O. Denekas, C. C. Mattax and G. T. Davis, Effects of Crude Oil Components on Rock Wettability, Transactions of the AIME, 1959, 216, 330–333 CrossRef.
- A. R. Kovscek, H. Wong and C. J. Radke, A Pore-level Scenario for the Development of Mixed Wettability in Oil Reservoirs, AIChE J., 1993, 39, 1072–1085 CrossRef CAS.
- R. S. Al-Maamari, S. U. Qaboos and J. S. Buckley, Asphaltene Precipitation and Alteration of Wetting: The Potential for Wettability Changes During Oil Production, 2003.
- R. J. S. Brown, I. Fatt and M. Athie, Measurements of Fractional Wettability of Oil Fields' Rocks by the Nuclear Magnetic Relaxation Method, 1956.
- I. Fatt, W. A. Aime and J. R. Klikoff, Effect of Fractional Wettability on Multiphase Flow Through Porous Media, J. Pet. Technol., 1959, 11, 71–76 CrossRef.
- A. AlOmier, A. Sugar, D. Cha, S. Ayirala, M. Alotaibi, A. Yousef and H. Hoteit, Novel Mixed Wettability Coating: Application in Microfluidics Fabrication, SPE Annual Technical Conference and Exhibition, 2022 Search PubMed.
- A. M. Alhammadi, A. Alratrout, K. Singh, B. Bijeljic and M. J. Blunt, In Situ Characterization of Mixed-Wettability in a Reservoir Rock at Subsurface Conditions, Sci. Rep., 2017, 7(1) DOI:10.2118/210141-MS.
- Q. Lin, B. Bijeljic, S. Berg, R. Pini, M. J. Blunt and S. Krevor, Minimal Surfaces in Porous Media: Pore-scale Imaging of Multiphase Flow in an Altered-wettability Bentheimer Sandstone, Phys. Rev. E, 2019 DOI:10.1103/PhysRevE.99.063105.
- A. M. Alhammadi, Y. Gao, T. Akai, M. J. Blunt and B. Bijeljic, Pore-Scale X-Ray Imaging with Measurement of Relative Permeability, Capillary Pressure and Oil Recovery in a Mixed-Wet Micro-Porous Carbonate Reservoir Rock, Fuel, 2020, 268, 117018 CrossRef CAS.
- A. Alhosani, A. Selem, S. Foroughi, B. Bijeljic and M. J. Blunt, Steady-state Three-phase Flow in a Mixed-wet Porous Medium: A Pore-Scale X-ray Microtomography Study, Adv. Water Resour., 2023, 172, 104382 CrossRef.
- A. Scanziani, Q. Lin, A. Alhosani, M. J. Blunt and B. Bijeljic, Dynamics of Fluid Displacement in Mixed-wet Porous Media, Proc. R. Soc. A, 2020 DOI:10.1098/rspa.2020.0040.
- S. Zou, R. T. Armstrong, J. Y. Arns, C. H. Arns and F. Hussain, Experimental and Theoretical Evidence for Increased Ganglion Dynamics During Fractional Flow in Mixed-Wet Porous Media, Water Resour. Res., 2018, 54, 3277–3289 CrossRef.
- M. Rücker, W. B. Bartels, K. Singh, N. Brussee, A. Coorn, H. A. van der Linde, A. Bonnin, H. Ott, S. M. Hassanizadeh, M. J. Blunt, H. Mahani, A. Georgiadis and S. Berg, The Effect of Mixed Wettability on Pore-Scale Flow Regimes Based on a Flooding Experiment in Ketton Limestone, Geophys. Res. Lett., 2019, 46, 3225–3234 CrossRef.
- T. Akai, A. M. Alhammadi, M. J. Blunt and B. Bijeljic, Modeling Oil Recovery in Mixed-Wet Rocks: Pore-Scale Comparison Between Experiment and Simulation, Transp. Porous Media, 2019, 127, 393–414 CrossRef CAS.
- S. Foroughi, B. Bijeljic, Q. Lin, A. Q. Raeini and M. J. Blunt, Pore-by-pore Modeling, Analysis, and prediction of two-phase Flow in Mixed-wet Rocks, Phys. Rev. E, 2020 DOI:10.1103/PhysRevE.102.023302.
- A. M. Saad, M. P. Yutkin, C. J. Radke and T. W. Patzek, Pore-Scale Spontaneous Imbibition at High Advancing Contact Angles in Mixed-Wet Media: Theory and Experiment, Energy Fuels, 2022, 36(11), 5647–5656 CrossRef CAS.
- A. Alhosani, A. M. Selem, Q. Lin, B. Bijeljic and M. J. Blunt, Disconnected Gas Transport in Steady-State Three-Phase Flow, Water Resour. Res., 2021 DOI:10.1029/2021WR031147.
- D. Wildenschild and A. P. Sheppard, X-ray Imaging and Analysis Techniques for Quantifying Pore-Scale Structure and Processes in Subsurface Porous Medium Systems, Adv. Water Resour., 2013, 51, 217–246 CrossRef.
- T. Bultreys, W. De Boever and V. Cnudde, Imaging and Image-based Fluid Transport Modeling at the Pore Scale in Geological Materials: A Practical Introduction to the Current State-of-the-art, Earth-Sci. Rev., 2016, 155, 93–128 CrossRef.
- M. Buchgraber, A. R. Kovscek and L. M. Castanier, A Study of Microscale Gas Trapping Using Etched Silicon Micromodels, Transp. Porous Media, 2012, 95, 647–668 CrossRef CAS.
- M. Buchgraber, M. Al-Dossary, C. M. Ross and A. R. Kovscek, Creation of A Dual-porosity Micromodel for Pore-level Visualization of Multiphase Flow, J. Pet. Sci. Eng., 2012, 86–87, 27–38 CrossRef CAS.
- A. Anbari, H. T. Chien, S. S. Datta, W. Deng, D. A. Weitz and J. Fan, Microfluidic Model Porous Media: Fabrication and Applications, Small, 2018, 14, 1–15 CrossRef PubMed.
- H. Hoteit, A. Sugar, S. Habuchi, M. Serag, U. Buttner and M. Fahs, Novel Approach to Model and Visualize the Transport of Polymer Molecules in Porous Media Using Microfluidics, IOR 2021 - 21st European Symposium on Improved Oil Recovery, 2021, vol. 2021, pp. 1–12 Search PubMed.
- B. Bao, J. Riordon, F. Mostowfi and D. Sinton, Microfluidic and Nanofluidic Phase Behaviour Characterization for Industrial CO2, Oil and Gas, Lab Chip, 2017, 17, 2740–2759 RSC.
- A. Sugar, M. F. Serag, V. A. Torrealba, U. Buttner, S. Habuchi and H. Hoteit, Visualization of polymer retention mechanisms in porous media using microfluidics, SPE Europec, 2020 Search PubMed.
- A. Sugar, V. Torrealba, U. Buttner and H. Hoteit, Assessment of Polymer-Induced Clogging Using Microfluidics, SPE J., 2021, 26, 3793–3804 CrossRef CAS.
- V. Torrealba, A. Sugar, U. Buttner and H. Hoteit, Integrated Microfabrication-Microfluidics Workflow: Application for Polymer Injection Screening in DualPorosity Media, Gordon Research Conference on Physics and Chemistry of Microfluidics, Hong Kong, 10.1039/b000000x/Though.
- A. Sugar, M. Serag, U. Buttner, M. Fahs, S. Habuchi and H. Hoteit, Experimental and Numerical Investigation of Polymer Pore-clogging in Micromodels, Sci. Rep., 2023 DOI:10.1038/s41598-023-34952-9.
- I. M. Zarikos, S. M. Hassanizadeh, L. M. van Oosterhout and W. van Oordt, Manufacturing a Micro-model with Integrated Fibre Optic Pressure Sensors, Transp. Porous Media, 2018, 122, 221–234 CrossRef CAS PubMed.
- C. H. Ahn and J.-W. Choi, Microfluidic Devices and Their Applications to Lab-on-a-Chip, Springer Handbook of Nanotechnology, 2010, pp. 503–530 Search PubMed.
- A. Gerami, Y. Alzahid, P. Mostaghimi, N. Kashaninejad, F. Kazemifar, T. Amirian, N. Mosavat, M. Ebrahimi Warkiani and R. T. Armstrong, Microfluidics for Porous Systems: Fabrication, Microscopy and Applications, Transp. Porous Media, 2019, 130, 277–304 CrossRef.
- B. Zhao, C. W. MacMinn and R. Juanes, Wettability Control on Multiphase Flow in Patterned Microfluidics, Proc. Natl. Acad. Sci. U. S. A., 2016, 113, 10251–10256 CrossRef CAS PubMed.
- H. Lee, S. G. Lee and P. S. Doyle, Photopatterned Oil-reservoir Micromodels with Tailored Wetting Properties, Lab Chip, 2015, 15, 3047–3055 RSC.
- C. Chang, T. J. Kneafsey, J. Wan, T. K. Tokunaga and S. Nakagawa, Impacts of Mixed-Wettability on Brine Drainage and Supercritical CO2 Storage Efficiency in a 2.5-D Heterogeneous Micromodel, Water Resour. Res., 2020, 56, 1–19 Search PubMed.
- A. Irannezhad, B. K. Primkulov, R. Juanes and B. Zhao, Fluid-fluid Displacement in Mixed-wet Porous Media, Phys. Rev. Fluids, 2023 DOI:10.1103/PhysRevFluids.8.L012301.
- R. Maboudian, W. R. Ashurst and C. Carraro, Self-Assembled Monolayers as Anti-Stiction Coatings For MEMS: Characteristics and Recent Developments, Sens. Actuators, A, 2000, 82, 219–223 CrossRef CAS.
- M. J. Blunt, Multiphase Flow in Permeable Media: A Pore-Scale Perspective, Cambridge university press, 2017, pp. 1–16 Search PubMed.
- S. Watson, M. Nie, L. Wang and K. Stokes, RSC Adv., 2015, 5, 89698–89730 RSC.
- J. D. Swalen, D. L. Allara, J. D. Andrade, E. A. Chandross, S. Garoff, J. Israelachvili, T. J. Mccarthy, R. Murray, R. F. Pease, J. F. Rabolt, K. J. Wynne and H. Yu, Reviews Molecular Monolayers and Films, Langmuir, 1987, 3, 932–950 CrossRef CAS.
- R. Maboudian, W. R. Ashurst and C. Carraro, Tribological Challenges in Micromechanical Systems, Tribol. Lett., 2002, 95–100 CrossRef.
- Y. X. Zhuang, O. Hansen, T. Knieling, C. Wang, P. Rombach, W. Lang, W. Benecke, M. Kehlenbeck and J. Koblitz, Vapor-phase Self-assembled Monolayers for Anti-stiction Applications in MEMS, J. Microelectromech. Syst., 2007, 16, 1451–1460 CAS.
- P. Silberzan, L. Leger, D. Ausserre and J. J. Benattar, Silanation of Silica Surfaces. A New Method of Constructing Pure or Mixed Monolayers, Langmuir, 1991, 7, 1647–1651 CrossRef CAS.
- M. Grundner and H. Jacob, Investigations on Hydrophilic and Hydrophobic Silicon (100) Wafer Surfaces by X-Ray Photoelectron and High-Resolution Electron Energy Loss-Spectroscopy, Appl. Phys. A: Solids Surf., 1986, 39, 73–82 CrossRef.
- X. M. Yang, Z. W. Zhong, E. M. Diallo, Z. H. Wang and W. S. Yue, Silicon Wafer Wettability and Aging Behaviors: Impact on Gold Thin-film Morphology, Mater. Sci. Semicond. Process., 2014, 26, 25–32 CrossRef CAS.
- S. Günther, S. Si, H. D'Heer, D. Van Thourhout and M. Hoffmann, FDTS as Dewetting Coating for An Electrowetting Controlled Silicon Photonic Switch, IEEE Photonics Technol. Lett., 2018, 30, 2005–2008 Search PubMed.
| This journal is © The Royal Society of Chemistry 2024 |

