
 Open Access Article
 This Open Access Article is licensed under a Creative Commons Attribution-Non Commercial 3.0 Unported Licence
Zirconium analysis in microscopic spent nuclear fuel samples by resonance ionization mass spectrometry†
Manuel
Raiwa
 *,
Michael
Savina
,
Danielle Ziva
Shulaker
,
Autumn
Roberts
and
Brett
Isselhardt
*,
Michael
Savina
,
Danielle Ziva
Shulaker
,
Autumn
Roberts
and
Brett
Isselhardt
Lawrence Livermore National Laboratory, Nuclear and Chemical Sciences Division, 7000 East Ave, Livermore, CA 94551, USA. E-mail: raiwa1@llnl.gov
First published on 16th May 2024
Abstract
We developed a Zr two-photon resonance ionization scheme with a high useful yield of 6.3(5)%. This scheme utilizes the known intermediate energy level at 26443.88 cm−1 and a newly characterized Rydberg level at 53490.79(26) cm−1. Both the first (378.16 nm) and second (369.727 nm) transition wavelengths are accessible by frequency-doubled titanium:Sapphire lasers. We utilize the new scheme to analyze the isotopics of Zr, a fission product, in micrometer-sized spent nuclear fuel samples to understand their irradiation history. This includes the dependence on burnup and radial location within a fuel pellet. Resonance ionization mass spectrometry was used to obtain almost isobar-free Zr isotopic ratios from seven samples. The measured isotopic ratios from the spent nuclear fuel show a strong dependence on radial position within the fuel pellet while the effect of average pellet burnup was much less pronounced. All Zr isotopic ratios systematically change from the pellet center to the pellet edge, where isotopic values are close to those expected from 235U fission and 239Pu fission, respectively. Using Zr isotopics, we demonstrate a potential method to distinguish between samples derived from the edge or center of a fuel element of unknown pedigree, which strongly impacts the interpretation of a sample's irradiation history as the neutron fields are different between these locations.
Introduction
At the end of 2022, a total of 438 nuclear reactors across 32 countries were in operation with 58 more under construction.1 In the case of an interdicted or discovered spent nuclear fuel sample it is of paramount importance to assign it to its origin. This is often done by using elemental and isotopic ratios as these are strongly dependent on reactor type, age, burnup, and sample location within a reactor. Even within an individual fuel pellet significant deviations in elemental and isotopic compositions exist between the center and edge (sometimes also referred to as “skin”) of a pellet.2–5 This “edge effect” can be explained by the differences in the neutron spectrum and flux experienced across the pellet. A prominent example of the variable neutron field is the increased Pu production at the fuel pellet edge relative to the center by a factor of three.3 This is because a portion of epithermal neutrons from the moderator are overwhelmingly absorbed by 238U within a few hundred micrometers of the pellet edge due to the large neutron capture resonance of 238U in this energy region.Compositional analysis of spent nuclear fuel is routinely done by dissolving fuel pellets and chemically separating elements before performing mass spectrometry (typically inductively coupled mass spectrometry (ICP-MS) or thermal ionization mass spectrometry) and/or radioanalytical counting (e.g., alpha spectrometry).6 While these methods are well established and produce results with low uncertainties, they typically lose information on spatial heterogeneity within the sample. Laser ablation ICP-MS with a collision cell and small sample ICP-MS measurements provide some spatial information but are limited to several micrometer resolution.4,7,8 Direct laser ablation ICP-MS studies on spent nuclear fuel typically have higher sample consumption with pit sizes of 10 micrometer or more which requires specialized shielding of the ablation area.9,10 Secondary ion mass spectrometry (SIMS) has the spatial resolution to observe isotopic heterogeneity within a fuel sample on the micrometer scale but suffers from isobaric interferences like 235UH on 236U.2,5 Resonance ionization mass spectrometry (RIMS) is the only technique with neglectable sample consumption capable of resolving isobaric interferences while maintaining micrometer spatial resolution.11–13 RIMS does not require extensive sample preparation to resolve or discriminate against isobars, such as chemical purification required for actinide analyses by ICP-MS. Rather, RIMS relies on the stepwise excitation of atoms with lasers tuned to transition frequencies specific to the analyte(s) of interest.14 This results in high elemental selectivity (i.e. suppression of isobars) and high sensitivity. While not commercially available, several RIMS facilities are now in operation worldwide with applications ranging from cosmochemistry to nuclear fuel analysis.15–18 Today, Ti:Sapphire lasers are commonly used in modern RIMS facilities due to their wide tuning range and reliability.
Zirconium is an important fission product because it has several long-lived and stable isotopes with high fission yields from 235U and 239Pu together with low neutron capture cross sections that mitigate its transmutation after production.19 However, it also has several isobaric interferences that make it difficult to measure with traditional mass spectrometry. For example, 90Sr (T1/2 = 28.91 years) interferes with 90Zr and 96Mo interferes with 96Zr.20,21 In addition, while the isotopes of Mo and Nb are shielded and thus not significantly produced in reactors, their stable isotopes can be an Zr isobaric interferences if they are introduced during sample preparation and chemical pretreatment in traditional mass spectrometric approaches.
The high ionization energy of Zr (53507.832 cm−1 or 6.6 eV) generally requires multiphoton excitation with common benchtop lasers for RIMS analysis.22 More favorable resonance ionization spectroscopy (RIS) schemes are either not accessible by Ti:Sapphire lasers23,24 or start from a sparsely populated low-lying excited state at 1240.84 cm−1.22 Two-photon resonance ionization of Zr has been demonstrated, however the RIS scheme requires a high-energy UV photon at 319.215 nm to excite Zr from the ground state to the first excited state (FES).25 Such photons are produced by tripling the infrared output of the Ti:Sapphire laser, which is inefficient and laborious compared to frequency doubling. Further, high-energy photons such as these often increase the non-resonant ionization and photofragmentation of molecules which, for many sample matrices, can lead to unacceptable backgrounds in the mass spectra.
Recent developments in two-photon RIS schemes for actinides without frequency tripling have been shown to give good isobaric suppression and allow for quick changes in the laser frequency when tuning between elements.12,26 Therefore, a new high-efficiency Zr RIS scheme using two photons in the frequency-doubled Ti:Sapphire range was developed. In this paper we introduce this scheme and present the analysis of spent nuclear fuel samples in which the edge effect is observed in the isotopic composition of Zr.
Method
Materials
The Zr excitation scheme development and useful yield (UY) determination were performed on natural Zr metal. Seven spent nuclear fuel samples (UO2, initial 235U enrichment of 8.3%) were analyzed with the new scheme. The isotopic compositions of actinides and other fission products in these samples were previously measured and are described in detail elsewhere.11,21 In brief, the samples are 10 micrometer-sized cubes cut from two spent nuclear fuel pellets discharged from the Belgium pressurized water reactor No. 3 in September 1980. Three 10 μm cubes were cut from a fuel pellet with an average burnup of 48.3 GWd/tU (designated B) and four from a pellet with 40.7 GWd/tU (designated A). Within both pellets various radial positions, representing both the center and edges of the pellet, were cut using a focused ion beam (FIB) at Idaho National Laboratory (INL) and platinum-welded to copper combs. Remaining material from the same pellets was analyzed at INL by ICP-MS and the concentrations of 91,92,93,94,96Zr were measured.27 Those measurements are taken as representative of the average pellet isotopic composition. The mass of a 10 μm cube of UO2 is ∼10 ng and bulk analysis shows a Zr abundance of ∼0.5% in both pellets, this implies a total Zr mass of 50 pg per cube.RIMS instrument
All RIMS measurements were made on the Laser Ionization of Neutrals (LION) instrument at Lawrence Livermore National Laboratory, which has been described previously in detail.28 A general description of RIMS analysis can be found in Savina and Trappitsch.29 Before each analysis, the Zr metal standard or spent nuclear fuel sample was cleaned by rastering a continuous 15 keV Ga+ beam over the sample surface for two minutes to remove adsorbed contamination along with the top oxide layer. RIMS analysis was performed with the 15 keV Ga+ primary ion beam in pulsed mode (300 ns pulse width, 1 kHz repetition rate) focused to 1–2 μm on the sample surface. Secondary ions and neutrals sputtered from the surface form an expanding cloud above the impact area.29 A bias of 6 kV was applied to the sample for 250 ns to eject secondary ions. The sample bias was lowered to ground, and the remaining cloud of neutral atom and molecules was irradiated with simultaneous pulses from two wavelength-tuned Ti:Sapphire lasers. These lasers were pumped by 12 W of 527 nm light from commercial Photonics Industries DM50-527 Nd:YLF lasers pulsed at 1 kHz. The emitted Ti:Sapphire laser pulses had a length of 5 to 7 ns and a linewidth of ∼7 pm. The wavelength was set by a grating at the end of the cavity and the fundamental photons were intra-cavity frequency doubled by a Lithium triborate (LBO) crystal. Individual attenuation to the desired laser power was performed by polarization optics outside the cavity. Both beams were focused to a diameter of ∼1.3 mm inside the neutral atom cloud 1 mm above the sample surface. The sample bias was raised to 3 kV and the photoions generated by the lasers were accelerated into a time-of-flight mass spectrometer and detected on a discrete dynode detector (ETP MagneTOF).Zirconium excitation scheme
![[thin space (1/6-em)]](https://www.rsc.org/images/entities/char_2009.gif) 490 cm−1 accessible from 3F2 and 3F3 intermediate states with good oscillator strength. We performed a wavelength scan near this energy region using natural Zr metal. Fig. 1 shows the wavelength scan with a broad peak at 53491 cm−1, which is consistent with the observed Rydberg state.
490 cm−1 accessible from 3F2 and 3F3 intermediate states with good oscillator strength. We performed a wavelength scan near this energy region using natural Zr metal. Fig. 1 shows the wavelength scan with a broad peak at 53491 cm−1, which is consistent with the observed Rydberg state.
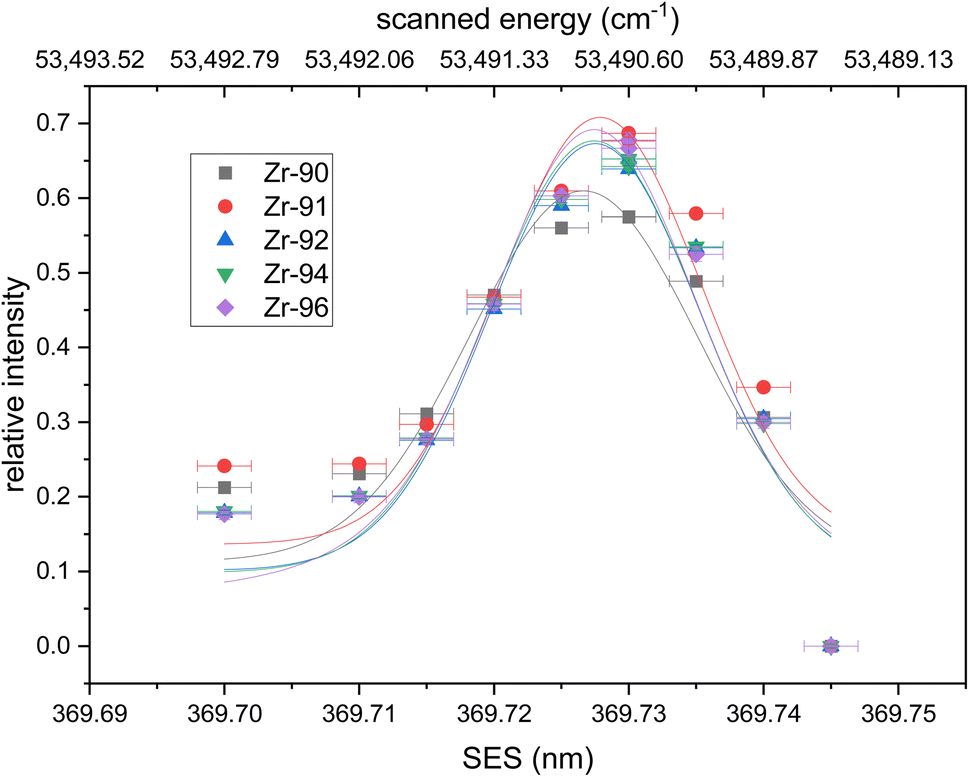 | ||
| Fig. 1 Wavelength scan of the second excitation step (SES). Relative intensities calculated using eqn (1) are fitted with a Voigt profile. No isotope shifts are visible within the uncertainties of the wavelength measurements. All fits have their center at 369.727(4) nm. Uncertainties are 1σ for the ion signal (counting statistics) and 2 pm for the wavelength. | ||
Ions from all naturally occurring Zr isotopes were collected to assess differences in the transition wavelength between individual isotopes (i.e., isotope shifts). To account for the resonant excess from the second excitation step counts from each isotope were normalized according to eqn (1):
 | (1) |
The resulting relative ion signal intensities for each isotope were fitted with Voigt profiles in Fig. 1. The center of all fitted curves agrees with 369.727(4) nm without any detectable isotopic shift within the 2 pm uncertainty of our wavelength measurement. The average full width at half maximum (FWHM) of the fits is 19(7) pm, which corresponds to our laser bandwidth (∼7 pm) combined with the Doppler and power broadening of the transition. 90Zr shows a slightly lower resonant excess due to higher background in the mass spectra compared to the other isotopes. The determined Rydberg energy level of 53490.79(26) cm−1 was selected as the second step for the new excitation scheme. Both wavelengths (FES = 378.16 nm and SES = 369.727 nm) are accessible by frequency-doubled Ti:Sapphire lasers.
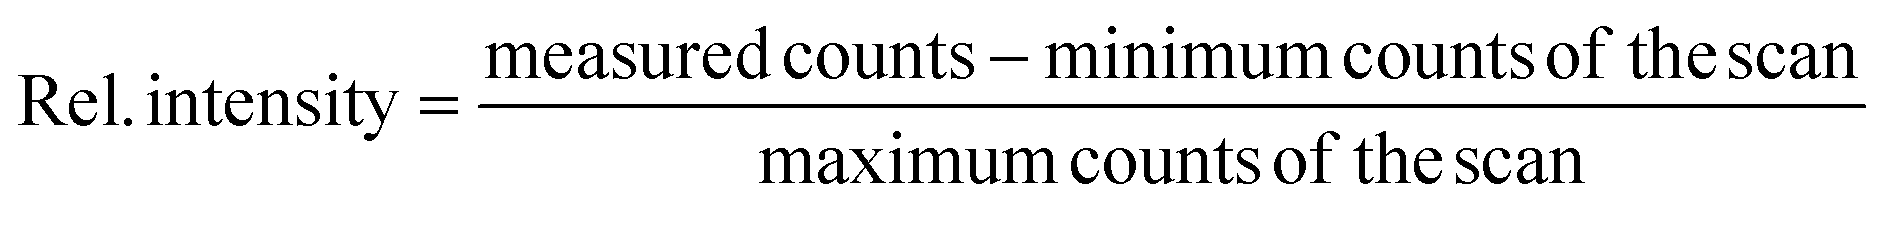
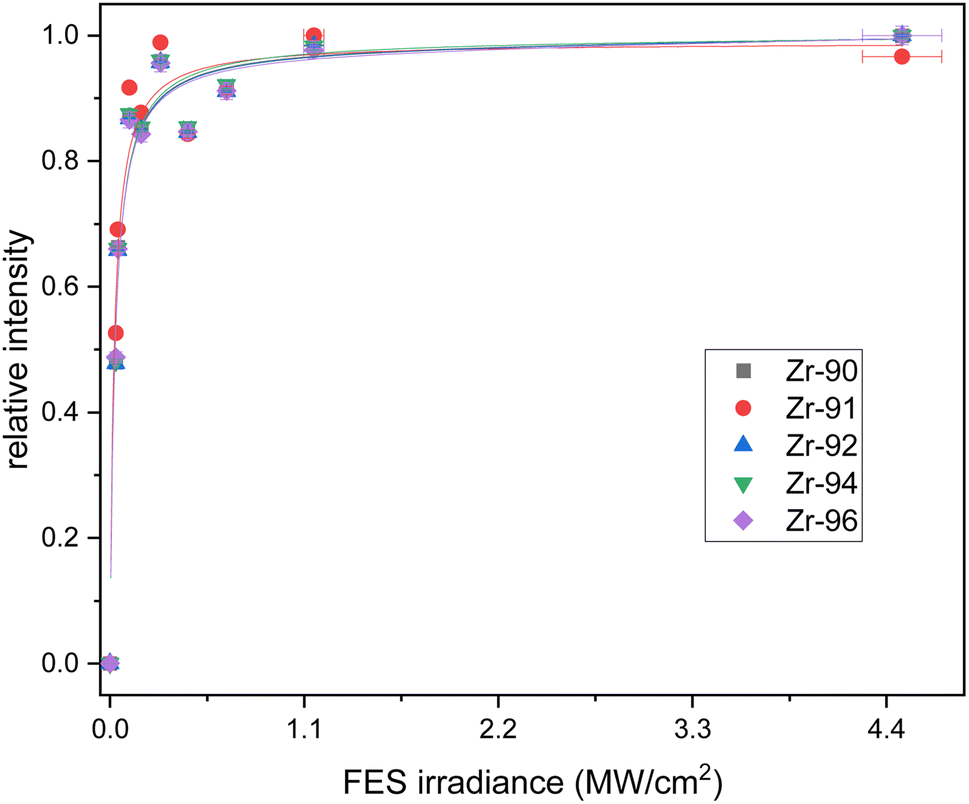
The counts were normalized to the maximum counts of the scan for each isotope. The resulting saturation behaviors of the first and second step are given in Fig. 2 and 3 respectively. The relative intensities were fitted with a standard saturation curve given in Schneider et al.36
 | ||
| Fig. 2 Saturation curves for all Zr isotopes for the first excitation step (FES). Relative uncertainties in the ion signal are one sigma (counting statistics); uncertainty in the power is 5%. The calculated saturation irradiance is 0.027(5) MW cm−2. | ||
 | ||
| Fig. 3 Saturation curves for all Zr isotopes for the second excitation step (SES). Relative uncertainties in the ion signal are one sigma (counting statistics); uncertainty in the power is 5%. The calculated saturation irradiance is 4.6(9) MW cm−2. | ||
Eqn (2): saturation curve
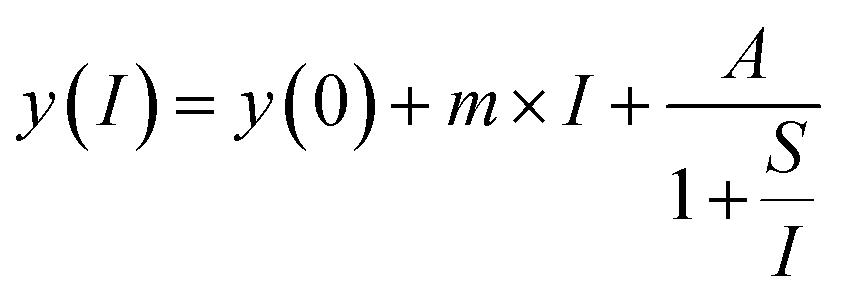 | (2) |
The first excitation step at 378.16 nm shows a typical saturation behavior for all isotopes with a low saturation irradiance of 0.027(5) MW cm−2 (Fig. 2). Given that the data was normalized and the offsets and linear terms in eqn (2) were zero, the fit parameter (A) of 1 for all fits indicates strong saturation. Note that as defined by eqn (2), the excitation efficiency y(I) is 50% at the saturation irradiance (S) of 0.027(5) MW cm−2. Differences between the isotopes are within their one sigma uncertainties. To ensure stable ionization rates and to cover slight power shifts over longer measurements, an irradiance of I = 0.16 MW cm−2 was selected for the first transition in all the following measurements which corresponds to 87% excitation into the first excited level.
The second excitation step at 369.73 nm shows a weaker saturation trend (Fig. 3). The short wavelength of the SES limited the achievable power of our Ti:Sapphire lasers, which hindered measurements with powers beyond 250 mW. This led to elevated uncertainties in the fit and a calculated saturation irradiance of 4.6(9) MW cm−2. To maximize the count rate the second step was not attenuated, and 250 mW corresponding to an irradiance of 5.3 MW cm−2 was used in the following measurements. The parameter A was 1.9(2) in the second fit, which implies an excitation of around 50% from the first into the second level. This excitation step also showed no significant differences between the isotopes, which agrees with the negligible isotope shift measured in the wavelength scan.
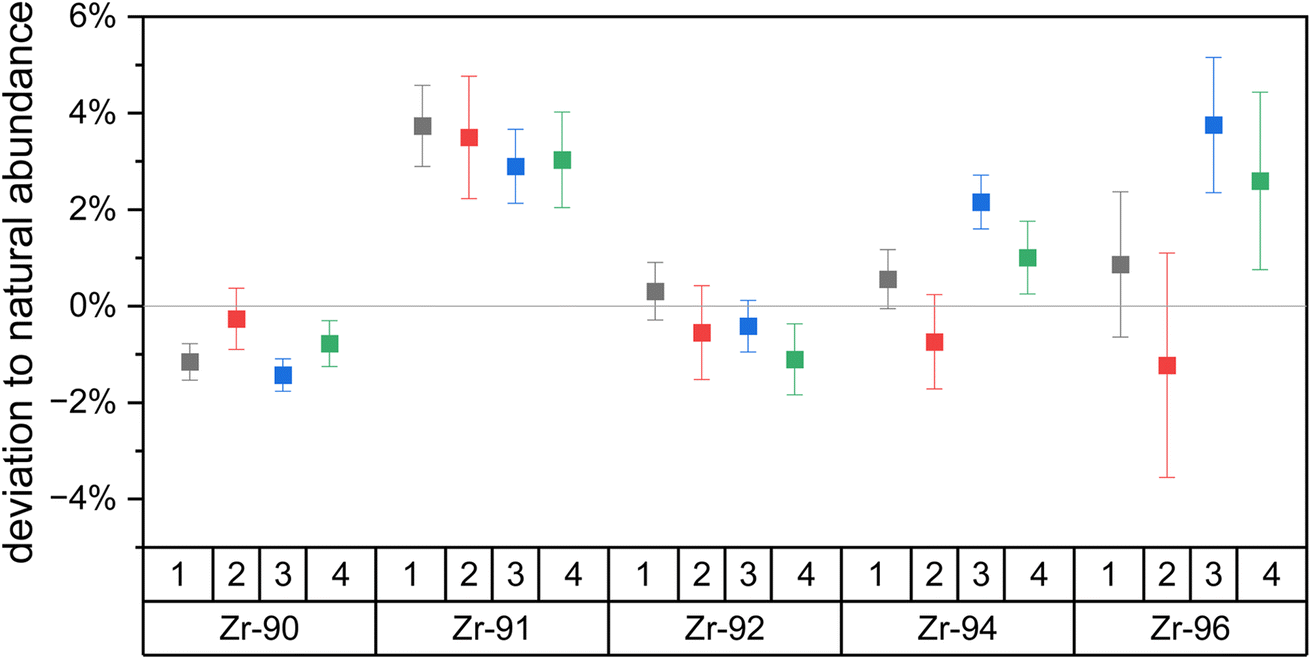 | ||
| Fig. 4 The deviation of the Zr isotopic composition of Zr metal relative to the assumed natural Zr isotopic abundances, calculated using eqn (3). Four measurements on two days show isotopic fractionation below 5% for each Zr isotope. The deviations are consistent between days which shows external reproducibility. Zr-96 shows the highest uncertainties due to its low natural abundance. Uncertainties are 1σ. | ||
Eqn (3): deviation from natural abundance
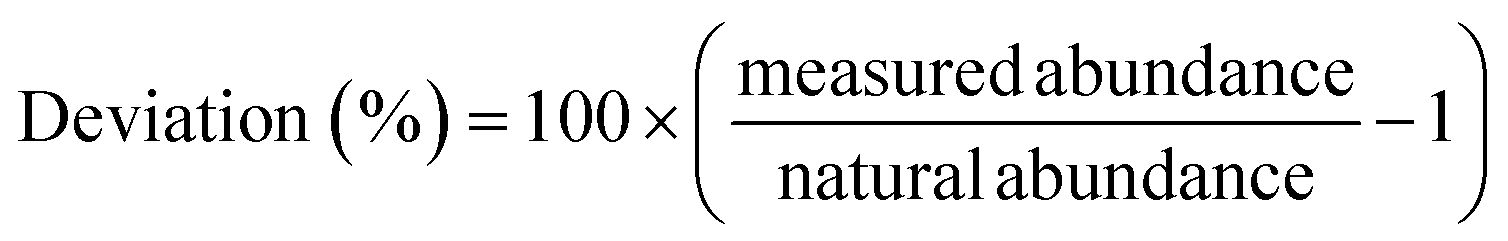 | (3) |
Overall, the newly developed Zr excitation scheme reproduces the natural isotopic ratios with minor fractionation. Uncertainties of the individual measurements are one sigma counting statistics and below 1% for all isotopes besides the minor 96Zr. Deviations of the measured to expected Zr isotopic composition are due to laser ionization bias and below 5% for all isotopes on both days. The odd isotope 91Zr is the only isotope with a consistently higher yield compared to the even isotopes, which we attribute to the odd-even effect. 91Zr has a nuclear spin of +5/2, which results in hyperfine splitting of the energy levels and leads to a higher transition rate than the spin-zero even isotopes.37 Note that the small enhancement in the 91Zr signal (<5%) indicates that the Rydberg state is J = 4, since transitions with ΔJ = −1,0 would lead to much larger deviations due to the selection rules (17% for ΔJ = 0; 40% for ΔJ = −1) (e.g., ref. 38). Large peaks are seen in this region of the spectra obtained by Hasegawa et al.33 for transitions originating from intermediate states with J = 2 or 3, but not J = 1, further supporting this interpretation.
Since natural Zr does not have the long-lived anthropogenic 93Zr (T1/2 = 1.6 × 10⁶ years), its deviation could not be measured. However, 93Zr also has a nuclear spin of +5/2 and thus a deviation similar to that of 91Zr is expected. Additional deviations from isotopic shifts are not expected as the endmember isotopes 90Zr and 96Zr do not show any significant signal drop and we thus assume our frequency-doubled laser linewidth of ∼7 pm is greater than the isotopic shifts of both transitions.
Eqn (4): useful yield
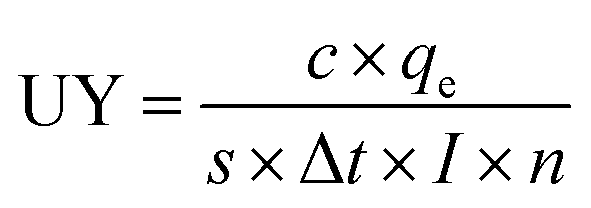 | (4) |
In this work we collected 1.14 × 10⁵ Zr ions over 104 measurement cycles using a primary ion current of 34 pA and a primary ion pulse width of 300 ns. The useful yield according to eqn (4) is 6.3(5)%. This is slightly higher than our previously reported UY of 5.4(4)% for Zr.25 As noted above, that scheme used a much higher-energy first excited state, which required the use of a frequency-tripled Ti:Sapphire laser, followed by a frequency-doubled laser, rather than the simpler configuration of two frequency-doubled lasers in the present scheme. Compared to the Zr metal a lower useful yield is expected from the UO2 spent nuclear fuel matrix as most of the Zr is expected to be sputtered as oxide. In the case of uranium it has been shown that this reduces the useful yield by a factor of ∼20.35
Spent nuclear fuel sample measurements
Fuel pellets 8 mm in diameter were removed from a single fuel rod at two locations, representing a higher or lower average burnup (Table 1). Cubes were subsampled from the pellets in a transect across from the center to edge (sample distance from the pellet edge shown in Table 1). While we do not know how much material is required for Zr analysis, Fig. 5 shows secondary electron microscope (SEM) images of the sample A-100 before (left) and after the RIMS analysis (right), in which very little sample consumption is visible. We estimate the total amount of Zr consumed is much less than 1 pg.| Sample | A-5 | A-40 | A-100 | A-4000 | B-30 | B-100 | B-4000 |
|---|---|---|---|---|---|---|---|
| Average pellet burnup (GWd/tU) | 40.7 | 40.7 | 40.7 | 40.7 | 48.3 | 48.3 | 48.3 |
| Distance sampled from the pellet edge (μm) | 5 | 40 | 100 | 4000 | 30 | 100 | 4000 |
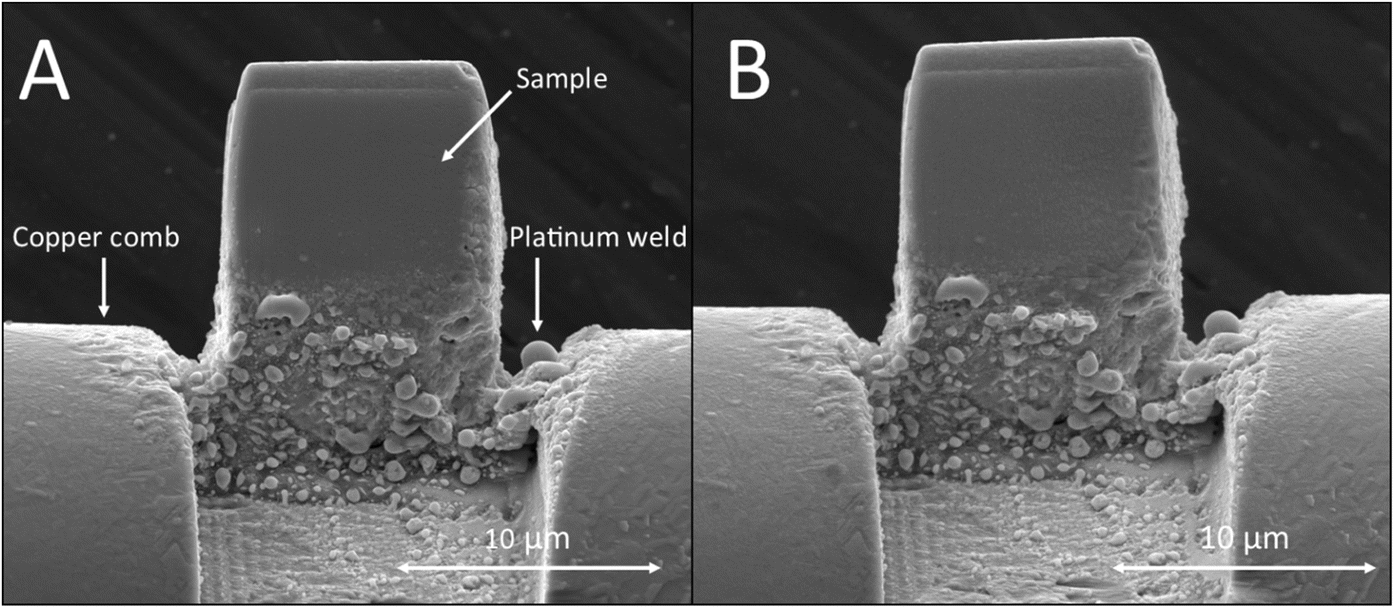 | ||
| Fig. 5 The secondary electron images of spent nuclear fuel cube A-100 before RIMS measurement (A) and after the RIMS measurement (B) show practically no sample consumption. | ||
To correct for the laser induced isotopic deviations shown in Fig. 4, Zr metal was analyzed at the beginning of each measurement day and used to correct the measured counts for each isotope. 93Zr counts are uncorrected because there is no 93Zr in natural Zr. As discussed above, we expect ∼4% overestimation of 93Zr counts. Because this affects all measurements systematically, the relative differences between center and edge cubes are preserved.
Results
While the mass spectra on the Zr metal did not show other peaks in the Zr region (i.e. Sr, Mo, etc.), other peaks were observed when measuring spent nuclear fuel. Fig. 6 shows the RIMS mass spectrum of the spent nuclear fuel cube A-40 with all lasers on-resonance (black) and with the FES detuned off-resonance to 378.06 nm (0.1 nm shorter wavelength than the on-resonance spectrum). To quantitatively measure any background signal, the measurements were done for 20 minutes each.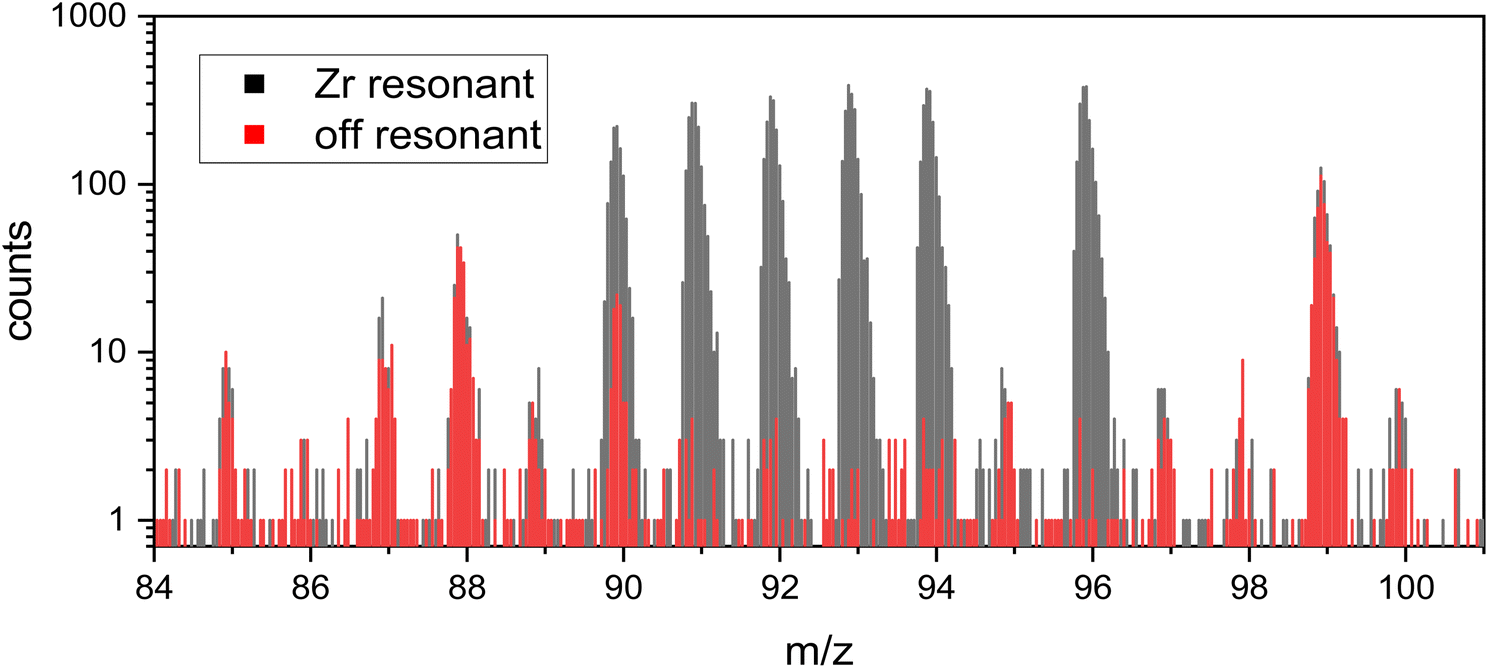 | ||
| Fig. 6 A 20 minute RIMS measurement with Zr lasers on resonance (grey) is shown with an overlay of a 20 minute off resonance measurement (red, FES detuned by −0.1 nm) on sample A-40. Minor interference (∼8%) is visible at mass 90. Counts at each peak on- and off-resonant are given in ESI-Table 1 in the ESI.† | ||
Fission product Rb (mass 85 and 87) is present as well as fission product Sr at mass 88 and 90 and Tc at mass 99. These are photoions generated by the Ti:Sapphire lasers, since they are absent when the lasers are off.
Non-resonant ionization of atoms is generally unlikely in RIMS due to the narrowness of atomic energy levels relative to the space between them. Rather, we believe that photofragmentation of oxide molecules into positive metal ions is a more likely explanation, since oxide molecules have many more energy levels than their constituent atoms, and these are further split and broadened by rotation and vibration. Rubidium, Sr, and Tc oxides all have much less negative enthalpies of formation than ZrO (i.e. they form weaker bonds to oxygen), and thus are much more likely to appear as photofragments in the off-resonance spectrum. This is what is seen in Fig. 6 in which the resonant Zr signals at mass 91, 92, 93, 94, and 96 all essentially disappear while the other peaks remain largely unaffected by the small wavelength change of 0.1 nm. Of course, the absorption and repartitioning of the laser energy in each specific case is important, but the argument is generally consistent with the observations in Fig. 6.
88Sr and 99Tc have nearly identical counts in each measurement, which shows that the sample and laser conditions did not change between the two collected measurements. 90Sr is a minor isobaric interference for 90Zr, with only 83 off-resonance counts compared to 1055 counts on resonance, and in any case can be quantitatively subtracted by measuring the off-resonance contribution as necessary.
An exact isobaric suppression could not be calculated as the concentrations of 90Zr and 90Sr in the sample are unknown. However, previous work measured the 90Sr/88Sr ratio in this sample to be 0.566(7).21 Together with the RIMS background-corrected 90Zr/92Zr ratio from this measurement of 0.63(3) and the reported pellet average concentrations of 88Sr (435 ppm) and 92Zr (769 ppm) from bulk measurements we expect a 90Sr/90Zr ratio of 0.51(2). Assuming all off-resonant ions on mass 90 are 90Sr we measure a 90Sr/90Zr ratio of 0.09(1), which indicates a strontium suppression factor of 5.9(7). While the 90Sr/88Sr ratio does not vary significantly within a sample set of common origin and age,21,39 this calculation does not account for differences between pellet average and sample-specific Zr composition. The given number can therefore only be taken as an estimate.
The non-resonant 90Sr contribution to 90Zr is ∼8%. An analytical approach with the highest accuracy would utilize an off-resonance measurement on every sample after a resonant measurement. While this is certainly possible (Fig. 6) we opted not to do so for this study since no data on pellet average 90Zr is given in the bulk measurements and thus no comparison is possible. None of the other Zr isotopes have significant isobaric interference (i.e., the non-resonant background is below the one sigma counting statistical uncertainty of the resonant measurement) and so our data interpretation going forward is based on these isotopes only.
Isotopic ratios
Similar to U, Pu, Mo, and Ru,11,21 the Zr isotopic composition is dependent on the sample's radial location within these fuel pellets. Fig. 7 shows the 94Zr/91Zr ratio vs. the distance from the edge. (All measured sample ratios are given in ESI-Table 2 in the ESI.† All fission yields are thermal and taken from the JEFF-3.1.1 Nuclear Data Library.40) The blue band indicates the range of the bulk sample results with burnups from 19.8 to 48.3 GWd/tU.27 Samples from comparable radial locations within have indistinguishable 94Zr/91Zr within 2σ uncertainties even though the difference in pellet average burnup between sample set A and B is considerable (40.7 versus 48.3 GWd/tU). Rather, the sample location within the pellet has a much greater effect. The ratios from the two cubes cut from the center of the pellet agree with the fission yield ratio (FYR) produced by 235U fission (1.09(2)), while the cubes towards the edge do not. There the 94Zr/91Zr ratio is shifted upwards towards the 239Pu fission yield ratio of 1.77(5), indicating the influence of increased Pu production and subsequent fission at the edge. However, because the natural 94Zr/91Zr ratio is 1.549(8), this trend could originate from Zr migrating in from the Zr-rich Zircalloy nuclear fuel cladding. These so called fuel-cladding chemical interactions (FCCI) are complex and depended on a variety of factors such as fuel and cladding type, burnup and structural damages to the boundary between fuel and cladding.41,42 This makes a general quantification of migrating Zr from the cladding difficult.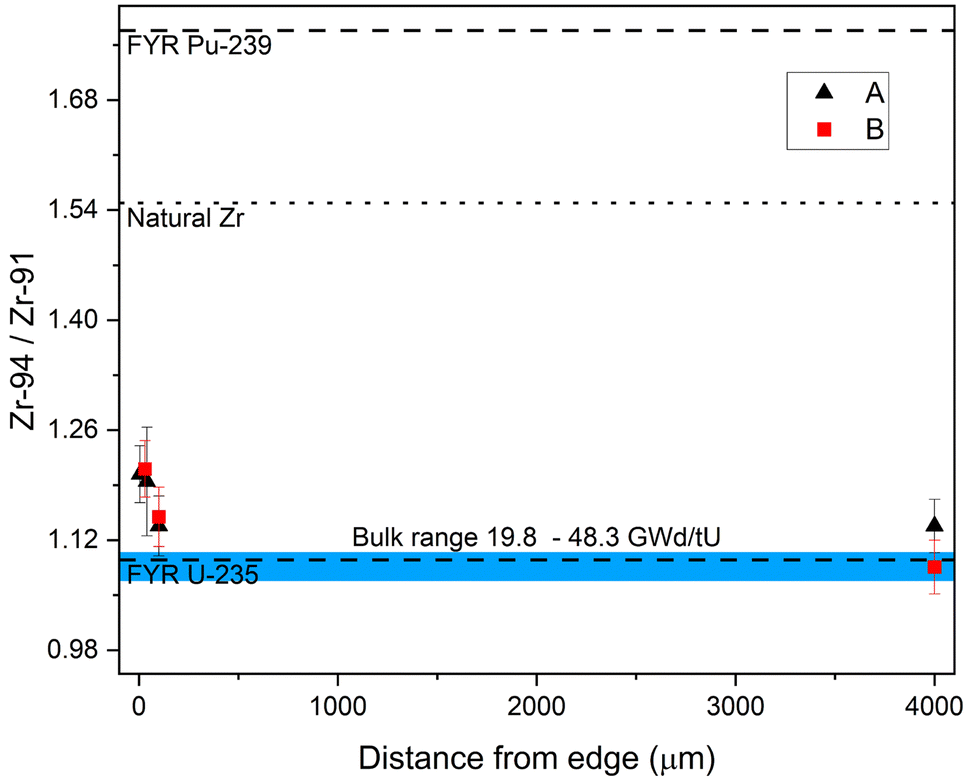 | ||
| Fig. 7 Measured 94Zr/91Zr ratios as a function of distance from the pellet edge. The ratio shifts from the expected 235U fission yield ratio (FYR U-235, lower dashed line) towards the ratio expected from 239Pu (FYR Pu-239, upper dashed line). The blue band shows the range of 94Zr/91Zr ratios measured in bulk sample with burnups ranging from 19.8 to 48.3 GWd/tU. Uncertainties on data points are 2σ. | ||
To rule out any significant influence of cladding material two additional Zr ratios are monitored. Firstly, the ratio of anthropogenic long-lived fission product 93Zr to the naturally occurring 91Zr. Because 93Zr is not initially present in the cladding material and the neutron capture cross-section from 92Zr is low (0.13 b), any influx from migrating cladding material would significantly lower the 93Zr/91Zr ratio at the edge compared to the center, but this was not observed. Secondly, the isotopic ratio of 91Zr/96Zr has a natural value of 4.01(3), but both 235U and 239Pu fission yield ratios have much lower values (0.93(2) and 0.50(2)). In this case migrating Zr would lead to a higher ratio towards the edge, but this was not observed. In contrast, the trend towards the 239Pu fission yield holds up here as well but higher uncertainties prevent a definitive separation outside of the uncertainties (2σ) for the center and edge cubes in the 93Zr system. Figures analogous to Fig. 7 for both systems are given in the ESI (ESI-Fig. 2 and 3†).
To compare the shifts in the three isotopic ratios, we express the xZr/91Zr ratios as linear combinations of the 235U (FYR235) and 239Pu fission yield ratios (FYR239) according to eqn (5):
Eqn (5): zirconium isotope ratios as linear combinations of fission yield ratios.
| xZr/91Zr = F239 × FYR239 + (1 − F239) × FYR235 | (5) |
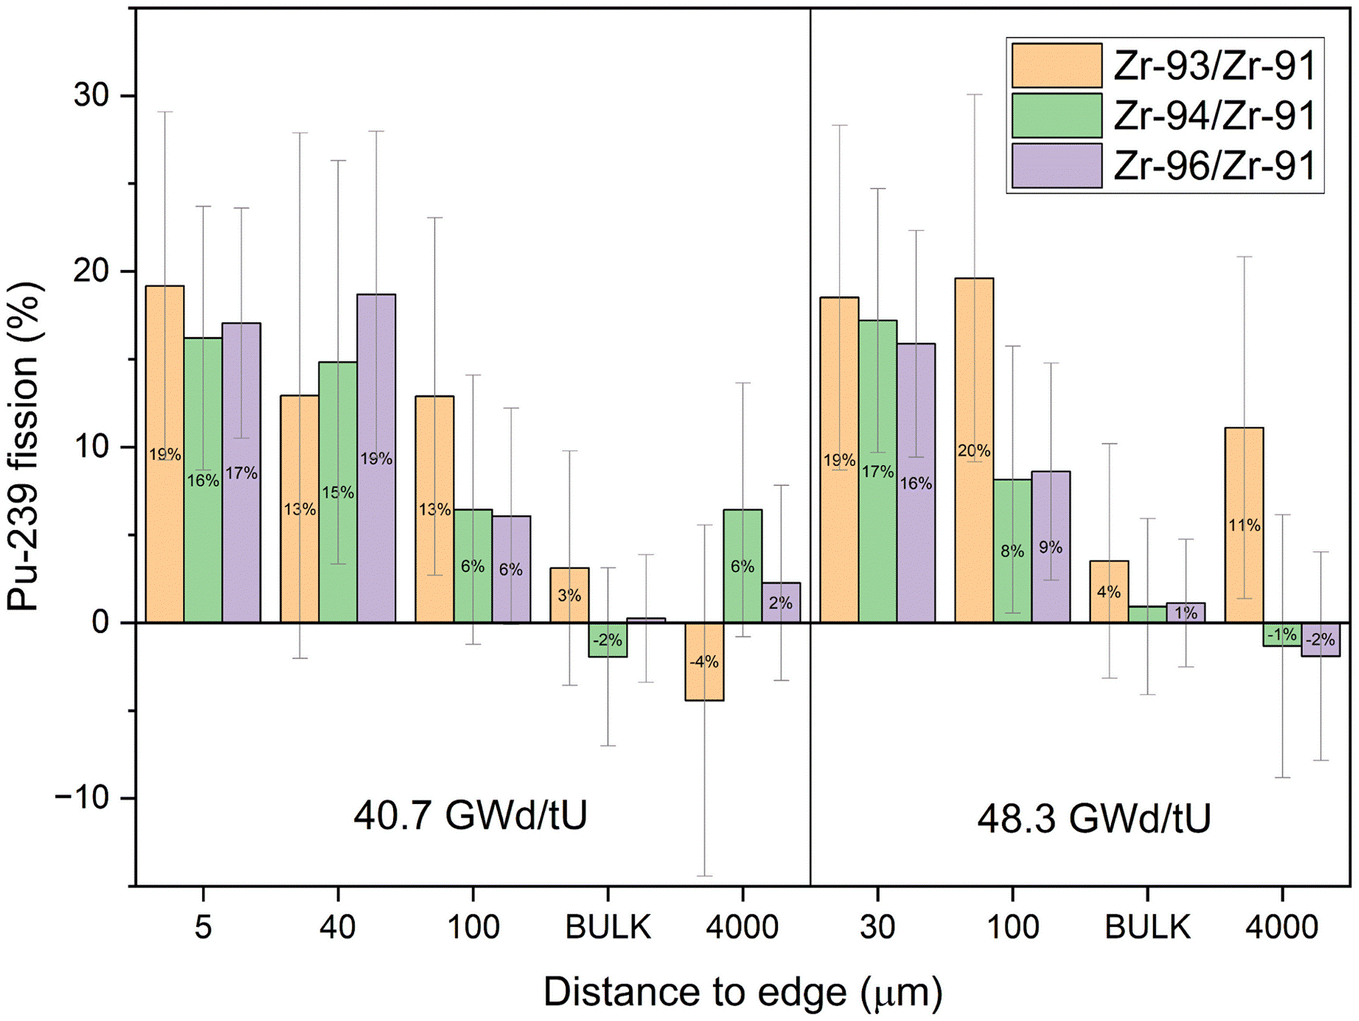 | ||
| Fig. 8 Fraction of fissions due to 239Pu (F239) as a function of distance from the pellet edge for three Zr isotope ratios. All Zr isotopic ratios show the same trend towards more 239Pu fission at the edge. The bulk measurements show comparable uncertainties to the RIMS measurements. Uncertainties are 2σ. | ||
The center cubes show overwhelmingly 235U fission in all ratios, with F239 consistent with zero in most cases. Only the samples towards the edge have elevated 239Pu influences that are non-zero at two sigma uncertainties. The increase in fissions from 239Pu towards the edge is comparable between isotopic pairs and sample sets of different burnups. This further indicates that migrating Zr from the cladding does not have a significant influence as it would affect each isotopic pair differently. More precisely, cladding influx would move the isotope ratios closer to natural values which would increase the calculated 239Pu fraction derived from 94Zr/91Zr and decrease the fraction from 96Zr/91Zr. But most apparently the calculated fraction from 93Zr/91Zr would be significantly lower as the cladding originally did not contain any 93Zr. The bulk measurements have a comparable variability between each of the isotope ratios and are close to the values of the center sample.
With the migrating cladding Zr ruled out this effect is best explained with higher Pu production and thus more fission from 239Pu at the edge. This should be reflected in the previously measured actinide isotopic ratios of U and Pu on these samples.11Fig. 9 and 10 show the 96Zr/91Zr ratio vs. the actinide ratios 238U/235U and 240Pu/239Pu. These figures include the distance in μm next to our measurements. Bulk measurements from these (blue diamonds marked A and B) and two additional pellets with burnups of 19.6 and 23 GWd/tU are added to indicate the general isotopic shift with increasing burnup (dotted blue line left to right). The shift in actinide ratios within a nuclear fuel pellet in dependence of its radial position and specifically in the here analyzed cubes towards the edge to a higher burnup value has been discussed in the literature before.2,11
 | ||
| Fig. 9 96Zr/91Zr vs.238U/235U ratios. Bulk data (blue diamonds and line) shows pellet averages spanning 19.8 GWd/tU up to 48.5 GWd/tU. Pellet average burnup increases from left to right. RIMS results of individual samples from Pellet A (black triangles) and B (red squares) are given with their distance towards the edge in μm. Uncertainties are 2σ. The Zr isotopic ratios from the center of Pellets A and B agree with their determined bulk values. The change towards the edge is greater than the expected shift by increased burnup alone. | ||
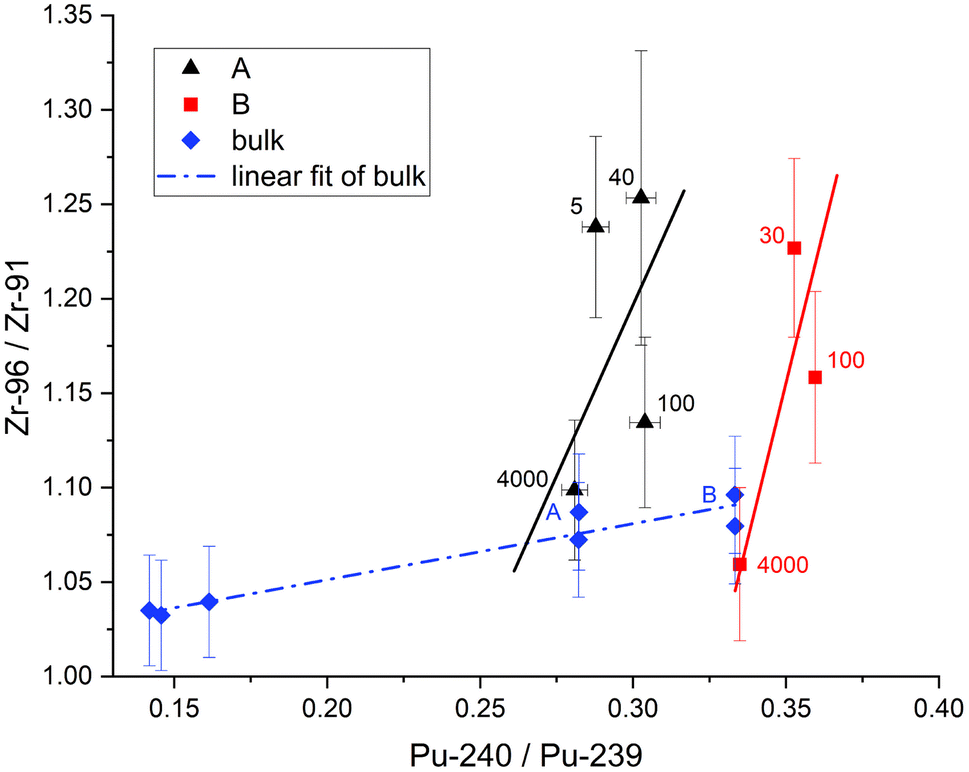 | ||
| Fig. 10 96Zr/91Zr vs.240Pu/239Pu ratios. Bulk data (blue diamonds and line) shows pellet averages spanning 19.8 GWd/tU up to 48.5 GWd/tU. Pellet average burnup increases from left to right. RIMS results of individual samples from Pellet A (black triangles) and B (red squares) are given with their distance to edge in μm. Uncertainties are 2σ. The Zr isotopic ratios from the center of Pellets A and B agree with their determined bulk values. The change towards the edge is greater than the expected shift by increased burnup alone. | ||
For U (Fig. 9) there is a small increase in the 96Zr/91Zr ratio with burnup in bulk samples due to the slight increase in bulk 239Pu abundance over this range (0.30% at 19.6 GWd/tU vs. 0.44% at 48.3 GWd/tU).27 However, it is dwarfed by the edge effect as evidenced by much sharper slopes of the linear fits through the cube samples. Whereas the relative shift of 238U/235U in cubes with comparable distances to the edge resembles the shift of the bulk analysis, the shift in Zr isotopic ratio is mostly dependent on the sample location.
This effect is even more pronounced when plotted vs. Pu isotopic composition (Fig. 10). Again, the difference in 240Pu/239Pu is mainly dictated by the average burnup of the fuel pellet while the difference in Zr isotopic ratio is related to the location within the pellet. Even more, all samples from comparable locations within pellets (i.e., edge or center) have the same Zr isotopic ratios within two sigma uncertainties regardless of the pellet's average burnup. Combining these actinide measurements with the Zr analysis is therefore a useful technique to gain insight into the origin of a small nuclear fuel sample from an unknown location.
Conclusion
The newly developed Zr excitation scheme shows a high useful yield of 6.3(5)% with decent isobaric suppression of Sr. The transition wavelengths 378.16 nm and 369.727 nm can be easily reached with frequency-doubled Ti:Sapphire lasers, which is a distinct advantage over the previous scheme which required frequency tripling. Additionally, the excitation scheme demonstrates little isotopic fractionation due to laser ionization bias. This makes it ideal to measure all isotopes at the same time, without the need for big corrections or extensive sample pretreatment. The first excitation step is easily saturated while the second step saturation could be improved with additional optimization of the laser cavity.Spent nuclear fuel samples analyzed with the new scheme clearly show an edge effect where the Zr isotopic ratios from the edge of a pellet are shifted towards the 239Pu fission yield ratio. The shift of the 91Zr/96Zr ratio and the increase of 93Zr/91Zr at the edge exclude migrating Zr as the cause for this effect. The effect is in line with the sharp increase of the Pu to U ratio at the edge as observed previously by others.2,4,5
The analysis of the fission product Zr with its low neutron absorption cross sections enables the identification of a sample originating from the edge of a pellet due to its shifted isotopic ratios. These shifts are due to the overproduction of 239Pu at the pellet edge and are separable from overall burnup, which is dominated by 235U fission.
This kind of information is critical for evaluating the irradiation history of a sample of unknown pedigree and was previously not accessible with actinide isotopic ratios alone, as samples from the inside of a high burnup sample resemble the actinide composition of a low burnup sample from the edge of a pellet.11 The presented analysis is therefore complementary to the actinide analysis and easily accessible with our new excitation scheme.
Author contributions
Manuel Raiwa: conceptualization, data curation, formal analysis, investigation, methodology, visualization, writing – original draft, writing – review & editing Michael Savina: conceptualization, data curation, formal analysis, funding acquisition, investigation, methodology, project administration, resources, supervision, writing – review & editing Danielle Ziva Shulaker: investigation, data curation, writing – review & editing Autumn Roberts: investigation, data curation, visualization Brett Isselhardt: conceptualization, funding acquisition, methodology, project administration, supervision, writing – review & editing.Conflicts of interest
There are no conflicts to declare.Acknowledgements
This work was performed under the auspices of the U.S. Department of Energy by Lawrence Livermore National Laboratory under Contract DE-AC52-07NA27344. LLNL-JRNL-860699. This work was supported by the National Nuclear Security Agency Office of Defense Nuclear Nonproliferation Research and Development.References
-
International Atomic Energy Agency, Nuclear Power Reactors in the World, Reference Data Series No. 2, IAEA, Vienna, 2023 Search PubMed
.
- L. Desgranges, B. Pasquet, C. Valot and I. Roure, J. Nucl. Mater., 2009, 385, 99–102 CrossRef CAS
- A. Schubert, P. Van Uffelen, J. van de Laar, C. T. Walker and W. Haeck, J. Nucl. Mater., 2008, 376, 1–10 CrossRef CAS
- S. K. Hanson and A. D. Pollington, J. Anal. At. Spectrom., 2021, 36, 1018–1027 RSC
- C. T. Walker, S. Bremier, S. Portier, R. Hasnaoui and W. Goll, J. Nucl. Mater., 2009, 393, 212–223 CrossRef CAS
- T. P. Makarova, B. A. Bibichev and V. D. Domkin, Radiochemistry, 2008, 50, 414–426 CrossRef CAS
- S. Konegger-Kappel and T. Prohaska, Anal. Bioanal. Chem., 2016, 408, 431–440 CrossRef CAS PubMed
- A. Gourgiotis, M. Granet, H. Isnard, A. Nonell, C. Gautier, G. Stadelmann, M. Aubert, D. Durand, S. Legand and F. Chartier, J. Anal. At. Spectrom., 2010, 25, 1939–1945 RSC
- M. Guillong, P. Heimgartner, Z. Kopajtic, D. Günther and I. Günther-Leopold, J. Anal. At. Spectrom., 2007, 22, 399–402 RSC
- Y. K. Ha, S. H. Han, H. G. Kim, W. H. Kim and K. Y. Jee, Nucl. Eng. Technol., 2008, 40, 311–318 CrossRef CAS
- M. R. Savina, B. H. Isselhardt and R. Trappitsch, Anal. Chem., 2021, 93, 9505–9512 CrossRef CAS PubMed
- M. Raiwa, S. Buchner, N. Kneip, M. Weiss, P. Hanemann, P. Fraatz, M. Heller, H. Bosco, F. Weber, K. Wendt and C. Walther, Spectrochim. Acta, Part B, 2022, 190, 106377 CrossRef CAS
- H. Bosco, L. Hamann, N. Kneip, M. Raiwa, M. Weiss, K. Wendt and C. Walther, Sci. Adv., 2021, 7, eabj1175 CrossRef CAS PubMed
- R. V. Ambartzumian and V. S. Letokhov, Appl. Opt., 1972, 11, 354–358 CrossRef CAS PubMed
- T. Sakamoto, M. Morita, K. Kanenari, H. Tomita, V. Sonnenschein, K. Saito, M. Ohashi, K. Kato, T. Iguchi, T. Kawai, T. Okumura, Y. Satou and I. Wakaida, Anal. Sci., 2018, 34, 1265–1270 CrossRef CAS PubMed
- T. Stephan, R. Trappitsch, A. M. Davis, M. J. Pellin, D. Rost, M. R. Savina, R. Yokochi and N. Liu, Int. J. Mass Spectrom., 2016, 407, 1–15 CrossRef CAS
- G. Vering, C. Crone, P. Kathers, J. Bijma and H. F. Arlinghaus, Appl. Surf. Sci., 2006, 252, 7163–7166 CrossRef CAS
- M. Mandel, L. Holtmann, M. Raiwa, A. Wunnenberg-Gust, B. Riebe and C. Walther, J. Hazard. Mater., 2022, 423, 127143 CrossRef CAS PubMed
-
S. F. Mughabghab, in Atlas of Neutron Resonances, ed. S. F. Mughabghab, Elsevier, Amsterdam, 2018, pp. 111–679, DOI:10.1016/b978-0-44-463780-2.00015-3
- Y. Takagai, M. Furukawa, Y. Kameo and K. Suzuki, Anal. Methods, 2014, 6, 355–362 RSC
- M. R. Savina, B. H. Isselhardt, D. Z. Shulaker, M. Robel, A. J. Conant and B. J. Ade, Sci. Rep., 2023, 13, 5193 CrossRef CAS PubMed
- Y. Liu, E. Romero-Romero, D. Garand, J. D. Lantis, K. Minamisono and D. W. Stracener, Spectrochim. Acta, Part B, 2019, 158, 105640 CrossRef CAS
- L. W. Green, G. A. McRae and P. A. Rochefort, Phys. Rev. A, 1993, 47, 4946–4954 CrossRef CAS PubMed
- D. R. Spiegel, W. F. Calaway, G. A. Curlee, A. M. Davis, R. S. Lewis, M. J. Pellin, D. M. Gruen and R. N. Clayton, Anal. Chem., 2002, 66, 2647–2655 CrossRef
- R. Trappitsch, D. Z. Shulaker, W. J. Ong, M. R. Savina and B. H. Isselhardt, J. Radioanal. Nucl. Chem., 2022, 331(12), 5199–5204 CrossRef CAS
- N. Kneip, C. E. Dullmann, V. Gadelshin, R. Heinke, C. Mokry, S. Raeder, J. Runke, D. Studer, N. Trautmann, F. Weber and K. Wendt, Hyperfine Interact., 2020, 241, 45 CrossRef
-
K. P. Carney and R. K. Hague, Irradiated BR-3 Fuel Pin I-334 Bulk Analysis Results, Idaho National Laboratory, 2017 Search PubMed
- M. R. Savina, B. H. Isselhardt, A. Kucher, R. Trappitsch, B. V. King, D. Ruddle, R. Gopal and I. Hutcheon, Anal. Chem., 2017, 89, 6224–6231 CrossRef CAS PubMed
-
M. Savina and R. Trappitsch, in Photoionization and Photo-Induced Processes in Mass Spectrometry, 2021, pp. 215–244, DOI:10.1002/9783527682201.ch6
-
C. E. Moore, Atomic Energy Levels, National Bureau of Standards (US), 1971 Search PubMed
- E. Langlois and J.-M. Gagné, J. Opt. Soc. Am. B, 1993, 10, 774–783 CrossRef CAS
- C. Bourauel, W. Rupprecht and S. Buttgenbach, Z. Phys. D: At., Mol. Clusters, 1987, 7, 129–132 CrossRef CAS
- S. Hasegawa and D. Nagamoto, J. Phys. Soc. Jpn., 2017, 86, 104302 CrossRef
- M. G. Littman, M. M. Kash and D. Kleppner, Phys. Rev. Lett., 1978, 41, 103–107 CrossRef CAS
- M. R. Savina, R. Trappitsch, A. Kucher and B. H. Isselhardt, Anal. Chem., 2018, 90, 10551–10558 CrossRef CAS PubMed
- F. Schneider, K. Chrysalidis, H. Dorrer, C. E. Dullmann, K. Eberhardt, R. Haas, T. Kieck, C. Mokry, P. Naubereit, S. Schmidt and K. Wendt, Nucl. Instrum. Methods Phys. Res., Sect. B, 2016, 376, 388–392 CrossRef CAS
- P. Lambropoulos and A. Lyras, Phys. Rev. A, 1989, 40, 2199–2202 CrossRef CAS PubMed
- W. M. Fairbank, M. T. Spaar, J. E. Parks and J. M. R. Hutchinson, Phys. Rev. A, 1989, 40, 2195–2198 CrossRef CAS PubMed
- D. van Eerten, M. Raiwa, P. Hanemann, L. Leifermann, T. Weissenborn, W. Schulz, M. Weiß, D. Z. Shulaker, P. Boone, D. Willingham, K. Thomas, B. Sammis, B. Isselhardt, M. Savina and C. Walther, J. Hazard. Mater., 2023, 452, 131338 CrossRef CAS PubMed
-
NEA, The JEFF-3.1.1 Nuclear Data Library, OECD Publishing, Paris, 2009 Search PubMed
- C. Matthews, C. Unal, J. Galloway, D. D. Keiser Jr. and S. L. Hayes, Nucl. Technol., 2017, 198, 231–259 CrossRef
- J. M. Harp, L. Capriotti, D. L. Porter and J. I. Cole, J. Nucl. Mater., 2020, 528, 151840 CrossRef CAS
Footnotes |
| † Electronic supplementary information (ESI) available. See DOI: https://doi.org/10.1039/d4ja00065j |
| ‡ Note that the Zr sputtering yield given in ref. 25 is different due to the inclusion of a correction factor to account for Ga implantation in the Zr metal. That sputtering yield (s = 3.67) referred to the overall sputtering yield of the Ga–Zr alloy produced by dynamic sputtering. Here we have rolled the correction factor into the sputtering yield prior to calculating the useful yield, so that s is the sputtering yield for Zr, not the alloy. |
| This journal is © The Royal Society of Chemistry 2024 |