
 Open Access Article
 This Open Access Article is licensed under a
 Creative Commons Attribution 3.0 Unported Licence
Evaluating accuracy improvements of laser ablation ICPMS element analysis in silicate glasses and carbonates via downhole fractionation correction – an old problem re-assessed†
Romi
Nambiar
 *ab,
Wolfgang
Müller
ab and
David
Evans‡
ab
*ab,
Wolfgang
Müller
ab and
David
Evans‡
ab
aInstitute of Geosciences, Goethe University Frankfurt, Altenhöferallee 1, 60438 Frankfurt am Main, Germany. E-mail: Nambiar@geo.uni-frankfurt.de
bFIERCE, Frankfurt Isotope & Element Research Center, Goethe University Frankfurt, 60438 Frankfurt am Main, Germany
First published on 16th April 2024
Abstract
Non-matrix-matched calibration of laser ablation ICPMS (trace/major) element data is a common quantification strategy. However, LA sampling is associated with downhole elemental fractionation, potentially causing inaccuracies if the magnitude of fractionation between the sample and reference material (RM) differs. Here, we estimate fractionation factors (FFs) for different elements (El) in a range of RMs relative to NIST SRM610/612 (FFEl/Ca-NIST) and evaluate element-specific corrections for downhole fractionation using these measured FFEl/Ca-NIST. Significantly different mean El/Ca values were observed before and after correction, particularly for the alkali elements (all RMs), and B, Fe, and Zn (some RMs), notably improving accuracy, especially for the alkali elements. In cases where this methodology does not result in an accuracy improvement, this may help identify underlying issues in reported/reference values for RMs, given that this phenomenon should be accounted for. Overall, we recommend considering routine assessment of FFs and applying a FF correction to enhance data quality.
1. Introduction
When using laser ablation (LA) as an ICPMS sample introduction system for spatially-resolved compositional analysis, elemental and isotopic fractionation occurs, related to matrix-dependent laser-sample coupling, particle-size distribution, preferential ablation of volatile elements or deposition of those with lower condensation temperatures,1–3 in addition to plasma loading and heterogeneity, and matrix-dependent ionisation efficiency.4–6 For example, Jeffries et al.7 showed that switching from a 1064 nm laser to shorter wavelengths (213 and 266 nm) improved the ablation behaviour of geological materials and improved overall measurement accuracy, due to improved laser-sample coupling. Following this work, several studies have demonstrated that the use of shorter wavelength lasers improves data quality for a wide range of geological reference materials, as most minerals show better absorption at shorter wavelengths,4,8–12 with 193 nm LA now being common given that matrix-matched standardisation is often not possible.When utilising LA as a sampling methodology, spot analysis (depth-profiling) remains the approach with the highest (vertical) spatial resolution. This method is capable of revealing elemental heterogeneity at sub-μm resolution, providing insights into diverse mineral formation processes from elemental zoning in igneous minerals13 to biominerals formed by marine calcifying organisms.9,14–17 However, during LA spot analysis, ablation-induced fractionation as a function of time, relatable in broad terms to element volatility/condensation temperature,18 usually referred to as ‘downhole fractionation’, can be a significant source of inaccuracy, particularly when the magnitude of this effect differs between the sample and calibration reference material. These phenomena of downhole fractionations were already reported in the early days of the LA pioneer period in the 1990s.19 Downhole fractionation is usually influenced by an analyte's geochemical affinity with the chosen internal standard, with elements from the same grouping in Goldschmidt's20 geochemical classifications characterised by similar behaviour.18 However, there are some exceptions; for example, the alkali elements often do not fractionate in the same way as other lithophile elements.21,22
Efforts to minimise potential sources of inaccuracy due to downhole fractionation have focused to a large degree on hardware solutions and related analytical approaches, with the broad shift to 193 nm ArF lasers in the Earth and Environmental Sciences resulting in substantially lower downhole element fractionation compared to 213 nm lasers.23 In addition: (1) the ablation pit geometry (depth-diameter ratio) has been shown to exert an influence on downhole fractionation, with higher depth/width aspect ratios largely resulting in more pronounced fractionation,24,25 and (2) downhole fractionation is less pronounced in a helium atmosphere compared to argon at a similar depth/diameter ratio.24,26 To overcome issues related to downhole fractionation, the most ideal approach would be using matrix-matched reference materials. Where these are unavailable, calibration or characterisation of this issue using in-house standards has also been proposed, e.g., by co-precipitation of elements into a CaCO3 matrix27 or adding standard solutions to a powder base.28,29 However, these approaches, in turn, require the (time-consuming) comprehensive characterization of the composition and homogeneity of any standard materials before they are used for this purpose.
Correction for downhole fractionation is common practise when high precision (permil-level) accuracy and precision are required, for example, for U–Pb geochronology.30–32 However, despite this being a widely-known issue, to our knowledge, only one study has attempted to correct for downhole fractionation associated with trace element determinations following non-matrix matched standardisation,33 using a model derived from the compositionally-matching reference material applied to the sample (i.e., matrix matched reference material is still ideally required). Fractionation factors may be as large as ±30% (Jochum et al., 2014) and depend on the analyte and sample matrix, such that failing to account for this issue could lead to important inaccuracies given that low-% level accuracy and precision is desirable when making trace element measurements.
Here, we determine fractionation factors for various common analytes, including the alkali elements (Li, Na, K), alkaline earth metals (Mg, Sr, Ba), metalloid (B), and transition metals (Fe, Zn) in a range of reference materials including the silicate MPI-DING glasses, GOR128-G, GOR132-G, KL2-G, and ATHO-G as well as nano-pellets of the carbonate reference materials JCp-1NP, JCt-1NP and MACS-3NP.34 We compare this information to the respective fractionation factor values in NIST SRM610/612, the most commonly used primary standards, and evaluate the contribution of downhole fractionation to inaccuracy. Finally, we show how measured fractionation factors, inherently available in the data collected in any case, can be used to directly correct for element-specific fractionation.
2. Instrumentation
All measurements were conducted using the LA-ICPMS instrumentation at the Frankfurt Isotope and Element Research Center (FIERCE), Goethe University Frankfurt. The setup consists of a RESOlution 193 nm ArF laser ablation system (Applied Spectra Inc., formerly Resonetics LLC), with a Laurin Technic S-155 two-volume laser ablation cell,35 coupled to a magnetic sector-field ICPMS (ThermoFisher Scientific Element XR). The details of the laser ablation system and ICPMS operating parameters are given in Table 1. Standardisation from count ratios to molar El/Ca was performed using an in-house Matlab script22 that identifies the sample counts, subtracts the adjacent background values, and calibrates the data using a depth-dependent measured/reported element/43Ca ratio derived from repeat analysis of the NIST SRM61X glasses (here, 43Ca is used as internal standard). In this way, as we do not simply use the mean NIST count rates, downhole fractionation is already accounted for to a degree, but different fractionation behaviour between matrices is not. The values for NIST SRM610 and NIST SRM612 were taken from Jochum et al.,36 with the exception of Mg, for which we follow the suggestion of Evans and Müller, 2018 (ref. 22) and use a [Mg] value for NIST SRM610/612 of 465 μg g−1 (ref. 37) and 62.4 μg g−1,22 respectively. We assess accuracy and matrix-dependent fractionation using the MPI-DING glasses38 and nano-pellets of three commonly used carbonate reference materials (RMs) listed above. In the latter case, we assess accuracy using the values reported by Jochum et al.,39 and the GEOREM database, version 34 (ref. 40) (preferred values). In the case of K/Ca, we use an ICP-OES value of the original JCp-1 reference material,41 which agrees with its nano-pellet (JCp-1NP) K/Ca value measured using LA-ICPMS.42 For the K/Ca value in JCt-1NP and MACS-3NP, we used the recently reported average of medium and high-resolution LA-ICPMS measurements.42| RESOlution laser ablation (LA) system (now Applied Spectra) | |
| Wavelength | 193 nm |
| Sampling mode | Spot (depth profiling) analysis |
| Fluence/repetition rate | ∼6.3 J cm−2/3 Hz |
| Ablation spot size/ablation time | 50 μm/60 s |
| He flow | 300–400 mL min−1 |
| N2 flow | 2.5–4.0 mL min−1 |
![[thin space (1/6-em)]](https://www.rsc.org/images/entities/char_2009.gif) |
|
| Element XR Inductively Coupled Plasma Mass Spectrometer (ICPMS) - (ThermoFisher Scientific) | |
| Mass resolution | Medium mass resolution |
| Torch RF power | 1300–1380 W |
| Sample cone/skimmer cone | Ni Jet cone/Ni H cone |
| Sample gas flow | 0.86–1.00 L min−1 |
| Auxiliary gas flow | 0.65–0.90 L min−1 |
| Monitored elements (m/z) | 7Li, 11B, 23Na, 25Mg, 39K, 43Ca, 56Fe, 66Zn, 88Sr, and 138Ba (43Ca used as internal standard) |
| Sensitivity measured on NIST SRM612 (60 μm; 6 Hz) in low mass resolution (LR) mode | >4.5 million cps on 238U |
| ThO+/Th+ (m/z 248/232) in LR mode | <1% |
| Doubly charged production rate (m/z 22/44) in LR mode | <2% |
3. Results and discussion
3.1. Ablation-induced fractionation
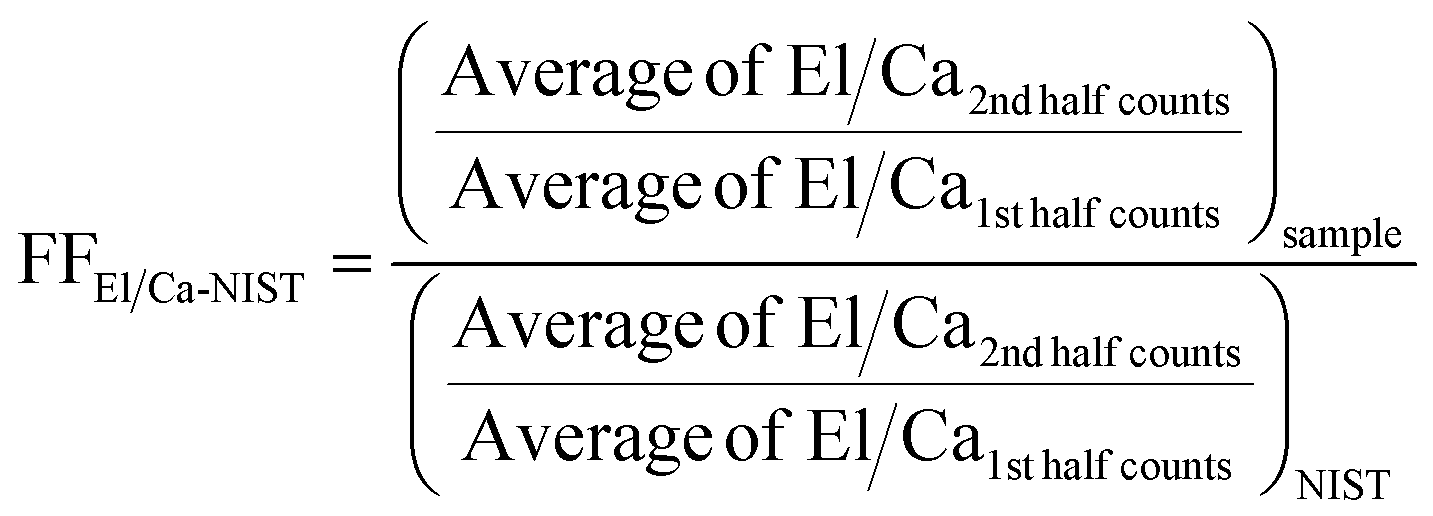
Downhole elemental fractionation can be estimated using the fractionation factor (FF) as suggested by Fryer et al.,19 which is calculated by dividing the average count rate ratio during the second half of an analysis by the first half, normalised to an internal standard, in this case,43Ca:| FF = (X/43Ca0.5t–1t)/(X/43Ca0–0.5t), |
 | ||
| Fig. 1 (A) The relationship between the downhole fractionation factors of several elements in different reference materials with respect to (wrt) NIST SRM612 versus NIST SRM610 shows a tight correlation close to a 1:1 line (red dashed line). Different symbols represent different elements, depicting the alkali elements (blue), alkaline earth metals (green), metalloids (yellow), and transition metals (pink). Each set of symbols consists of seven distinct reference materials (see panel B). (B) An equivalent plot for Li that distinguishes between the various reference materials; for all other elements see Fig. S1.† The number of session (s) and replicates (r) were: GOR128-G (s = 14, r = 150); GOR132-G (s = 14, r = 146); ATHO-G (s = 2, r = 23); KL2-G (s = 2, r = 25); JCp-1NP (s = 14, r = 148); JCt-1NP (s = 14, r = 148) and MACS-3NP (s = 14, r = 147). | ||
Averaging over all measurements, a tight correlation close to a 1:1 line was observed between the fractionation factor relative to NIST SRM610 versus NIST SRM612 for all elements in a range of reference materials, as expected, given their very similar matrix. Only the Ba FFs showed a poorer correlation between the seven RMs (R2 = 0.51, p = 0.07; Fig. S1†), although all values are within error of a 1:1 line. Overall, this is in good agreement with the earlier finding that the fractionation of elements in NIST SRM610 relative to NIST SRM612 using a 193 nm ArF laser were non-resolvable with the exception of a few volatile elements such as V, Zn, and Pb.22 Given that overall FF relative to NIST SRM610 and NIST SRM612 are comparable, in the next section, we use the NIST SRM610 calibrated data to demonstrate the utility of downhole fractionation correction but note that our results imply that a correction based on either standard would function in the same way.
This exercise (further) highlights that the volatile elements (Li and Zn in particular) are substantially offset from values of 1, i.e., characterised by substantially differing downhole fractionation between RMs. Specifically, the percentage differences between the RMs and NIST SRM610 fractionation factors were −3% to 18% for Li, the element displaying the highest degree of downhole fractionation. The FFEl/Ca_percent of Na and K ranged between −3 to 4% and −3 to 5%, respectively. In contrast, the alkaline earth metals showed the lowest FFEl/Ca_percent with all values ranging from −1% to 2%, which is one reason that non-matrix matched standardisation produces accurate data in these cases.22 In the case of B, the carbonate reference materials were characterised by greater offsets compared to NIST SRM610 (JCp-1NP = −8%, JCt-1NP = −6%, MACS-3NP = −8%) than the MPI-DING reference materials. In addition, Fe and Zn fractionation factors were offset by −2% to 3% and −15% to 2%, respectively. In the case of Zn, relatively lower degrees of offset (<2%) were observed for one carbonate and three MPI-DING glasses, in contrast to ATHO-G (−7%), JCp-1NP (−15%) and JCt-1NP (−10%). However, the RSD (n = 148) of the measured Zn fractionation factor was ∼50% for JCp-1NP and JCt-1NP, possibly resulting from the low [Zn] (<0.3 μg g−1) of these materials or inhomogeneity.
3.2. Downhole fractionation correction
In this section, we explore whether the use of a systematic correction based on measured downhole fractionation factors can result in an improvement in data quality for a range of elements (Li, B, Na, Mg, K, Fe, Zn, Sr, and Ba) when different geological reference materials are treated as unknowns using non-matrix matched calibration. To do so, we used the measured fractionation factors of each individual spot analysis to apply an accuracy correction on an analysis-specific basis via the following steps:(1) The molar El/Ca value was standardised using the in-house Matlab script as described in the methods section (here denoted as El/Cacal). The El/Cacal values represent the primary standardised data i.e., before the downhole fractionation correction is applied.
(2) The fractionation factor (FF) was determined for each individual spot analysis of the sample relative to the NIST primary calibration standard (averaged over each individual session/single instrument run given that the variability of FFNIST <0.5% for each session), denoted as FFEl/Ca-NIST:
 | (1) |
(3) A downhole fractionation correction was then applied to the (primary) standardised El/Cacal values using FFEl/Ca-NIST estimated for each individual spot analysis:
| El/Cacorrected = El/Cacal/FFEl/Ca-NIST | (2) |
In practical terms, this is approximately equivalent to regressing the analyte/internal standard count ratios versus time back to the respective y-axis intercept (as proposed in the case of U–Pb analysis45), which we avoid here simply because this approach may be sensitive to outliers. The resulting change in the accuracy of the measurements i.e., percent offset from reported values for the seven geological RMs, before and after applying the fractionation factor correction using eqn (2), measured over an ∼18 month period, is shown in Fig. 3. In order to verify if the shifts in El/Ca values following the correction for downhole fractionation is statistically different from the primary standardized El/Ca data, we utilise Student's t-test at the 95% confidence interval.
As expected, we find that analytes characterised by a greater degree of downhole fractionation relative to the NIST glass (Fig. 2) are associated with statistically significant changes (El/Cacalversus El/Cacorrected). In particular, the alkali elements resulted in significantly different mean values after the correction described above (eqn (1) and (2)). Specifically, Li/Ca, Na/Ca, and K/Ca accuracy were broadly improved in almost all RMs utilised here (Fig. 3, Table S1†). In contrast, applying a correction to the alkaline earth metals, which are characterised by the lowest degree of downhole fractionation relative to the primary NIST standard (Fig. 2), resulted in statistically indistinguishable mean values except for Mg in KL2-G (however, the long-term accuracy of Mg/Ca before and after fractionation correction were within 4%). In the case of B/Ca, we find a significant shift in accuracy for the carbonate RMs characterised by higher FFEl/Ca-NIST (Fig. 2) but not the MPI-DING glasses (Fig. 3, Table S1†). This correction for B/Ca resulted in a substantial improvement in accuracy in the case of JCt-1NP but a worsening of accuracy in the case of JCp-1NP and MACS-3NP. In addition, significant shifts in Zn/Ca and Fe/Ca accuracy resulted from the procedure outlined here, resulting in a worse apparent accuracy in the case of Zn/Ca in ATHO-G but an improvement in Zn/Ca accuracy in JCp-1NP and Fe/Ca accuracy in KL2-G.
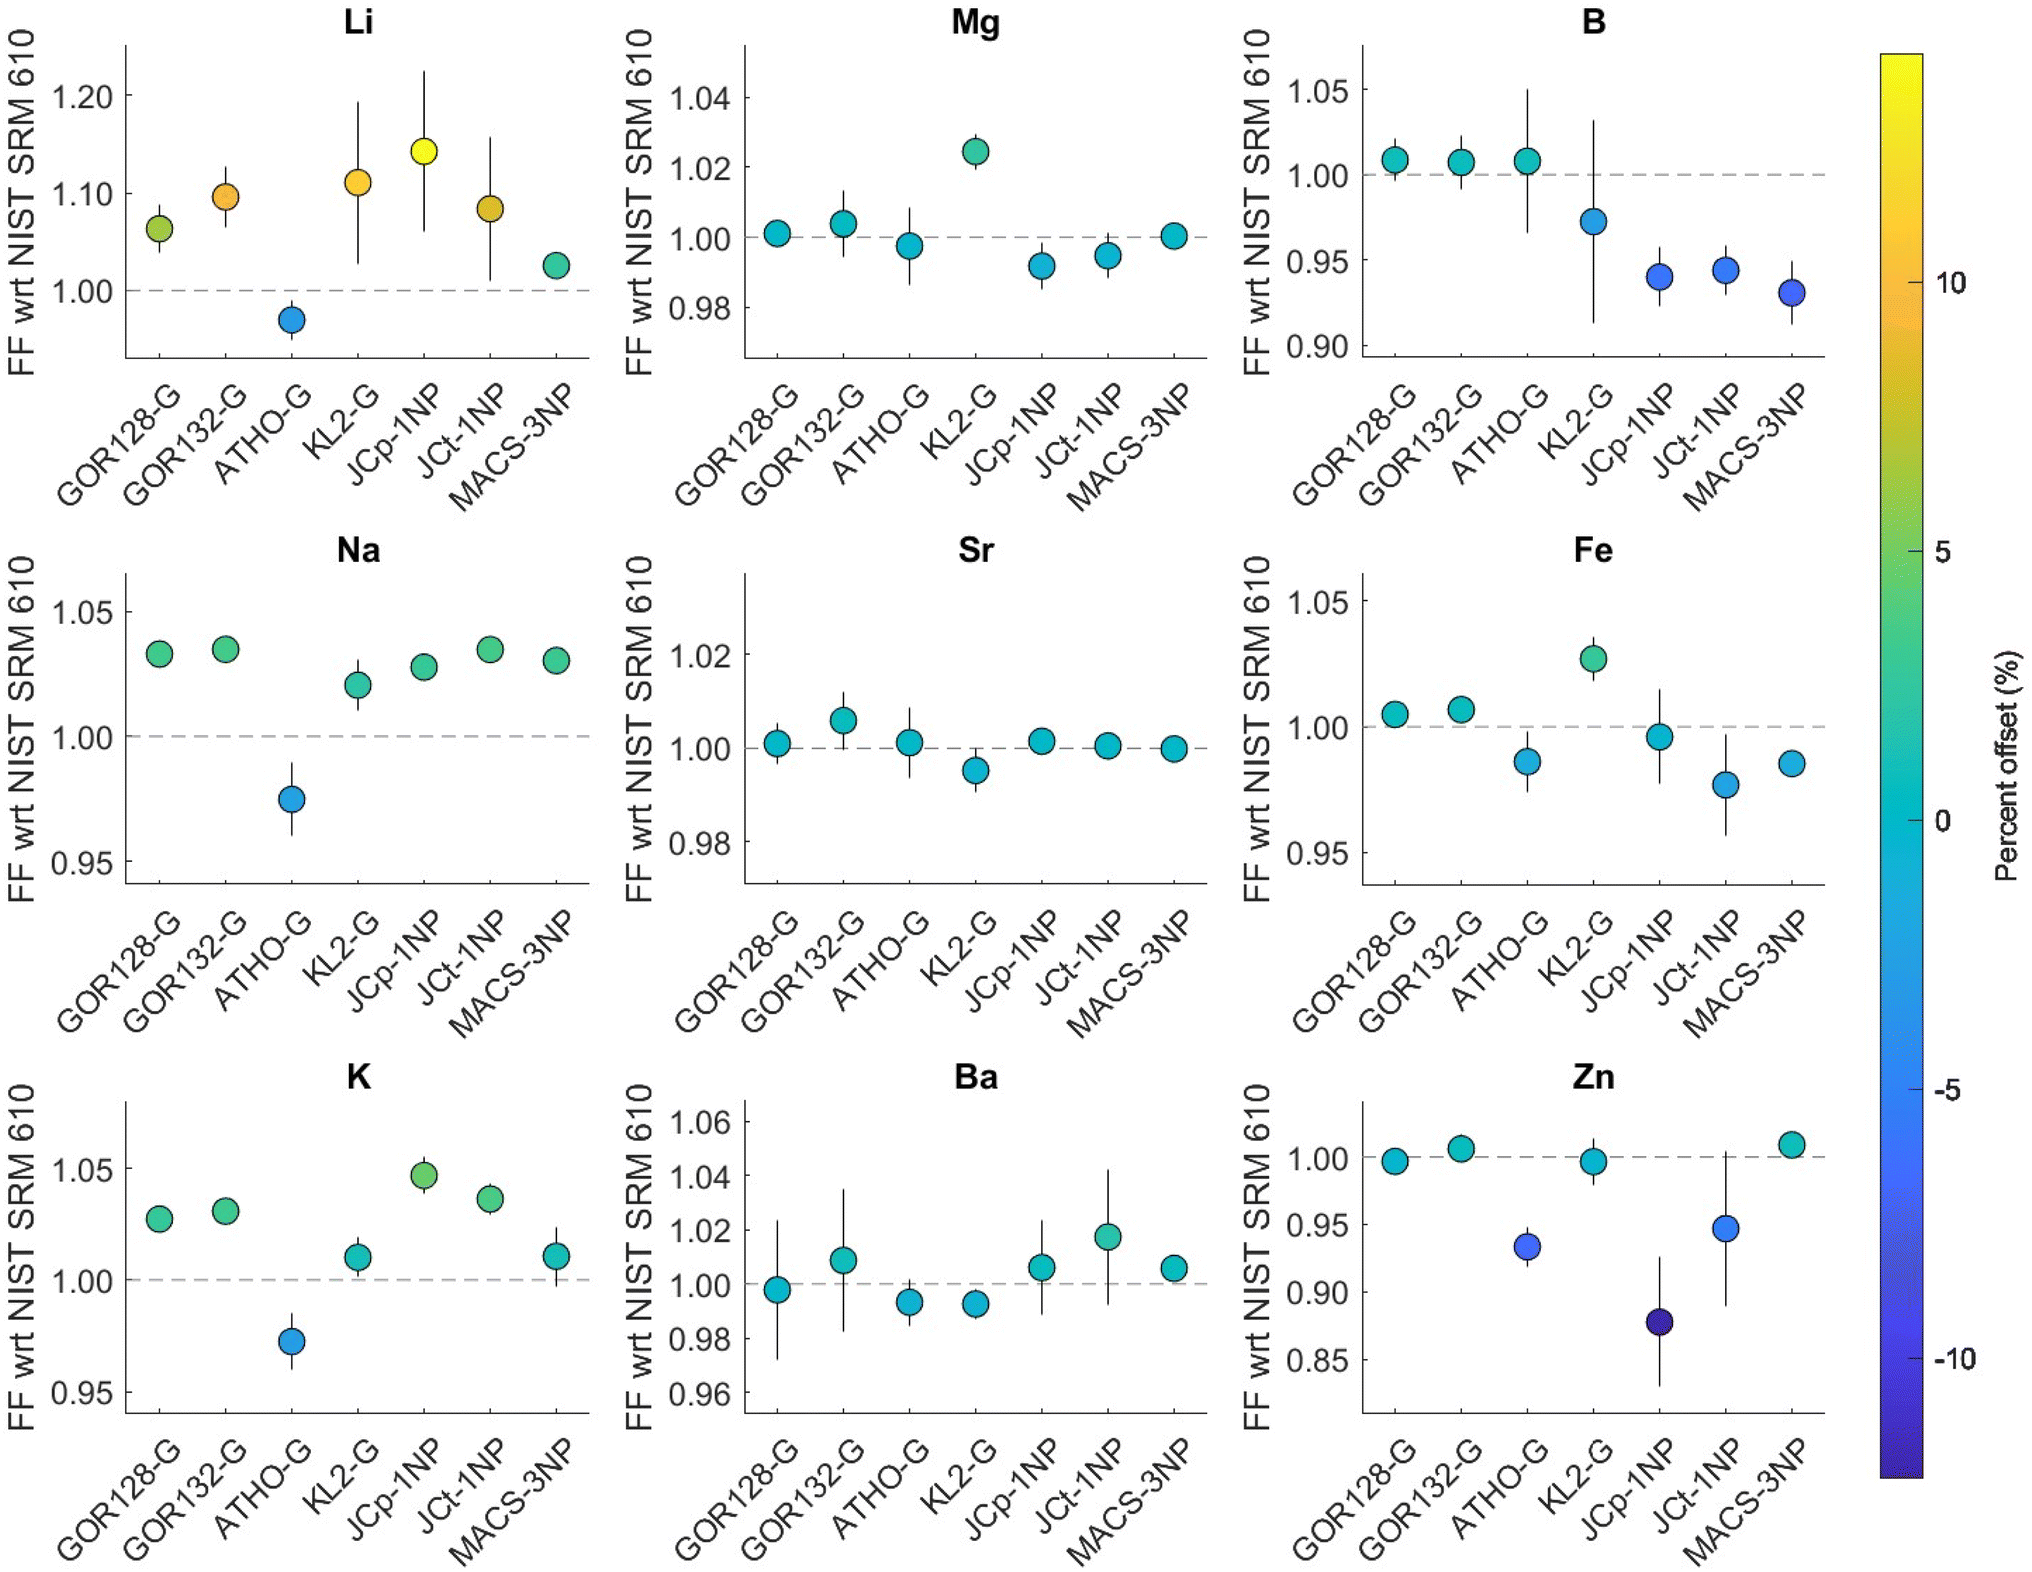 | ||
| Fig. 2 Long-term average of downhole fractionation of elements normalised to 43Ca in different reference materials relative to NIST SRM610. The error bars depict 2SE uncertainties estimated over all analyses from different sessions spanning ∼18 months. The dashed line represents the ideal case in which no fractionation occurs relative to the NIST primary reference material. The symbol colour shows the percentage offset of fractionation from the ideal case. The number of session (s) and replicates (r) were: GOR128-G (s = 14, r = 150); GOR132-G (s = 14, r = 146); ATHO-G (s = 2, r = 23); KL2-G (s = 2, r = 25); JCp-1NP (s = 14, r = 148); JCt-1NP (s = 14, r = 148); MACS-3NP (s = 14, r = 147). | ||
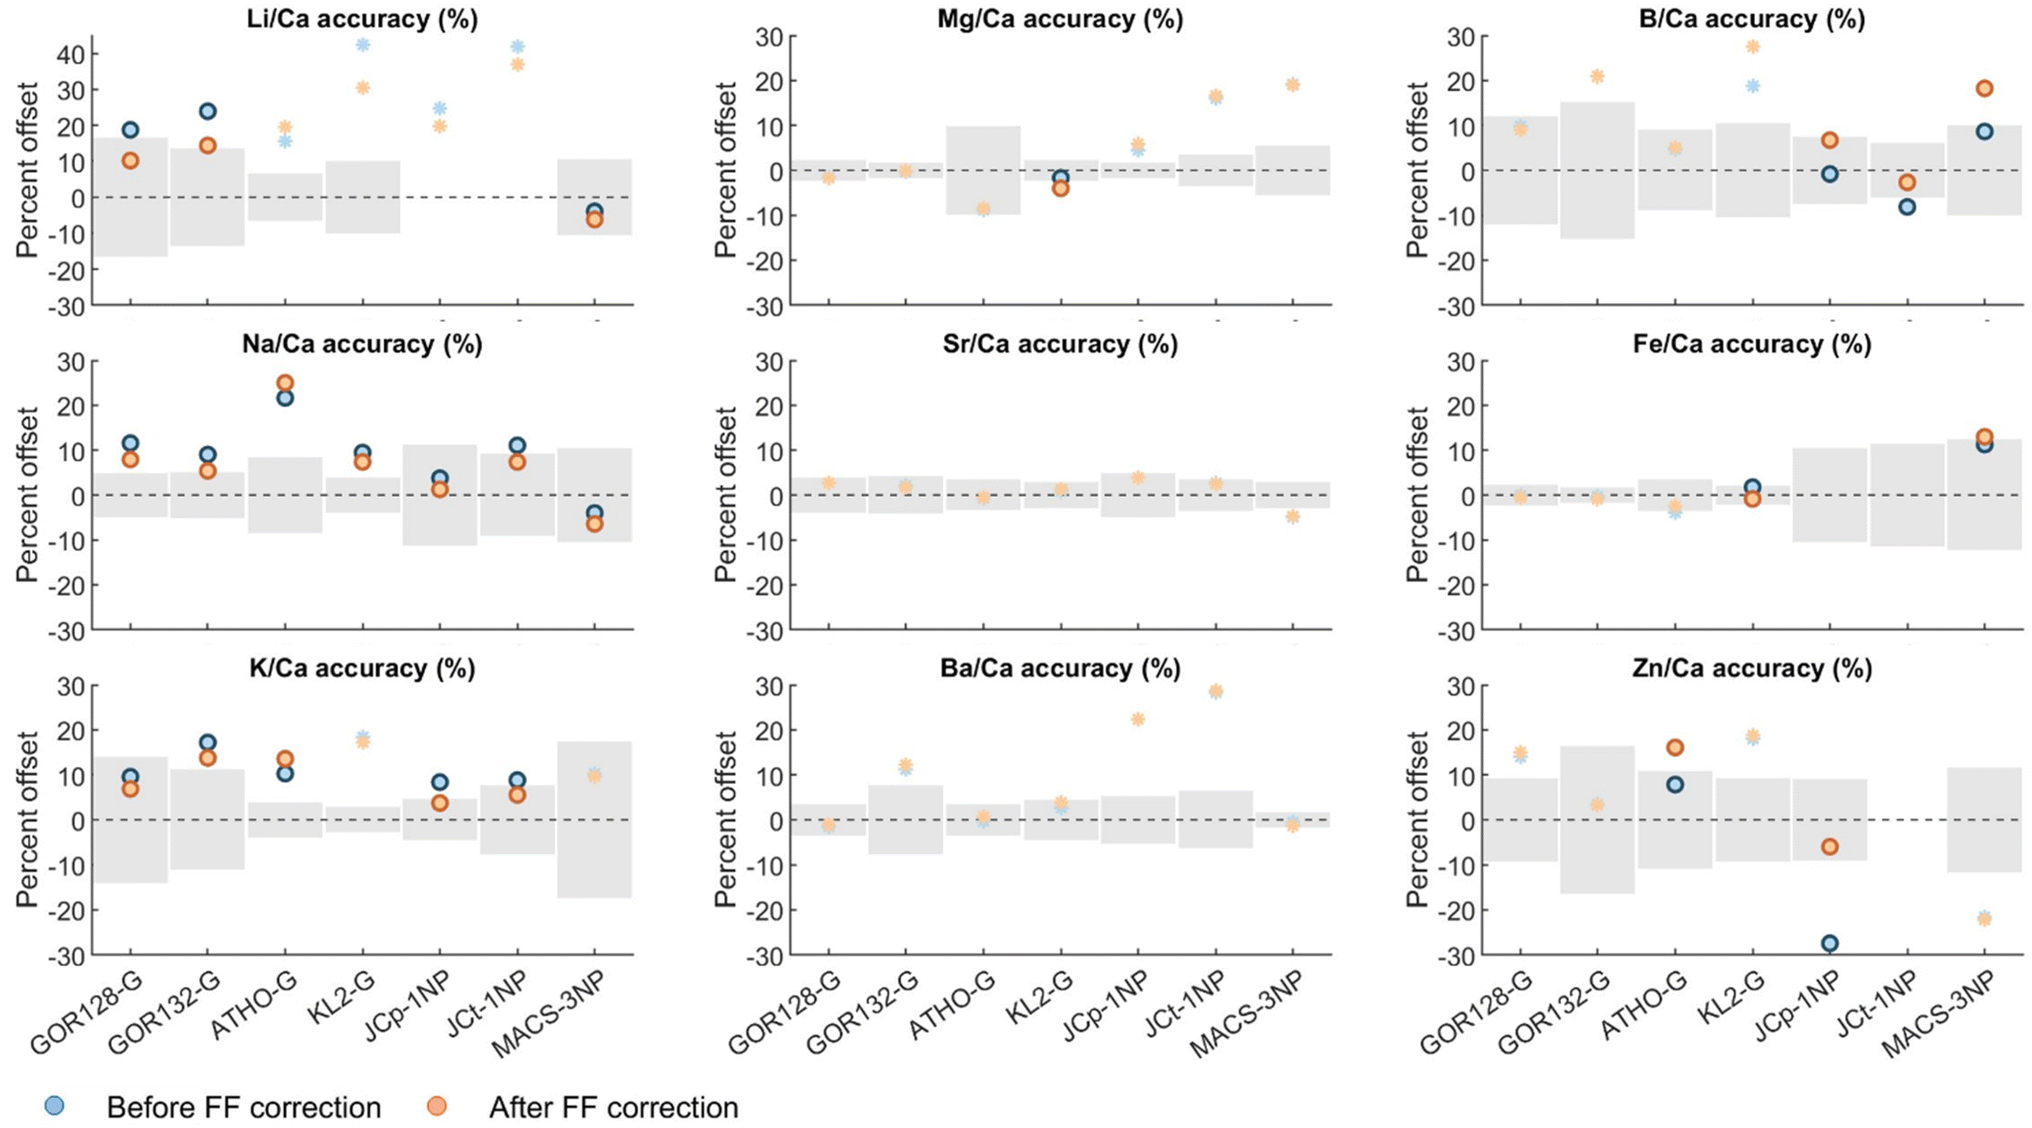 | ||
| Fig. 3 Percent offset in El/Ca from the reported value of different geological reference materials before (blue) and after (orange) a downhole fractionation correction (eqn (1) and (2)). Solid symbols represent analyte/standard combinations characterised by statistically different population means before and after downhole fractionation correction based on a Student's t-test (95% CI); asterisks depict combinations for which the correction made no significant difference. Where data points are missing, analytes were below the limit of detection, and/or there is no reported value. The grey shaded region represents the uncertainty in the reported values (MPI-DING reference materials: 95% CL; carbonate reference materials: 1SD). | ||
The above results demonstrate a substantial improvement in accuracy for several analytes in the reference materials studied here (while exerting no appreciable impact on precision). Given that the resultant El/Ca following the proposed correction are significantly different for elements characterised by a greater degree of downhole fractionation, our results highlight the potential of applying this correction in improving data quality while performing non-matrix matched calibration. At the very least, this exercise serves to highlight specific cases in which such a correction is warranted, namely, the non-matrix-matched calibration of the alkali elements, and even in cases in which accuracy is not improved we nonetheless suggest that the approach taken here should be routinely applied and built into data reduction software. The rationale for this is that the reference values for many analytes in many reference materials are not well-characterised, a well-known issue with LA-ICPMS trace element analysis,40 and these have often been determined with a degree of circularity (i.e., the reported/reference values are derived to a large extent from LA measurements22). Given that downhole fractionation is demonstrably a complication for some of the analyte/matrix combinations reported here (e.g., B in carbonates), this is an analytical phenomenon that should be accounted for. The worsening of accuracy that we observe in some cases (Fig. 3) may, therefore, point towards an issue with the reported values, previously masked to a degree by a coincident (analytical) offset in the same direction. In the case that the reported/reference values were derived (mainly) from LA measurements, an apparent worsening in accuracy following our procedure may also result from the previous lack of a correction along the lines of that suggested here (for example, the available values of [B] in JCp-1NP, JCt-1NP, and MACS-3NP are based on LA-ICPMS/LA-MC-ICPMS; GEOREM database, version 35 (ref. 40)).
4. Conclusion
In this study, we evaluated the data quality of trace/major element measurements in seven commonly used reference materials conducted over multiple sessions spanning ∼18 months and under similar ablation and tuning conditions. As is well-known, we observed substantial downhole fractionation for several elements, such as the alkali elements, B, and Zn, relative to the primary NIST SRM610/612 calibration standard, which is likely to be a significant source of analytical bias when using this (common) analytical approach. For this reason, we propose the application of element-specific downhole fractionation corrections on an individual analysis basis, using the measured sample/reference material fractionation factor ratio measured simultaneously. Applying this to our long-term dataset, we show that this correction results in an overall substantial improvement in accuracy, especially for the alkali elements, but a worsening of apparent accuracy in some other cases. However, given that downhole fractionation is clearly an issue for some analyte/matrix combinations, we suggest that these latter cases may point towards instances in which potential unidentified issues with the reported values may be a fruitful line of future investigation, rather than an issue with the correction suggested here per se. Overall, the results of this study highlight the importance of identifying element-specific downhole fractionation and the utility of applying a correction based on this information to improve accuracy overall.Author contributions
Romi Nambiar: conceptualization; methodology; formal analysis; writing—original draft; writing—review and editing. Wolfgang Müller and David Evans: conceptualization; resources; writing—review and editing.Conflicts of interest
There are no conflicts of interest to declare.Acknowledgements
This work is part of the VeWA consortium funded by the Hessen State Ministry for Higher Education, Research, and the Arts (HMWK) through the LOEWE program. FIERCE is financially supported by the Wilhelm and Else Heraeus Foundation and by the Deutsche Forschungsgemeinschaft (DFG: INST 161/921-1 FUGG, INST 161/923-1 FUGG and INST 161/1073-1 FUGG), which is gratefully acknowledged. This is FIERCE contribution No. 157. We gratefully acknowledge the comments of two anonymous reviewers that helped to improve our manuscript.References
- H. R. Kuhn and D. Günther, Anal. Chem., 2003, 75, 747–753 CrossRef CAS PubMed.
- R. E. Russo, X. L. Mao, O. V. Borisov and L. Haichen, J. Anal. At. Spectrom., 2000, 15, 1115–1120 RSC.
- I. Horn and F. von Blanckenburg, Spectrochim. Acta, Part B, 2007, 62, 410–422 CrossRef.
- M. Guillong and D. Günther, J. Anal. At. Spectrom., 2002, 17, 831–837 RSC.
- I. Kroslakova and D. Günther, J. Anal. At. Spectrom., 2007, 22, 51–62 RSC.
- J. Fietzke and M. Frische, J. Anal. At. Spectrom., 2016, 31, 234–244 RSC.
- T. E. Jeffries, S. E. Jackson and H. P. Longerich, J. Anal. At. Spectrom., 1998, 13, 935–940 RSC.
- E. C. Hathorne, R. H. James, P. Savage and O. Alard, J. Anal. At. Spectrom., 2008, 23, 240–243 RSC.
- W. Müller and J. Fietzke, Elements, 2016, 12, 329–334 CrossRef.
- M. Guillong, I. Horn and D. Günther, J. Anal. At. Spectrom., 2003, 18, 1224–1230 RSC.
- P. J. Sylvester and S. E. Jackson, Elements, 2016, 12, 307–310 CrossRef CAS.
- D. Günther, R. Frischknecht, C. A. Heinrich and H. J. Kahlert, J. Anal. At. Spectrom., 1997, 12, 939–944 RSC.
- A. Neubeck, M. Tulej, M. Ivarsson, C. Broman, A. Riedo, S. McMahon, P. Wurz and S. Bengtson, Int. J. Astrobiol., 2016, 15, 133–146 CrossRef CAS.
- S. Eggins, P. De Deckker and J. Marshall, Earth Planet. Sci. Lett., 2003, 212, 291–306 CrossRef CAS.
- D. Evans, J. Erez, S. Oron and W. Müller, Geochim. Cosmochim. Acta, 2015, 148, 325–342 CrossRef CAS.
- E. C. Hathorne, O. Alard, R. H. James and N. W. Rogers, Geochem., Geophys., Geosyst., 2003, 4 DOI:10.1029/2003GC000539.
- J. Fietzke, F. Ragazzola, J. Halfar, H. Dietze, L. C. Foster, T. H. Hansteen, A. Eisenhauer and R. S. Steneck, Proc. Natl. Acad. Sci. U. S. A., 2015, 112, 2960–2965 CrossRef CAS PubMed.
- H. P. Longerich, D. Günther and S. E. Jackson, Fresenius' J. Anal. Chem., 1996, 355, 538–542 CrossRef CAS PubMed.
- B. J. Fryer, S. E. Jackson and H. P. Longerich, Can. Mineral., 1995, 33, 303–312 CAS.
- V. M. Goldschmidt, J. Chem. Soc., 1937, 655–673 RSC.
- J. Míková, J. Košler, H. P. Longerich, M. Wiedenbeck and J. M. Hanchar, J. Anal. At. Spectrom., 2009, 24, 1244–1252 RSC.
- D. Evans and W. Müller, Geostand. Geoanal. Res., 2018, 42, 159–188 CrossRef CAS.
- D. Günther and C. A. Heinrich, J. Anal. At. Spectrom., 1999, 14, 1369–1374 RSC.
- A. J. G. Mank and P. R. D. Mason, J. Anal. At. Spectrom., 1999, 14, 1143–1153 RSC.
- S. E. Jackson, H. P. Longerich, G. R. Dunning and B. J. Fryer, Can. Mineral., 1992, 30, 1049–1064 CAS.
- S. M. Eggins, L. P. J. Kinsley and J. M. G. Shelley, Appl. Surf. Sci., 1998, 127, 278–286 CrossRef.
- V. R. Bellotto and N. Miekeley, Fresenius' J. Anal. Chem., 2000, 367, 635–640 CrossRef CAS PubMed.
- C. A. Craig, K. E. Jarvis and L. J. Clarkej, J. Anal. At. Spectrom., 2000, 15, 1001–1008 RSC.
- H. Traub, M. Wälle, J. Koch, U. Panne, R. Matschat, H. Kipphardt and D. Günther, Anal. Bioanal. Chem., 2009, 395, 1471–1480 CrossRef CAS PubMed.
- C. M. Allen and I. H. Campbell, Chem. Geol., 2012, 332, 157–165 CrossRef.
- C. Paton, J. D. Woodhead, J. C. Hellstrom, J. M. Hergt, A. Greig and R. Maas, Geochem., Geophys., Geosyst., 2010, 11 DOI:10.1029/2009GC002618.
- T. J. Ver Hoeve, J. S. Scoates, C. J. Wall, D. Weis and M. Amini, Chem. Geol., 2018, 483, 201–217 CrossRef CAS.
- B. Paul, J. Petrus, D. Savard, J. Woodhead, J. Hergt, A. Greig, C. Paton and P. Rayner, J. Anal. At. Spectrom., 2023, 38, 1995–2006 RSC.
- D. Garbe-Schönberg and S. Müller, J. Anal. At. Spectrom., 2014, 29, 990–1000 RSC.
- W. Müller, M. Shelley, P. Miller and S. Broude, J. Anal. At. Spectrom., 2009, 24, 209–214 RSC.
- K. P. Jochum, U. Weis, B. Stoll, D. Kuzmin, Q. Yang, I. Raczek, D. E. Jacob, A. Stracke, K. Birbaum, D. A. Frick, D. Günther and J. Enzweiler, Geostand. Geoanal. Res., 2011, 35, 397–429 CrossRef CAS.
- N. J. G. Pearce, W. T. Perkins, J. A. Westgate, M. P. Gorton, S. E. Jackson, C. R. Neal and S. P. Chenery, Geostand. Newsl., 1997, 21, 115–144 CrossRef CAS.
- K. P. Jochum, B. Stoll, K. Herwig, M. Willbold, A. W. Hofmiann, M. Amini, S. Aarburg, W. Abouchami, E. Hellebrand, B. Mocek, I. Raczek, A. Stracke, O. Alard, C. Bouman, S. Becker, M. Dücking, H. Brätz, R. Klemd, D. De Bruin, D. Canil, D. Cornell, C. J. De Hoog, C. Dalpé, L. Danyushevshy, A. Eisenhauer, Y. Gao, J. E. Snow, N. Groschopf, D. Günther, C. Latkoczy, M. Guillong, E. H. Hauri, H. E. Höfer, Y. Lahaye, K. Horz, D. E. Jacob, S. A. Kasemann, A. J. R. Kent, T. Ludwig, T. Zack, P. R. D. Mason, A. Meixner, M. Rosner, K. Misawa, B. P. Nash, J. Pfänder, W. R. Premo, W. D. Sun, M. Tiepolo, R. Vannucci, T. Vennemann, D. Wayne and J. D. Woodhead, Geochem., Geophys., Geosyst., 2006, 7 DOI:10.1029/2005GC001060.
- K. P. Jochum, D. Garbe-Schönberg, M. Veter, B. Stoll, U. Weis, M. Weber, F. Lugli, A. Jentzen, R. Schiebel and J. A. Wassenburg and others, Geostand. Geoanal. Res., 2019, 43, 595–609 CrossRef.
- K. P. Jochum, U. Nohl, K. Herwig, E. Lammel, B. Stoll and A. W. Hofmann, Geostand. Geoanal. Res., 2005, 29, 333–338 CrossRef CAS.
- T. Okai, A. Suzuki, H. Kawahata, S. Terashima and N. Imai, Geostand. Newsl., 2002, 26, 95–99 CrossRef CAS.
- R. Nambiar, J. F. Kniest, A. Schmidt, J. Raddatz, W. Müller and D. Evans, Rapid Commun. Mass Spectrom., 2024, 38 DOI:10.1002/rcm.9692.
- S. M. Eggins and J. M. G. Shelley, Geostand. Geoanal. Res., 2002, 26, 269–286 CrossRef CAS.
- J. S. Kane, Geostand. Newsl., 1998, 22, 7–13 CrossRef CAS.
- J. Košler, H. Fonneland, P. Sylvester, M. Tubrett and R. B. Pedersen, Chem. Geol., 2002, 182, 605–618 CrossRef.
Footnotes |
| † Electronic supplementary information (ESI) available. See DOI: https://doi.org/10.1039/d4ja00018h |
| ‡ Present address: School of Ocean and Earth Science, University of Southampton, Southampton, SO14 3ZH, UK. |
| This journal is © The Royal Society of Chemistry 2024 |