High-precision measurement of Ag isotopes for silicate rocks by MC-ICP-MS†
Yuan
Fang
a,
Qiu-Yu
Wen
a,
Zi-Cong
Xiao
a,
Hui-Min
Yu
 ab and
Fang
Huang
 *ab
*ab
aCAS Key Laboratory of Crust-Mantle Materials and Environments, School of Earth and Space Sciences, University of Science and Technology of China, Hefei, 230026, China. E-mail: fhuang@ustc.edu.cn
bCAS Center for Excellence in Comparative Planetology, University of Science and Technology of China, Hefei, 230026, China
First published on 16th April 2024
Abstract
Silver (Ag) isotopes can be useful geochemical and environmental tracers, but their applications are hindered by the challenges of Ag isotope analyses, especially for samples with extremely high matrix element and low Ag contents (<100 ng g−1). In this study, we developed a new protocol by using four-step chromatography for high-precision Ag isotope measurements for silicate samples. The δ109Ag values were measured using a multi-collector inductively coupled plasma mass spectrometer (MC-ICP-MS) using dry plasma. The sensitivity was 100 V ppm−1, reducing the consumption of Ag to 5 ng. Moreover, instrumental mass bias was corrected using the Pd-doping and standard-sample bracketing methods. The robustness of this method was assessed by analyzing the NIST SRM978a doped with different matrix element ratios. The average δ109AgSRM978a value of synthetic solutions (0.00 ± 0.05‰; 2SD, n ≥ 4) is consistent with the recommended values (0). The external precision is 0.05‰ (2SD) based on the measurement of two in-house standards. We further analyzed seven USGS rocks, including basalt (BCR-2 and BIR-1), andesite (AGV-2), granite (GSP-2 and G-2), rhyolite (RGM-2), and ferromanganese crusts (NOD-P-1). Their δ109AgSRM978a values vary from −0.24 ± 0.05‰ to 0.20 ± 0.05‰, suggesting that Ag isotopes can be significantly fractionated in silicate rocks. This study provides a great opportunity for the future application of Ag isotopes in geochemical and environmental studies.
Introduction
Silver (Ag) is a moderately incompatible, chalcophile, and siderophile element. The physicochemical characteristics of silver lead to numerous applications. As a noble metal, silver has been widely employed as a medium of international and domestic trade. In archeology, tracing the Ag origin can provide insights into historical development of human society.1,2 Ag is enriched in the core relative to the mantle during core–mantle segregation of planets.3 During partial melting of the mantle, Ag prefers melts and sulfur-rich hydrothermal fluids relative to the residual peridotite. Therefore, Ag is more enriched in the continental crust3 (50 ng g−1) than in the mantle (8 ng g−1 in Bulk Silicate Earth3).Silver has two stable isotopes: 107Ag (51.839%) and 109Ag (48.161%).4 The isotope composition is usually expressed as: δ109Ag = [(109Ag/107Ag)sample/(109Ag/107Ag)standard − 1] × 1000 (‰), which is the per mil deviation of the 109Ag/107Ag of the sample relative to that of the reference material NIST SRM978a. Ag isotopes can be a new tool to study a number of important geochemical problems, such as the early stages of planetary evolution,5 the formation of mineral deposits,6,7 and the historical development of civilizations.1,2 The key to these applications is to precisely measure Ag isotope ratios. Although thermal ionization mass spectrometry (TIMS) was used to analyze radiogenic isotopes (107Pd–107Ag) of iron and CI chondrites,8 it cannot precisely correct mass fractionation which results in an error of 2‰ (2SD).8 Application of multi-collector inductively coupled plasma-mass spectrometry (MC-ICP-MS) significantly improved the precision of Ag stable isotope measurement,9–12 but previous methods may not be appropriate for low Ag sample analyses such as silicate materials because of the following limitations:
(1) At least 20 ng (typically about 100 ng) of Ag is used for its isotope measurement.7,13 However, this would require digestion of too many samples with low Ag content such as most terrestrial and extra-terrestrial samples.
(2) The purification procedure for samples with a low content of Ag (<50 ng g−1) is complicated and very challenging because of the high matrix/Ag ratios.14
(3) Only two international silicate reference materials (BHVO-2 and AGV-2) were reported for Ag isotope ratios,9,10,15 which hinders the comparison of data among different laboratories.
In order to solve the above-mentioned problems, we developed an analytical protocol to measure Ag isotope compositions of samples with low Ag content. The Ag was separated from the matrix with a four-step chromatographic procedure in silicate rocks. The Ag isotope ratios were determined using a MC-ICP-MS with dry plasma, which significantly reduces Ag consumption down to merely 5 ng. Furthermore, the instrumental mass-bias was calibrated by Pd-doping and standard-sample bracketing (SSB) methods. With this method, we report the first δ109Ag data of five silicate reference materials. Because our new protocol can measure samples with various Ag contents, we can explore more geoscience problems using Ag isotope tracers.
Analytical methods
Reagents and reference materials
Concentrated acids (HCl, HNO3, and HF) used in this study were purified by a sub-boiling distillation system (Milestone Inc.; Shelton CT, USA) of reagent grade feedstock (Fisher Scientific; Ottawa ON, Canada). Hydrogen peroxide solution 31% (H2O2) was from ICPMSPURE, China. Ultrapure water (18.2 MΩ) (Milli-Q, Sigma-Aldrich; Oakville ON, Canada) was employed to dilute the reagents.The Ag isotope primary standard was provided by the National Institute of Standards and Technology (NIST). The absolute silver isotope ratio (109Ag/107Ag) is 0.92904 ± 0.00022, and the nuclide relative masses of 107Ag and 109Ag are 106.90509 and 108.90475.16 NIST SRM978a was dissolved in 2% HNO3 and stored in a 30 mL beaker, and was further diluted to 0.5 μg g−1 for measurements. Two in-house laboratory standards, USTC-Ag (≥99.9999% silver nitrate standard solution, trace metal base from MERCK) and ICP-Ag (a domestic single-element silver standard solution), were regularly measured to monitor the instrumental stability and long-term external precision. To avoid potential light effects, the beakers were placed in a PET lightproof sealed box.
Sample preparation and Ag purification
Chemical digestion and Ag purification were performed in an ISO Class 6 clean room at the CAS Key Laboratory of Crust-Mantle Materials and Environments, USTC. 100 mg USGS petrological powder was digested in 6 mL of a 3![[thin space (1/6-em)]](https://www.rsc.org/images/entities/char_2009.gif) :
:![[thin space (1/6-em)]](https://www.rsc.org/images/entities/char_2009.gif) 1 (v/v) mixture of concentrated HF–HNO3 solution in a capped 15 mL Teflon PFA beaker (Savillex). The solutions were heated at 130 °C on a hotplate for 72 hours and subjected to ultrasonic treatment several times for complete dissolving. After evaporation, 6 mL of concentrated aqua regia (HNO3–HCl ∼1
1 (v/v) mixture of concentrated HF–HNO3 solution in a capped 15 mL Teflon PFA beaker (Savillex). The solutions were heated at 130 °C on a hotplate for 72 hours and subjected to ultrasonic treatment several times for complete dissolving. After evaporation, 6 mL of concentrated aqua regia (HNO3–HCl ∼1![[thin space (1/6-em)]](https://www.rsc.org/images/entities/char_2009.gif) :
:![[thin space (1/6-em)]](https://www.rsc.org/images/entities/char_2009.gif) 3, v/v) was added to beakers and heated at 125 °C on a hotplate for one day to ensure that residual fluoride was eliminated. The samples were dried down and converted to chloride form by adding 1 mL of concentrated HCl. After sample digestion, the solutions were evaporated and residues were re-dissolved in 0.5 mol L−1 HCl for the following chromatographic procedures. Before chemical purification, the Ag contents of USGS rock standards were measured by ICP-MS. The Ag contents of solutions are consistent with the recommended values within error.
3, v/v) was added to beakers and heated at 125 °C on a hotplate for one day to ensure that residual fluoride was eliminated. The samples were dried down and converted to chloride form by adding 1 mL of concentrated HCl. After sample digestion, the solutions were evaporated and residues were re-dissolved in 0.5 mol L−1 HCl for the following chromatographic procedures. Before chemical purification, the Ag contents of USGS rock standards were measured by ICP-MS. The Ag contents of solutions are consistent with the recommended values within error.
For high-precision Ag isotope measurements in natural samples, it is crucial to separate Ag completely from matrix elements such as Cu, Zn, Sr, Y, Zr, and Nb. These elements could interfere with Ag isotope analyses in various forms, as listed in Table 1. We improved the chemical procedure from the protocols of Schönbächler et al.10 and Luo et al.,17 and our method can significantly reduce acid consumption and the duration of purification. Since the residual Ag on the resin may increase the procedure blank,18 the resins were well cleaned before conditioning. The anion resin was cleaned with 30 mL of 9 N HCl, followed by 5 mL of Milli-Q H2O. The cation resin was cleaned with 30 mL of 6 N HNO3, followed by 5 mL of Milli-Q H2O. Both resins were filled in Savillex microcolumns with an inner diameter of 6 mm and height of 7 cm. The first chromatographic procedure (columns 1 and 2) is based on anion resin Bio-Rad AG1-X8 (200–400 mesh). After loading the sample, most major elements were preferentially eluted by 0.5 mol L−1 HCl with 0.001% H2O2, while Ag was well adsorbed on the resin. After that, Zn and Cd were removed in sequence by 0.05 mol L−1 HCl with 0.001% H2O2 (ref. 19) and 0.001 mol L−1 HCl (Fig. 1a). Then, the Ag elution was collected and dried down for the following chromatographic procedures (columns 3 and 4) with cation resin AG50 W-X8 (200–400 mesh) to further separate Ag from Nb, As, and other minor matrices (Fig. 1b).
| Isobaric interferences | Polyatomic interferences | |
|---|---|---|
| 104Pd | 88Sr16O | |
| 105Pd | 65Cu40Ar+, 89Y16O+ | |
| 106Pd | 108Cd+ | 66Zn40Ar+, 90Zr16OH+ |
| 107Ag | 73As34S, 67Zn40Ar+, 71Ga36Ar+, 91Zr16O+, 91Zr16OH+, 92Zr16O+ | |
| 108Pd | 108Cd+ | 68Zn40Ar+, 92Mo16O+ |
| 109Ag | 69Ga40Ar+, 73Ge36Ar+, Nb93O16+ | |
| 110Pd | 110Cd+ |
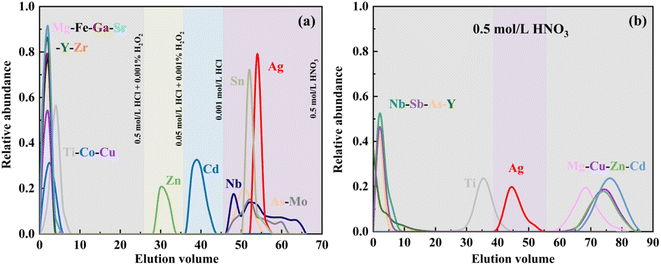 | ||
| Fig. 1 Elution curves of RGM-2 for the Ag purification procedure by anion-exchange resin AG1-X8 (a) and cation-exchange resin AG50 W-X8 (b). | ||
The residuals of matrix elements may result in significant deviations on Ag isotope measurements. For synthetic solutions, purification using one column of anion resin and cation resin was enough to completely separate Ag. However, natural samples require repeating the elution of anion resin twice to remove most of the matrix. The Ag fraction was dried and then treated with 1 mL of 0.5 mol L−1 HCl with 0.001% H2O2 before being loaded onto the cation resin column. Then, Ag samples were purified using the cation resin procedure twice to completely remove As, Sn, and Nb. Notably, although some elements such as Ti can be eluted in the Ag fraction with cation resin AG50 W-X8 (Fig. 1b), they have been effectively separated by anion exchange column AG1-X8 (Fig. 1a). The contents of potential matrix/Ag ratios after the four-step chromatography process are listed in Table S1.† The anion resin procedure took around 10 hours for separation after pre-cleaning, while the cation resin took about 6 hours. After purification, the Ag fraction was evaporated and then 1 mL of 2% HNO3 was added for MC-ICP-MS measurement. Before and after the collection of the Ag fraction, 1 mL of solution was collected to assess the possible loss of Ag during the chemical purification. The overall chemical procedure yield of Ag was >95%. The detailed purification procedure is listed in Table 2.
| Separation stage | Eluent | Vol. (mL) |
|---|---|---|
| Columns 1 and 2, Bio-Rad AGI-X8, 200–400 mesh, 2 mL resin bed | ||
| Cleaning | 9 mol L−1 HCl | 30 |
| Conditioning | 0.5 mol L−1 HCl + 0.001% H2O2 | 10 |
| Sample loading | 0.5 mol L−1 HCl + 0.001% H2O2 | 1 |
| Elution of matrix elements | 0.5 mol L−1 HCl + 0.001% H2O2 | 26 |
| Elution of Zn | 0.05 mol L−1 HCl + 0.001% H2O2 | 10 |
| Elution of Cd | 0.001 mol L−1 HCl | 10 |
| Elution of Ag | 1 mol L−1 HNO3 | 30 |
![[thin space (1/6-em)]](https://www.rsc.org/images/entities/char_2009.gif) |
||
| Columns 3 and 4 Bio-Rad AG50 W-X8, 200–400 mesh, 2 mL resin bed | ||
| Cleaning | 6 mol L−1 HNO3 | 30 |
| Conditioning | 0.5 mol L−1 HNO3 | 10 |
| Sample loading | 0.5 mol L−1 HNO3 | 1 |
| Elution of matrix elements | 0.5 mol L−1 HNO3 | 40 |
| Elution of Ag | 0.5 mol L−1 HNO3 | 24 |
Mass spectrometry
The Ag isotope compositions were determined using MC-ICP-MS (Thermo-Fisher Scientific Neptune Plus) in the CAS Key Laboratory of Crust-Mantle Materials and Environments, USTC. Because Ag only has two stable isotopes, SSB and Pd internal mass bias correction were combined to calibrate the instrumental mass bias. The Pd standard (NIST3138 solution) was doped into both samples and standards in this study.The Ag content in rock samples is generally low (∼50 ng g−1),20,21 posing a challenge to provide enough Ag for Ag isotope measurement. To solve this problem, we used Aridus III membrane desolvation (CETAC) for dry plasma to increase the sensitivity. The MC-ICP-MS was equipped with a Jet sampler cone and H skimmer cone. Multiple Faraday cups were applied to simultaneously collect signals in low-resolution mode, including L3 (104Pd), L2 (105Pd), L1 (106Pd), C (107Ag), H1 (108Pd), H2 (109Ag), H3 (110Pd), and H4 (111Cd). The potential Cd interferences on 106Pd, 108Pd, and 110Pd were corrected by monitoring 111Cd. Each measurement cycle consisted of serial washes with 5% and 2% HNO3, and 40 isotope ratio measurements in a single block with 4.194 s integration time. To eliminate the memory effect, it took almost 9.5 minutes to thoroughly clean the system before taking sample measurement.
Prior to MC-ICP-MS analysis, all solutions were spiked with Pd at the appropriate ratio to ensure equivalent signals between 107Ag and 108Pd. Instrumental mass bias correction was performed by internally normalizing to a known Pd isotope ratio, based on the exponential mass fractionation law. The 107Ag and 108Pd signals were approximately 0.5 V with 50 μL min−1 took up rate for the solutions with an Ag content of 5 ng g−1. Each sample was analyzed at least three times in parallel, and the reference material NIST SRM978a was used as the bracketing standard to correct the instrumental mass bias. Meanwhile, the ICP-Ag and USTC-Ag solutions were used as in-house standards to monitor the stability of the instrument after every 4 analyses of samples. The instrumental parameters for MC-ICP-MS are summarized in Table 3.
| Solution MC-ICP-MS | Thermo Fisher Scientific, Neptune Plus | |||||||
|---|---|---|---|---|---|---|---|---|
| Cooling gas (Ar) | 15 L min−1 | |||||||
| Auxiliary gas (Ar) | 0.60 L min−1 | |||||||
| Mass resolution | Low resolution | |||||||
| Typical sensitivity | 100 V/(μg g−1) for 107Ag | |||||||
| Interface cones | Jet sample cone + H skimmer cone | |||||||
| Ar sweep | 5.45 L min−1 | |||||||
| Solution uptake | 50 μL min−1 | |||||||
| Integration time | 4.194 s per cycle | |||||||
| Aridus gas (N2) | ∼1.5 L min−1 | |||||||
| Faraday cup configuration | L3 104Pd | L2 105Pd | L1 106Pd | Central 107Ag | H1 108Pd | H2 109Ag | H3 110Pd | H4 111Cd |
Tests of method performance
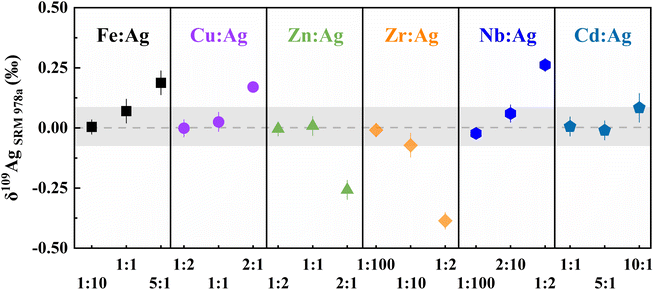
To evaluate the effect of matrix and the acidity of HNO3 on Ag isotope measurements, the doping experiments were conducted by adding certain amounts of Fe, Cu, Zn, Zr, Nb, and Cd to the standard solution with 5 ng g−1 Ag. The molar ratios of Fe![[thin space (1/6-em)]](https://www.rsc.org/images/entities/char_2009.gif) :
:![[thin space (1/6-em)]](https://www.rsc.org/images/entities/char_2009.gif) Ag ranged from 1
Ag ranged from 1![[thin space (1/6-em)]](https://www.rsc.org/images/entities/char_2009.gif) :
:![[thin space (1/6-em)]](https://www.rsc.org/images/entities/char_2009.gif) 10 to 5
10 to 5![[thin space (1/6-em)]](https://www.rsc.org/images/entities/char_2009.gif) :
:![[thin space (1/6-em)]](https://www.rsc.org/images/entities/char_2009.gif) 1, Cu
1, Cu![[thin space (1/6-em)]](https://www.rsc.org/images/entities/char_2009.gif) :
:![[thin space (1/6-em)]](https://www.rsc.org/images/entities/char_2009.gif) Ag from 1
Ag from 1![[thin space (1/6-em)]](https://www.rsc.org/images/entities/char_2009.gif) :
:![[thin space (1/6-em)]](https://www.rsc.org/images/entities/char_2009.gif) 2 to 2
2 to 2![[thin space (1/6-em)]](https://www.rsc.org/images/entities/char_2009.gif) :
:![[thin space (1/6-em)]](https://www.rsc.org/images/entities/char_2009.gif) 1, Zn
1, Zn![[thin space (1/6-em)]](https://www.rsc.org/images/entities/char_2009.gif) :
:![[thin space (1/6-em)]](https://www.rsc.org/images/entities/char_2009.gif) Ag from 1
Ag from 1![[thin space (1/6-em)]](https://www.rsc.org/images/entities/char_2009.gif) :
:![[thin space (1/6-em)]](https://www.rsc.org/images/entities/char_2009.gif) 100 to 1
100 to 1![[thin space (1/6-em)]](https://www.rsc.org/images/entities/char_2009.gif) :
:![[thin space (1/6-em)]](https://www.rsc.org/images/entities/char_2009.gif) 2, Nb
2, Nb![[thin space (1/6-em)]](https://www.rsc.org/images/entities/char_2009.gif) :
:![[thin space (1/6-em)]](https://www.rsc.org/images/entities/char_2009.gif) Ag from 1
Ag from 1![[thin space (1/6-em)]](https://www.rsc.org/images/entities/char_2009.gif) :
:![[thin space (1/6-em)]](https://www.rsc.org/images/entities/char_2009.gif) 100 to 1
100 to 1![[thin space (1/6-em)]](https://www.rsc.org/images/entities/char_2009.gif) :
:![[thin space (1/6-em)]](https://www.rsc.org/images/entities/char_2009.gif) 2, and Cd
2, and Cd![[thin space (1/6-em)]](https://www.rsc.org/images/entities/char_2009.gif) :
:![[thin space (1/6-em)]](https://www.rsc.org/images/entities/char_2009.gif) Ag from 1
Ag from 1![[thin space (1/6-em)]](https://www.rsc.org/images/entities/char_2009.gif) :
:![[thin space (1/6-em)]](https://www.rsc.org/images/entities/char_2009.gif) 1 to 10
1 to 10![[thin space (1/6-em)]](https://www.rsc.org/images/entities/char_2009.gif) :
:![[thin space (1/6-em)]](https://www.rsc.org/images/entities/char_2009.gif) 1, respectively. Additionally, different concentrations of HNO3 were diluted to test the impact on Ag isotope measurements. A solution of SRM978a was diluted to a concentration of 5 ng g−1 by adding 2% HNO3 (m/m) as a standard, while another solution of SRM978a was diluted using varying concentrations of HNO3 ranging from 1% to 3%. These diluted solutions were then treated as samples for bracketed measurements.
1, respectively. Additionally, different concentrations of HNO3 were diluted to test the impact on Ag isotope measurements. A solution of SRM978a was diluted to a concentration of 5 ng g−1 by adding 2% HNO3 (m/m) as a standard, while another solution of SRM978a was diluted using varying concentrations of HNO3 ranging from 1% to 3%. These diluted solutions were then treated as samples for bracketed measurements.
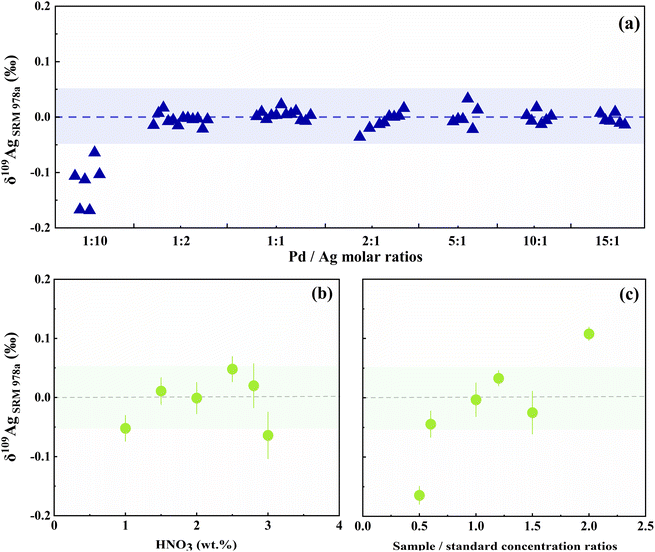
We further determined the concentration effect on Ag isotope composition when there was a discrepancy between the sample and the standard. The sample/standard ranged from 0.5 to 2. These solutions were measured by MC-ICP-MS with the same method as described above.
Results and discussion
Establishment of elution curves
In order to ensure reliable and robust measurements, the elution curves for Ag should be consistent for different samples. In this study, a series of experiments were carried out using synthetic solutions and natural samples. We tested whether the leaching curves for Ag are uniform in the solutions with different matrixes (Table S2†). Then we conducted experiments on both synthetic solutions and rock standards with the same procedure. The data show that the Ag isotope compositions of the synthetic solutions with different Ag contents are consistent with the recommended values (Table S2†). The elution curves of the synthetic solutions were the same as that of the geological reference material RGM-2 (Fig. 1), while rhyolite (RGM-2), basalt (BCR-2), and andesite (AGV-2) samples with an equivalent mass of Ag have almost the same elution position for Ag (Fig. 1a, S1a and b†), indicating that the chemical separation effect could be the same for different types of geological samples. From this, we can conclude that changes in the Ag or matrix content have little effect on the Ag elution during the chemical purification.As depicted in Fig. 1, some minor elements still exist in the Ag elution. The potential spectral interferences can compromise the accuracy and precision of Ag isotopes in MC-ICP-MS analyses. Specifically, matrix components (e.g., 93Nb16O, 73As34S) have isobaric effect on high precision Ag isotope measurement. Because geological samples such as basalt and ferromanganese nodules exhibit elevated Nb content and Nb/Ag ranging from 100 to 500, cation resin was used to mitigate Nb and As in purified Ag solution. We evaluated the elution efficiency at different concentrations of HNO3, specifically 0.5 mol L−1 (Fig. 1b), 1 mol L−1, and 2 mol L−1 (Fig. S1(c) and (d)†). The results show that the 0.5 mol L−1 HNO3 on the cation resin can well separate Nb, Ti, and As from Ag. For samples with low Nb/Ag (<0.01), the fourth column with AG50 W-X8 is unnecessary. We suggest that for silver-containing sulfide minerals, especially for samples with high Ag content, two steps may be enough for a good purification.
Spectral interferences
Because the Ag contents of silicate rock samples are normally low,3 the matrix components may result in substantial interference with Ag isotope determination. For instance, the signals of 65Cu40Ar+, 66Zn40Ar+, 106Cd+, 68Zn40Ar+, 92Mo16O+, and 108Cd+ potentially generate isobaric effect on those of 104Pd, 105Pd, 106Pd, 108Pd, and 110Pd, respectively, which may cause interference with the correction for Pd. Similarly, the polyatomic interferences from 67Zn40Ar+, 91Zr16O+, 93Nb16O+, 69Ga40Ar+, and 73Ge36Ar on Ag isotopes may impact the precision of Ag isotope ratios. In particular, the presence of trace amounts of Nb and Zr can result in significant positive or negative deviations from the recommended δ109Ag values (Fig. S2†). Therefore, we doped varying amounts of elements into the NIST SRM978a to obtain the window of allowed matrix contents during the Ag isotope determination. The results are presented in Table S3.† The δ109Ag values of solutions approach the recommended value (0 ± 0.05‰) when the molar ratios of Fe/Ag < 1, Cu/Ag < 1.5, Zn/Ag < 1.5, Zr/Ag < 0.1, Nb/Ag < 0.2, and Cd/Ag < 10 (Fig. 2). Within the above range, the influence of these matrix elements on Ag isotope measurements is negligible.Instrumental mass fractionation correction
Measurements of Ag isotopes may possibly be subjected to instrumental drift as a result of various factors, including matrix effects, plasma systems, and environmental conditions (e.g., temperature and humidity). The instrumental fractionation can be corrected by adding Pd to the measured solutions to get high-quality data. Both the sample and standard solutions were doped with the same amount of NIST 3138. The Pd isotope signal ratios were determined to calculate the instrumental mass-dependent fractionation factors.Assuming the measurement exhibits equivalent mass bias factor (f) for both Pd and Ag, the equation can be expressed as follows:
 | (1) |
| δ109/107Ag = (2 × Rcorrected-sample/(Rcorrected-standard-last + Rcorrected-standard-next) − 1) × 1000‰ | (2) |
In order to maintain a consistent correlation between the mass factors of Ag and Pd during the measurement, it is important to identify an appropriate concentration ratio between Ag and Pd. Therefore, the quantity of doped Pd will exert a substantial influence on the calibration of Ag isotopes. Because deviations from the optimal Pd doping levels might result in a drift in the calibration results, the amount of Pd doped in both the sample and the standard solutions should be carefully evaluated. Pd and Ag signals between the sample and the standard are closely aligned to minimize the discrepancies. When 108Pd/107Ag is less than 0.1, the isotope composition of the corrected Ag will experience a significant shift. Similarly, excessive Pd doping may interfere with and even damage the MC-ICP-MS. Consequently, we recommend to maintain the Pd content within a specific range of 108Pd/107Ag from 0.1 to 10. This range promises stability in measurement and the 109/107Ag can be accurately corrected (Fig. 3a). We also noticed that the Pd-doped solution prepared too early may result in notable deviations in the Ag isotopes, which is probably due to the selective adsorption of Ag and Pd in the solution onto the inner surfaces of the tubes. As a result, we suggest to prepare the Pd-doped solution immediately before the measurement.
The calibration process requires a careful selection of stable isotope pairs of Pd. Pd has six stable isotopes: 102Pd (1.02%), 104Pd (11.14%), 105Pd (22.33%), 106Pd (27.33%), 108Pd (26.46%), and 110Pd (11.72%), and the specific choice of Pd correction varies across different laboratories. With excessive concentrations of Cu ions, such as the case of measuring natural silver samples, the presence of 105Pd can lead to isobaric interference between 106Pd and 65Cu40Ar+. Similarly, the isotope pair 104Pd–105Pd was selected to address the mass bias that may arise due to potential interference between 106Cd and 108Cd with 106Pd and 108Pd, particularly when the sample contains a high concentration of Cd17. To mitigate the influence of 208Pb on 104Pd, the 105Pd–108Pd internal standard was used when the concentration of Pb ions in the sample was comparatively elevated.13,22 We used the standard SRM978a, the laboratory internal standard ICP-Ag, and the USTC-Ag solution, to evaluate the correction effect of various Pd isotope ratios. The correction effect is presented in Fig. 4, reflecting the measurements over a 24 hour period. The normalized fits of ln(110Pd/106Pd) and ln(109Ag/107Ag) demonstrated the best (R2 = 0.987) among all possible Pd isotopes pairs (Fig. 4). This result corresponds well to the findings of Brügmann et al.12 The procedure in this study demonstrates complete separation. The impact of matrix components such as Cu and Cd is almost negligible, but the 106Pd–108Pd for data calibration was notably biased due to the presence of 68Zn40Ar+. With dry plasma in high sensitivity, Zn content is on the same scale (ng) as Ag, which has significant effects on the signal of 108Pd.
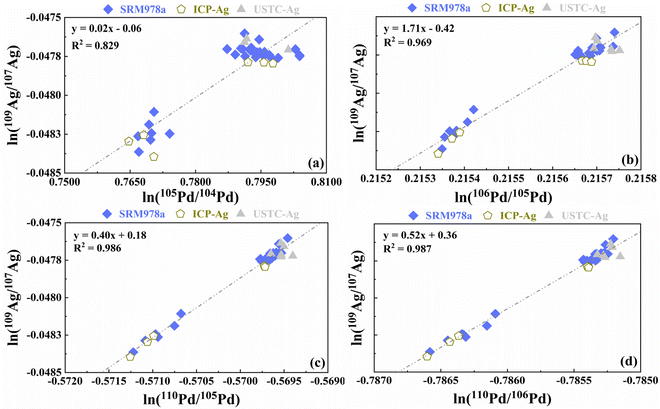 | ||
| Fig. 4 Natural logarithms of Ag and Pd isotope ratios for the NIST SRM978a, ICP-Ag, and USTC-Ag solutions measured as bracketing standards (regression line) fall on the same or similar linear trends. | ||
Precision and accuracy
Studies have shown that acid molarity and concentration mismatch may affect isotope composition.23 In this study, a series of tests were carried out to determine the potential influence on Ag isotope measurements. The results suggest that acidity variation effect is limited when diluted HNO3 is 1% to 3%. In addition, because instrumental mass fractionation between samples and standards should be consistent, it is critical to ensure that the samples and standards contain the same amount of Ag. As shown in Fig. 3, the mismatch has little effect on Ag isotope determination when sample/standard Ag concentration ratios are 0.6–1.4. Thus, sample-standard concentration differences were within 10% tolerance during analysis.Long-term measurements of reference materials were conducted to assess the precision. Since there is currently only one international Ag isotope standard in common use (NIST SRM978a), we developed two new in-house standards, ICP-Ag and USTC-Ag. After three years of repeated measurements, their average values of 109AgSRM978a were recommended to be 0.01 ± 0.05‰ and −0.02 ± 0.05‰, respectively (Fig. S3†). Furthermore, data quality was monitored using multiple internal standards, and the long-term external precision was better than 0.05‰ (2SD, n ≥ 4) at a 95% confidence level.
Ag isotope compositions of the USGS standards
Current Ag isotope studies focus on studies on Ag-ore deposit and cosmochemistry. More investigations for terrestrial and extra-terrestrial samples are needed to improve our understanding of the mechanisms governing Ag isotope fractionation. We analyzed 7 USGS standards: basalt (BCR-2 and BIR-1), andesite (AGV-2), granite (GSP-2 and G-2), rhyolite (RGM-1), and ferromanganese crusts (NOD-P-1) for an inter-laboratory comparison. The Ag isotope data of rock standards are still rare in the literature.9,10,15 Our findings agree well with reported data within error for basalt BCR-2 (0.20 ± 0.04‰ vs. 0.24 ± 0.07‰) and andesite AGV-2 (0.07 ± 0.04‰ vs. 0.3 ± 0.2‰).According to the data in Fig. 5 and Table 4, most samples were analyzed with a precision better than 0.05‰. The δ109AgSRM978a values of the silicate rocks ranged from −0.24 ± 0.05‰ to 0.20 ± 0.05‰, indicating significant Ag isotope fractionation during various geological processes. Because of its low Ag content, the analytical uncertainty in the granite G-2 analysis is higher (2SD, 0.08‰). δ109AgSRM978a values of the standards measured in this study are not correlated with the content of Ag, SiO2, or δ65Cu values (Fig. 6a, b, and, f). In contrast, Fig. 6(c–e) depict the relationship between δ109AgSRM978a and F, Cl, and S contents, showing an increasing trend followed by a decrease, suggesting that halogens in the hydrothermal fluid process may affect the Ag isotope composition. Besides, Fig. 5 shows that Mn-nodule NOD-P-1 has relatively lighter Ag isotopes, indicating that Ag isotope fractionation may occur during the seawater alteration. Furthermore, because Ag is a redox-sensitive element, electron migration from Ag0 to Ag+ may also fractionate Ag isotopes. In summary, our findings highlight the promising future of Ag isotope data in future studies.
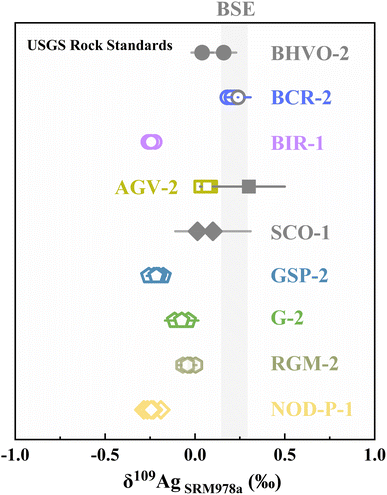 | ||
| Fig. 5 The δ109AgSRM978a values of geological reference materials. Solid symbols indicate the δ109AgSRM978a values cited from the literature.9,10,15 Error bars represent the 2SD (n ≥ 3) uncertainties for each sample. The gray band represents the Ag isotope composition of BSE.10 | ||
| USGS standard | Rock types | Ag (μg g−1) | δ109AgSRM978a | 2SD | N |
|---|---|---|---|---|---|
| a The reported Ag isotope data were cited from Schönbächler et al., 2007.10 b Zhu et al., 2023,15 and c Woodland et al., 2005.9 d The Ag contents in USGS rock standards were obtained from Axelsson et al., 2002.24 e Chen et al., 2020.25 f Braukmüller et al., 2020.20 g Wang et al., 2014,18 and h Zou et al., 2020.21 | |||||
| NOD-P-1 | Ferromanganese crusts | 0.21d | −0.24 | 0.07 | 6 |
| BHVO-2a | Basalt | 0.44e | 0.16 | 0.07 | — |
| BHVO-2b | Basalt | 0.44e | −0.04 | 0.06 | ≧4 |
| BCR-2a | Basalt | 0.03f | 0.24 | 0.07 | — |
| BCR-2 | Basalt | 0.03f | 0.20 | 0.04 | 5 |
| BIR-1 | Basalt | 0.03f | −0.24 | 0.04 | 3 |
| AGV-2c | Andesite | 0.05f | 0.30 | 0.20 | — |
| AGV-2 | Andesite | 0.05f | 0.07 | 0.04 | 5 |
| SCO-1c | Cody shale | 0.13g | 0.08 | 0.05 | 10 |
| GSP-2 | Granite | 0.09h | −0.21 | 0.05 | 7 |
| G-2 | Granite | 0.03f | −0.07 | 0.09 | 5 |
| RGM-2 | Rhyolite | — | −0.04 | 0.05 | 6 |
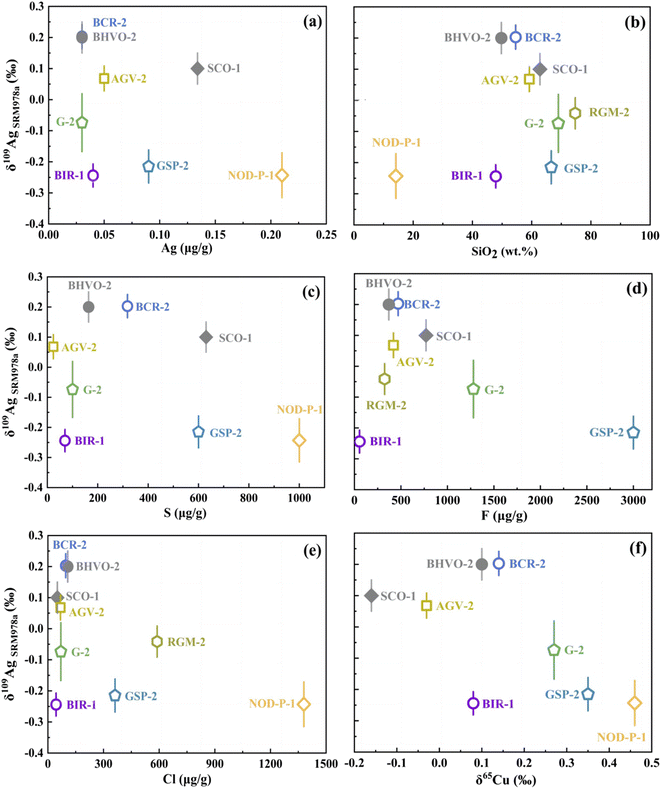 | ||
| Fig. 6 The δ109AgSRM978a values of geological reference materials as a function of Ag content (a), SiO2 content (b), S content (c), F content (d), Cl content (e), and δ65Cu values (f). | ||
Conclusions
(1) This study improved the chemical purification procedure by using AG1-X8 and AG50 W-X8 resins. The method can purify Ag from a complex matrix with recovery rate better than 95%.(2) The MC-ICP-MS with dry plasma reduces the sample consumption to merely 5 ng. The SSB method with Pd addition was used to calibrate the instrumental fractionation. Two new in-house standards, ICP-Ag (δ109AgSRM978a = −0.01 ± 0.05‰) and USTC-Ag (δ109AgSRM978a = 0.02 ± 0.05‰) were developed to monitor data quality.
(3) The Ag isotope compositions of seven USGS geological standard were measured, and five of them were reported for the first time, ranging from −0.24 ± 0.05‰ to 0.20 ± 0.05‰. This study provides the analytical basis for further exploration of Ag isotopes.
Author contributions
Yuan Fang: methodology, formal analysis, investigation, writing – original draft, and writing – review & editing. Qiu-Yu Wen: formal analysis and investigation. Zi-Cong Xiao: formal analysis and writing – review & editing. Hui-Min Yu: methodology, validation and supervision. Fang Huang: conceptualization, validation, writing – review & editing and supervision.Conflicts of interest
There are no conflicts of interest to declare.Acknowledgements
We thank Lan-Lan Tian and Wei-Xin Lv for suggestions in early experiments. This study was supported by the National Natural Science Foundation of China (4233000014).References
- A. M. Desaulty, P. Telouk, E. Albalat and F. Albarède, Proc. Natl. Acad. Sci. U.S.A., 2011, 108(22), 9002–9007 CrossRef CAS PubMed.
- A. M. Desaulty and F. Albarede, Geology, 2013, 41(2), 135–138 CrossRef.
- W. F. McDonough, Treatise Geochem., 2003, 2, 547–568 Search PubMed.
- K. Rosman and P. Taylor, Pure Appl. Chem., 1998, 70, 217–235 CrossRef CAS.
- R. W. Carlson and E. H. Hauri, Geochim. Cosmochim. Acta, 2001, 65(11), 1839–1848 CrossRef CAS.
- D. Wang, R. Mathur, Y. Y. Zheng, H. J. Wu, Y. W. Lv, G. Y. Zhang, Y. Huan, M. Yu and Y. J. Li, Miner. Deposita, 2022, 57, 701–724 CrossRef CAS.
- C. R. Voisey, R. Maas, A. G. Tomkins, M. Brauns and G. Brügmann, Econ. Geol., 2019, 114(2), 233–242 CrossRef.
- J. H. Chen and G. J. Wasserburg, Geochim. Cosmochim. Acta, 1983, 47(10), 1725–1737 CrossRef CAS.
- S. J. Woodland, M. Rehkämper, A. N. Halliday, D. C. Lee, B. Hattendorf and D. Günther, Geochim. Cosmochim. Acta, 2005, 69(8), 2153–2163 CrossRef CAS.
- M. Schönbächler, R. W. Carlson, M. F. Horan, T. D. Mock and E. H. Hauri, Int. J. Mass Spectrom., 2007, 261(2–3), 183–191 CrossRef.
- L. Yang, E. Dabek-Zlotorzynska and V. Celo, J. Anal. At. Spectrom., 2009, 24(11), 1564–1569 RSC.
- G. Brügmann, M. Braunsa and R. Maas, Chem. Geol., 2019, 516, 59–67 CrossRef.
- Q. Guo, H. Z. Wei, S. Y. Jiang, S. Hohl, Y. B. Lin, Y. J. Wang and Y. C. Li, Anal. Chem., 2017, 89(24), 13634–13641 CrossRef CAS PubMed.
- M. Matthes, M. Fischer-Gödde, T. S. Kruijer, I. Leya and T. Kleine, Geochim. Cosmochim. Acta, 2015, 169, 45–62 CrossRef CAS.
- Y. F. Zhu, H. Z. Wei, J. L. Wang, A. E. Williams-Jones, Z. C. Wang, S. Y. Jiang, S. V. Hohl, C. Huan and M. M. Zhang, ACS Earth Space Chem., 2023, 7, 2031–2041 CrossRef CAS.
- L. J. Powell, T. J. Murphy and J. W. Gramlich, J. Res. Natl. Bur. Stand., 1982, 87, 9–19 CrossRef CAS PubMed.
- Y. Luo, E. Dabek-Zlotorzynska, V. Celo, D. C. G. Muir and L. Yang, Anal. Chem., 2010, 82, 3922–3928 CrossRef CAS PubMed.
- Z. C. Wang, H. Becker and F. Wombacher, Geostand. Geoanal. Res., 2014, 39, 185–208 CrossRef.
- S. H. Tang, B. Yan and J. Li, Geochim., 2013, 1, 46–52 Search PubMed.
- N. Braukmüller, F. Wombacher, A. Bragagni and C. Münker, Geostand. Geoanal. Res., 2020, 44(4), 733–752 CrossRef.
- Z. Q. Zou, Z. C. Wang, H. Cheng, T. He, Y. N. Liu, K. Chen, Z. C. Hu and Y. S. Liu, Geostand. Geoanal. Res., 2020, 44(3), 501–521 CrossRef CAS.
- W. Argapadmi, E. R. Toth, M. A. Fehr, M. Schönbächler and C. A. Heinrich, Econ. Geol., 2018, 113(7), 1553–1570 CrossRef.
- X. Y. Nan, F. Wu, Z. F. Zhang, Z. H. Hou, F. Huang and H. M. Yu, J. Anal. At. Spectrom., 2015, 30, 2307 RSC.
- M. D. Axelsson, I. Rodushkin, J. Ingri and B. Öhlander, Analyst, 2002, 127, 76–78 RSC.
- K. Chen, M. Tang, C. Lee, Z. C. Wang, Z. Q. Zou, Z. C. Hu and Y. S. Liu, Earth Planet. Sci. Lett., 2020, 531, 115971 CrossRef CAS.
Footnote |
| † Electronic supplementary information (ESI) available: Additional tables and figures of the experimental details (DOCX). See DOI: https://doi.org/10.1039/d3ja00424d |
| This journal is © The Royal Society of Chemistry 2024 |

