
 Open Access Article
 This Open Access Article is licensed under a Creative Commons Attribution-Non Commercial 3.0 Unported Licence
Assessment of matrix effects induced by chloride, sulfate and dissolved organic carbon during Si isotope measurements by MC-ICP-MS under wet plasma conditions†
Sofía
López-Urzúa
 *a,
Tu-Han
Luu
a and
Louis
Derry
ab
*a,
Tu-Han
Luu
a and
Louis
Derry
ab
aInstitut de Physique Du Globe de Paris, Université Paris Cité, CNRS, F-75005, Paris, France. E-mail: lopezurzua@ipgp.fr
bDepartment of Earth and Atmospheric Sciences, Cornell University, Ithaca, NY, USA
First published on 26th February 2024
Abstract
Since 2006, with the development of an optimized methodology for silicon purification based on alkaline fusion followed by cation-exchange chromatography, silicon isotopes have been widely measured across diverse sample types. Nevertheless, this technique does not remove anions and dissolved organic carbon (DOC), leading to potential matrix effects. Notably, under dry plasma conditions, several studies have reported offset in the δ30Si value up to +1.4‰ when [S]/[Si] > 0.02 (wt/wt) and +0.65‰ when [DOC]/[Si] > 1.75. Here, we examine the matrix effects induced by chloride, sulfate and dissolved organic carbon under wet plasma conditions. To achieve this, we doped the NBS-28 (NIST® RM 8546) solution, with varying amounts of sulfate and chloride and measured the δ30Si value in the doped solutions. To investigate the DOC matrix effect, we used the UV photolysis method to decompose the DOC within natural samples and then compared the resulting δ30Si values with those of untreated samples. Importantly, we did not observe any significant δ30Si offset outside the range of our long-term analytical precision (±0.11‰, 2SD) attributed to chloride, sulfate, or DOC across a range of [Cl−]/[Si] = 0.09 to 5.65, [SO42−]/[Si] = 0.09 to 5.65 and [DOC]/[Si] = 0.08 to 6.38. Even though no offset in δ30Si value is observed for DOC-contaminated samples, we recommend removal of DOC. We suggest that the matrix effect observed under dry plasma conditions can be primarily attributed to the use of introduction systems with desolvating membranes, followed by differences in the operating parameters and the absolute quantity of anions introduced into the plasma. Our study indicates that precise and accurate measurements (<0.11‰, 2SD) can be reached for stable Si isotope ratios by MC-ICP-MS in wet plasma, with a larger tolerance to sample based-matrix effect induced by anion contamination compared to dry plasma.
Introduction
Silicon isotopes were measured for the first time in the early 1950s by Reynolds and Verhoogen1 using gas source spectrometry. With the advent and improvement of MC-ICP-MS, De la Rocha et al.2 were able to accurately measure the 29Si/28Si ratio in sponge spicules and diatoms but not the 30Si/28Si ratio due to isobaric interferences (29SiH+, 14N16O+, 14N15NH+, 14N14ND+ on 30Si+). The development of higher performance MC-ICP-MS instruments such as the Nu Plasma 1700 and Thermo Finnigan Neptune, with higher mass resolving power made it possible to isolate spectral interferences and enable the measurement of both ratios.3 Furthermore, the introduction of new methodologies for Si purification by alkaline fusion and cationic chromatography4–6 facilitated the determination of δ30Si with high precision (≈± 0.14‰, 2 standard deviations (SD)).Unfortunately, cationic ion exchange chromatography does not remove anions or dissolved organic carbon, which can lead to sample matrix-based effects. These effects are defined as unequal transmission efficiency of ions from the plasma ion source to the detectors resulting in inaccurate determination of the 29Si/28Si and 30Si/28Si ratios.7 Matrix effects affecting silicon isotope measurements by MC-ICP-MS have been previously observed in several studies. Van Den Boorn et al.8 reported a δ30Si offset of +1.4‰ when [S]/[Si] > 0.02 (wt/wt) in samples from sulfur-rich rock. Chen et al.9 tested the influence of sulfur by doping a pure silicon solution and reported a similar δ30Si shift of +1.04‰ when [S]/[Si] > 0.02. Hughes et al.10 observed a shift of +0.28‰ in river samples when [SO42−]/[Si] > 0.35, as well as an offset of +0.29‰ and +0.65‰ produced by dissolved organic carbon when [DOC]/[Si] > 0.69 and 1.75 respectively. Conversely, Georg et al.5 tested the effect of sulfates and nitrates on the accuracy of Si isotope measurements, but no significant isotopic effect was reported. Moreover, Oelze et al.11 using Mg as an internal standard, doped the pure Si standard solution NBS-28 with different amounts of NO3−, SO42− and PO43− and found no significant deviation from the expected value of 0‰. Recently, Gaspard et al.12 suggested the addition of an anionic column separation step for hydrothermal waters ([SO42−]/[Si] > 2) to remove the SO42− impurities, but this requires samples with at least 8 mg L−1 of Si which are not always available in stream water. To the best of our knowledge, all the tests demonstrating sample matrix-based effects associated either with anions or DOC have been performed using ‘dry’ plasma conditions (refer to Table 1). The term ‘dry’, as defined by O'Connor et al.,13 refers to the use of desolvation units to reduce the solvent load before the analyte enters the plasma. Although ‘dry’ plasma offers the benefit of increasing sensitivity, it also exacerbates matrix effects due to the preconcentration of both the matrix and the analyte.14 In contrast, in ‘wet’ plasma, both the liquid phase aerosol and the vapor phase water are present. Isotopic measurements using ‘wet’ plasma require higher concentrations of Si, which may not always be possible depending on the type of samples but has the advantage of being less impacted by matrix effects. Consequently, the aim of this technical note is to investigate whether the sample matrix-based interferences observed in previous studies are also observed when Si isotopes are measured using a ‘wet’ plasma.
| Parameters | This study | Georg et al.5 (2006) | Van Den Boorn et al.8 (2009)a | Hughes et al.,10 (2011) | Chen et al.,9 (2016) | Oelze et al.,11 (2016) | |
|---|---|---|---|---|---|---|---|
| a Also based on Van Den Boorn et al. (2006). b n.i.: no information. | |||||||
| Instrument | Thermo Finnigan Neptune Plus | Nu plasma 1700 | Nu plasma | Thermo Finnigan Neptune | Nu plasma | Nu plasma II | Thermo Finnigan Neptune |
| RF power (W) | 1200 | 1300 | 1300 | n.i.b | n.i. | n.i. | n.i. |
| Resolution mode | Medium | High | High | Medium or high | Medium | Medium | High |
| Mass resolution | >4000 | 2000 | 400 | 2500 | n.i. | 4000 | n.i. |
| Plasma type | Wet | Dry | Dry | Dry | Dry | Dry | Dry |
| Cool gas (L min−1) | 15–16 | 13 | n.i. | n.i. | n.i. | n.i. | |
| Auxiliary gas (L min−1) | 0.9–1.01 | 0.9–0.75 | 0.9–1.01 | n.i. | n.i. | n.i. | n.i. |
| Sample gas (L min−1) | 0.98–1.1 | n.i. | n.i. | n.i. | n.i. | n.i. | n.i. |
| Introduction system | Cyclonic spray chamber | DSN-100 Nu instrument | Cetac Aridius | Cetac Aridus | Cetac Aridus II + spray chamber | Cetac Aridus II | ESI Apex-Q without desolvation membrane |
| N2: n.i. | N2: n.i. | N2: n.i. | N2: n.i. | N2: n.i. | N2: no | ||
| Nebulizer | PFA nebulizer (ESI) | Self-aspirant 6 mm microflow PFA nebulizer | PFA micro-concentric nebulizer | PFA nebulizer | PFA nebulizer | PFA nebulizer | |
| Nebulizer uptake flow (μL min−1) | ≈100 | 60–80 | 50 | n.i. | n.i. | n.i. | 100 |
| Cones (sample and skimmer) | Jet and H | “Experimental” WA cone | n.i. | n.i. | n.i. | Jet and H | |
| “Experimental” WA cone | |||||||
| Cup configuration | L4 (28Si), L1 (29Si), H2(30Si) | L7 (28Al), L4 (28Si), H1 (29Si), H6 (30Si) | L5 (28Si), Ax (29Si), H6 (30Si) | L4 (28Si), L1 (29Si), C (30Si) | n.i. | n.i. | L4 (28Si), L1 (29Si), C (30Si), L2 (24Mg), C (25Mg) H3 (26Mg) |
| Si concentration (ppm) | 1 | 0.6 | 2–5 | 2 | n.i. | 0.8–1 | |
| Sensitivity on 28Si (V per ppm) | 9–11 | 13 | 6 | n.i | n.i. | 6 | |
| Data acquisition | 25 cycles, integration time of 4.194 s | 25 cycles, integration time of 8 s | 60 cycles, integration time of 4 s | n.i. | 80 cycles, integration time of 5 s | Dynamic measurement (Mg-doping). 30 cycles, integration time of 4 s | |
| Mg doping | No | No | No | Yes | No | Yes | |
| Anion mass bias offset in δ30Si | Not observed | Not observed: up to [SO42−]/[Si] = 14.4 | +1.4‰ when [SO42−]/[Si] > 0.2 | +0.28‰ when [SO42−]/[Si] > 0.35 | +1.04‰ when [S]/[Si] > 0.25 | Not observed | |
| +0.65‰ when [DOC]/[Si] > 1.75 | |||||||
| Matrix | 0.2 N HNO3 | 0.1 N HCl | 0.25 N HNO3 | HCl | HCl | 0.1 N HCl | |
Methods
Materials and sample preparation
To investigate the potential impact of anions on the accuracy and precision of Si isotope measurements by MC-ICP-MS, we doped the NBS-28 (NIST® RM 8546) solution, a pure silicon dioxide used as an international reference material, with varying amounts of (a) Cl−, (b) SO42− and (c) a mix of both anions at 1![[thin space (1/6-em)]](https://www.rsc.org/images/entities/char_2009.gif) :1 ratio. We did not investigate the effect of nitrate in this study since the measurements were conducted in a 0.2 N HNO3 medium. The doping was achieved using dilutions of AccuSPEC SCP Science® (1001 μg mL−1) chloride and sulfate ion chromatography standards. We prepared a total of 36 doped samples, with [anion]/[Si] ratios ranging from 0.09 to 5.65, and then processed them through cationic chromatography – see details below.
:1 ratio. We did not investigate the effect of nitrate in this study since the measurements were conducted in a 0.2 N HNO3 medium. The doping was achieved using dilutions of AccuSPEC SCP Science® (1001 μg mL−1) chloride and sulfate ion chromatography standards. We prepared a total of 36 doped samples, with [anion]/[Si] ratios ranging from 0.09 to 5.65, and then processed them through cationic chromatography – see details below.
To assess the potential effect of dissolved organic carbon on Si isotope measurements, we opted for natural solutions (stream, groundwater, and soil solutions) with varying amounts of DOC, rather than adding a DOC standard to the NBS-28 pure Si solution. The natural water samples were collected from three different catchments: the Weierbach experimental catchment in Luxembourg,15 the Strengbach catchment16 and the Kervidy-Naizin of the ArgHyS observatory,17 both located in France. A total of 14 samples were selected to cover a large range of [DOC]/[Si] ratios, from 0.08 to 6.38, as shown in Table 2.
| Water type | Sample name | Concentrations (ppm) | Ratios (ppm/ppm) | |||||
|---|---|---|---|---|---|---|---|---|
| Si | DOC | Cl− | SO42− | [DOC]/[Si] | [Cl−]/[Si] | [SO42−]/[Si] | ||
| Weierbach (Luxembourg) | ||||||||
| Groundwater | GW11 | 6.68 | 0.531 | 3.917 | 10.724 | 0.08 | 0.59 | 1.60 |
| Groundwater | GW5 | 2.74 | 0.927 | 3.920 | 6.454 | 0.34 | 1.43 | 2.36 |
| Groundwater | GW2 | 2.86 | 2.355 | 3.090 | 6.993 | 0.82 | 1.08 | 2.44 |
| Streamwater | SW2 | 2.64 | 2.863 | 3.399 | 6.092 | 1.09 | 1.29 | 2.31 |
| Groundwater | GW9 | 2.87 | 4.000 | 3.340 | 9.374 | 1.39 | 1.16 | 3.26 |
| Streamwater | SW3 | 2.54 | 3.721 | 3.190 | 7.080 | 1.47 | 1.26 | 2.79 |
|
||||||||
| Strengbach (France) | ||||||||
| Groundwater | CS2 | 4.17 | 0.773 | 2.363 | 3.558 | 0.19 | 0.57 | 0.85 |
| Soil solution | RAZS | 3.72 | 1.823 | 2.206 | 3.953 | 0.49 | 0.59 | 1.06 |
| Groundwater | SG | 2.78 | 2.060 | 2.070 | 4.361 | 0.74 | 0.75 | 1.57 |
| Groundwater | BH | 3.71 | 4.887 | 2.364 | 3.829 | 1.32 | 0.64 | 1.03 |
| Streamwater | RUZS | 1.78 | 9.186 | 1.291 | 1.159 | 5.16 | 0.73 | 0.65 |
|
||||||||
| Kervidy-Naizin (France) | ||||||||
| Streamwater | N1_Ech04 | 3.51 | 7.089 | 30.37 | 7.63 | 2.02 | 8.65 | 2.17 |
| Streamwater | N1_Ech07 | 3.23 | 9.777 | 25.63 | 8.32 | 3.03 | 7.94 | 2.58 |
| Streamwater | N1_Ech19 | 3.35 | 13.680 | 26.93 | 9.69 | 4.09 | 8.05 | 2.89 |
Soil solution, stream and groundwater samples were filtered through 0.22 μm PES filters and collected in pre-cleaned LDPE bottles. Subsequently, the samples were acidified using concentrated 16 N HNO3 to reach pH 2. An additional 30 mL aliquot was filtered through a 0.45 μm glass fiber filter and acidified with 3 drops of H3PO4 in a glass bottle to determine the dissolved organic carbon. The samples were then stored refrigerated at 3 °C until being processed in the clean labs at the Institut de physique du globe de Paris (IPGP, France). Silicon concentrations were measured using an Agilent 7900 Inductively Coupled Plasma source Mass Spectrometer (ICP-MS); spectral interferences on mass 28 were mitigated by the use of an integrated collision cell with He. DOC concentrations were determined using a Shimadzu TOC-VCSH Total Organic Carbon Analyzer. Both analytical instruments are located at IPGP.
To decompose the DOC present in the samples, we opted for a different method than the photo-ozonolysis used by Hughes et al..10 Instead, we chose a UV photolysis method. To this end, 10 mL of acidified water samples were first transferred into a quartz vial (Metrohm) and 20 μL of 30% H2O2 (Suprapur) were added. The samples were irradiated using a UV digester (Metrohm AG – 705 UV Digester, equipped with a mercury lamp) at wavelength ranging from 200 to 600 nm for 10 minutes, followed by a cooling period of 10 minutes. This process was repeated twice, without adding any extra H2O2. After this treatment, the DOC concentration was measured to check the DOC decomposition. All samples had a post-treatment concentration below 0.5 ppm. We also conducted procedural blanks of ultrapure MilliQ water with 20 μL of 30% H2O2 to assess the degree of Si leaching from the quartz tubes and the purity of the H2O2. There was no evidence of Si contamination, as the Si concentration in the blanks was below the detection limit.
Sample digestion
We used an alkali fusion technique adapted from the method published in Georg et al.5 to digest five reference materials: NBS-28 (NIST® RM 8546), a pure silicon dioxide used as the bracketing standard; two USGS basalts, BHVO-2 (Hawaiian Volcano Observatory Basalt) and BCR-2 (Columbia River Basalt); an artificial highly fractionated SiO2 material known as Big Batch, which was prepared by precipitating large amounts of dissolved sodium metasilicate at the Marine Science Institute, UCSB, USA;18 and a natural diatomite rock called “Diatomite”, which was obtained from one of the world's largest diatomite deposits situated in Lompoc, California.19 Ultrapure MilliQ® water (18.2 MΩ cm, Millipore, USA) was used for all the dilutions, and concentrated acids were purified by in-house sub-boiling distillation. For each reference material, depending on the Si concentration, we weighed between 5 mg and 10 mg of powdered material in Ag crucibles and added NaOH pellets (analytical grade, Merck) while maintaining a ratio between the material's weight and the NaOH pellets of less than 1:10. The crucibles were heated at 720 °C for 12 minutes in a muffle furnace, and left to cool down to 300 °C. Subsequently, the crucibles were transferred into a Teflon vial with 15 mL of MilliQ® water, closed and left for 24 hours at room temperature. The liquid was then transferred into LDPE bottles, and the Teflon vial containing the crucibles was filled with 10 mL of MilliQ® water and sonicated for 15 minutes before transferring the liquid into the bottle. This step was repeated three times to ensure optimal recovery from the crucibles. Finally, the sample was diluted to reach a Si concentration of less than 30 ppm (to avoid precipitation of silica) and adjusted to 0.2 N HNO3, ready for Si purification. The yields after alkaline fusions for standard are 94.5% for the NBS-28, 99.3% for BCR-2 and, 92.2% for BHVO-2. Uncertainties in powder weights (10–5 mg), dilution steps, and ICP-MS measurement are estimated at 3%.
Chemical purification
The Si purification procedure involved a column chemistry protocol adapted from Van Den Boorn et al.6 and Georg et al.5 About 20 μg Si were loaded onto a Biorad polypropylene column filled with 1.8 mL of AG50W-X12 resin (200–400 mesh). Silicon was eluted by adding 5 mL of MilliQ® water, in two steps. Approximately 70% of the silicon is collected in the first elution step (2 mL MilliQ®) with the remaining 30% being collected in the final elution step (3 mL MilliQ®). The solution is then adjusted to 0.2 N NHO3 and diluted for a target concentration of 1 ppm, ready to be analyzed on the MC-ICP-MS.Silicon isotope measurements by MC-ICP-MS
Silicon isotopes were measured using a Thermo Finnigan Neptune Plus MC-ICP-MS (IPGP, France) in ‘wet’ plasma mode. Samples were introduced using a Stable Introduction System (SIS) composed of a quartz spray chamber, with an uptake rate of ∼100 μL min−1. Jet sampler and H skimmer nickel cones were used. Isotopes 28Si, 29Si and 30Si were simultaneously collected in three Faraday cups (L4, L1 and H2, respectively), using ‘medium’ resolution (M/ΔM 5–95% peak height ≥ ∼4000) to separate polyatomic interferences. Table 1 shows the operating parameters of the Neptune Plus instrument used in the course of this study. The samples were analyzed at a silicon concentration of 1 ppm, with typical signal intensities for 28Si+ ranging from 9 to 11 V. The typical background signal on 28Si+ was <0.04 V. The Faraday cup amplifiers (with 1011 Ω feedback resistors) were internally calibrated for baseline and gain at the beginning of each analytical session. Silicon isotopic compositions are reported in standard per mil notation, δ30Si (‰) and δ29Si (‰), calculated by a classical standard-sample bracketing (SSB) method using the NBS-28 as the bracketing standard. One measurement consists of 25 cycles of 4.194 s integration. Each sample was measured multiple times (n), and the reported delta values correspond to the average of the n consecutive measurements (n = 4 to 8).Results and discussion
Data quality and rejection criteria
The measurements were conducted over the course of three years (2021, 2022 and 2023). Certified USGS basalt standards BHVO-2 and BCR-2, Diatomite and Big Batch were routinely measured during the different analytical sessions to check the accuracy and precision of the measurements. Table 3 provides the δ30Si values obtained over the course of this study for these four reference materials, with δ30Si = −0.30 ± 0.12‰ (2SD, n = 127) for BHVO-2, −0.28 ± 0.12‰ (2SD, n = 8) for BCR-2, 1.29 ± 0.17‰ (2SD, n = 127) for Diatomite and −10.59 ± 0.20‰ (2SD, n = 49) for Big Batch. The δ30Si obtained for BHVO-2 is in agreement with the value of −0.27 ± 0.11‰ (2SD) reported by Jochum et al.20 based on a compilation of the GeoReM database, as well as with the more recent compilation of published data by Delvigne et al.,21 which gave a value of −0.28 ± 0.08‰ (2SD). The δ30Si value for BCR-2 agree with compilation of 4 measurements in the GeoReM database with value of −0.24 ± 0.05‰ (2SD) reported by Jochum et al.20 The δ30Si values obtained for Diatomite and Big Batch are in good agreement with the values reported in Reynolds et al.,19 who gave δ30Si values of 1.26 ± 0.20‰ and −10.48 ± 0.20‰ respectively.| Standard name | δ 30Si (‰) | δ 29Si (‰) | n | ||||
|---|---|---|---|---|---|---|---|
| Mean | 2SD | 95% CI | Mean | 2SD | 95% CI | ||
| BHVO-2 | −0.30 | 0.12 | 0.01 | −0.16 | 0.08 | 0.01 | 127 |
| BCR-2 | −0.28 | 0.12 | 0.05 | −0.15 | 0.07 | 0.03 | 8 |
| Diatomite | 1.29 | 0.17 | 0.01 | 0.66 | 0.13 | 0.01 | 127 |
| Big Batch | −10.59 | 0.20 | 0.03 | −5.43 | 0.13 | 0.02 | 49 |
Additionally, the δ30Si values reported for BHVO-2 and Diatomite in this study are consistent with the long-term values we obtained over three years, comprising 14 analytical sessions for BHVO-2 and one year with 4 analytical sessions for Diatomite. Fig. 1 illustrates both the short-term repeatability (3 to 4 consecutive measurements) and the long-term reproducibility. Short-term repeatability for BHVO-2 and Diatomite is typically ca. 0.07‰ and 0.09‰ (95% CI), respectively. The long-term δ30Si values are −0.30 ± 0.11‰ (2SD, n = 451) for BHVO-2 and -1.28 ± 0.16‰ (2SD, n = 182) for Diatomite, showing long-term reproducibility of 0.11% and 0.16% (2SD), respectively.
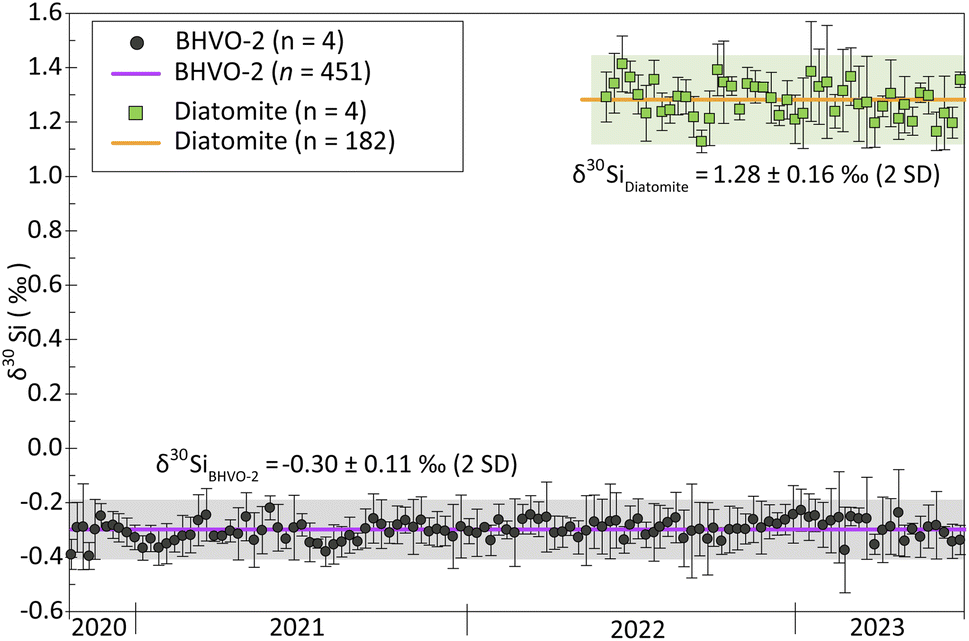 | ||
| Fig. 1 Long-term reproducibility and short-term repeatability of BHVO-2 and Diatomite over three years. Green squares (Diatomite) and black dots (BHVO-2) represents the average values for 4 consecutive measurements, with error bars indicating the 95% CI. The long-term δ30Si in purple for BHVO-2 and orange for Diatomite represent the mean of all the measurements. Shaded areas around the lines represent the uncertainty (2SD). | ||
Analytical sequences in which the delta values of the reference standard were not in the margins of the long-term standard measurements were rejected. Likewise, samples whose 2SD were larger than 0.16 (average long-term 2SD for standards) were discarded and re-measured.
The three-isotope plot of Si (Fig. 2) shows that all the data obtained in this study plot along the mass-dependent fractionation line. The slope of the line described by our measurements is of 0.5126 ± 0.0032 SE, calculated using IsoplotR's maximum likelihood estimator,22 which is consistent with the slopes of the theoretical mass-dependent fractionation lines, i.e., 0.5092 and 0.5178 for kinetic and equilibrium fractionation, respectively.
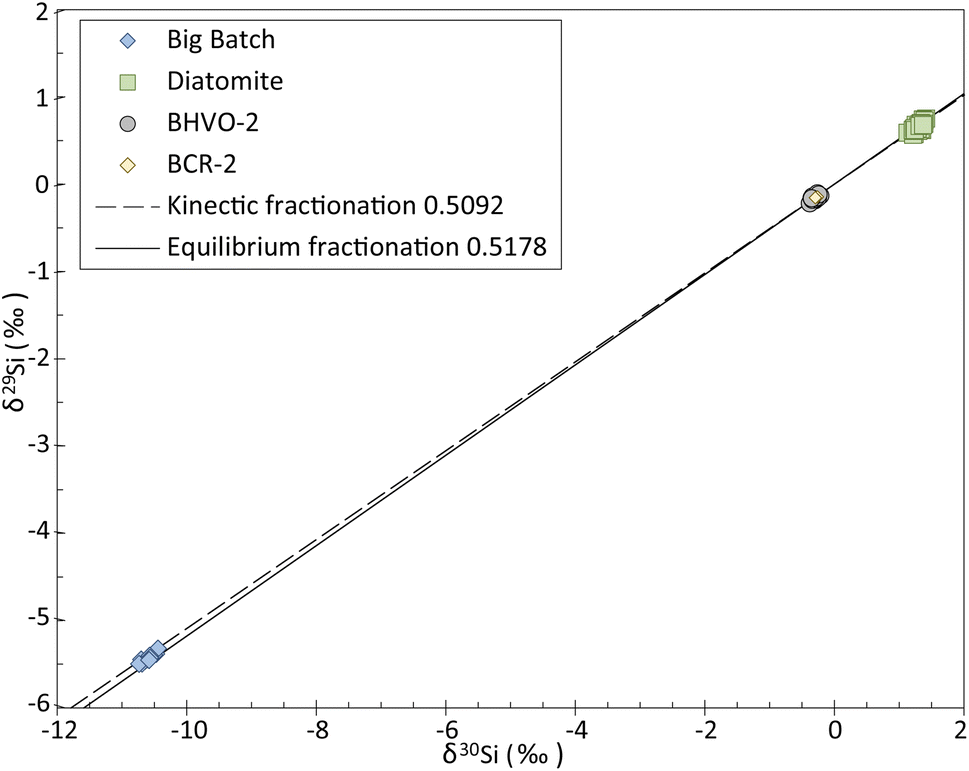 | ||
| Fig. 2 Three-isotope plot of Si for the four reference materials BHVO-2, BCR-2, Big Batch and Diatomite measured during this study. Our data fall along a mass-dependent fractionation line with a slope of 0.5126 (δ29Si = δ30Si × 0.5126). | ||
Sulfate and chloride matrix effect
A total of 36 solutions of NBS-28 doped with anions were analyzed (12 with chloride, 12 with sulfate, and 12 with a mixture both at a 1:1 concentration ratio). Additionally, undoped NBS-28 was systematically measured during the different analytical sessions. Undoped NBS-28 was measured a total of 97 times, giving δ30Si = −0.01 ± 0.09‰ and δ29Si = 0.00 ± 0.09‰ (2SD), as expected for a self-bracketed solution. Overall, the 36 doped solutions show good reproducibility, with a 95% CI < 0.10‰ and 2SD < 0.14‰ for δ30Si. The results for each solution are reported in the ESI (Table A†), as well as in Fig. 3 where the δ30Si for each doped sample is plotted against the [anion]/[Si] ratio (wt/wt). Deviation from the δ30Si NBS-28 value of 0.0‰ would be observed if a matrix effect occurs. However, as can be seen on Fig. 2a, our chloride-doped solutions show no significant offset, with all the δ30Si values falling within the 2SD range of the undoped NBS-28. The δ30Si values for all doped solutions typically range from −0.04 to 0.03‰, with the exception of the solution whose [Cl−]/[Si] = 1.75 which has a δ30Si of 0.08 ± 0.08‰ (95% CI). However, the latter value remains within uncertainties of the undoped NBS-28. Our results clearly indicate that no significant matrix effect is induced by the presence of chloride for [Cl−]/[Si] ratio < 5.65. In contrast to the findings of Van Den Boorn et al.,8 Chen et al.9 and Hughes et al.,10 we did not observe significant offset in the delta values resulting from SO42− contamination or both Cl− and SO42− contamination. In general, the δ30Si values for the sulfate-doped solutions typically range from 0 to −0.09‰, with the exceptions of the solutions whose [SO42−]/[Si] = 0.12 and 0.15 that show a slightly larger deviation of −0.12‰ and −0.11‰, respectively. However, all those values remain within uncertainties of the undoped NBS-28. Similarly, the solutions doped with both Cl− and SO42− anions show a similar behavior, with δ30Si values typically ranging from 0.04 to −0.09‰, except for the solutions whose [SO42−]/[Si] and [Cl−]/[Si] = 0.55 and 0.72, which display a slightly larger deviation of −0.12‰ and −0.13‰ of δ30Si, respectively. Again, all those values remain within uncertainties of the undoped NBS-28.
 | ||
| Fig. 3 δ 30Si values for the NBS-28 standard solution doped with chloride (a), sulfate (b) and both sulfate and chloride (c) at different [anion]/[Si] ratios. In each plot, error bars represent the 95% confidence interval for each sample, grey line represent the value of NBS-28 without doping (n = 97) and the shaded area represent the uncertainty of 0.09‰ (2SD). | ||
To further evaluate the effect of anions on the precision and accuracy of Si isotope measurements, we divided all measurements in four groups, as the δ30Si for the doped samples was consistent regardless of the [anion]/[Si] ratios. The first group consists of all the measurements of the undoped NBS-28 solution, while the second, third and fourth groups include measurements of samples doped with either chloride, or sulfate, or the mix of both SO42− and Cl−, respectively, regardless of the [anion]/[Si] ratios. Table 4 summarizes the statistical metrics for each group. Undoped NBS-28 has a mean δ30Si value of −0.01 ± 0.09‰ (2SD, n = 97), while the mean for the chloride-doped group is similar with a δ30Si of 0.00 ± 0.09‰ (2SD, n = 48), confirming there is no influence of chloride on the accuracy and precision of Si isotope measurements within our analytical uncertainty. The sulfate and sulfate plus chloride doped groups exhibit the same mean δ30Si value of −0.06‰ ± 0.10‰ (2SD, n = 48) and −0.06‰ ± 0.12‰ (2SD, n = 74), respectively. This observation suggests a potential matrix effect in both groups when comparing mean values. However, it is important to note that this shift falls within our analytical uncertainty for the mean values within each group, as observed for the individual measurements (n = 4).
| Group | δ 30Si (‰) | δ 29Si (‰) | n | ||||
|---|---|---|---|---|---|---|---|
| Mean | 2SD | 95% CI | Mean | 2SD | 95% CI | ||
| Undoped NBS-28 | −0.01 | 0.09 | 0.01 | 0.00 | 0.09 | 0.01 | 97 |
| Cl− doped | −0.00 | 0.09 | 0.01 | 0.01 | 0.07 | 0.01 | 48 |
| SO42− doped | −0.06 | 0.10 | 0.01 | −0.02 | 0.09 | 0.01 | 48 |
| SO42− and Cl− doped | −0.06 | 0.12 | 0.01 | −0.03 | 0.11 | 0.01 | 74 |
| T test | ||||
|---|---|---|---|---|
| Group 1 | Group 2 | t | P values | Meaning |
| Undoped NBS-28 | Cl− doped | −0.55 | 0.58 | Null hypothesis is accepted |
| Undoped NBS-28 | SO42− doped | 5.12 | 0.00 | Null hypothesis is rejected |
| Undoped NBS-28 | SO42− and Cl− doped | 5.06 | 0.00 | Null hypothesis is rejected |
| Cl− doped | SO42− doped | 6.25 | 0.00 | Null hypothesis is rejected |
| Cl− doped | SO42− and Cl− doped | 6.18 | 0.00 | Null hypothesis is rejected |
| SO42− and Cl− doped | SO42− doped | −0.01 | 0.99 | Null hypothesis is accepted |
To determine whether the means of the four groups are different, we first tested the normal distribution of the groups using a Shapiro–Wilk test with a 95% confidence level. Once we confirmed that all four groups have a normal distribution, we used a t-test to compare the arithmetic means of the groups. The t-test was conducted with a 95% confidence level to test the null hypothesis, which assumes that two independent groups have identical average values for δ30Si. A p-value greater than 0.05 indicates that we do not have sufficient evidence to conclude that the two means are different, while a p-value smaller than 0.05 suggests that the groups do not come from the same population and have different means. Table 4 presents the results of the t-test for the 6 possible combinations of groups. The tests conducted between undoped NBS-28 and Cl−-doped NBS-28, as well as between SO42−-doped and SO42− and Cl− doped groups, show that we do not have enough evidence to reject the null hypothesis concluding that these groups have the same mean. However, the results of the remaining tests indicate that we have enough evidence to reject the null hypothesis and conclude that undoped NBS-28 and the chloride doped groups have different means than the SO42− doped and SO42− and Cl− doped groups, suggesting that they come from different populations.
Although the statistical approach revealed a shift in δ30Si of −0.06‰ produced by sulfate and a mixture of sulfate and chloride contamination, this shift is substantially smaller than those reported by previous authors with values of +1.4‰,8 +0.28‰10 and +1.04‰.9 Moreover, considering the analytical uncertainties associated with Si isotope measurements by MC-ICP-MS, the shift in δ30Si of −0.06‰ for both groups (sulfate only and sulfate + chloride) fall within errors of the undoped NBS-28, whose δ30Si = −0.01 ± 0.09‰ (2SD), as well as within the long-term reproducibility of ±0.11‰ (2SD) obtained for the BHVO-2 standard. Consequently, we concluded that despite observing a matrix effect (−0.06‰) produced by sulfate, chloride, or a mix of both anions, this effect is not distinguishable given our current measurement uncertainties.
Dissolved organic carbon matrix effect
To investigate the impact of the DOC on Si isotope measurements, we analyzed natural water samples including groundwater, soil solution and stream water from three distinct catchments (see Table 2). The samples display a range of [DOC]/[Si] ratios, from 0.08 to 5.16. To identify any shift induced by the DOC, we measured the δ30Si for each sample twice, in samples for which we applied the UV photolysis treatment described in the Method section, and in samples that were not treated. The UV photolysis was conducted before the samples were processed through ion chromatography procedure. We refer to samples that underwent UV treatment as “treated”, and the others as “untreated”.Our dataset shows no significant difference between treated and untreated samples, with most data plotting on a 1:1 line (Fig. 4a and ESI Table B†). The only two samples that deviate significantly from the 1:1 line come from the Naizin-Kerdivy catchment and correspond to the ones with the highest [DOC]/[Si] ratios (of 4 and 5.8, Fig. 4b). The difference between the treated and untreated δ30Si value is of 0.09 and 0.10‰, respectively. As already mentioned, this limited offset is only observed in the samples from Naizin-Kervidy catchment and cannot be only attributed to the [DOC]/[Si] ratio. In fact, one sample from the Strengbach catchement shows a high [DOC]/[Si] ratio of 5.16 but with no associated difference between treated and untreated samples. We suggest that the offset seen for the two samples from Naizin-Kervidy catchment is related to the type of DOC present in this catchment, and not the amount of DOC. The main constituents of natural waters are humic substances, which can be classified into humic acids and fulvic acids. Together, these substances constitute approximately 60% of the total dissolved organic carbon.23 Humic substances are complex molecules, and their precise structures remain unidentified.24 Consequently, predicting the behavior of dissolved organic carbon during ion transmission becomes challenging due to the diverse compounds that may be present in various sample types.
 | ||
| Fig. 4 (a) δ30Si values of untreated samples against that of the treated samples. Green diamonds, orange squares and blue dots represent treated samples of Naizin-Kerdivy, Strengbach and the experimental catchment of the Weierbach, respectively. (b) δ30Si values for the UV photolysis-treated and untreated samples in function of their [DOC]/[Si] ratios. Black dots represent the value of untreated samples. | ||
Although no significant matrix effect was observed due to the presence of organic carbon, Liu et al.25 reported that when samples are introduced into the plasma in an organic-solvent matrix or water-organic solvent mixture matrix, the resulting organic plasma contracts and narrows along the axial and possibly along radial directions (approx. 20–30% decrease in plasma volume). Consequently, the plasma becomes more concentrated, with a higher ion density and, therefore, a greater number of ions are sampled into the interface orifice.25 This may cause an increase in the sample concentration, leading to a concentration mismatch between the unknown samples and the bracketing standard resulting in inaccurate isotope measurements. To avoid potential matrix effects, we recommend using the UV photolysis method or photo-ozonolysis to remove any DOC from samples, especially for soil solutions and rivers, as proposed by Hughes et al.10 Moreover, beyond the accurate and precise determination of the isotopic ratios, introducing high concentrations of DOC into the MC-ICP-MS is not recommended, as it may cause clogging of the nebulizer and may form deposits on the cones.
What can cause matrix effects?
Sample matrix-based interferences are produced by the suppression or enhancement of the analyte signal compared to what is expected for the same analyte concentration in a matrix-free solution. Various factors can influence the transmission of ions from the plasma into the mass spectrometer, including the introduction system setup, the matrix of the sample solution, and the operating parameters of the instrument.The different introduction setups appear to be the most plausible explanation for the matrix effect observed by Van Den Boorn et al.,8 Hughes et al.10 and Chen et al.,9 who all measured Si isotope compositions in dry plasma using a Cetac Aridus introduction system. While the use of a desolvating system (dry plasma) offers the advantage of increasing the sensibility, it is also more sensitive to the presence of matrix and leads to a less stable signal.21 Oelze et al.11 examined the influence of anions on matrix effects in dry plasma using an ESI Apex Q introduction system and did not observe any significant shift in δ30Si values (for SSB and SSB + Mg correction). Hence, a possibility is that the desolvation membrane (present on a Cetac Aridus but absent on an Apex Q introduction system) might be responsible for increasing the matrix effects, however this should be tested. Nevertheless, Georg et al.5 did not observe any mass bias caused by the presence of SO42− or NO3−, despite using a Cetac Aridus introduction system. To explain these contrasting results, Van Den Boorn et al.8 suggested that the difference in sample solution-medium (0.1 N HCl vs. 0.25 N HNO3) could be a contributing factor. However, the tests conducted by Van Den Boorn et al.8 with [SO42−]/[Si] = 0.4 in HCl revealed that while 0.1 N HCl reduces the bias by approximately 1.5 times compare to 0.25 N HNO3 (+1.3‰), a significant shift of +0.8‰ persisted. Therefore, the different matrix does not appear to be entirely responsible for the significant offset caused by sulfate contamination. Our runs were performed in a 0.2 N HNO3 matrix, and we observed no shift.
Variations in instrumental parameters such as carrier flow rate, sampling depth in the plasma and ion optic settings could also be a potential explanation for the discrepancy reported between the different studies using a Cetac Aridus introduction system. Fontaine et al.26 evaluated the matrix effect caused by holmium (Ho) in determining the 146Nd/144Nd ratios using a Cetac Aridus introduction system. They reported that when increasing Ho concentration in the matrix up to a factor of 6, the mass bias variation induced can be reduced increasing carrier gas flow from 1.076 to 1.131 L min−1. Therefore, if the discrepancy is indeed due to instrumental parameters, matrix effects could be mitigated by optimizing the instrument parameters while measuring a reference material (such as BHVO-2, Diatomite or Big Batch) doped with a high and known amount of SO42−. This approach can help ensure precise and accurate Si isotope measurements. Van Den Boorn et al.8 and Chen et al.9 also observed an increase up to 60% in the beam intensity in the solutions with [SO42−]/[Si] > 0.2 with an offset on δ30Si. Van Den Boorn et al.8 attributed this intensity increase to either the ionization efficiency of silicon in the plasma, or the transport efficiency in the sample introduction system or in the mass spectrometer. They suggest that monitoring changes in intensity can be valuable indicator to identify any inaccurate measurements caused by SO42− and/or DOC contamination. We specifically examined the intensity in the samples that exhibited the largest deviations among all the doping tests, but we observed no intensity increase.
Finally, another factor that could explain the discrepancy in matrix effects observed by different groups using a Cetac Aridus introduction system is the absolute concentration of anions introduced into the plasma, rather than the [anion]/[Si] ratio. Tan et al.27 demonstrated that matrix effects in ICP-MS are more dependent on the absolute concentration of the matrix element rather than on the relative concentration of matrix to analyte. Thus, dilutions can be employed to minimize matrix effects. In fact, Van Den Boorn et al.8 measured Si isotope compositions at higher Si concentrations, ranging from 2 to 5 ppm, compared to Georg et al.,5 Oelze et al.11 and this study, who measured at concentrations of 0.6 ppm, 0.6 ppm and 1 ppm respectively. Indeed, some preliminary tests conducted at IPGP show that doping NBS-28 solution with sulfur standard but with much higher Si and sulfur concentrations (20 ppm and 0.2–10 ppm, respectively), an offset up to +0.14‰ in δ30Si values was observed when [S]/[Si] > 0.5 (H. Sun, personal communication). In this context, dilution during dry plasma measurements could potentially mitigate the observed matrix effects, especially if the total amount of anions is a crucial factor influencing these effects. However, further investigations are required to thoroughly assess the impact of dilution on reducing matrix effects in dry plasma.
Based on our analyses, we concluded that the discrepancy amongst studies can be primarily attributed to the use of desolvating sample introduction systems. Meanwhile, the influence of other operating parameters and the absolute quantity of sulfates introduced into the plasma seem to play a secondary role.
Conclusions
We did not observe any significant offset in δ30Si values outside the range of our analytical precision (±0.09‰, 2SD) induced by the presence of chloride, sulfate or dissolved organic carbon in the matrix, across a range of [Cl−]/[Si] = 0.09 to 5.65, [SO42−]/[Si] = 0.09 to 5.65 and [DOC]/[Si] = 0.08 to 6.38. Statistical tests reveal a mean shift of −0.06‰ in solutions doped with SO42− and a mixture of SO42− and Cl−, indicating the presence of matrix effects. However, this shift falls within analytical uncertainty, considering the current precision in Si isotopes measurements by MC-ICP-MS. Although the offset due to DOC contamination was less than 0.10‰ and fell within the range of analytical uncertainty, we recommend removal of DOC from samples. We have presented an easy and rapid methodology to remove organic matter from water samples and ensure accurate and precise Si isotope measurements. Our results indicate that precise and accurate measurements (<0.11‰, 2SD) can be attained for stable Si isotope ratios by MC-ICP-MS in wet plasma, with a larger tolerance to sample based-matrix effect induced by anion contamination compared to dry plasma.Author contributions
Sofía López-Urzúa: conceptualization, data curation, formal analysis, methodology, investigation, writing – original draft. Tu-Han Luu: Writing – review & editing. Louis Derry: funding acquisition, project administration, resources, writing – review & editing.Conflicts of interest
There are no conflicts to declare.Acknowledgements
This study was financially supported by Agence Nationale de la Recherche (ANR) through the “Investissements d'avenir” program under the project CZTOP (n 725 ANR-17-MPGA726 0009). We greatly thank Dimitri Rigoussen for technical support with MC-ICP-MS analyses and Pierre Burckel for the measurement of Si concentrations by ICP-MS Agilent 7900. We also thank Mark Brzezinski and Janice Jones for kindly providing the Diatomite and Big Batch standards. We are grateful for the thoughtful and constructive comments by two anonymous reviewers.References
- J. H. Reynolds and J. Verhoogen, Natural variations in the isotopic constitution of silicon, Geochim. Cosmochim. Acta, 1953, 3(5), 224–234 CrossRef CAS.
- C. L. De La Rocha, Measurement of silicon stable isotope natural abundances via multicollector inductively coupled plasma mass spectrometry (MC-ICP-MS), Geochem., Geophys., Geosyst., 2002, 3(8), 1–8 CrossRef.
- E. Engström, I. Rodushkin, D. C. Baxter and B. Öhlander, Chromatographic Purification for the Determination of Dissolved Silicon Isotopic Compositions in Natural Waters by High-Resolution Multicollector Inductively Coupled Plasma Mass Spectrometry, Anal. Chem., 2006, 78(1), 250–257 CrossRef PubMed.
- T. Ding, D. Wan, C. Wang and F. Zhang, Silicon isotope compositions of dissolved silicon and suspended matter in the Yangtze River, China, Geochim. Cosmochim. Acta, 2004, 68(2), 205–216 CrossRef CAS.
- R. B. Georg, B. C. Reynolds, M. Frank and A. N. Halliday, New sample preparation techniques for the determination of Si isotopic compositions using MC-ICPMS, Chem. Geol., 2006, 235(1–2), 95–104 CrossRef CAS.
- S. H. J. M. Van Den Boorn, P. Z. Vroon, C. C. Van Belle, B. Van Der Wagt, J. Schwieters and M. J. Van Bergen, Determination of silicon isotope ratios in silicate materials by high-resolution MC-ICP-MS using a sodium hydroxide sample digestion method, J. Anal. At. Spectrom., 2006, 21(8), 734 RSC.
- J. W. Olesik, Inductively Coupled Plasma Mass Spectrometers, in Treatise on Geochemistry, Elsevier, 2014, pp. 309–336 Search PubMed.
- S. H. J. M. Van Den Boorn, P. Z. Vroon and M. J. Van Bergen, Sulfur-induced offsets in MC-ICP-MS silicon-isotope measurements, J. Anal. At. Spectrom., 2009, 24(8), 1111 RSC.
- X. Chen, T. J. Lapen and H. S. Chafetz, Accurate and Precise Silicon Isotope Analysis of Sulfur- and Iron-Rich Samples by MC - ICP - MS, Geostand. Geoanal. Res., 2017, 41(3), 427–435 CrossRef CAS.
- H. J. Hughes, C. Delvigne, M. Korntheuer, J. De Jong, L. André and D. Cardinal, Controlling the mass bias introduced by anionic and organic matrices in silicon isotopic measurements by MC-ICP-MS, J. Anal. At. Spectrom., 2011, 26(9), 1892 RSC.
- M. Oelze, J. A. Schuessler and F. Von Blanckenburg, Mass bias stabilization by Mg doping for Si stable isotope analysis by MC-ICP-MS, J. Anal. At. Spectrom., 2016, 31(10), 2094–2100 RSC.
- F. Gaspard, S. Opfergelt, C. Dessert, V. Robert, Y. Ameijeiras-Mariño and P. Delmelle, Imprint of chemical weathering and hydrothermalism on the Ge/Si ratio and Si isotope composition of rivers in a volcanic tropical island, Basse-Terre, Guadeloupe (French West Indies), Chem. Geol., 2021, 577, 120283 CrossRef CAS.
- C. O'Connor, B. L. Sharp and P. Evans, On-line additions of aqueous standards for calibration of laser ablation inductively coupled plasma mass spectrometry: theory and comparison of wet and dry plasma conditions, J. Anal. At. Spectrom., 2006, 21(6), 556 RSC.
- C. Agatemor and D. Beauchemin, Matrix effects in inductively coupled plasma mass spectrometry: A review, Anal. Chim. Acta, 2011, 706(1), 66–83 CrossRef CAS PubMed.
- C. Hissler, N. Martínez-Carreras, F. Barnich, L. Gourdol, J. F. Iffly and J. Juilleret, et al., The Weierbach experimental catchment in Luxembourg: A decade of critical zone monitoring in a temperate forest - from hydrological investigations to ecohydrological perspectives, Hydrol. Processes, 2021, 35(5), e14140 CrossRef.
- M. C. Pierret, S. Cotel, P. Ackerer, E. Beaulieu, S. Benarioumlil and M. Boucher, et al., The Strengbach Catchment: A Multidisciplinary Environmental Sentry for 30 Years, Vadose Zone J., 2018, 17(1), 1 CrossRef.
- O. Fovet, L. Ruiz, G. Gruau, N. Akkal, L. Aquilina and S. Busnot, et al., AgrHyS: An Observatory of Response Times in Agro-Hydro Systems, Vadose Zone J., 2018, 17(1), 1–16 CrossRef.
- D. Cardinal, L. Y. Alleman, J. De Jong, K. Ziegler and L. André, Isotopic composition of silicon measured by multicollector plasma source mass spectrometry in dry plasma mode, J. Anal. At. Spectrom., 2003, 18(3), 213–218 RSC.
- B. C. Reynolds, J. Aggarwal, L. André, D. Baxter, C. Beucher and M. A. Brzezinski, et al., An inter-laboratory comparison of Si isotope reference materials, J. Anal. At. Spectrom., 2007, 22(5), 561–568 RSC.
- K. P. Jochum, U. Nohl, K. Herwig, E. Lammel, B. Stoll and A. W. Hofmann, GeoReM: A New Geochemical Database for Reference Materials and Isotopic Standards, Geostand. Geoanal. Res., 2005, 29(3), 333–338 CrossRef CAS.
- C. Delvigne, A. Guihou, J. A. Schuessler, P. Savage, F. Poitrasson and S. Fischer, et al., Silicon Isotope Analyses of Soil and Plant Reference Materials: An Inter-Comparison of Seven Laboratories, Geostand. Geoanal. Res., 2021, 45(3), 525–538 CrossRef CAS.
- P. Vermeesch, IsoplotR: A free and open toolbox for geochronology, Geosci. Front., 2018, 9(5), 1479–1493 CrossRef CAS.
- E. M. Thurman. Amount of Organic Carbon in Natural Waters, in Organic Geochemistry of Natural Waters, Springer Netherlands, Dordrecht, 1985, pp. 7–65 Search PubMed.
- W. M. White, Organic geochemistry, the carbon cycle, and climate, in Geochemistry, Wiley-Blackwell, Chichester, West Sussex: Hoboken, NJ, 2013, p. 1 Search PubMed.
- S. Liu, Z. Han, X. Kong, J. Zhang, Z. Lv and G. Yuan, Organic matrix effects in inductively coupled plasma mass spectrometry: a tutorial review, Appl. Spectrosc. Rev., 2022, 57(6), 461–489 CrossRef.
- G. H. Fontaine, B. Hattendorf, B. Bourdon and D. Günther, Effects of operating conditions and matrix on mass bias in MC-ICPMS, J. Anal. At. Spectrom., 2009, 24(5), 637 RSC.
- S. H. Tan and G. Horlick, Matrix-effect observations in inductively coupled plasma mass spectrometry, J. Anal. At. Spectrom., 1987, 2(8), 745 RSC.
Footnote |
| † Electronic supplementary information (ESI) available. See DOI: https://doi.org/10.1039/d3ja00290j |
| This journal is © The Royal Society of Chemistry 2024 |