
 Open Access Article
 This Open Access Article is licensed under a Creative Commons Attribution-Non Commercial 3.0 Unported Licence
Comparison of microbial strains as candidate hosts and genetic reservoirs for the valorization of lignin streams†
Rebecca A.
Wilkes
 ab,
Andrew J.
Borchert
ab,
Valentina E.
Garcia
cd,
Gina M.
Geiselman
cd,
Sarah
Liu
e,
Adam M.
Guss
bf,
Joshua K.
Michener
bf,
Daniel R.
Noguera
e,
Eiji
Masai
g,
John M.
Gladden
cd,
John
Ralph
e and
Gregg T.
Beckham
*ab
ab,
Andrew J.
Borchert
ab,
Valentina E.
Garcia
cd,
Gina M.
Geiselman
cd,
Sarah
Liu
e,
Adam M.
Guss
bf,
Joshua K.
Michener
bf,
Daniel R.
Noguera
e,
Eiji
Masai
g,
John M.
Gladden
cd,
John
Ralph
e and
Gregg T.
Beckham
*ab
aRenewable Resources and Enabling Sciences Center, National Renewable Energy Laboratory, Golden, CO 80401, USA. E-mail: gregg.beckham@nrel.gov
bCenter for Bioenergy Innovation, Oak Ridge National Laboratory, Oak Ridge, TN, USA
cJoint BioEnergy Institute, Lawrence Berkeley National Laboratory, Emeryville, CA 94608, USA
dBiomanufacturing and Biomaterials Department, Sandia National Laboratories, Livermore, CA 94550, USA
eGreat Lakes Bioenergy Research Center, University of Wisconsin–Madison, Madison, Wisconsin, USA
fBiosciences Division, Oak Ridge National Laboratory, Oak Ridge, TN 37830, USA
gDepartment of Materials Science and Bioengineering, Nagaoka University of Technology, Nagaoka, Niigata 940-2188, Japan
First published on 5th November 2024
Abstract
Bioconversion of lignin-rich streams requires microbial hosts capable of utilizing and tolerating heterogeneous mixtures of monomeric and oligomeric compounds. Promising strains such as Novosphingobium aromaticivorans F199, N. aromaticivorans JMN2, Pseudomonas putida KT2440, Rhodococcus opacus PD630, Rhodosporidium toruloides NBRC0880, Sphingobium lignivorans B1D3A, and S. lignivorans SYK-6 possess inherent catabolic abilities to utilize lignin-related compounds (LRCs). In this work, we compared the cellular fitness and catabolic capabilities of these six bacteria and one yeast on a lignin-rich stream, alkaline pretreated liquor (APL) from corn stover, and on representative aromatic and aliphatic compounds. First, a minimal medium recipe that supported the growth of all seven strains on LRCs was selected for the comparison. Using this minimal medium, P. putida KT2440 was found to have the fastest growth and greatest tolerance when grown on guaiacyl-type compounds, p-hydroxyphenyl-type compounds, aliphatic acids, corn stover APL, and a model chemical mixture, whereas the S. lignivorans strains had the fastest growth on the syringyl-type compound. After 120 h on APL, the change in total lignin was 10–12% and aromatic and aliphatic compound usage was 85–96% for all the strains except R. opacus PD630, which had minimal utilization of APL components. Although substantial conversion of high-molecular-mass lignin was not observed by any strains, the S. lignivorans strains showed detectable modification β-ether units. Additionally, the N. aromaticivorans strains liberated aromatic compounds, potentially from lignin oligomer modification. This work serves as a comparison of seven promising microbial strains for bioconversion of lignin-enriched streams, providing a foundation for evaluating suitable microbial platforms for lignin valorization and genetic reservoirs to source unique metabolic capabilities.
Introduction
Leveraging microbial metabolism for the bioconversion of complex chemical mixtures to performance-advantaged products is a recognized strategy for valorizing lignin.1–9 Catalytic lignin depolymerization methods often generate mixtures comprising residual oligomeric lignin and bio-available aromatic and aliphatic compounds.10–12 Selection of microbial hosts able to effectively convert this diverse, carbon-rich feedstock to target products is necessary to realize lignin valorization in a process-relevant context. Important characteristics of microbial hosts for bioconversion of lignin-rich streams include native metabolic pathways and enzymatic machinery to uptake and catabolize the broad range of lignin-derived chemical constituents, mechanisms to tolerate stress from aromatic and non-aromatic compounds, genetic tractability to engineer improved substrate utilization and product formation, and previous or potential domestication of strains for use in biorefineries.1,7,13–16 To take advantage of novel catabolic and tolerance pathways, probing diverse genera as potential platform strains is vital.Multiple putative microbial hosts have been identified and evaluated in self-consistent manners.17–20 Among the strains studied previously, Pseudomonas putida KT2440, Amycolatopsis sp. 39116, Rhodococcus jostii RHA1, Acinetobacter baylyi ADP1, and Corynebacterium glutamicum 534 were recognized for their catabolism of a large fraction of lignin-derived chemical constituents, tolerance to high concentrations of lignin feedstocks, and potential modification of high-molecular-mass (HMM) lignin.17–20 In particular, P. putida KT2440 has been well-studied as a chassis strain due to its rapid growth, comprehensive catabolic potential for varied substrates, native machinery for stress tolerance, genetic tractability, and ability to accumulate target products at high titers.21–24
As the field progresses, several other microbial strains have emerged as potential hosts that merit comparison for biocatalytic lignin valorization. Highlighted for metabolism of diverse aromatic compounds, these microbial host candidates include Sphingobium lignivorans,25,26Novosphingobium aromaticivorans,27Rhodococcus opacus PD630,28 and Rhodosporidium toruloides NBRC0880.29 In particular, S. lignivorans SYK-6 and N. aromaticivorans strains have been well-studied for catabolism of lignin-relevant dimers and their usage of syringyl (S)-type, guaiacyl (G)-type, and p-hydroxyphenyl (H)-type aromatic compounds.25,30,31 Additionally, R. opacus and R. toruloides have gained attention for their utilization of lignin-related compounds (LRCs) and production of lipid products at high yields.28,29,32 All of these microbial species can also be engineered to funnel LRCs to valuable products.33–37 In-depth characterizations of these microbes through systems biology and transposon insertion sequencing studies have furthered the understanding of the native enzymes involved in aromatic compound catabolism and metabolic reactions that support cellular growth and energy demands.30,31,38–43
In this work, we assessed the capacity of seven promising microorganisms to catabolize, tolerate, and modify components of lignin-enriched streams to evaluate their potential as hosts or genetic reservoirs for lignin valorization. We first evaluated different minimal media to establish a single medium that could support the growth of all seven microbes on LRCs. Next, we compared the metabolic capabilities of the strains on both model lignin stream compounds and a representative lignin-rich stream, corn-stover-derived alkaline pretreated liquor (APL). With several analytical techniques, we found that, apart from R. opacus PD630, which did not substantially utilize the APL components, the percent change in lignin was comparable between strains, but the rate and specificity of monomeric carbon utilization differed. Additionally, limited structural changes to the lignin substrate were measured with two-dimensional nuclear magnetic resonance (NMR) spectroscopic analysis. Overall, this work provides a direct comparison of the catabolic capabilities of several notable microbes for growth and bioconversion of lignin-rich streams. The findings of this work aim to provide a comparative analysis of the proposed hosts for lignin bioconversion to performance-advantaged bioproducts and recognize the potential use of different strains as genetic resources for unique metabolic capabilities.
Results
Identification of suitable minimal medium for comparing catabolic capabilities of strains
The first step in evaluating the cellular fitness and catabolic capacity of various microbial species was to determine a common growth medium. Seven wild-type strains were compared in this work including six bacteria, N. aromaticivorans F199, N. aromaticivorans JMN2, P. putida KT2440, R. opacus PD630, S. lignivorans B1D3A, and S. lignivorans SYK-6, and one yeast, R. toruloides NBRC0880, hereafter referred to, respectively, as F199, JMN2, KT2440, PD630, B1D3A, SYK-6, and NBRC0880. Cultivation of microbes requires essential nutrients to support growth, but the optimal composition and ratios of key nutrients in minimal media can differ between species. Growth outcomes for the seven strains were therefore assessed in six different minimal media formulations to identify a common recipe that supports, on average, the most optimal growth across all the strains tested (Fig. 1). A shared growth medium may enable synthetic co-cultures or consortia in future work. | ||
| Fig. 1 Compatibility of minimal media to support growth on mock lignin stream. Strains were grown in several base media compositions that contained either 10% or 25% mock APL as a carbon and energy source, in which APL comprises a mixture of aliphatic acids (lactate, acetate, and glycolate) and aromatic acids (p-coumarate, ferulate, and vanillate). Maximum absolute growth rates and lag times were calculated using Gompertz fits of the growth dynamics illustrated in Fig. S1 and provided in ESI Excel File 1.† If no detection of growth occurred after 75 h, the strains were considered to not grow in that medium and mock-APL concentration. The data are the means of the maximum absolute growth rate or lag time measurements determined from three biological replicates and error bars denote the standard deviation of the mean values. Minimal media typically reported for growth of each strain are denoted with triangle symbols. Calculations for the averaged performance score are depicted in ESI Excel File 1.† | ||
The minimal media recipes examined included MM457, M9, RM, SD, and Wx that, respectively, have been used to grow JMN2,31 KT2440,17 PD630,44 NBRC0880,29 and SYK-6![[thin space (1/6-em)]](https://www.rsc.org/images/entities/char_2009.gif) 45 (Table S1†). Additionally, K3 medium was included as it was previously utilized for co-cultures of Saccharomyces cerevisiae and Escherichia coli.46 To identify a medium that supports growth on lignin streams, a “mock APL” chemical mixture was utilized as the carbon and energy source, as described previously.47 This mock-APL mixture was intended to contain the most abundant aromatic and aliphatic compounds present in corn stover APL generated at 130 °C with 250 mg NaOH per g dry biomass.18,47,48 The composition of 100% mock-APL mixture was 30 mM p-coumarate, 20 mM ferulate, 6 mM vanillate, 44 mM acetate, 63 mM lactate, and 60 mM glycolate. To account for potential toxicity from high concentrations of aromatic or aliphatic acids, the 100% mock-APL mixture was diluted in each minimal medium (v/v) to create 10% and 25% mock APL. B1D3A did not grow on 25% mock APL in any media type after 75 h, indicating that higher concentrations of mock APL would likely be toxic to the growth of this strain (Fig. 1).
45 (Table S1†). Additionally, K3 medium was included as it was previously utilized for co-cultures of Saccharomyces cerevisiae and Escherichia coli.46 To identify a medium that supports growth on lignin streams, a “mock APL” chemical mixture was utilized as the carbon and energy source, as described previously.47 This mock-APL mixture was intended to contain the most abundant aromatic and aliphatic compounds present in corn stover APL generated at 130 °C with 250 mg NaOH per g dry biomass.18,47,48 The composition of 100% mock-APL mixture was 30 mM p-coumarate, 20 mM ferulate, 6 mM vanillate, 44 mM acetate, 63 mM lactate, and 60 mM glycolate. To account for potential toxicity from high concentrations of aromatic or aliphatic acids, the 100% mock-APL mixture was diluted in each minimal medium (v/v) to create 10% and 25% mock APL. B1D3A did not grow on 25% mock APL in any media type after 75 h, indicating that higher concentrations of mock APL would likely be toxic to the growth of this strain (Fig. 1).
Only KT2440 was able to grow on all media containing 10% or 25% mock APL, indicating a robust fitness for varied nutritional conditions (Fig. 1). NBRC0880 and PD630 grew under all conditions except for, respectively, 25% mock APL in Wx minimal medium and 25% mock APL in SD minimal medium. However, S. lignivorans and N. aromaticivorans strains were more sensitive to media type and either did not grow or grew poorly in SD or K3 media at both mixture concentrations, with 1.5- to 4-fold increases in lag time and up to 4.5-fold decreases in maximum absolute growth rate (hereafter referred to simply as ‘growth rate’), compared to that on their typical growth medium (Fig. 1). Both N. aromaticivorans strains (F199 and JMN2) also did not grow within 75 h on 25% mock APL in M9 medium (Fig. 1). Interestingly, SD, K3, and M9 have the highest concentration of salt ions, suggesting that these media might interfere with the osmotic balance of SYK-6, B1D3A, JMN2, and F199 (Table S2; Fig. S2†).
Although MM457 and RM minimal media formulations could be used to support growth of all seven strains, KT2440 had up to a 3-fold reduction in growth rate on MM457 relative to M9 minimal medium, potentially due to the low iron and ammonium concentrations in this medium relative to the others (Fig. 1; Fig. S2; Table S2†). RM minimal medium, however, supported all the strains at comparable or, in some cases, better lag times and growth rates than their typical growth medium (Fig. 1). Further, a medium performance score was calculated for each media type, in which a higher score represents better growth performance, assessed as higher growth rates and shorter lag times across all strains tested, and in which higher relative growth rate and lower relative lag time values were weighted equally during analysis. Details regarding these calculations can be found in the Materials and Methods section and all calculations are available in ESI Excel File 1.† The medium performance scores confirmed that RM minimal medium supported the best growth outcomes for all strains, whether using a 10% mock APL mixture or a 25% mock APL solution (Fig. 1). Accordingly, RM minimal medium was chosen for all subsequent experiments.
Growth on and tolerance to chemical constituents of lignin streams
To evaluate the innate cellular tolerance and the catabolic capability of the candidate hosts to utilize lignin streams, each strain was grown on a mock-APL mixture and individually on nine key aromatic and aliphatic compounds as sole carbon and energy sources at increasing concentrations. All strains were grown first in a nutrient rich medium [Luria–Bertani (LB) medium] to late exponential phase before pelleting, washing, and transferring to RM minimal medium containing the representative substrate. Growth rate and lag time calculated after transfer to the experimental media were used as criteria for evaluating the ability of each microbial strain to convert carbon sources to biomass and energy and to tolerate common components of lignin streams (Fig. 2).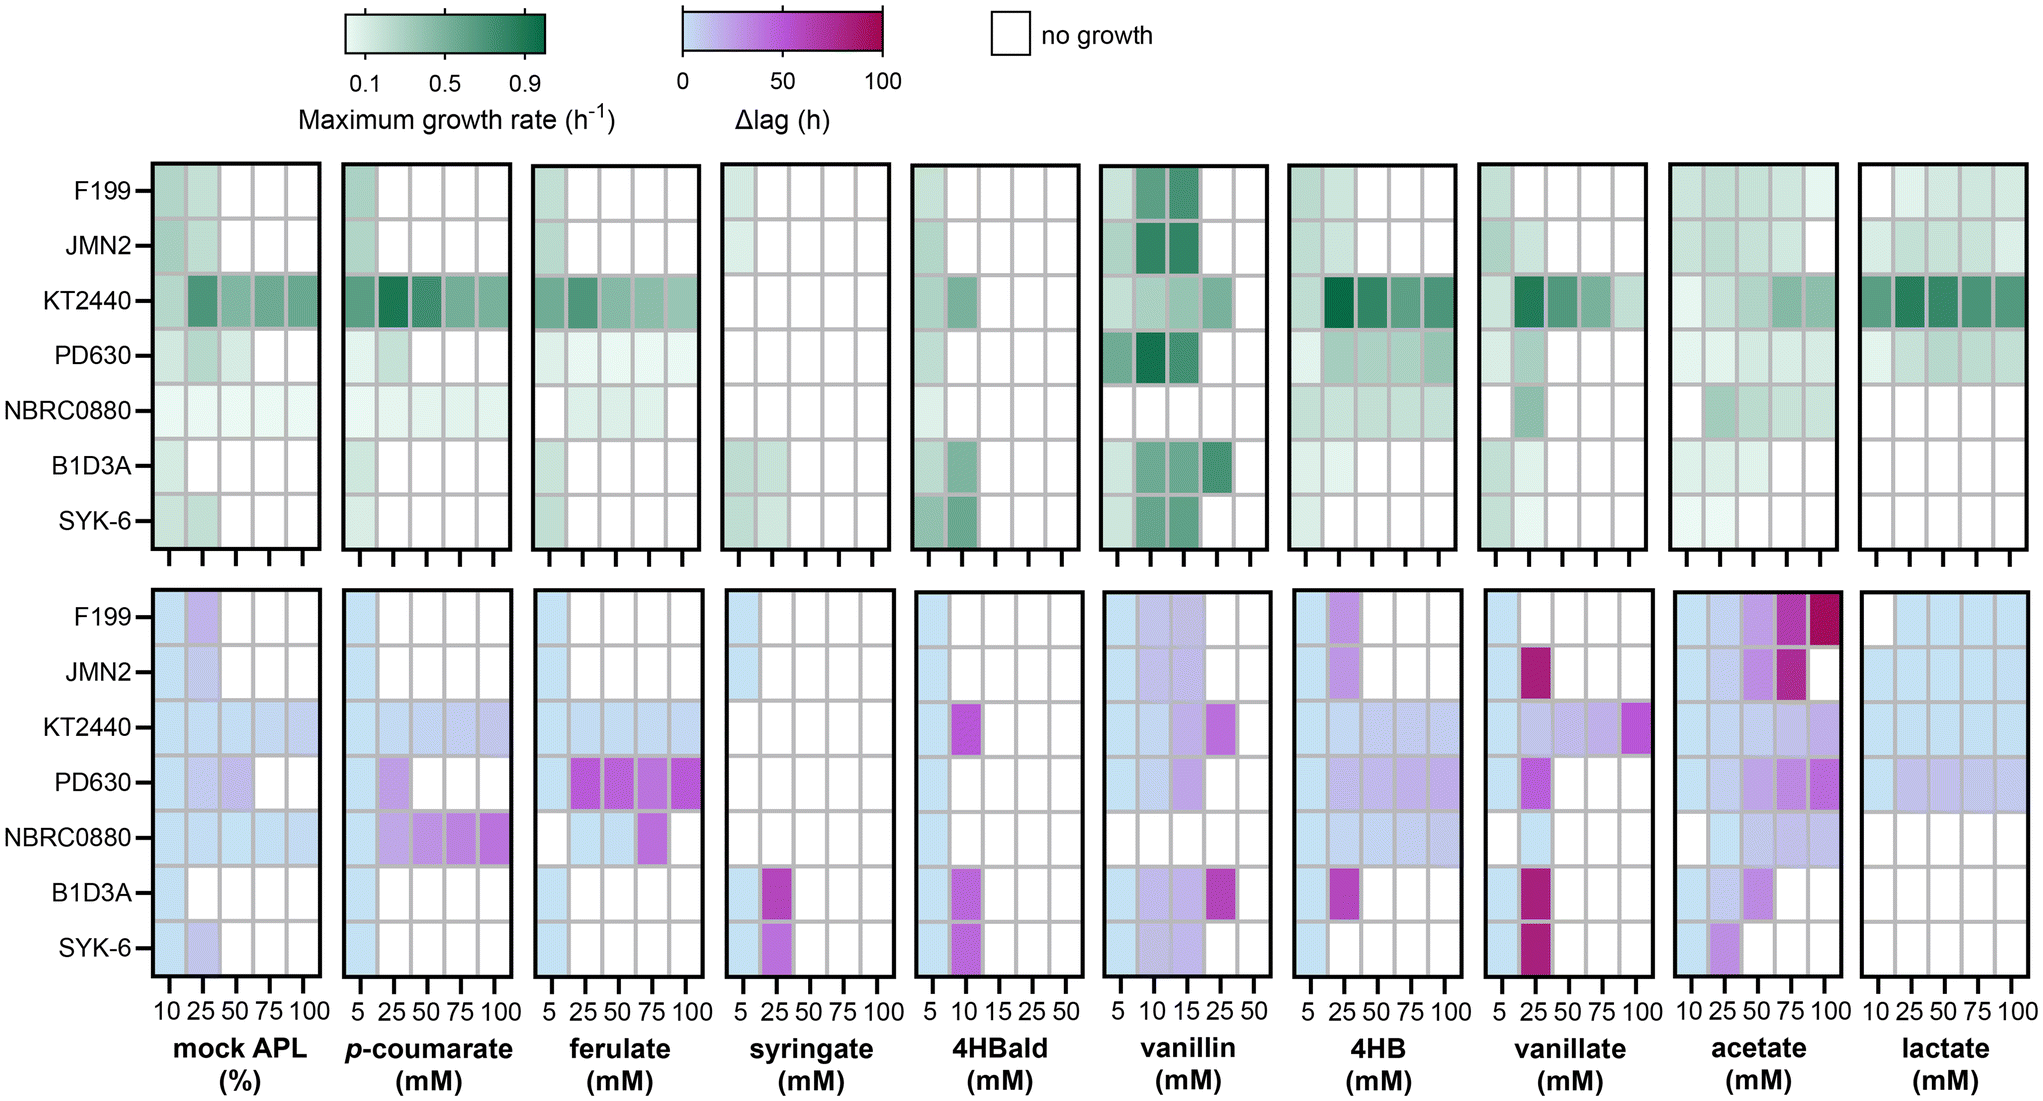 | ||
| Fig. 2 Growth capacity and tolerance of microbial strains to chemical constituents of lignin streams. Maximum absolute growth rates and lag times were calculated using Gompertz fits of the measured change in optical density over time, which are provided in ESI Excel File 1.† The change in lag (Δlag) was calculated relative to growth on the lowest concentration of each substrate that each strain grew on. Bacterial growth in 96-well plates containing 200 μL of growth medium was monitored on a BioscreenC Pro instrument. For NBRC0880, which did not grow consistently in the BioscreenC Pro, growth in 48-well plates containing 1 mL of growth medium was monitored using a BioLector® automated growth curve analysis system. Strains were grown in RM minimal media supplemented with increasing concentrations of mock APL, aromatic acids, aldehydes, or aliphatic acids as sole carbon sources ranging from 5 mM to 100 mM. The starting concentration for acetate and lactate was 10 mM to provide enough carbon to support cellular growth. If no measurement of growth occurred after 120 h, the strains were considered to not grow on that substrate concentration. To support growth on p-coumarate, 4-hydroxybenzoate (4HB), 4-hydroxybenzaldehyde (4HBald), acetate, and lactate for both Sphingobium sp. strains, 130 μM methionine was supplemented in the media, due to a previously reported methionine auxotrophy when grown on a substrate lacking a methoxy groups.49 The data represent the mean of the calculated growth rates and Δlag times determined from three replicates. | ||
To solubilize and neutralize the model acidic compounds, media was titrated with NaOH, and as such, higher concentrations of the tested compounds correlate with a higher Na+ concentration in the growth medium. To delineate the impact of Na+ on the growth phenotypes, each strain was grown on a favorable carbon source without or with the addition of NaCl ranging from 75 mM to 500 mM (Fig. S3 and S4†). RM minimal medium does not initially contain Na+ in its recipe (Fig. S2b†)—an advantage of utilizing RM minimal medium when neutralizing with NaOH. When the media was supplemented with 500 mM NaCl, all seven strains grew with varying degrees of inhibition to growth rates and lags (Fig. S3 and S4†). Relative to no addition of NaCl, KT2440, PD630, and NBRC0880 had the highest inhibition to growth rate (50% decreased) whereas F199 and JMN2 had the largest increase in lag (up to 30 h) due to the addition of 500 mM NaCl (Fig. S3 and S4†). Nevertheless, although high concentrations of Na+ impacted growth, Na+ did not prevent growth for any of the strains at the concentrations relevant to the solubilization of acidic compounds.
Although growth on acidic compounds could be examined at 100 mM, the maximum concentration for vanillin and 4-hydroxybenzaldehyde (4HBald) solubilized in dimethylsulfoxide (DMSO) was 50 mM due to solubility constraints. For both aldehydes, DMSO was maintained at 1% (v/v) in the media, which was at a concentration that did not impact growth for any of the strains (Fig. S3 and S4†). Generally, vanillin was less toxic than 4HBald as was demonstrated by six out of seven strains growing on 15 mM vanillin whereas 10 mM was the maximum concentration any of the strains grew on 4HBald (Fig. 2). However, NBRC0880 did not grow on vanillin at any concentration, indicating vanillin is not a favorable sole carbon source for this strain (Fig. 2). Overall, only KT2440 and B1D3A grew on 25 mM vanillin and only KT2440, B1D3A, and SYK-6 grew on 10 mM 4HBald (Fig. 2), highlighting the general toxicity of aldehydes to microbial growth.
The growth trends for strains from the same genus and species, S. lignivorans SYK-6 and B1D3A and N. aromaticivorans JMN2 and F199, were similar across the tested substrates with a few key differences: SYK-6 tolerated a higher concentration of mock APL than B1D3A, but B1D3A grew on higher concentrations of 4-hydroxybenzoate (4HB), vanillin, and acetate than SYK-6. JMN2 had a higher growth rate than F199 on lactate, but F199 grew on 100 mM acetate whereas JMN2 did not (Fig. 2). Larger differences in growth phenotype were observed when comparing across genera.
For all the microbial strains fed mock APL, only KT2440 and NBRC0880 grew on 100% of the mock APL whereas the rest of the strains only tolerated 50% mock APL or less (Fig. 2). Further, there was only about a 5 h increase in lag time between the 10% and 100% mock APL concentrations for KT2440 and NBRC0880, indicating high inherent tolerance to the aliphatic and aromatic compound mixture (Fig. 2). During growth on the individual substrates, KT2440 exhibited the highest tolerance (growth maintained up to 100 mM of all the acidic compounds tested, excluding syringate), shortest change in lag time (averaging Δ14 h between 5 mM and 100 mM), and fastest growth rates (on average around 0.5 h−1) in both 200 μL and 1 mL growth conditions as compared to the other strains (Fig. 2; Fig. S5†). Although the lag in growth remained consistent between growth in 1 mL and 200 μL for KT2440, the growth rates differed, likely due to aeration differences between culture conditions (Fig. S5†). Regardless of culture volume, KT2440 grew on all the acidic compounds up to 100 mM, excluding syringate (Fig. S5†).
Broad substrate catabolism and tolerance was also observed for PD630, which grew on up to 100 mM of the aliphatic acids, 4HB, and ferulate and up to 25 mM of vanillate and p-coumarate (Fig. 2). As substrate concentrations increased, PD630 exhibited up to 50 h increases in lag times, indicating a sensitivity to high concentrations of aromatic and aliphatic acids solubilized with NaOH (Fig. 2). In contrast, as the substrate concentration increased, NBRC0880 maintained consistent growth rates (with a max standard deviation of 0.01 h−1 between 5 and 100 mM) and lag times (typically ranging between 1–30 h) on mock APL, H-type aromatic compounds, and acetate (Fig. 2; ESI Excel File 1†). However, NBRC0880 had 40–90 h lag times on G-type aromatic compounds, grew only on 25 mM vanillate and 25 to 75 mM ferulate, and did not grow on vanillin (Fig. 2). Notably, vanillate was especially toxic for all the strains, as only KT2440 grew at and above 50 mM and at 25 mM the other bacterial strains had about an 80 h increase in lag time compared to at 5 mM (Fig. 2).
Syringate did not support the growth of KT2440, PD630, or NBRC0880 as a sole carbon and energy source, but S. lignivorans and N. aromaticivorans strains were able to grow without an additional substrate (Fig. 2). The two S. lignivorans strains (B1D3A and SYK-6) performed better than the N. aromaticivorans strains (F199 and JMN2) on syringate, growing at 25 mM and exhibiting 2-fold faster growth rates at 5 mM than JMN2 or F199 (Fig. 2). In contrast, both the S. lignivorans and N. aromaticivorans strains did not grow at or above 25 mM on p-coumarate or ferulate, indicating that they have a low native tolerance to the hydroxycinnamic acids, solubilized with NaOH, that are the most prominent monomeric aromatic components in corn stover APL.17,18 Overall, KT2440, followed by PD630 and NBRC0880, showed the broadest substrate tolerance and catabolic capacity demonstrated by growth on the chemical mixture, G-type compounds, H-type compounds, and aliphatic acids tested, but the two S. lignivorans strains (B1D3A and SYK-6), followed by the two N. aromaticivorans strains (F199 and JMN2), performed the best on the S-type compound.
Strain performance on a lignin-rich stream
Alkaline pretreatment of lignocellulosic plant material produces a soluble lignin-rich liquor, or APL, as well as a solid fraction consisting of polysaccharides and residual insoluble lignin that can undergo additional processing.48,50 Here, corn stover was treated with 70 mg NaOH per g of dry biomass at 130 °C, as previously described,17 to produce APL that contains HMM lignin, monomeric LRCs, and aliphatic acids. Although a lower NaOH loading than the harsher conditions used as a basis for the mock-APL mixture will generate fewer free aromatic and aliphatic acids, this lower NaOH concentration was chosen to mitigate the toxicity contributed by high Na+ concentrations (Fig. S3 and S4†). Before inoculation of the microbial strains, the APL was neutralized, filter sterilized, and diluted to 25% (v/v) in RM minimal medium. The main components of the 25% APL feedstock were categorized by Klason lignin analysis to be lignin-derived species (19.7%), xylan (6.2%), arabinan (2.9%), galactan (1.9%), glucan (1.6%), and acetate (1.4%) (Table S3†). A large portion of the media was characterized as ash (55.3%) due to the salts added during pretreatment, neutralization, and dilution with RM minimal media. The quantified free carbon in the 25% APL medium consisted of the LRCs p-coumarate (1.33 mM), ferulate (0.15 mM), 4-hydroxybenzaldehyde (0.13 mM), vanillin (0.06 mM), and acetosyringone (0.04 mM), and the primarily carbohydrate-derived species acetate (11.60 mM), formate (2.03 mM), lactate (0.54 mM), and oxalate (0.37 mM). The presence of aromatic compounds with methoxy groups, such as ferulate, can act as methyl sources for S. lignivorans strains, and accordingly, supplementation with methionine was not required for SYK-6 and B1D3A to grow on APL and utilize H-type aromatic compounds.49,51All seven strains grew, as measured by an increase in optical density, on 25% APL in RM minimal medium as a sole carbon source (Fig. 3). Similar to growth trends on mock APL, KT2440 grew the fastest of the microbial strains on 25% APL, reaching stationary phase within 6 h. The next three fastest were SYK-6, PD630, and NBRC0880, which entered stationary phase within 12 h. For B1D3A and JMN2, stationary phase was reached by 24 h, whereas the slowest growth was found for F199, which required 48 h to reach a maximum OD600 value (Fig. 3). After reaching stationary phase, the microbial biomass generally remained constant without a decline in OD600, except for KT2440, which lost about 50% of its max OD600 at 24 h before mostly recovering by 96 h. The highest maximum OD600 values were observed for NBRC0880 and the two N. aromaticivorans strains (F199 and JMN2). After 120 h of inoculation, the cells were pelleted, and the cell-free supernatant was harvested for analysis of the APL.
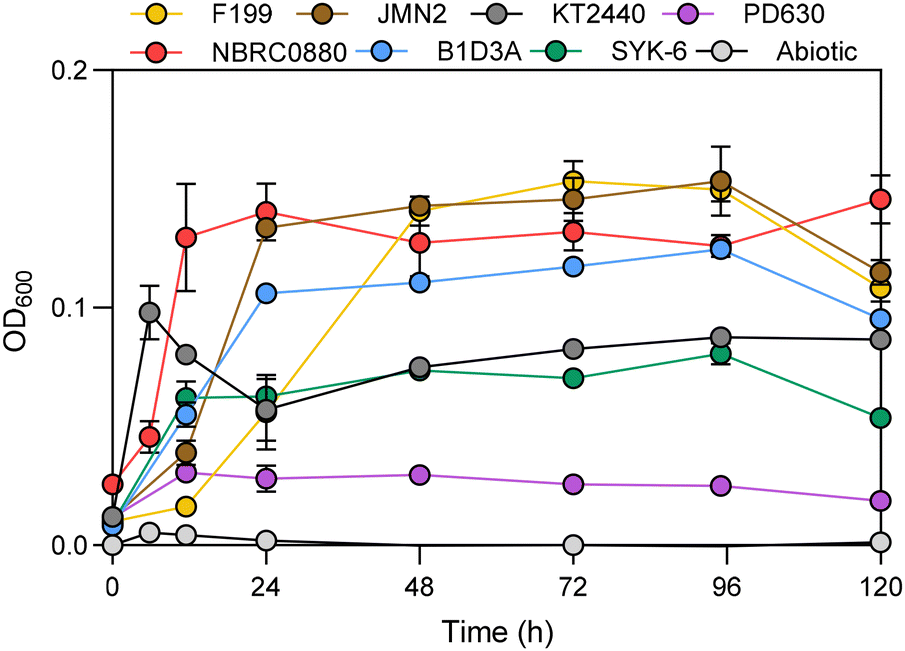 | ||
| Fig. 3 Growth dynamics on 25% APL. OD600 measurements over 120 h of microbial growth on 25% APL and RM minimal media. Data represents the mean ± the standard deviation of three biological replicates. Abiotic controls, in triplicate, without microbial inoculation are illustrated in grey. | ||
To quantify the decrease in lignin content after microbial treatment, Klason lignin analysis of both acid-soluble and acid-insoluble fractions was conducted on the cell-free lyophilized APL and the percent change in lignin content, including both HMM and monomeric aromatic compounds, was calculated as described previously.17,52 Before microbial treatment, the majority of the lignin content (about 91%) was HMM or uncharacterized lignin components, whereas the quantified free H-type, G-type, and S-type aromatic compounds consisted of only 9.08 ± 0.22 g/g % of the total lignin content (Fig. 4a). After 120 h of microbial treatment, the maximum decrease in lignin content was 12.9 ± 1.3% in B1D3A (Fig. 4b; Fig. S6†). However, all the other strains, except PD630, reached comparable decreases in lignin content within the biological and instrumental error (Fig. 4b). Notably, PD630 did not significantly alter the total lignin content, the measured aliphatic and aromatic compounds, or the pH of the media, as compared to the abiotic control (Fig. 4b and c; Fig. S6–S8†). In contrast, the other six strains depleted the measured compounds by 85 to 96 mol C/mol C % and the pH of the media increased from 7.1 to ∼8.0 after 120 h (Fig. 4c; Fig. S7 and S8†). The highest significant percent decrease (mol C/mol C) in quantified aromatic and aliphatic acids was found for the two N. aromaticivorans strains, KT2440, and B1D3A (Fig. 4c and d). Although the overall depletion of free compounds, in mol C, was close to 100% after 120 h, there were key differences in the rate of substrate depletion and types of substrates used.
 | ||
| Fig. 4 Microbial strain performance with 25% APL. (A) The composition of measured aromatic compounds in the lignin fraction of the APL for the abiotic controls after 120 h of incubation. (B) Percent decrease in lignin content representing both microbial lignin depolymerization and catabolism after 120 h of incubation with the seven strains or no inoculum (abiotic control). The dotted line indicates the percentage of measured aromatic compounds in the total lignin fraction of APL for the abiotic control. The measured lignin content in g L−1 from Klason analysis is depicted in Fig. S6.† (C) The percent decrease in the sum of all measurable residual carbon, both aromatic and aliphatic compounds, after 120 h of microbial treatment. The total mM of carbon remaining for each condition is illustrated in Fig. S7.† For A, B, and C, the bar graphs show the mean ± the standard deviation of three replicates. For B and C, statistically significant differences (p < 0.05) are denoted by a change in letter; significance was determined by one-way ANOVA followed by Tukey HSD post hoc tests. Exact p-values can be found in ESI Excel File 1.† (D) The conversion of the individual lignin-derived and carbohydrate-derived components of APL at different timepoints of growth relative to the initial content in the media (% remaining). The data represent the mean of three biological replicates. The measured concentrations, in mM, of all compounds for each strain and timepoint (6 h, 12 h, 24 h, 48 h, 72 h, and 120 h) are provided in ESI Excel File 1.† Compound names for 4-hydroxybenzoate and 4-hydroxybenzaldehyde were abbreviated as 4HB and 4HBald respectively. The compounds 4HB, vanillate, syringate, and acetovanillone were present in the initial media but were below the limit of quantification (LOQ). Due to evaporation over time, some compounds were able to be measured in the abiotic control and in some of the microbial treatments after 120 h. For 4HB, vanillate, syringate, and acetovanillone, if the difference between the detection of a compound in a microbial treatment versus the abiotic control at a specific timepoint was less than 0.01, the condition was left grey. | ||
As expected from the rapid growth on APL, KT2440 utilized all the measured compounds in APL, except oxalate and acetosyringone, within 6 h, which was, compared to the other strains, the most amount of carbon at the fastest rate (Fig. 4d; Fig. S9; ESI Excel File 1†). None of the strains utilized oxalate and the concentration increased over time (Fig. 4d). Both S. lignivorans strains depleted acetosyringone within 12 h (Fig. 4d), indicating it was, as expected, a viable carbon source for S. lignivorans.53 Although JMN2 and F199 did not completely deplete acetosyringone from the extracellular medium, the concentration after 120 h was 50% lower than in the abiotic control, indicating that these strains can convert this carbon source to some extent.
Comparable to the growth trends when acetate or lactate were sole carbon and energy source (Fig. 2), B1D3A depleted acetate 96 h before SYK-6 and neither S. lignivorans strain consumed lactate in the APL mixture (Fig. 4d). In fact, only KT2440 completely depleted lactate after 120 h. Reflecting the slower time to stationary phase, F199 depleted APL components 24–48 h slower than the other strains but, similarly to JMN2 and the S. lignivorans strains, the aromatic compounds were depleted before the aliphatic compounds (Fig. 4d; Fig. S9†). Of the tested microbial strains, NBRC0880 was the most discriminating in its substrate usage. After 12 h, NBRC0880 completely depleted five carbon sources but, even after 120 h, the strain did not utilize lactate, formate, oxalate, or acetosyringone (Fig. 4d). Some compounds, including acetovanillone, vanillate, and 4HB, appeared at 12 or 24 h in the inoculations with the two Novosphingobium strains (F199 and JMN2) but not in the abiotic control, implying potential modification of unmeasured aromatic-containing substrates in the APL, and/or secretion of these metabolites during the catabolism of upstream aromatic compounds (Fig. 4d).
Although the strains significantly utilized the free aromatic and aliphatic acids, the majority of APL consists of HMM components (Fig. 5). After 120 h of treatment, gel-permeation chromatography further illustrated a substantial decrease in low-molecular-mass (LMM) compounds, but also indicated changes in HMM peaks compared to the abiotic control for all the strains except PD630 and NBRC0880 (Fig. 5). The LMM peak closely matched the spectra of p-coumarate (Fig. S10†), which was also the aromatic compound found at the highest concentration in the APL (Fig. 4d). Unique from the other strains, both N. aromaticivorans strains also had a new LMM peak appear in the spectra (Fig. 5). However, only B1D3A significantly depleted the lignin content (p = 0.012) compared to the total quantified free aromatic compounds (ESI Excel File 1†), suggesting that only the monomer fraction of APL was appreciably depleted by most strains. To assess if the strains acted on the functional linkages in HMM lignin, NMR analysis was applied to the APL after 120 h of microbial treatment.
 | ||
| Fig. 5 Molecular mass distribution of 25% APL after microbial treatment. The abiotic control replicate used as reference is illustrated by the dashed line. The additional two replicates for the abiotic control are shown in shades of grey. Replicates (rep.) for microbial treatment are depicted in the different shades of blue. Spectra are normalized to the maximum response per spectra and shifted to align with the abiotic control reference peak at a molecular mass 575. | ||
Changes to aromatic components after microbial treatment
NMR spectroscopy was used to examine the impact of microbial treatment on the lignin and hydroxycinnamate components of the APL. For each sample, the cell-free APL material after 120 h of biological treatment or the no inoculation control was freeze-dried and then dissolved in 4:1 DMSO-d6/pyridine-d5 and 2D 1H–13C (HSQC, heteronuclear single-quantum coherence) spectra acquired (Fig. 6a–c). As is typical for lignin spectra, the syringyl/guaiacyl nature of the lignin was apparent, as was the array of typical lignin dimeric moieties, denoted by their characteristic interunit linkages, β-aryl ether (β-O-4) units A, phenylcoumaran (β-5) units B, and resinol (β-β) units C. As has been noted previously, but is striking in corn stover, much of the early lignification dimerization is via the sinapyl p-coumarate (S-pCA) conjugate from which its prominent β-β-coupled quinone methide intermediate cannot form the usual resinol C because the γ-OH is acylated by pCA; the main product diagnostic of such monolignol acylation is the tetrahydrofuran C′. Also, apparent from comparison with isolated or whole-cell-wall lignins in corn stover is that the p-coumarate and ferulate are present in the APL as their free acids, i.e., the esters have efficiently cleaved under the alkaline conditions. Tetrahydrofuran units C′ had also been efficiently hydrolyzed as the moiety was found as the di-γ-OH variant shown rather than the ester that is present in the native lignin; saponification of such units has been documented previously.54 The flavone tricin (T) is also well-established as (starting) end-units on the lignin polymer in monocots, including corn stover.55–57 The T2′/6′ correlation appears to be intact but the T8 and perhaps T6 correlation peaks have changed/moved. The fate of tricin units under these APL conditions is currently under investigation.
 | ||
| Fig. 6 Structural changes in hydroxycinnamates and lignin units from 2D-HSQC-NMR spectroscopic analysis. (A, B, and C) APL spectra with main correlation peaks color-coded to match the structures shown. Note that the lighter (40%) contours are from a 4-fold intensity expansion to make it easier to see minor peaks. (D–J) The difference spectra are from 2D spectral subtraction with nulling of the methoxy signal; red peaks are negative, meaning that they have been depleted relative to the abiotic control shown in C; cyan peaks are positive meaning that they are relatively elevated (or new) compared to the abiotic control. Note that if a peak has equal red and cyan components because of small shifts in the peaks [as in the p-coumarate (pCA) peaks] in difference spectrum I, for example it signifies that the component essentially remains un-metabolized following treatment. | ||
Although it is difficult to match correlation intensities across spectra, both KT2440 (Fig. 6a) and SYK-6 (Fig. 6b) depleted the p-coumarate compared to the abiotic control (Fig. 6c). The changes to the APL fraction after treatment with the microbes is most readily seen via the difference spectra between microbial treatment and the abiotic control (Fig. 6d–j). Volume-integration of the contours further delineated the major changes, showing the remaining p-coumarate at 13% and 20% of the original level, respectively, with all microbes except PD630 showing similar reductions (Fig. 6d–j). The only other notable difference between microbial treatment and the abiotic control was that SYK-6 and B1D3A exhibited mild depletions of β-ether units (Fig. 6e and f), presumably from metabolism of small β-ether-containing oligomers in the APL. The other strains did not appear to display a similar metabolism of such units despite the potential for β-etherase activity (Fig. 6d–j).25,58,59 Furthermore, there was no measurable difference in any of the other lignin units. However, additional non-lignin-related peaks in the APL medium showed a decrease in signal intensity especially for the S. lignivorans strains, the N. aromaticivorans strains, and NBRC0880 (Fig. 6d–j), indicating that non-lignin components were modified and potentially catabolized by these strains.
Discussion and conclusions
The efficiency of microbial catabolism of the components present in lignin streams directly impacts the economic feasibility of lignin bioconversion to target bioproducts.9,60 A vital component to efficient bioconversion is selection of an effective microbial host capable of tolerating and catabolizing components of lignin streams. Here, we evaluated seven strains (N. aromaticivorans F199, N. aromaticivorans JMN2, P. putida KT2440, R. opacus PD630, R. toruloides NBRC0880, S. lignivorans B1D3A, and S. lignivorans SYK-6) that have been reported previously as potential platform strains due to their ability to grow on lignin streams, catabolize diverse LRCs, be genetically manipulated, and produce valuable products from aromatic compounds.21–23,25,25,27–31,33–36,61The broadest tolerance, as measured by growth performance metrics in batch culture using solubilized aromatic and aliphatic compounds, was observed for KT2440, PD630, and NBRC0880 (Fig. 1 and 2). Both P. putida and R. toruloides strains have been highlighted previously for their toxicity tolerance to a broad range of compounds.47,62–65 Here, this native tolerance was also illustrated, in general, by small changes in lag time (around a 15 h increase) between 5 mM and 100 mM of individual aromatic and aliphatic acids (Fig. 2). Aldehydes, important components of diverse lignin streams,17,66–68 were found to be especially toxic to microbial growth and only KT2440 and B1D3A grew on 10 mM 4HBald and 25 mM vanillin (Fig. 2). It is possible that different preculture strategies, such as an initial growth in minimal media instead of rich media, could improve growth outcomes and tolerance for all the microbial strains. Additionally, although the strains grew when exposed to 500 mM NaCl (Fig. S3 and S4†), the growth performance was inhibited on a favorable carbon source at high Na+ concentrations and thus there could be a combinatorial toxicity effect from Na+ and acidic compounds that prevented growth for some strains. Production strains could also have reduced tolerance compared to native strains, such as engineered N. aromaticivorans grown in standard mineral base medium that had a greater inhibition to Na+ supplementation than observed here.37 For all strains examined, additional strain-based optimization could be employed to improve host strain performance such as altering the neutralization reagents (e.g., NH4OH instead of NaOH),37 optimizing the growth medium, increasing the aeration through growth in bioreactors, as well as feeding strategies to slowly introduce aromatic or aliphatic compounds.
To accommodate all the strains in this work, a moderate concentration of corn stover APL (25% v/v) was chosen because growth of microbial strains was commonly impeded on NaOH-solubilized aromatic acid concentrations at or above 25 mM (Fig. 2). All strains, except PD630, grew in the corn stover APL medium (Fig. 3), indicating the presence of a sufficient amount of available carbon sources to support growth. Despite catabolism and tolerance to 50% mock APL (Fig. 2), PD630 did not significantly utilize components of the corn stover APL (Fig. 4d). This growth limitation could be due to an unmeasured inhibitory component in the corn stover APL. Since PD630 has been grown on other lignin streams with success, including kraft lignin and an alkali/alkali-peroxide-pretreated corn stover waste streams,32,44 the inhibitory components of this corn stover APL may not be present in other lignin streams. Supplementation of lignin streams with alternative carbon sources such as glucose can also be used to mitigate growth limitations of host strains.17,32,69,70 Efficient product formation will ultimately rely on feeding high concentrations of LRCs, which will subsequently increase inhibitory components, further emphasizing the need for broad detoxification and/or tolerance mechanisms in the host strain.
Another key factor in host selection is innate catabolic capabilities to rapidly utilize the heterogeneous compounds found in lignin streams, and thus minimize downstream needs to genetically insert novel metabolic pathways. In this study, all strains except PD630 consumed the two most abundant aromatic species, p-coumarate and ferulate, and the most abundant primarily carbohydrate-derived species, acetate, in the APL (Fig. 4d). The broadest free compound usage was found for the two N. aromaticivorans strains (F199 and JMN2), KT2440, and B1D3A, which all utilized between 93 and 96 mol C/mol C % of the quantified aromatic and aliphatic carbon in the APL (Fig. 4c and d). Exhibiting specialist capabilities, only the S. lignivorans strains completely depleted acetosyringone (Fig. 4d), which represented a small fraction of this corn stover APL at 0.04 mM but is an important compound common in other lignin streams.11,67,71,72 Catabolic pathways for acetosyringone have been identified in SYK-653 and could represent important genetic sources for the expansion of substrate usage in other hosts. In addition, pathways for degradation of other S-type aromatic compounds, such as syringate examined here, have been described for both S. lignivorans and N. aromaticivorans.33,51,69,73–75 While KT2440, PD630, and NBRC0880 did not utilize syringate as a sole carbon source, there is the potential for co-metabolism of S-type compounds by these strains as was demonstrated for KT2440 which utilized syringate when an additional carbon source such as vanillate or glucose was present.50,51 Although an ideal host strain for bioconversion of complex feedstocks should natively utilize the highest percentage of carbon, advances in synthetic biology and adaptive laboratory evolution have simplified approaches for substrate expansion and inhibitor tolerance. Future expansion of metabolic pathways in these strains could alter their capabilities.
Metabolism of lignin stream constituents can result in the appearance of compounds either through the accumulation of an intermediate in a metabolic pathway or from modification of oligomeric substrates. Accumulation of aromatic compounds occurred in the media at 12 and 24 h during the inoculations with both N. aromaticivorans strains. For both strains, 4HB and vanillate, known intermediates in the catabolism of p-coumarate and ferulate,39 appeared in the supernatant, potentially due to secretion of these compounds during the metabolism of the hydroxycinnamates. JMN2 was the only strain to have acetovanillone appear in the supernatant, which increased up to 0.08 mM after 120 h, suggesting that it was a product from modification of an uncharacterized lignin-derived species. Concurrently, the concentration of acetosyringone decreased by 50% in the JMN2 inoculation compared to the abiotic control (Fig. 4d). In SYK-6, the acetosyringone catabolism pathway can also act on acetovanillone.53 Previously, N. aromaticivorans PDC (derived from F199) was found to not utilize acetosyringone or acetovanillone in the presence of glucose,69 but supplementation with an aromatic compound may initiate metabolism, as demonstrated when vanillate supplementation enabled syringate metabolism in KT2440.76,77 Additional examination of the acetovanillone/acetosyringone metabolism in JMN2 is warranted to assess its catabolic capacity.
Lignin is a complex aromatic polymer containing structural inter-unit linkages, characterized by the bonds formed during the radical coupling steps in lignification, such as β-O-4, β-5, β-β, β-1, and 5-5. Enzymatic cleavage of representative dimeric compounds containing these linkages has been well-characterized in S. lignivorans SYK-6 and N. aromaticivorans strains.25,30,31,78,79 However, this work commonly uses model dimeric compounds instead of more complex oligomers like those in the HMM lignin fraction of APL. NMR indicated significant metabolism of p-coumarate but little to no changes in the structural units of the lignin backbone of the oligomers present in the APL, except for a decrease in the β-ether level observed after treatment with both S. lignivorans strains. Previously, etherases from SYK-6 recombinantly expressed in E. coli were shown to cleave β-ether linkages in a synthetically constructed lignin.80 Here, we found that both SYK-6 and B1D3A could also moderately deplete these linkages in corn-stover APL. The minimal conversion of HMM species in the APL stream could therefore represent a disconnect between the enzymes capable of cleaving dimers and activity on larger oligomers, whether due to spatial separation (i.e., intracellular enzyme and extracellular substrate), steric hindrance from more complex oligomers, lack of enzyme upregulation in the presence of APL, alterations to the lignin bioavailability due to high salt content, or inhibitors of enzyme activity in complex media. Of note, extracellular enzymatic lignin deconstruction through the action of oxidases, such as laccases and peroxidases, has shown potential to deconstruct lignin.81–83 Supplementation with exogenous laccases was found to act synergistically with bacterial catabolism by deconstructing lignin and improving the growth of PD630 on kraft lignin.44 Similarly, the growth of KT2440 on corn stover lignin solids was increased when a fungal secretome was added to act on HMM lignin.84 Improvements in enzymatic deconstruction of lignin remain an area of interest, but currently many challenges remain for it to become applicable at a commercial scale.81,85 For bioconversion to occur under process-relevant conditions, systematic improvements in obtaining a higher percentage of monomeric content from lignin is crucial.1,9,86
The chemical composition of lignin streams for bioconversion is dependent on both the plant species and the chemical deconstruction method. In this work, we utilized corn stover APL as a representative lignin stream due to its precedent in previous work.17,19,20 However, alkaline pretreatment represents only one of many approaches to extract lignin from biomass, and is effective only for grasses or for the few hardwood species (polar, willow, palms) that have p-hydroxybenzoylated lignins.11,85,87,88 In particular, catalytic oxidation offers a promising strategy for improving the yield of bioavailable, water-soluble aromatic compounds from lignin.1,66,68,89 The cleavage of C–O bonds in the oxidation processes is well known and can occur at near-theoretical yields, providing 20–30 wt% monomers based on the lignin content of intact biomass.66,68,89 Beyond the monomers available from aryl-ether bond cleavage in lignin, several oxidation studies have demonstrated C–C bond cleavage in lignin that could potentially increase the yields of aromatic monomers for bioconversion.90–92 Recently, the combination of C–O and C–C bond cleavage in an oxidative process enabled a yield of 28% lignin monomers from pine that could be funneled to muconic acid by P. putida.92 In another example, optimizing the catalyst and process conditions in reductive catalytic fractionation to produce aryl-propanols instead of aryl-propanes improved production of 2-pyrone-4,6-dicarboxylic acid by N. aromaticivorans.69 As catalytic deconstruction strategies further improve the bioavailable content of lignin streams, metabolic pathways to catabolize S-type lignin and dimers will become increasingly important. Host strain tolerance to high aromatic content and to the lignin stream matrix will also become essential traits for bioconversion.
The strains tested here utilize either the ortho-cleavage pathway (KT2440, PD630, NBRC0880) or the 4,5-meta-cleavage pathway (SYK-6, B1D3A, JMN2, F199) from the central aromatic pathway intermediate, protocatechuate.23,38–40,42,51 Performance-advantaged products have been obtained from these cleavage pathways through the deletion of enzymes downstream of the metabolite intermediate of interest combined with supplementation of an alternative carbon source to support biomass demands.1,23,23,34,37,60 For additional products that cycle through central carbon metabolism, the 4,5-meta-cleavage pathway has the advantage over the ortho-cleavage pathway due to both the formation of NADPH as well as total carbon conversion to central carbon metabolites (i.e., no carbon loss to CO2). When selecting a microbial host for bioconversion, it is important to consider the feedstock, deconstruction method, product of interest, catabolic and synthesis pathways, cofactor balance, and additional traits such as the ability to natively generate desirable products in large quantities. Going forward, the comparisons presented in this study can be employed as guiding information to select and improve microbial hosts for the bioconversion of lignin.
Materials and methods
Microbial strains
The strains used in this study were Pseudomonas putida KT2440 (ATCC 47054), Sphingobium lignivorans SYK-6 (also Sphingobium sp. SYK-6), Sphingobium lignivorans B1D3A, Novosphingobium aromaticivorans JMN2, Novosphingobium aromaticivorans F199, Rhodococcus opacus PD630, and Rhodosporidium toruloides NBRC0880 (also R. toruloides IFO 0880). All strains were maintained in 25% glycerol at −80 °C. To revive strains, they were either streaked first on a Luria–Bertani (LB) medium (Lennox) and 1.5% agar plate or directly inoculated into LB liquid medium at 30 °C. Seed cultures for all experiments were grown until late exponential phase, pelleted at 5000g for 5 min, resuspended in minimal media (no carbon source), pelleted again, and resuspended in minimal media. The OD600 of the washed seed cultures was measured and used to inoculate experimental cultures to a starting OD600 of 0.1.Media preparation and chemicals
Each minimal medium recipe (M9, Wx, MM457, RM, SD, and K3) was prepared, as described before.17,29,31,44–46 The exact composition of the different minimal media types can be found in Table S1.† Indicated carbon source(s) were supplemented into minimal media to support growth as follows. Individual stocks of each chemical for mock APL were prepared in ultrapure water and titrated to a pH of 7.0–7.5. They were combined to prepare a 200% mock-APL stock (60 mM p-coumarate, 40 mM ferulate, 12 mM vanillate, 88 mM acetate, 126 mM lactate, and 120 mM glycolate) that was subsequently diluted to create 2× concentrations of each percentage of mock APL tested. The 2× mock-APL stocks in ultrapure water were combined with 2× minimal media stocks to produce final concentrations of 100%, 75%, 50%, 25%, or 10% mock APL. For growth assays on the individual acidic compounds used in this work (lactate, acetate, 4HB, p-coumarate, vanillate, ferulate, and syringate), stock solutions were prepared at 120 mM in a 1× RM minimal media solution titrated with 5 M NaOH to pH of 7.0 prior to dilution in 1× RM minimal media to the tested concentrations. For acetic acid, an initial working acetic acid stock was prepared from reagent grade (>99%) glacial acetic acid in ultrapure water titrated to pH of 5 before addition to RM minimal media to create 120 mM stock solution adjusted to pH of 7.0. The sodium salt concentration in the 100 mM aromatic and acetate conditions was between 200–350 mM. For vanillin and 4HBald, a 5 M stock solution was prepared in DMSO and diluted to the reported concentrations in RM medium. Additional DMSO was supplemented to maintain a 1% (v/v) concentration in all conditions. For NaCl tolerance experiments, a 5 M NaCl stock was made in RM media containing the favorable carbon source and diluted to the reported concentrations. The favorable carbon source was 20 mM glucose for all the strains except SYK-6 and B1D3A. For the two S. lignivorans strains, RM medium was supplemented with SEMP (10 mM sucrose, 10 mM glutamate, 10 mM proline, and 0.13 mM methionine) to support growth. All media was utilized for experimentation within 18 h of preparation. All chemicals were purchased from Sigma Aldrich, except for vanillic acid (4-hydroxy-3-methoxybenzoic acid), which was purchased from Acros Organics.Preparation of APL media
As previously described,17,50 APL was produced from corn stover at 130 °C with 70 mg NaOH per g dry biomass. Immediately before use, the APL was processed by centrifugation at 10000g and 10 °C for 30 min to remove the bulk of the solids. The pH of APL was next adjusted to 7.0 using 5 M H2SO4 and additional precipitates were removed through centrifugation at 10000g and 10 °C for 30 min. The resulting supernatant was filter-sterilized through 0.20 μm pore-size nylon filters. The filter-sterilized APL was combined with 1.33× concentrated RM minimal media to a resultant concentration of 25% (v/v) APL in 1× concentrated RM minimal media. No additional carbon sources were provided to support growth.
Measurement of microbial growth on APL and representative components of lignin streams
All microbial growth experiments were conducted in triplicate and included non-inoculated control samples treated under the same conditions as those to support microbial growth. All microbial strains were grown at 30 °C with shaking to maintain high aeration. Except for growth on 25% APL which was conducted in shake-flasks, growth experiments were conducted using plate readers with automated optical density measurements every 15 to 30 min. All bacterial strains were inoculated into 1 mL of each medium at OD600 of 0.1 and then 200 μL of the mixture was dispensed into three separate wells in a microtiter plate. Plates were incubated for 120 h in BioscreenC Pro instrument (Growth Curves Ltd) with maximum shaking speed and optical density measurements (OD600) taken every 15 min. However, R. toruloides NBRC0880 did not grow consistently in the BioscreenC Pro plate reader. Thus, NBRC0880 was compared to KT2440 in 48-well FlowerPlate (Beckman-Coulter) with larger culture volumes. The washed LB seed cultures were inoculated into wells containing 1.2 mL of growth medium and shaken at 1200 rpm to test different minimal media types or inoculated into wells containing 1 mL of growth medium and shaken at 975 rpm to assess tolerance and catabolic capacities. Measurements were conducted on BioLector® automated growth curve analysis system (m2p-labs GmbH) maintained at 85% humidity. Changes in biomass were measured in arbitrary units [a.u] of back-scattered 620 nm light with gain set to 2 or 3. Maximum absolute growth rates (μA) and lag times (λ) were calculated using single Gompertz model fit where maximum absolute growth rates represent the slope of the tangent at the inflection point and the lag time is the x-intercept of the tangent line.93,94 All growth from BioscreenC Pro and BioLector® were plotted using GraphPad Prism. Biomass measurements for all growth data are available in ESI Excel File 1.†Microbial growth experiments on 25% APL in RM minimal medium were performed in 250 mL baffled shake-flasks containing 50 mL of culture medium and shaken at 225 rpm for 120 h. An initial aliquot of medium prior to the inoculation was collected and frozen at −20 °C until additional processing was conducted. Growth and extracellular samples were acquired after 6 h, 12 h, and then daily for 120 h. When strains were grown on APL, which is dark brown in color, cell suspensions were measured spectrophotometrically at OD600 with a NanoDrop™ 2000 spectrophotometer (Thermo Fisher Scientific) before aliquots were centrifuged at 5000g for 10 min and the cell-free supernatant for each aliquot was measured again at OD600, which was used to correct the original biomass measurement for the APL background coloration. The cell-free supernatant was further filtered through 0.22 μm nylon Costar® Spin-X® centrifuge tube filters (Corning) to ensure bacterial removal before analysis of the aliphatic and aromatic acid composition. After cultivation ended at 120 h, 35 mL of each culture were centrifuged at 4500g and 4 °C for 20 min to remove the cells, the supernatant was lyophilized, and the resulting freeze-dried APL was weighed and aliquoted for Klason lignin, GPC, and 2D NMR analyses.
Quantification of aromatic and aliphatic compounds
To measure the aromatic compounds in the APL, a UHPLC-MS/MS method using an Agilent 1290 UHPLC paired with an Agilent 6470A Triple Quadrupole Mass Spectrometer was employed as described previously.95 In brief, reverse-phase chromatography was utilized at a flow rate of 0.5 mL min−1 with a Phenomenex Kinetex Phenyl-Hexyl (2.1 mm × 100 mm; 1.7 μm pore size) column maintained at 40 °C. Multiple reaction monitoring and dual Agilent jet stream electrospray ionization in negative-ion mode was used for analyte detection. An internal standard, 4-hydroxybenzoic-2,3,5,6-d4 acid, was spiked into each sample to improve data processing and quantitation. For aliphatic acid measurements, an Agilent 1260 Infinity II UHPLC equipped with a refractive index system was employed as described previously.96 In brief, all samples were first acidified with 72% sulfuric acid and then filtered through a 0.22 μm filter to remove HMM lignin before UHPLC analysis. The ion exclusion chromatography used a Phenomenex Rezex ROA-Organic Acids H+, 8% (7.8 mm × 50 mm) column maintained at 70 °C. The flow rate of the mobile phase (0.02 N sulfuric acid in water) was kept at 0.5 mL min−1 for 30 min. All linear calibration standard curves had a correlation coefficient (r2) of 0.995 or higher for quantification of compounds present in the APL.Characterization of lignin content
Klason lignin and GPC were used to determine, respectively, the amount of insoluble and soluble lignin remaining after 120 h of microbial treatment and the molecular mass distribution of the degraded lignin in APL. For Klason lignin, acid hydrolysis of 300 mg of freeze-dried APL was conducted according to NREL Laboratory Analytical Procedures.52 Both the acid-insoluble and acid-soluble fractions were combined to calculate a total percentage of lignin in the samples. Klason lignin content was corrected for evaporation that occurred at the end of 120 h by accounting for the final volume of the cultures after 120 h versus the theoretical amount without evaporation. A percent change in total lignin between the samples after bacterial treatment and the abiotic control was calculated as described before.17 For GPC analysis, 20 mg of the freeze-dried samples were derivatized via acetylation and analyzed using HPLC attached to a diode-array detector measuring absorbance at 260 nm, as described previously.17,50 In brief, an Agilent HPLC with three PLgel GPC columns (7.5 × 300 mm) were used in series: 10 μm × 50 Å, 10 μm × 103 Å, 10 μm × 104 Å. Isocratic elution was maintained with tetrahydrofuran at a flow rate of 1.0 mL min−1. The injection volume was 25 μL. A calibration curve using polystyrene standards was used to convert retention time to molecular mass.2D-HSQC-NMR spectroscopy
For determination of the lignin composition by 2D HSQC NMR, 50 mg of APL was suspended in 600 μL of DMSO-d6/pyridine-d5 (4:1, v/v), as previously described.97–99 The samples were sonicated with occasional vortexing until a uniform gel was formed. The gel suspension was analyzed with a Bruker Biospin (Billerica, Massachusetts) NEO 700 MHz spectrometer equipped with a 5 mm QCI 1H/31P/13C/15N cryoprobe with inverse geometry (proton coils closest to the sample). Two-dimensional 1H–13C HSQC NMR spectra were collected on a NEO 700 MHz spectrometer (Bruker Corp., Billerica, MA, U.S.A.) with an adiabatic-pulse program (hsqcetgpsisp2.2).100 HSQC experiments were carried out using the following parameters: acquired from 11.65 to −0.66 ppm in F2 (1H) with 1724 data points (acquisition time, 100 ms) and 215 to −5 ppm in F1 (13C) with 618 increments (F1 acquisition time, 8 ms) of 48 scans with a 0.5 s interscan delay; the d24 delay was set to 0.89 ms (⅛J, J = 140 Hz). The total acquisition time for each sample was 5 h 8 min. Processing used typical matched Gaussian apodization (GB = 0.001, LB = −0.5) in F2 and squared cosine-bell in F1 (without using linear prediction). The spectra were referenced using the central DMSO solvent peak (δC 39.5, δH 2.49 ppm). Volume integration of contours in HSQC data used TopSpin 4.4 (Mac) software, and no correction factors were applied. Peak identifications were based on previous reports.97–99
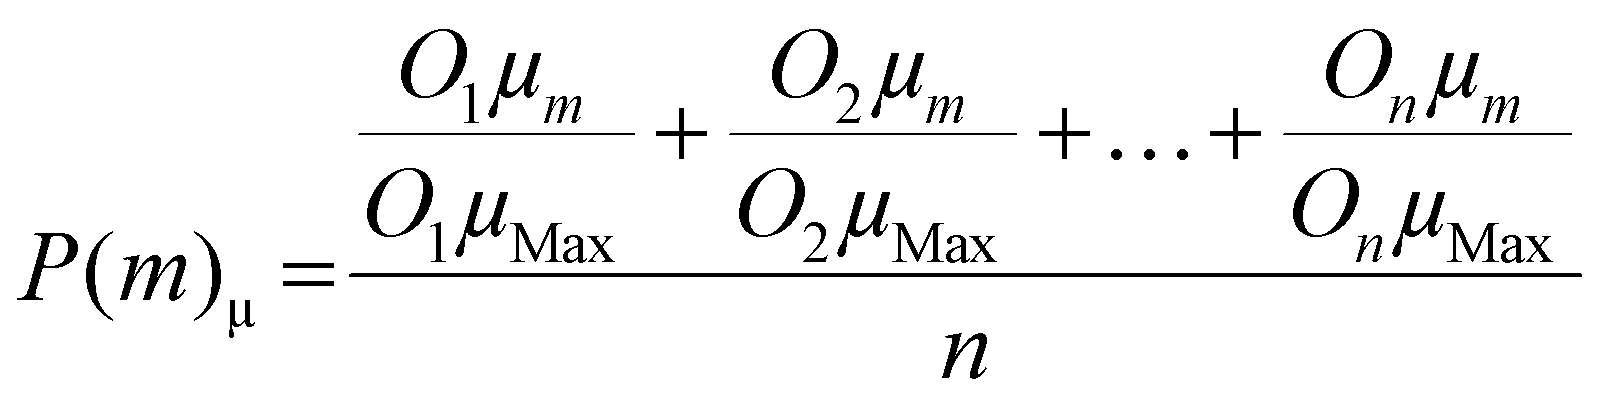
Media performance calculations
For each medium, m, a lag time performance score, P(m)λ and a maximum absolute growth rate performance score, P(m)μ was determined using eqn (1) and (2), respectively. | (1) |
 | (2) |
 | (3) |
Statistical analysis
Differences in lignin content and aromatic and aliphatic compound utilization between strains and abiotic controls were analyzed for statistically significant differences (p ≤ 0.05) using one-way analysis of variance (ANOVA) combined with Tukey honestly significant difference (HSD) post hoc tests. All analysis was conducted using GraphPad Prism 10.2.2.Author contributions
RAW, conceptualization, data curation, data analysis and visualization, design of experiments, writing – original draft, review & editing. AJB, conceptualization, data analysis, design and performance of experiments, review & editing. VEG, performance of experiments, review & editing. GMG, performance of experiments, review & editing. SL, performance of experiments, review & editing. AMG, conceptualization, review & editing. JKM, conceptualization, review & editing. DRN, conceptualization, review & editing. EM, conceptualization, review & editing. JMG, conceptualization, review & editing. JR, data curation, data analysis, design and performance of experiments, review & editing. GTB, conceptualization, project administration, supervision, funding acquisition, writing, review & editing.Data availability
Experimental data is presented in the manuscript or provided in the ESI document and the ESI Excel File.†Conflicts of interest
There are no conflicts of interest to declare.Acknowledgements
We thank Stefan Haugen and Kelsey Ramirez for the analytical support to quantify aliphatic and aromatic acids in the APL, Jeremy Bussard for producing the APL from corn stover, and Lisa Stanley for conducting the GPC analysis of the APL samples. We also thank Lindsay Eltis at the University of British Columbia for providing R. opacus PD630.This work was authored in part by the National Renewable Energy Laboratory, operated by Alliance for Sustainable Energy, LLC, for the U.S. Department of Energy (DOE) under Contract No. DE-AC36-08GO28308. This work was also authored in part by Oak Ridge National Laboratory, managed by UT-Battelle, LLC for the US DOE under Contract Number DE-AC05-00OR22725. This material is based upon work supported by the Center for Bioenergy Innovation (CBI), U.S. Department of Energy, Office of Science, Biological and Environmental Research Program under Award Number ERKP886. DRN, SL, and JR were supported by the Great Lakes Bioenergy Research Center, U.S. Department of Energy, Office of Science, Biological and Environmental Research Program under Award Number DE-SC0018409. This work was part of the DOE Joint BioEnergy Institute (https://www.jbei.org) supported by the U.S. Department of Energy, Office of Science, Office of Biological and Environmental Research, through contract DE-AC02-05CH11231 between Lawrence Berkeley National Laboratory and the U. S. Department of Energy. Additional funding was provided by the U.S. Department of Energy Office of Energy Efficiency and Renewable Energy Bioenergy Technologies Office, which additionally supported the analytical analysis of aromatic and aliphatic acids. The views expressed in the article do not necessarily represent the views of the DOE or the U.S. Government. The U.S. Government retains and the publisher, by accepting the article for publication, acknowledges that the U.S. Government retains a nonexclusive, paid-up, irrevocable, worldwide license to publish or reproduce the published form of this work, or allow others to do so, for U.S. Government purposes.
References
- G. T. Beckham, C. W. Johnson, E. M. Karp, D. Salvachúa and D. R. Vardon, Curr. Opin. Biotechnol., 2016, 42, 40–53 CrossRef CAS PubMed.
- O. Y. Abdelaziz, D. P. Brink, J. Prothmann, K. Ravi, M. Sun, J. García-Hidalgo, M. Sandahl, C. P. Hulteberg, C. Turner, G. Lidén and M. F. Gorwa-Grauslund, Biotechnol. Adv., 2016, 34, 1318–1346 CrossRef CAS PubMed.
- L. D. Eltis and R. Singh, in RSC Energy and Environment Series, Royal Society of Chemistry, 2018, pp. 290–313 Search PubMed.
- J. Becker and C. Wittmann, Biotechnol. Adv., 2019, 37, 107360 CrossRef CAS.
- T. D. H. Bugg, J. J. Williamson and F. Alberti, Renewable Sustainable Energy Rev., 2021, 152, 111674 CrossRef CAS.
- R. M. Cywar, N. A. Rorrer, C. B. Hoyt, G. T. Beckham and E. Y. X. Chen, Nat. Rev. Mater., 2021, 7, 83–103 CrossRef.
- F. Weiland, M. Kohlstedt and C. Wittmann, Metab. Eng., 2021, 71, 13–41 CrossRef.
- Z. H. Liu, B. Z. Li, J. S. Yuan and Y. J. Yuan, Trends Biotechnol., 2022, 40, 1150–1566 Search PubMed.
- A. Z. Werner and L. D. Eltis, Trends Biotechnol., 2023, 41, 270–272 CrossRef CAS PubMed.
- R. Rinaldi, R. Jastrzebski, M. T. Clough, J. Ralph, M. Kennema, P. C. A. Bruijnincx and B. M. Weckhuysen, Angew. Chem., Int. Ed., 2016, 55, 8164–8215 CrossRef CAS.
- W. Schutyser, T. Renders, S. Van Den Bosch, S. F. Koelewijn, G. T. Beckham and B. F. Sels, Chem. Soc. Rev., 2018, 47, 852–908 RSC.
- Z. Sun, B. Fridrich, A. De Santi, S. Elangovan and K. Barta, Chem. Rev., 2018, 118, 614–678 CrossRef CAS PubMed.
- T. D. H. Bugg, J. J. Williamson and F. Alberti, Renewable Sustainable Energy Rev., 2021, 152, 111674 CrossRef CAS.
- C. C. Azubuike, M. N. Allemann and J. K. Michener, Curr. Opin. Microbiol., 2022, 65, 64–72 CrossRef CAS PubMed.
- A. J. Borchert, W. R. Henson and G. T. Beckham, Curr. Opin. Biotechnol., 2022, 73, 1–13 CrossRef CAS PubMed.
- L. A. Riley and A. M. Guss, Biotechnol. Biofuels, 2021, 14, 1–17 CrossRef PubMed.
- D. Salvachúa, E. M. Karp, C. T. Nimlos, D. R. Vardon and G. T. Beckham, Green Chem., 2015, 17, 4951–4967 RSC.
- E. M. Karp, C. T. Nimlos, S. Deutch, D. Salvachúa, R. M. Cywar and G. T. Beckham, Green Chem., 2016, 18, 4750–4760 RSC.
- A. Rodriguez, D. Salvachúa, R. Katahira, B. A. Black, N. S. Cleveland, M. Reed, H. Smith, E. E. K. Baidoo, J. D. Keasling, B. A. Simmons, G. T. Beckham and J. M. Gladden, ACS Sustainable Chem. Eng., 2017, 5, 8171–8180 CrossRef CAS.
- D. Salvachúa, A. Z. Werner, I. Pardo, M. Michalska, B. A. Black, B. S. Donohoe, S. J. Haugen, R. Katahira, S. Notonier, K. J. Ramirez, A. Amore, S. O. Purvine, E. M. Zink, P. E. Abraham, R. J. Giannone, S. Poudel, P. D. Laible, R. L. Hettich and G. T. Beckham, Proc. Natl. Acad. Sci. U. S. A., 2020, 117, 9302–9310 CrossRef.
- E. Belda, R. G. A. Van Heck, M. J. Lopez-Sanchez, S. Cruveiller, V. Barbe, C. Fraser, H. Klenk, J. Petersen, A. Morgat, P. I. Nikel, D. Vallenet, Z. Rouy, A. Sekowska, V. A. P. Martins dos Santos, V. de Lorenzo, A. Danchin and C. Medigue, Environ. Microbiol., 2016, 18, 3403–3424 CrossRef CAS PubMed.
- C. Molina-Santiago, B. F. Cordero, A. Daddaoua, Z. Udaondo, J. Manzano, M. Valdivia, A. Segura, J. L. Ramos and E. Duque, Microbiology, 2016, 162, 1535–1543 CrossRef CAS PubMed.
- C. W. Johnson, D. Salvachúa, N. A. Rorrer, B. A. Black, D. R. Vardon, P. C. St. John, N. S. Cleveland, G. Dominick, J. R. Elmore, N. Grundl, P. Khanna, C. R. Martinez, W. E. Michener, D. J. Peterson, K. J. Ramirez, P. Singh, T. A. VanderWall, A. N. Wilson, X. Yi, M. J. Biddy, Y. J. Bomble, A. M. Guss and G. T. Beckham, Joule, 2019, 3, 1523–1537 CrossRef CAS.
- P. I. Nikel, E. Martínez-García and V. de Lorenzo, Nat. Rev. Microbiol., 2014, 12, 368–379 CrossRef CAS PubMed.
- N. Kamimura, K. Takahashi, K. Mori, T. Araki, M. Fujita, Y. Higuchi and E. Masai, Environ. Microbiol. Rep., 2017, 9, 679–705 CrossRef CAS PubMed.
- M. N. Allemann, G. N. Presley, J. G. Elkins and J. K. Michener, Int. J. Syst. Evol. Microbiol., 2023, 73, 005704 CrossRef CAS PubMed.
- J. M. Perez, W. S. Kontur, C. Gehl, D. M. Gille, Y. Ma, A. V. Niles, G. Umana, T. J. Donohue and D. R. Noguera, Appl. Environ. Microbiol., 2021, 87, e02794–e02720 CrossRef CAS.
- W. E. Anthony, R. R. Carr, D. M. Delorenzo, T. P. Campbell, Z. Shang, M. Foston, T. S. Moon and G. Dantas, Biotechnol. Biofuels, 2019, 12, 192 CrossRef PubMed.
- J. Yaegashi, J. Kirby, M. Ito, J. Sun, T. Dutta, M. Mirsiaghi, E. R. Sundstrom, A. Rodriguez, E. Baidoo, D. Tanjore, T. Pray, K. Sale, S. Singh, J. D. Keasling, B. A. Simmons, S. W. Singer, J. K. Magnuson, A. P. Arkin, J. M. Skerker and J. M. Gladden, Biotechnol. Biofuels, 2017, 10, 241 CrossRef PubMed.
- A. M. Linz, Y. Ma, J. M. Perez, K. S. Myers, W. S. Kontur, D. R. Noguera and T. J. Donohue, Appl. Environ. Microbiol., 2021, 87, e01742–e01721 CrossRef CAS.
- G. N. Presley, A. Z. Werner, R. Katahira, D. C. Garcia, S. J. Haugen, K. J. Ramirez, R. J. Giannone, G. T. Beckham and J. K. Michener, Metab. Eng., 2021, 65, 1–10 CrossRef CAS PubMed.
- R. K. Le, T. Wells, P. Das, X. Meng, R. J. Stoklosa, A. Bhalla, D. B. Hodge, J. S. Yuan and A. J. Ragauskas, RSC Adv., 2017, 7, 4108–4115 RSC.
- J. M. Perez, W. S. Kontur, M. Alherech, J. Coplien, S. D. Karlen, S. S. Stahl, T. J. Donohue and D. R. Noguera, Green Chem., 2019, 21, 1340–1350 RSC.
- T. Sonoki, K. Takahashi, H. Sugita, M. Hatamura, Y. Azuma, T. Sato, S. Suzuki, N. Kamimura and E. Masai, ACS Sustainable Chem. Eng., 2018, 6, 1256–1264 CrossRef CAS.
- C. Cai, Z. Xu, H. Zhou, S. Chen and M. Jin, Sci. Adv., 2021, 7, eabg4585 CrossRef CAS.
- V. E. Garcia, V. Pidatala, C. A. Barcelos, D. Liu, P. Otoupal, O. Wendt, H. Choudhary, N. Sun, A. Eudes, E. R. Sundstrom, H. V. Scheller, D. H. Putnam, A. Mukhopadhyay, J. M. Gladden, B. A. Simmons and A. Rodriguez, Green Chem., 2023, 25, 6797–6808 RSC.
- B. Kim, J. M. Perez, S. D. Karlen, J. Coplien, T. J. Donohue and D. R. Noguera, Green Chem., 2024, 26, 7997–8009 RSC.
- A. M. Varman, L. He, R. Follenfant, W. Wu, S. Wemmer, S. A. Wrobel, Y. J. Tang and S. Singh, Proc. Natl. Acad. Sci. U. S. A., 2016, 113, E5802–E5811 CrossRef CAS PubMed.
- J. H. Cecil, D. C. Garcia, R. J. Giannone and J. K. Michener, Appl. Environ. Microbiol., 2018, 84, e01185–e01118 CrossRef CAS.
- W. R. Henson, T. Campbell, D. M. DeLorenzo, Y. Gao, B. Berla, S. J. Kim, M. Foston, T. S. Moon and G. Dantas, Metab. Eng., 2018, 49, 69–83 CrossRef CAS.
- X. Li, Y. He, L. Zhang, Z. Xu, H. Ben, M. J. Gaffrey, Y. Yang, S. Yang, J. S. Yuan, W. J. Qian and B. Yang, Biotechnol. Biofuels, 2019, 12, 1–16 CrossRef.
- J. Kim, S. T. Coradetti, Y. M. Kim, Y. Gao, J. Yaegashi, J. D. Zucker, N. Munoz, E. M. Zink, K. E. Burnum-Johnson, S. E. Baker, B. A. Simmons, J. M. Skerker, J. M. Gladden and J. K. Magnuson, Front. Bioeng. Biotechnol., 2021, 8, 612832 CrossRef PubMed.
- A. Bleem, R. Kato, Z. A. Kellermyer, R. Katahira, M. Miyamoto, K. Niinuma, N. Kamimura, E. Masai and G. T. Beckham, Cell Rep., 2023, 42, 112847 CrossRef CAS PubMed.
- C. Zhao, S. Xie, Y. Pu, R. Zhang, F. Huang, A. J. Ragauskas and J. S. Yuan, Green Chem., 2016, 18, 1306–1312 RSC.
- D. Kasai, N. Kamimura, K. Tani, S. Umeda, T. Abe, M. Fukuda and E. Masai, FEMS Microbiol. Lett., 2012, 332, 68–75 CrossRef CAS.
- K. Zhou, S. Edgar and G. Stephanopoulos, Methods Enzymol., 2016, 575, 225–245 CAS.
- A. J. Borchert, A. Bleem and G. T. Beckham, Metab. Eng., 2023, 77, 208–218 CrossRef CAS PubMed.
- E. M. Karp, B. S. Donohoe, M. H. O'Brien, P. N. Ciesielski, A. Mittal, M. J. Biddy and G. T. Beckham, ACS Sustainable Chem. Eng., 2014, 2, 1481–1491 CrossRef CAS.
- M. Fujita, T. Sakumoto, K. Tanatani, H. Y. Yu, K. Mori, N. Kamimura and E. Masai, Sci. Rep., 2020, 10, 1–14 CrossRef PubMed.
- J. G. Linger, D. R. Vardon, M. T. Guarnieri, E. M. Karp, G. B. Hunsinger, M. A. Franden, C. W. Johnson, G. Chupka, T. J. Strathmann, P. T. Pienkos and G. T. Beckham, Proc. Natl. Acad. Sci. U. S. A., 2014, 111, 12013–12018 CrossRef CAS PubMed.
- T. Araki, S. Umeda, N. Kamimura, D. Kasai, S. Kumano, T. Abe, C. Kawazu, Y. Otsuka, M. Nakamura, Y. Katayama, M. Fukuda and E. Masai, Sci. Rep., 2019, 9, 1–15 CrossRef PubMed.
- J. B. Sluiter, R. O. Ruiz, C. J. Scarlata, A. D. Sluiter and D. W. Templeton, J. Agric. Food Chem., 2010, 58, 9043–9053 CrossRef CAS.
- Y. Higuchi, N. Kamimura, H. Takenami, Y. Kikuiri, C. Yasuta, K. Tanatani, T. Shobuda, Y. Otsuka, M. Nakamura, T. Sonoki and E. Masai, Appl. Environ. Microbiol., 2022, 88, e00724–e00722 CrossRef.
- V. I. Timokhin, M. Regner, A. H. Motagamwala, C. Sener, S. D. Karlen, J. A. Dumesic and J. Ralph, ACS Sustainable Chem. Eng., 2020, 8, 17427–17438 CrossRef CAS.
- J. C. Del Río, J. Rencoret, P. Prinsen, Á. T. Martínez, J. Ralph and A. Gutiérrez, J. Agric. Food Chem., 2012, 60, 5922–5935 CrossRef.
- W. Lan, F. Lu, M. Regner, Y. Zhu, J. Rencoret, S. A. Ralph, U. I. Zakai, K. Morreel, W. Boerjan and J. Ralph, Plant Physiol., 2015, 167, 1284 CrossRef CAS PubMed.
- W. Lan, J. Rencoret, F. Lu, S. D. Karlen, B. G. Smith, P. J. Harris, J. C. del Río and J. Ralph, Plant J., 2016, 88, 1046–1057 CrossRef CAS PubMed.
- Y. Sato, H. Moriuchi, S. Hishiyama, Y. Otsuka, K. Oshima, D. Kasai, M. Nakamura, S. Ohara, Y. Katayama, M. Fukuda and E. Masai, Appl. Environ. Microbiol., 2009, 75, 5195–5201 CrossRef CAS PubMed.
- D. L. Gall, J. Ralph, T. J. Donohue and D. R. Noguera, Environ. Sci. Technol., 2014, 48, 12454–12463 CrossRef CAS PubMed.
- A. Z. Werner, W. T. Cordell, C. W. Lahive, B. C. Klein, C. A. Singer, E. C. D. Tan, M. A. Ingraham, K. J. Ramirez, D. H. Kim, J. N. Pedersen, C. W. Johnson, B. F. Pfleger, G. T. Beckham and D. Salvachúa, Sci. Adv., 2023, 9, eadj0053 CrossRef CAS PubMed.
- J. R. Elmore, G. N. Dexter, D. Salvachúa, J. Martinez-Baird, E. A. Hatmaker, J. D. Huenemann, D. M. Klingeman, G. L. Peabody, D. J. Peterson, C. Singer, G. T. Beckham and A. M. Guss, Nat. Commun., 2021, 12, 1–12 CrossRef.
- J. L. Ramos, T. Krell, C. Daniels, A. Segura and E. Duque, Curr. Opin. Microbiol., 2009, 12, 215–220 CrossRef CAS PubMed.
- M. Chavarría, P. I. Nikel, D. Pérez-Pantoja and V. de Lorenzo, Environ. Microbiol., 2013, 15, 1772–1785 CrossRef.
- I. Sitepu, T. Selby, T. Lin, S. Zhu and K. Boundy-Mills, J. Ind. Microbiol. Biotechnol., 2014, 41, 1061–1070 CrossRef CAS PubMed.
- R. Saini, K. Hegde, C. S. Osorio-Gonzalez, S. K. Brar and P. Vezina, Energies, 2020, 13, 5960 CrossRef CAS.
- H. Luo, E. P. Weeda, M. Alherech, C. W. Anson, S. D. Karlen, Y. Cui, C. E. Foster and S. S. Stahl, J. Am. Chem. Soc., 2021, 143, 15462–15470 CrossRef CAS.
- M. Alherech, S. Omolabake, C. M. Holland, G. E. Klinger, E. L. Hegg and S. S. Stahl, ACS Cent. Sci., 2021, 7, 1831–1837 CrossRef CAS.
- A. Rahimi, A. Ulbrich, J. J. Coon and S. S. Stahl, Nature, 2014, 515, 249–252 CrossRef CAS PubMed.
- J. M. Perez, C. Sener, S. Misra, G. E. Umana, J. Coplien, D. Haak, Y. Li, C. T. Maravelias, S. D. Karlen, J. Ralph, T. J. Donohue and D. R. Noguera, Green Chem., 2022, 24, 2795–2811 RSC.
- G. E. Umana, J. M. Perez, F. Unda, C. Y. Lin, C. Sener, S. D. Karlen, S. D. Mansfield, A. Eudes, J. Ralph, T. J. Donohue and D. R. Noguera, Front. Chem. Eng., 2022, 4, 1036084 CrossRef.
- W. Schutyser, J. S. Kruger, A. M. Robinson, R. Katahira, D. G. Brandner, N. S. Cleveland, A. Mittal, D. J. Peterson, R. Meilan, Y. Román-Leshkov and G. T. Beckham, Green Chem., 2018, 20, 3828–3844 RSC.
- Y. Zhu, Y. Liao, W. Lv, J. Liu, X. Song, L. Chen, C. Wang, B. F. Sels and L. Ma, ACS Sustainable Chem. Eng., 2020, 8, 2361–2374 CrossRef CAS.
- N. Kamimura, T. Goto, K. Takahashi, D. Kasai, Y. Otsuka, M. Nakamura, Y. Katayama, M. Fukuda and E. Masai, Sci. Rep., 2017, 7, 1–12 CrossRef PubMed.
- Y. Higuchi, S. Aoki, H. Takenami, N. Kamimura, K. Takahashi, S. Hishiyama, C. S. Lancefield, O. S. Ojo, Y. Katayama, N. J. Westwood and E. Masai, Appl. Environ. Microbiol., 2018, 84, 2670–2687 CrossRef PubMed.
- E. Masai, M. Sasaki, Y. Minakawa, T. Abe, T. Sonoki, K. Miyauchi, Y. Katayama and M. Fukuda, J. Bacteriol., 2004, 186, 2757–2765 CrossRef CAS.
- S. Notonier, A. Z. Werner, E. Kuatsjah, L. Dumalo, P. E. Abraham, E. A. Hatmaker, C. B. Hoyt, A. Amore, K. J. Ramirez, S. P. Woodworth, D. M. Klingeman, R. J. Giannone, A. M. Guss, R. L. Hettich, L. D. Eltis, C. W. Johnson and G. T. Beckham, Metab. Eng., 2021, 65, 111–122 CrossRef CAS.
- J. Mueller, H. Willett, A. M. Feist and W. Niu, Biotechnol. Bioeng., 2022, 119, 2541–2550 CrossRef CAS.
- M. Kawazoe, K. Takahashi, Y. Tokue, S. Hishiyama, H. Seki, Y. Higuchi, N. Kamimura and E. Masai, J. Agric. Food Chem., 2023, 71, 19663–19671 CrossRef CAS.
- R. Kato, K. Maekawa, S. Kobayashi, S. Hishiyama, R. Katahira, M. Nambo, Y. Higuchi, E. Kuatsjah, G. T. Beckham, N. Kamimura and E. Masai, Appl. Environ. Microbiol., 2023, 89, e00171–e00123 CrossRef.
- T. Sonoki, Y. Iimura, E. Masai, S. Kajita and Y. Katayama, J. Wood Sci., 2002, 48, 429–433 CrossRef CAS.
- J. C. Chan, M. Paice and X. Zhang, ChemCatChem, 2020, 12, 401–425 CrossRef CAS.
- R. Singh, J. Hu, M. R. Regner, J. W. Round, J. Ralph, J. N. Saddler and L. D. Eltis, Sci. Rep., 2017, 7, 1–13 CrossRef PubMed.
- S. Sun, F. Li, M. Li, W. Zhang, Z. Jiang, H. Zhao, Y. Pu, A. J. Ragauskas, S. Y. Dai, X. Zhang, H. Yu, J. S. Yuan and S. Xie, iScience, 2023, 26, 107870 CrossRef CAS PubMed.
- D. Salvachúa, R. Katahira, N. S. Cleveland, P. Khanna, M. G. Resch, B. A. Black, S. O. Purvine, E. M. Zink, A. Prieto, M. J. Martínez, A. T. Martínez, B. A. Simmons, J. M. Gladden and G. T. Beckham, Green Chem., 2016, 18, 6046–6062 RSC.
- M. Margarida Martins, F. Carvalheiro and F. Gírio, Biomass Convers. Biorefin., 2022, 14, 3183–3207 CrossRef.
- R. Davis and A. Bartling, Biochemical Conversion of Lignocellulosic Biomass to Hydrocarbon Fuels and Products: 2021 State of Technology and Future Research, National Renewable Energy Laboratory, Golden, CO, 2022, NREL/TP-5100-82512 Search PubMed.
- T. Renders, G. Van den Bossche, T. Vangeel, K. Van Aelst and B. Sels, Curr. Opin. Biotechnol., 2019, 56, 193–201 CrossRef CAS PubMed.
- Y. Han, B. A. Simmons and S. Singh, Ind. Chem. Mater., 2023, 1, 207–223 RSC.
- A. Das, A. Rahimi, A. Ulbrich, M. Alherech, A. H. Motagamwala, A. Bhalla, L. Da Costa Sousa, V. Balan, J. A. Dumesic, E. L. Hegg, B. E. Dale, J. Ralph, J. J. Coon and S. S. Stahl, ACS Sustainable Chem. Eng., 2018, 6, 3367–3374 CrossRef CAS.
- E. Subbotina, T. Rukkijakan, M. D. Marquez-Medina, X. Yu, M. Johnsson and J. S. M. Samec, Nat. Chem., 2021, 13, 1118–1125 CrossRef CAS PubMed.
- N. X. Gu, C. T. Palumbo, A. C. Bleem, K. P. Sullivan, S. J. Haugen, S. P. Woodworth, K. J. Ramirez, J. K. Kenny, L. D. Stanley, R. Katahira, S. S. Stahl and G. T. Beckham, ACS Cent. Sci., 2023, 9, 2277–2285 CrossRef CAS PubMed.
- C. T. Palumbo, N. X. Gu, A. C. Bleem, K. P. Sullivan, R. Katahira, L. M. Stanley, J. K. Kenny, M. A. Ingraham, K. J. Ramirez, S. J. Haugen, C. R. Amendola, S. S. Stahl and G. T. Beckham, Nat. Commun., 2024, 15, 1–12 Search PubMed.
- M. H. Zwietering, I. Jongenburger, F. M. Rombouts and K. Van't Riet, Appl. Environ. Microbiol., 1990, 56, 1875–1881 CrossRef CAS.
- K. M. C. Tjørve and E. Tjørve, PLoS One, 2017, 12, e0178691 CrossRef.
- S. J. Haugen, G. T. Beckham and K. J. Ramirez, protocols.io, 2023. DOI:10.17504/protocols.io.eq2ly7rzwlx9/v1.
- S. P. Woodworth, S. J. Haugen, A. F. Benson, D. Brandner, K. J. Ramirez and G. T. Beckham, protocols.io, 2024. DOI:10.17504/protocols.io.rm7vzxrn2gx1/v1.
- H. Kim, J. Ralph and T. Akiyama, BioEnergy Res., 2008, 1, 56–66 CrossRef.
- H. Kim and J. Ralph, Org. Biomol. Chem., 2010, 8, 576–591 RSC.
- S. D. Mansfield, H. Kim, F. Lu and J. Ralph, Nat. Protoc., 2012, 7, 1579–1589 CrossRef CAS PubMed.
- E. Kupče and R. Freeman, J. Magn. Reason., 1997, 127, 36–48 CrossRef.
Footnote |
| † Electronic supplementary information (ESI) available. See DOI: https://doi.org/10.1039/d4gc03876b |
| This journal is © The Royal Society of Chemistry 2024 |