
 Open Access Article
 This Open Access Article is licensed under a Creative Commons Attribution-Non Commercial 3.0 Unported Licence
Counter-current chromatography for lignin monomer–monomer and monomer–oligomer separations from reductive catalytic fractionation oil†
Hoon
Choi‡
 ,
Manar
Alherech‡
,
Jun Hee
Jang§
,
Sean P.
Woodworth
,
Kelsey J.
Ramirez
,
Eric M.
Karp¶
and
Gregg T.
Beckham
*
,
Manar
Alherech‡
,
Jun Hee
Jang§
,
Sean P.
Woodworth
,
Kelsey J.
Ramirez
,
Eric M.
Karp¶
and
Gregg T.
Beckham
*
Renewable Resources and Enabling Sciences Center, National Renewable Energy Laboratory, Golden, CO 80401, USA. E-mail: gregg.beckham@nrel.gov
First published on 9th April 2024
Abstract
Reductive catalytic fractionation (RCF) is a lignin-first biorefining technique that produces a polysaccharide-rich pulp and a lignin oil that is rich in aromatic monomers from aryl–ether bond cleavage and carbon–carbon linked aromatic oligomers. Separations of the lignin-derived monomers, both from one another and from the oligomers, out of these lignin oils could potentially yield high value co-products. To that end, we demonstrate that counter-current chromatography (CCC) is an effective means for simultaneous lignin monomer–monomer and monomer–oligomer separations using oils from RCF reactions with hardwood, softwood, and herbaceous feedstocks. Partition coefficient measurements of aromatic monomers from RCF of poplar, pine, and corn stover were first used to inform CCC solvent selection. We subsequently demonstrated CCC separations of those lignin oils using the HEMWat −3 solvent system and refined the measured partition coefficients using solute retention times and the cell utilized partitioning model to account for matrix effects in the following optimization experiments. Furthermore, the carbon–carbon linked oligomers in the lignin oil substrates elute together and separately from the aromatic monomers in lignin oil, resulting in an oligomer-rich product stream. Case studies of optimization of poplar RCF-derived lignin oil separations exhibited non-polar monomer yields of 95–99% with purities of 72–96%. Additionally, the same separation using a propyl-rich lignin oil produced from a H2-free RCF process showed a nearly 46% increase in normalized productivity, exhibiting the importance of tuning feed composition to improve separation performance. Taken together, this work shows that CCC is a promising method for simultaneous lignin monomer–monomer and monomer–oligomer separations.
Introduction
Lignin-first biorefining is a promising class of methods for the valorization of the recalcitrant plant biopolymer, lignin.1–7 Lignin-first approaches generally extract the polymer from the plant cell wall of whole biomass and intercept reactive groups in lignin, either through stabilization chemistry on the intact polymer or catalytic conversion of small molecule intermediates to stable products.6,7 Of note, reductive catalytic fractionation (RCF) is a popular lignin-first biorefining method that uses a polar protic solvent for lignin extraction and a metal catalyst with exogenous H2 gas or an endogenous hydrogen donor to cleave aryl–ether linkages in lignin.7 The products from the RCF process are a stabilized lignin oil and a polysaccharide-rich pulp. The lignin oil derived from RCF typically contains aromatic monomers, the yield of which is dictated by the aryl–ether bond content of the feedstock and extraction yields, and carbon–carbon bond linked dimers and oligomers.7–9Multiple approaches are being pursued to convert RCF-derived lignin oil to fuels, chemicals, and materials, several of which will rely on, or would benefit from, isolation of individual aromatic compounds and on fractionation of the monomers and oligomers.10–12 For monomer–oligomer separations of RCF-derived lignin oil, both liquid–liquid extraction (LLE) and vacuum distillation are common approaches used in the literature.13 Membrane separations for monomer–oligomer separations have also been pursued using nanofiltration.14–16 To date, less work has been reported to our knowledge on monomer–monomer separations from RCF-derived lignin oil. As a recent example to this end, the crystallization of two monomers was demonstrated.17 Ultimately, the development of cost-effective, energy-efficient, and flexible monomer–monomer and monomer–oligomer separations approaches for lignin streams, including RCF-derived lignin oil, would potentially enable new lignin valorization strategies.
Despite considerable progress to date in lignin oil separations, to accomplish both monomer–monomer and monomer–oligomer separations for lignin depolymerization products in a consolidated process remains a challenge. In previous work, Alherech et al. demonstrated a liquid–liquid chromatography method to accomplish this separation, namely centrifugal partitioning chromatography (CPC).18 In that work, the authors used CPC to isolate aromatic carboxylic acids and aldehydes that resulted from oxidative catalytic fractionation of poplar.18 Similar to CPC, counter-current chromatography (CCC) is a liquid–liquid chromatography approach using two immiscible liquids as stationary and mobile phases with planetary motion of the rotor.19 CCC has several advantages over standard liquid–solid chromatography, in that it can handle solids in the feed, allows large sample loadings, has no sample loss, and uses less solvent.20 For CPC and CCC, there are well-known biphasic solvent systems that vary in their polarity,19,21–26 and the selection of solvents for a given application is often the first step to deploy these liquid–liquid chromatographic methods for new applications.19,23
In this work, we demonstrate that CCC enables simultaneous lignin monomer–monomer and monomer–oligomer separations in RCF-derived lignin oils from multiple feedstocks, as illustrated in Fig. 1. We first measured the partition coefficients of common aromatic monomers in lignin oils from hardwood, softwood, and herbaceous feedstocks27,28 using the HEMWat (hexane, ethyl acetate, methanol, and water) solvent system (Table S1†).24 Based on the measured partition coefficients, we used the selected solvent system for CCC to separate lignin oils from poplar, pine, and corn stover, demonstrating in all cases both monomer–monomer and monomer–oligomer separations. From the traces, we were able to adjust the partition coefficients using the retention times of each compound and the cell utilized partitioning (CUP) model,29 ensuring increased accuracy in subsequent demonstration experiments that highlighted, in two separate case studies, high single component recovery and purity, and separately maximum throughput for separating all major monomer components. Lastly, we show in a third case study how by tuning the selectivity of the RCF conditions, we can further improve CCC productivity.
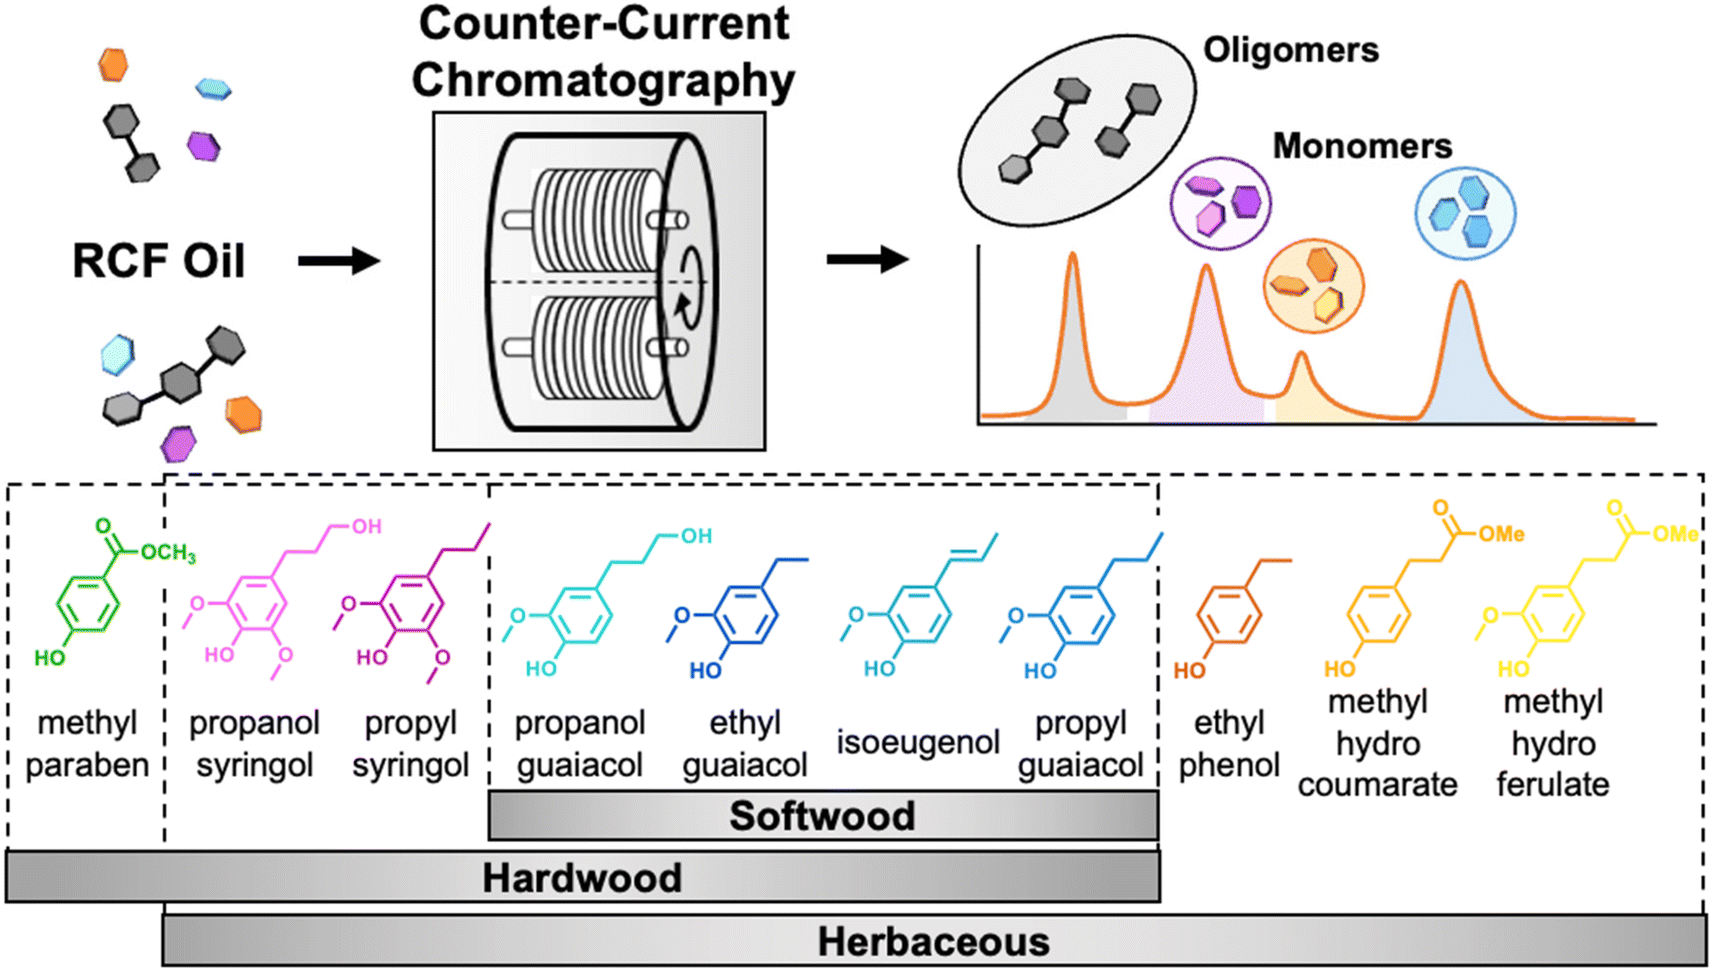 | ||
| Fig. 1 Scheme of the process to separate monomers from lignin oil using CCC (top) and representative RCF monomers obtained from hardwood, softwood, and herbaceous lignins (bottom). RCF oligomers and individual monomers are separated from each other simultaneously using CCC. RCF monomers are classified as p-coumaryl (H), guaiacyl (G), and syringyl (S) derivatives. Partition coefficient measurements for aromatic monomers in the lignin oils. To achieve efficient separations, the selection of the appropriate solvent system is the most important step for CCC because the solvent system determines the partition coefficient (KP) of the target compounds. Here, we define KP as the ratio of the solute concentration in the upper phase to the lower phase. Changing the mixing ratio of solvents varies the polarity of the solvent system, allowing fine control over the partitioning of solutes.33 | ||
Results
Generation and analysis of lignin oils from hardwood, softwood, and herbaceous feedstocks
Three lignin oil samples were produced with RCF using poplar, pine, and corn stover. As described in detail in the method section, for all RCF experiments, we conducted the reactions in a 75 mL magnetically-stirred batch reactor. For each RCF reaction, we loaded 3 g of feedstock, 0.3 g 5 wt% Ru/C, and 30 mL methanol. After the vessel was pressurized with 30 bar of H2, at room temperature the reaction was conducted at 225 °C for 3 hours (following a heat-up time of ∼30 minutes). After quenching, the resulting reaction mixture was subjected to methanol removal through rotary evaporation, then liquid–liquid extraction of the residue was conducted with ethyl acetate and water where lignin oil was extracted in ethyl acetate while co-extracted carbohydrates remained in water. Finally, the lignin oil was obtained by removal of ethyl acetate with rotary evaporation. We analyzed the monomer composition of each lignin oil with ultra-high performance liquid chromatography (UHPLC) (Fig. 2). Both guaiacyl (G)-type and syringyl (S)-type monomers were produced from poplar along with methyl paraben originating from p-hydroxybenzoic acid, while only G-type monomers were produced in the pine oil, as expected (Fig. 2). The oil from corn stover exhibited an increasing complexity of monomers, stemming from the presence of S- and G-type lignin and the hydroxycinnamic acids, ferulic acid and p-coumaric acid.30–32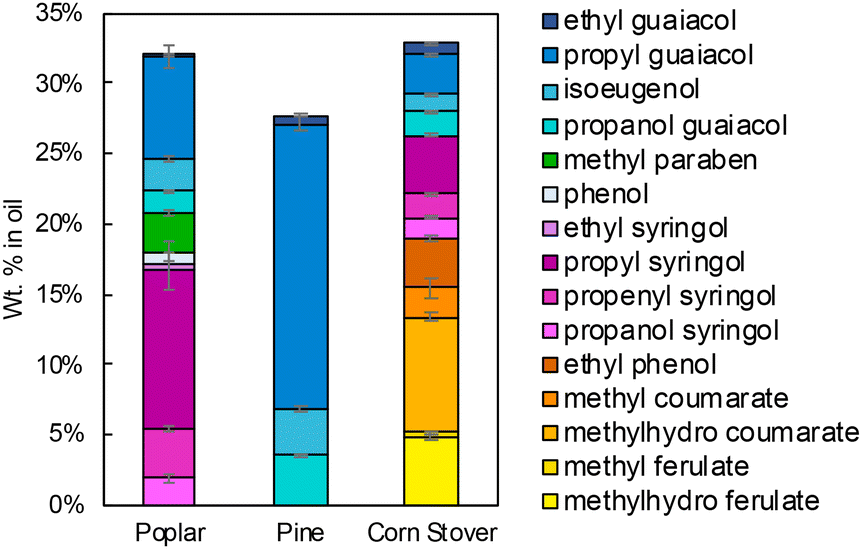 | ||
| Fig. 2 RCF monomer composition in the three lignin oils used in this work. The data shown in this figure are available in Table S2.† RCF reaction conditions: 3 g of feedstock, 0.3 g of 5 wt% Ru/C, 30 mL of methanol, and 30 bar H2 at room temperature at, 225 °C for 3 hours after a 30 minutes temperature ramp. | ||
Using synthetic mixtures of monomers with similar compositions to each lignin oil shown in Fig. 2, we measured the partition coefficients of the monomers across HEMWat solvent compositions24 varying in their polarity from non-polar (HEMWat −5) to polar (HEMWat +3). After mixing vigorously and allowing the mixtures to equilibrate for 15 minutes, we collected samples from each phase and used UHPLC to measure the partitioning of each compound, as shown in log10KP values in Fig. 3A–C. The log10KP value of each aromatic monomer exhibited a monotonic increase as the polarity of the solvent system increased, and the solute partitioning showed consistent trends based on functional group identity across all feedstocks (Fig. 2). Generally, the monomer polarity decreases from S- to G-type compounds and increases as the aliphatic chain para to the phenolic group increases in length from methyl through propyl for both G- and S-type compounds, resulting in the following order for all compounds from non-polar to polar: propyl guaiacol > isoeugenol ≈ ethyl guaiacol ≈ ethyl phenol > propyl syringol > methyl paraben ≈ methylhydro ferulate ≈ methylhydro coumarate > propanol guaiacol > propanol syringol. Notably, the selectivity – defined as the ratio of partition coefficients – between isoeugenol and ethyl guaiacol is higher as the polarity of the solvent system increases.
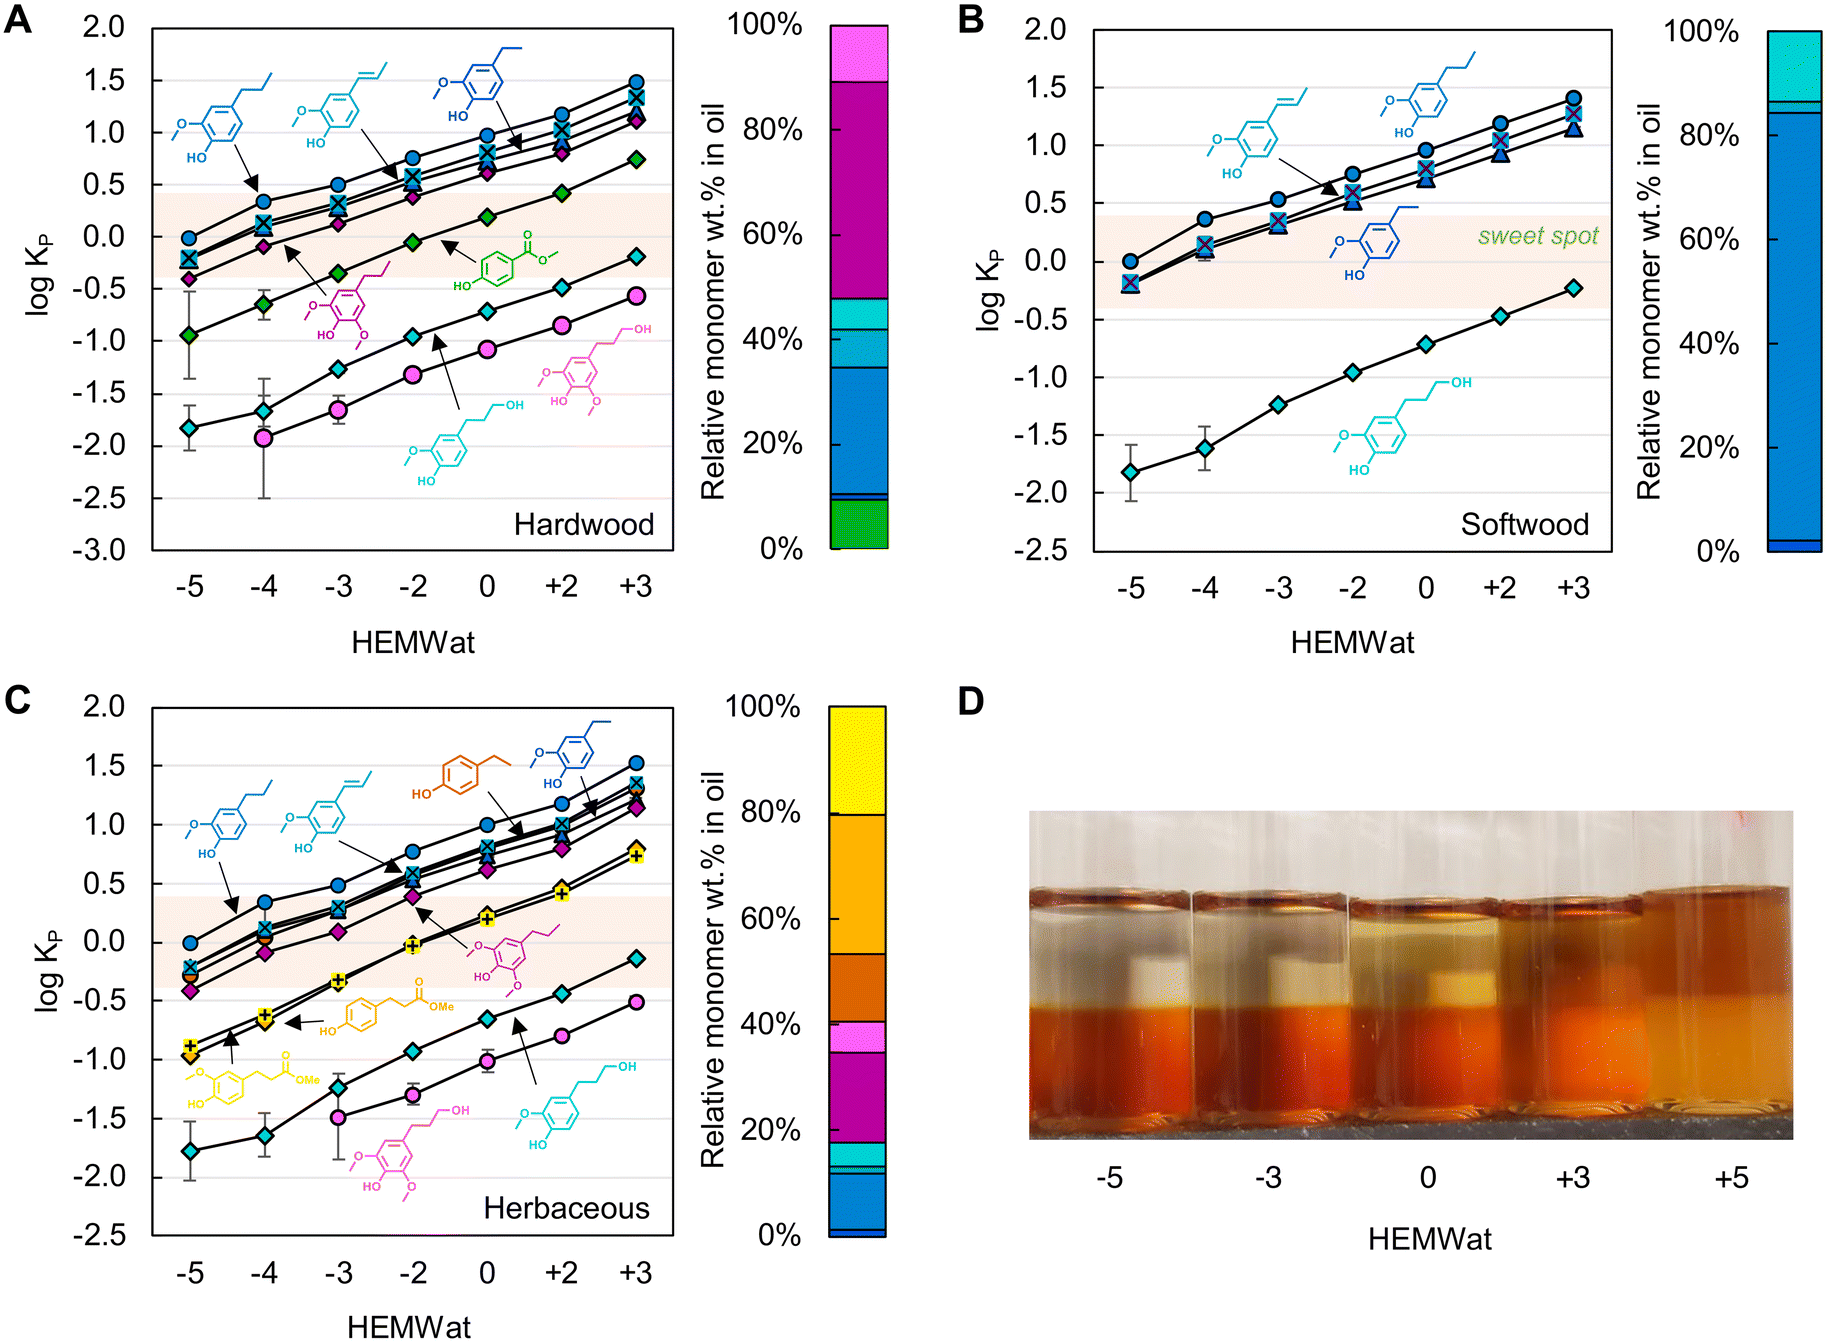 | ||
| Fig. 3 Log10 plots of partition coefficients (Kp) of aromatic monomers in synthetic mixtures of (A) hardwood, (B) softwood, and (C) herbaceous feedstocks among HEMWat solvent systems ranging from −5 to +3, and (D) the distribution of poplar lignin oil in select HEMWat solvent systems. The error bars were generated from the standard deviation of triplicate measurements. The right bar charts in panels A–C show the relative monomer composition of each oil, and the colors for each compound match that in Fig. 2. The quantitative data for panels A–C are available in Table S3.† | ||
As shown in Fig. 3A–C, most of the monomer log10Kp values in the HEMWat −3 solvent system are in the “sweet spot” range for CCC separations,24 where the log10KP ranges between −0.4 and +0.4, and thus this solvent system was selected to use for all three feedstocks to separate RCF monomers. The primary aromatic monomers outside this range are the propanol derivatives. It was also noted that this selection is consistent with Shen and Lehn's model prediction study34 using the conductor-like screening model for real solvents (COSMO-RS) that HEMWat −3 is a suitable solvent system to separate propyl syringol, ethyl syringol, and propanol syringol.
Additionally, the partitioning behavior of oligomers in various HEMWat solvent systems was investigated by conducting the shake flask test with poplar lignin oil, as shown in Fig. 3D. The oligomer KP values also likely increased with the polarity of solvent system as exhibited by the brown color in the lower phase and the upper phase color darkening as the polarity of the solvent system increased. However, the upper phase color was relatively clear in HEMWat −5 and −3, suggesting that HEMWat −3 is also an appropriate solvent system to separate monomers from oligomers. We recognize that this is a coarse visual measure of oligomer fractionation, but as shown below, the oligomers in all three RCF oils were readily separable from the monomeric compounds in the log10KP range of [−0.4, 0.4] with the HEMWat −3 solvent system (vide infra).
CCC separations of lignin oil
Following selection of a single solvent system, CCC separation was conducted on the three lignin oils using the HEMWat −3 solvent system in reverse phase mode (head-to-tail), which uses the lower phase as the mobile phase (Fig. 4). All injections were performed with a 2 mL sample loop at a concentration of 20 mg oil per mL after the column was equilibrated at the operating flow rate. To ensure the elution of all compounds, elution-extrusion CCC (EECCC) mode was used, whereby compounds still retained on the column after classical elution are extruded by entirely displacing the contents of the column with fresh stationary phase.29 Here, the elution volume at the start of EECCC mode is defined as VCM. In our separations, we initiated EECCC by pumping stationary phase into the column after 180 mL (referred to as VCM) of elution with the mobile phase. The detailed elution mechanism during EECCC was previously explained.29 No noticeable peaks were observed after propyl guaiacol elution.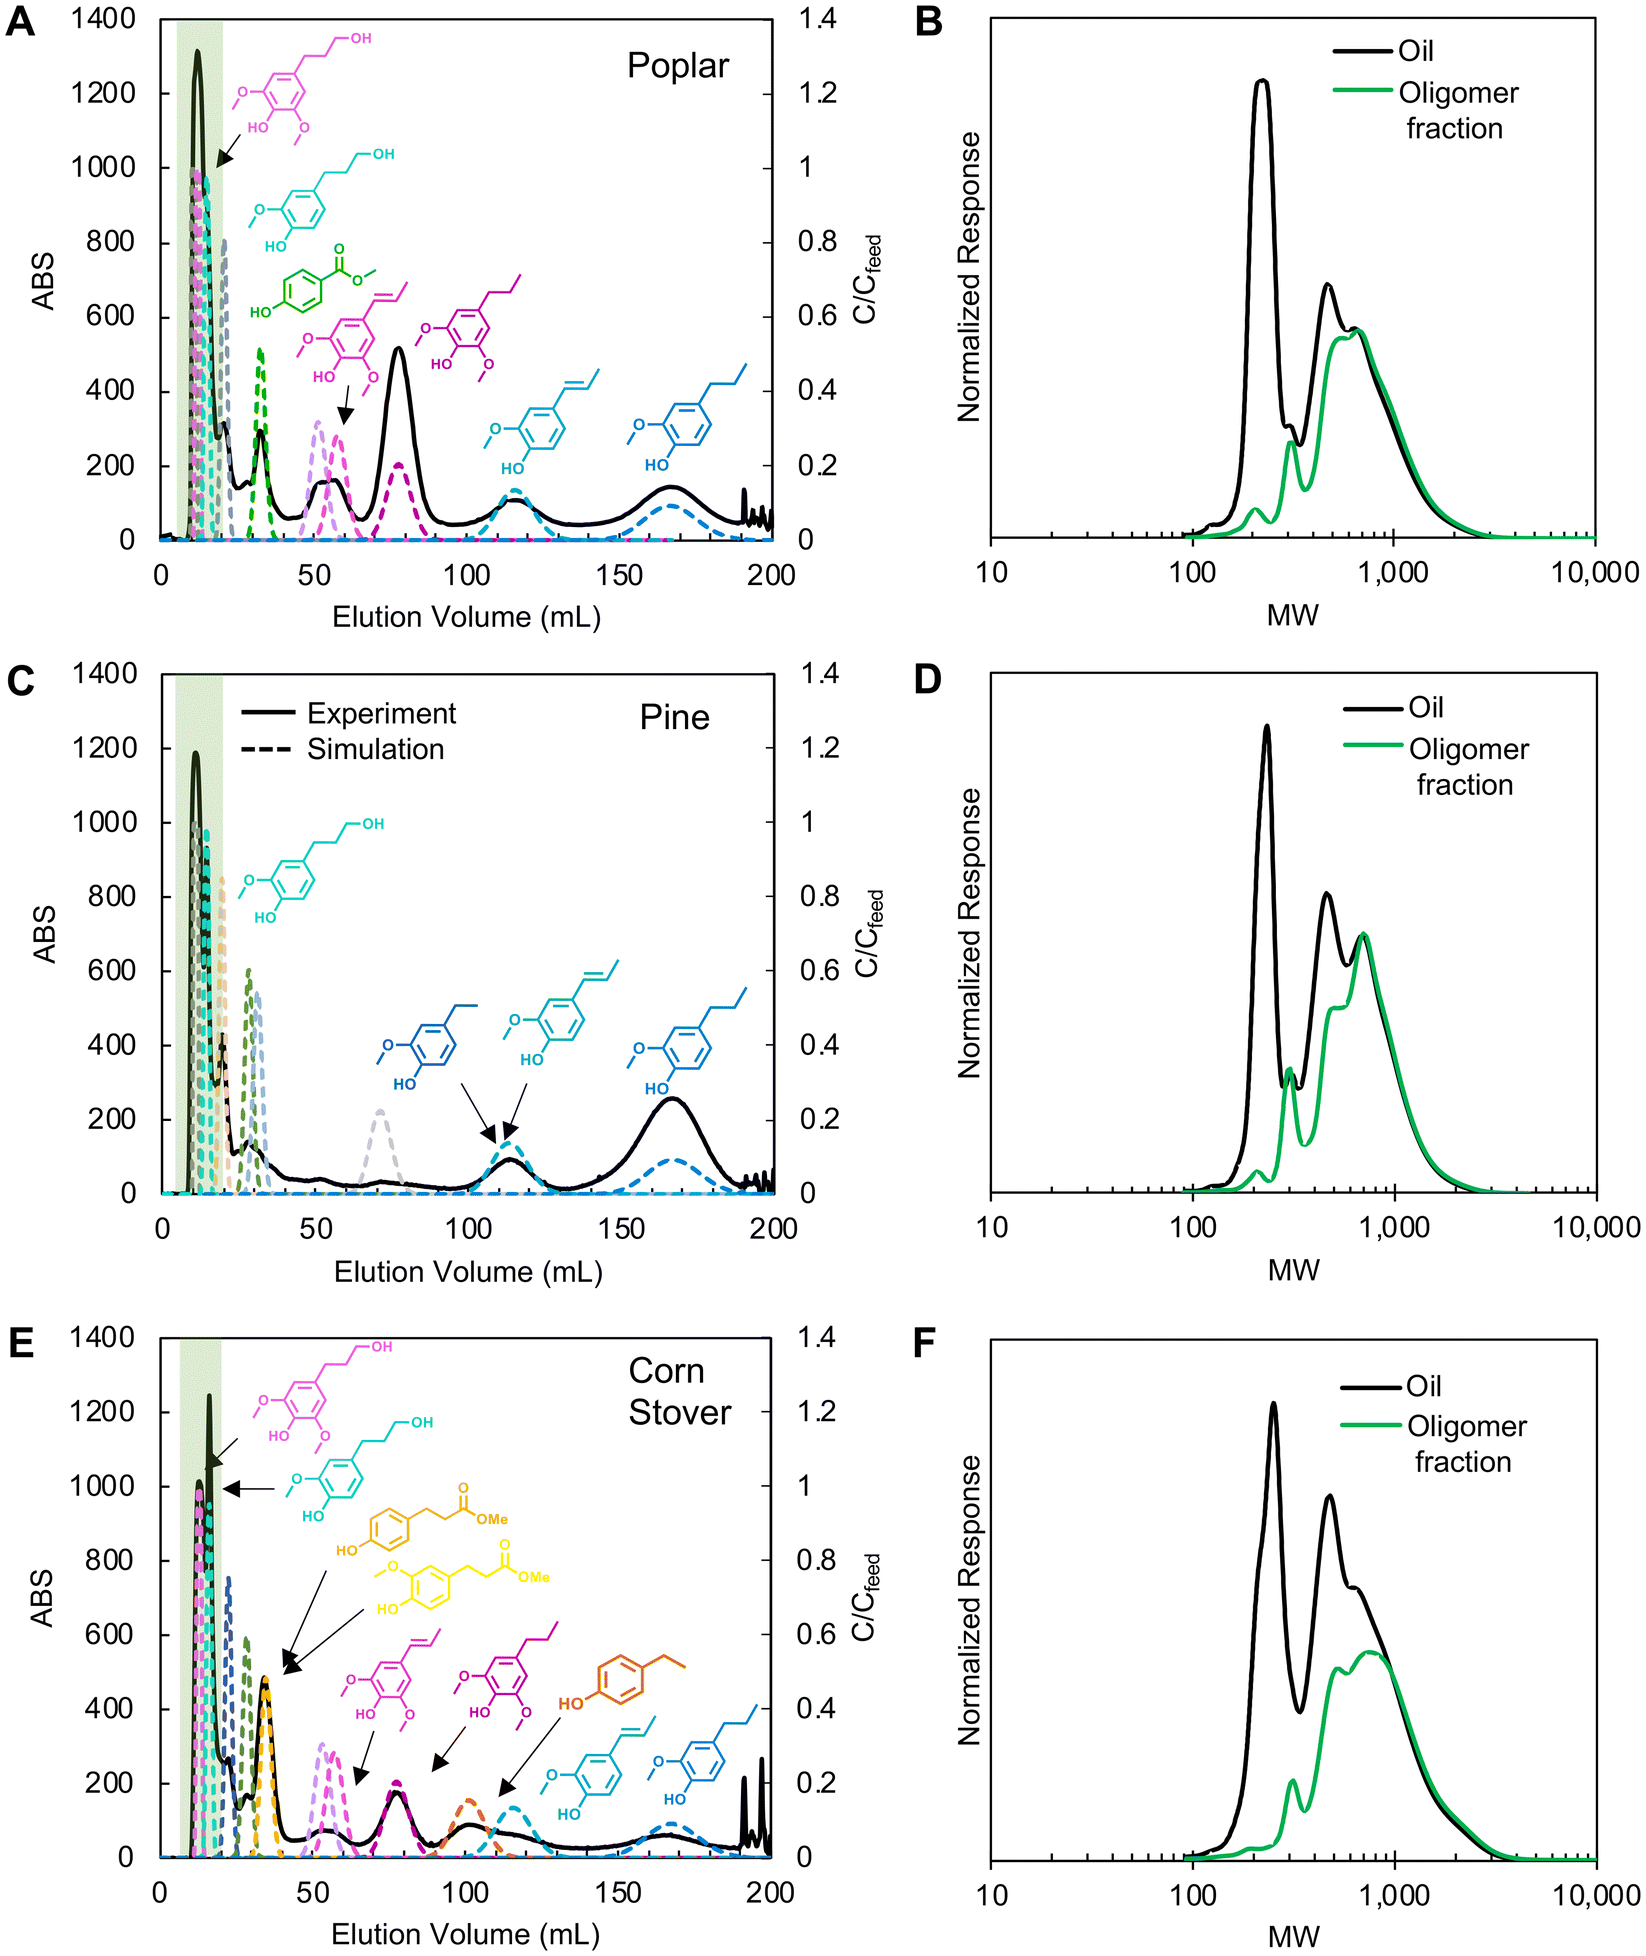 | ||
| Fig. 4 CCC chromatograms (left columns) of poplar, pine, and corn stover oils and GPC trace comparisons of lignin oils with oligomer fractions (right columns) separated by CCC: (A and B) poplar, (C and D) pine, and (E and F) corn stover. In CCC, the HEMWat −3 solvent system was used with the lower mobile phase (head-to-tail) at a rotor speed of 1400 ppm, 81 mL of column volume, 3 mL min−1, 2 mL of lignin oil (20 mg mL−1 each) was injected, and EECCC mode started at 90 min. The highlighted green areas in the CCC chromatograms indicate the oligomer fractions in the GPC analysis, shown in green on the right panels. Solid lines in CCC chromatograms are UV absorption data at 280 nm and the dashed lines are monomer concentration profiles from CUP model simulations based on partition coefficients optimized from the CCC traces. The simulation parameters are summarized in Table S4.† | ||
The first peaks in each trace (Fig. 4A, C and E) correspond to oligomer-rich fractions as evinced by the gel permeation chromatography (GPC) traces (Fig. 4B, D and F). Each GPC plot compares the first peaks against the injected oil, and in each case, the signal corresponding to monomers at 200–250 Da is significantly reduced in the oligomeric fractions.
Partition coefficient measurements provide a reasonable basis for identifying initial separation conditions; however, KP values were not able to predict retention times sufficiently and accurately in all cases because they do not account for matrix effects, high solute concentrations, or instrument characteristics. Although the co-elution of the propanol derivatives with the oligomers was consistent with the shake flask test results, showing a strong partitioning into the lower phase for both compounds, the remaining monomer elution profiles suggested that the actual partition coefficients were 30–40% lower than the values measured from the shake flask tests (Fig. S1†). Thus, we refined the partition coefficients based on compound peak retention time and stationary phase retention factor (Sf) by using the equation (eqn (S1)†) derived based on the solute movement theory.29 The KP values and simulation parameters are summarized in Table S4.† From these updated values, the CCC traces in Fig. 4A, C and E show updated CUP model traces for each compound as dotted line overlays and the corresponding new partition coefficient values were used in subsequent experiments.
Between the biomass sources, compounds displayed identical retention factors. Across all three experiments, the propyl guaiacol peak eluted after 170 mL of mobile phase delivery. Similarly, isoeugenol eluted at 115 mL, propyl syringol at 78 mL, propenyl syringol at 55 mL, and the propanol derivatives within the first 10–20 mL. All other identified monomers were unique to their corresponding biomass source and displayed retention times in the same order as expected from shake flask test partition coefficients. Methyl paraben, methylhydroferulate, and methylhydrocoumarate all exhibited similar partition coefficients in shake flask tests and displayed similar retention times in their corresponding experiments (33 mL elution). Ethyl guaiacol and ethyl phenol co-eluted with isoeugenol (115 mL) in poplar and pine oil separations, but ethyl phenol eluted before isoeugenol (100 mL) in corn stover oil separations.
CCC process optimization for monomer recovery
Using the results in Fig. 4 with the CUP model, we could optimize the CCC process for user-defined objectives such as optimizing the productivity for the isolation of a single monomer with high yield and high purity or maximizing the recovery yield of multiple compounds at a given purity.29 The required input parameters for the process optimization are feed injection volume, feed concentrations, partition coefficients of each compound, and the correlations among flowrate (F), stationary phase retention factor (Sf), and column efficiency (N) (Fig. S2†). We chose to vary F and elution volume before switching to column extrusion (VCM) since F and VCM were identified as key parameters affecting product yield and productivity.29Here, we selected the poplar lignin oil as an exemplary substrate to find the optimal VCM and F using the CUP model and conducted three optimization case studies. The first optimization (case 1) aimed to optimize the recovery yield and productivity of the most abundant monomer, propyl syringol, targeting >99% purity while the second optimization (case 2) aimed to recover >99% purity and yield of propyl syringol, isoeugenol (excluding negligible amount of ethyl guaiacol), and propyl guaiacol with the maximum productivity. In pursuing these specific goals, we expected case 2 to demonstrate superior separation of propyl syringol, isoeugenol, and propyl guaiacol from one another. The last optimization (case 3) was the same as case 2, but used a propyl-rich lignin oil to investigate the effect of feed composition on separation performance. The objective functions of the case studies are listed in Table S5.†
Contour plots of yield and productivity that guided our experimental conditions for case 1 and case 2 are shown in Fig. 5. In case 1, propenyl syringol has the smallest selectivity factor relative to propyl syringol at 1.42, which results in facile separation of the two monomers when VCM is higher than 46 mL – at which point the two compounds are resolved from one another on the column regardless of flowrate. As a result, increasing VCM after 46 mL has no effect on the yield and productivity at any given flowrate. However, increasing the flowrate higher than 15 mL min−1 decreases the yield of propyl syringol due to significant peak spreading and instrument limitations. Thus, the optimal flowrate and VCM were determined as 15 mL min−1 and 46 mL, respectively, indicated by the red asterisk on Fig. 5A and B. For case 2, since the selectivity factors of propyl syringol and propyl guaiacol relative to isoeugenol were 1.56 and 1.48, respectively, targeting isoeugenol introduces limits to the VCM value, while the flowrate was limited to meet the target yield of propyl syringol (Fig. S3†). Thus, the case 2 operating condition was determined as 14 mL min−1 and 90 mL for F and VCM, respectively, indicated by the red asterisks in Fig. 5C and D.
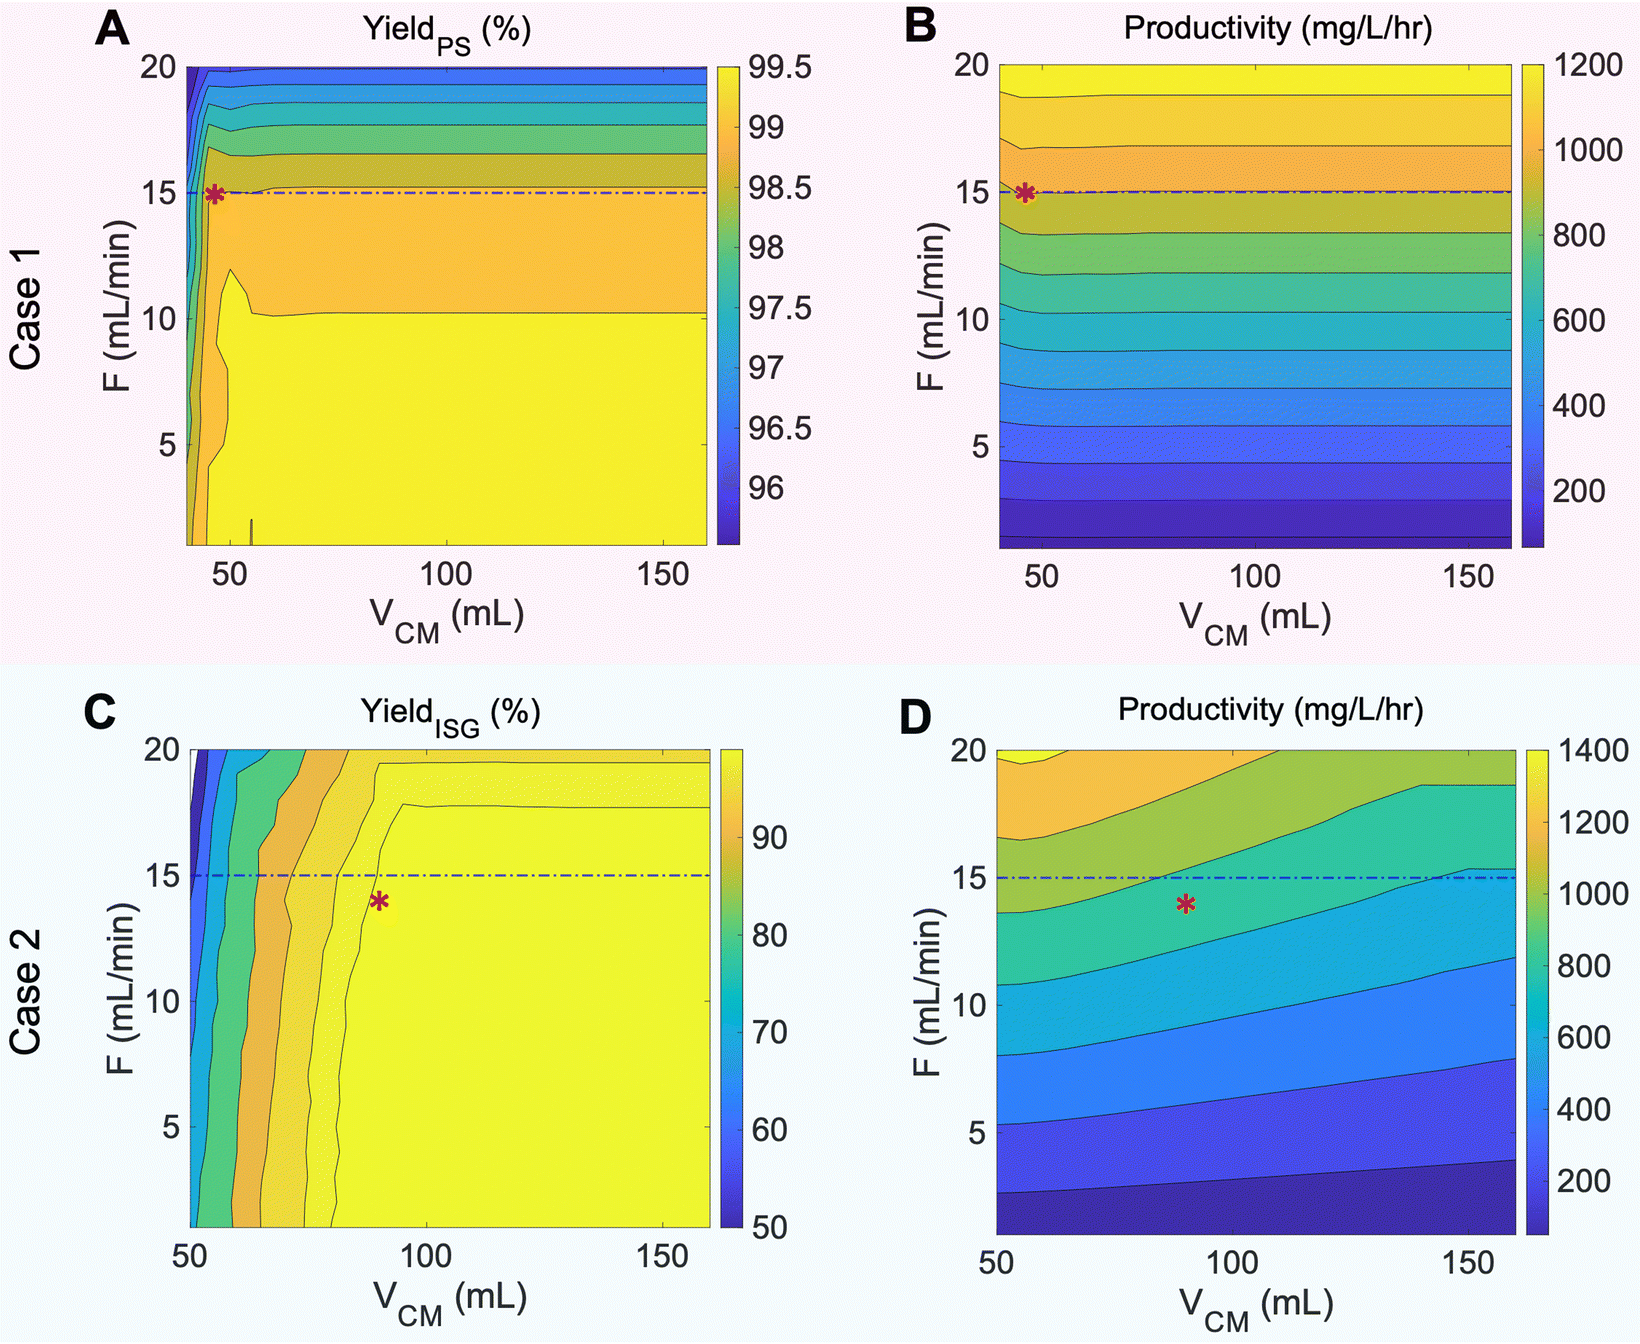 | ||
| Fig. 5 CUP model optimization for poplar lignin oil separation: contour plots of (A) the recovery yield of propyl syringol (PS), (B) productivity of propyl syringol and propenyl syringol, (C) the recovery yield of isoeugenol, and (D) productivity of isoeugenol (ISG), propyl syringol, and propyl guaiacol. Each plot has a corresponding scale color bar to the right. Asterisks on contour plots represent the chosen optimization operating conditions for case 1 and case 2, corresponding to 15 mL min−1 flow rate, 46 mL VCM and 14 mL min−1 flow rate, 90 mL VCM, respectively. Dashed line shows the maximum flowrate limited by column back pressure in our CCC instrument. | ||
Using these predicted operating conditions, the optimized CCC processes for poplar lignin oil for cases 1 and 2 were performed with a sample loading of 7.41% column volume at concentrations of 103 mg oil per mL solvent (i.e. 618 mg oil) to represent preparative-scale isolations. The resulting chromatograms and effluent trace analyses are shown in Fig. 6 with dashed lines representing predicted simulation profiles. All fractions corresponding to each compound were concatenated and analyzed by UHPLC.
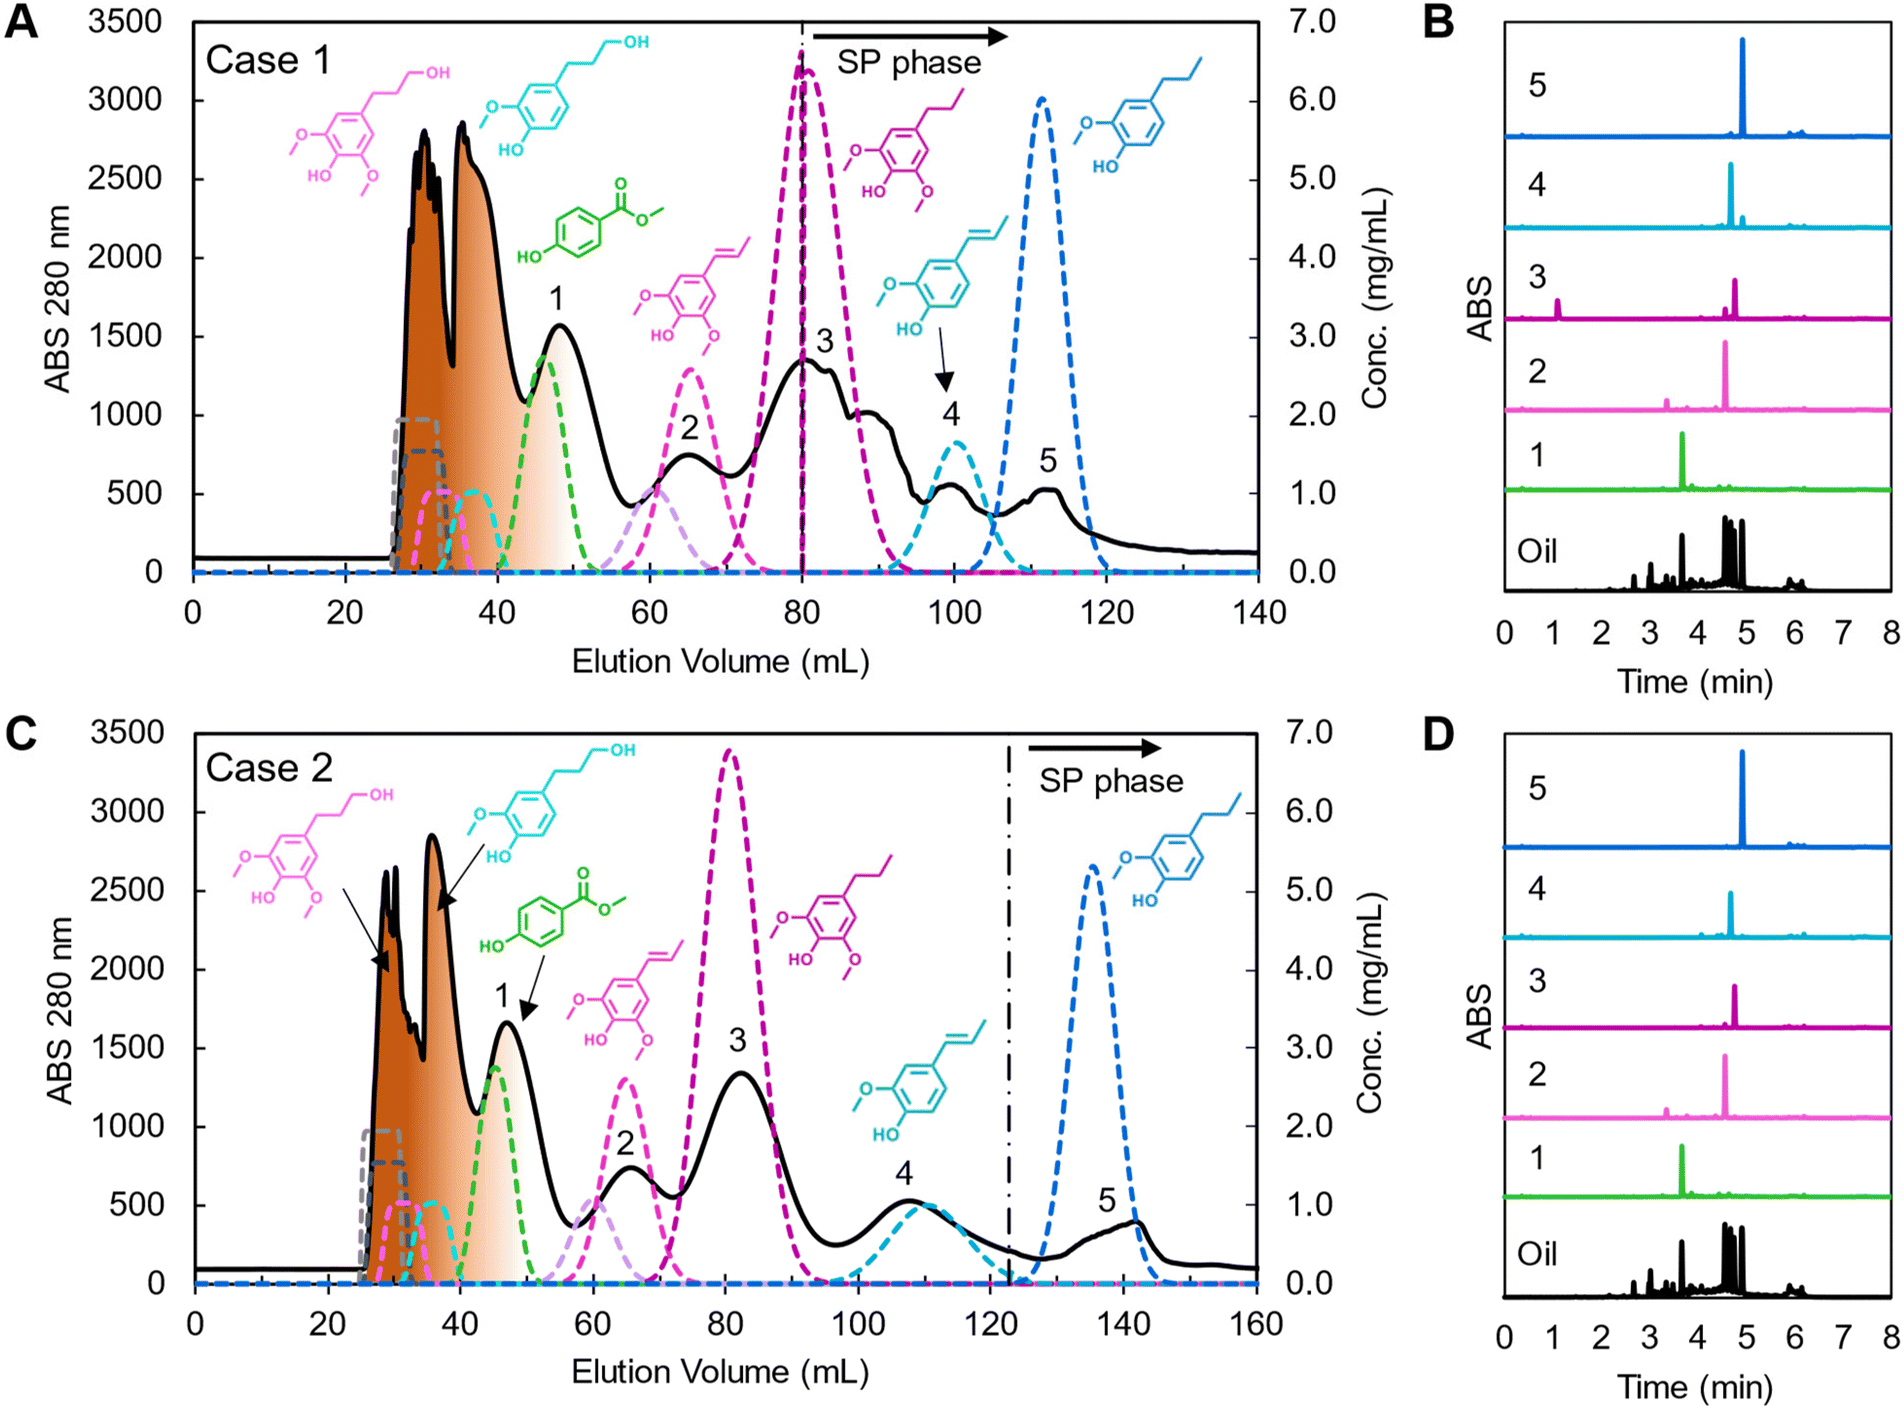 | ||
| Fig. 6 Poplar lignin oil separation using CCC with optimized conditions and UHPLC trace of labeled peak fractions in each chromatogram for (A and B) case 1 and (C and D) case 2. In the CCC chromatograms, solid traces indicate experimental data, dashed lines are the predicted concentration profiles from the CUP model, and oligomers are depicted as brown coloration of the early peaks. The black dashed vertical lines indicate the end of mobile phase extrusion and start of stationary phase (SP). CCC operating condition: HEMWat −3 solvent system, head-to-tail flow direction, rotor speed 1400 rpm, feed concentration 103 mg lignin oil per mL, injection volume 6 mL, flowrate (A) 15 mL min−1 and (B) 14 mL min−1, and VCM to EECCC (A) 46 mL and (B) 90 mL, respectively. The detailed simulation parameters are listed in Table S4.† | ||
Case 1 showed good resolution between propyl syringol and propenyl syringol at the expense of other monomer purities (Fig. 6A, noted as 2 and 3, respectively). We collected approximately 3.2 mL of stationary phase in the oligomer fractions, likely due to the larger, more concentrated injection destabilizing the biphasic separation in the column. The loss in stationary phase retention, and thus efficiency, leads to the methyl paraben retention time deviating from the CUP model prediction and overlapping slightly with the oligomers. The mobile phase was fully displaced from the column in the midst of propyl syringol elution, leading to the non-Gaussian peak shape from 80 to 96 mL. While propyl syringol was mostly separated from propenyl syringol, isoeugenol and propyl guaiacol were not fully separated due to the extrusion beginning before the compounds were resolved on the column. The yield and purity of each monomer, summarized in Table 1, were calculated using eqn (S5) and (S6)† respectively by analyzing the collected peak fractions. Although many of the non-targeted compounds in this case show notable yield losses, the remaining masses are accounted for in adjacent fractions (Fig. S4†).
| a Experimental and analytical errors resulted in mass balance errors of ±7%. | ||||||||
|---|---|---|---|---|---|---|---|---|
| Case 1: focusing on separation of propenyl syringol and propyl syringol | ||||||||
| Product | Methyl paraben | Ethyl syringol | Ethyl guaiacol | Propenyl syringol | Isoeugenol | Propyl syringol | Propyl guaiacol | Total productivity (g L−1 h−1) |
| Yield | 104.7%a | 100.8% | 106.9%a | 81.5% | 73.5% | 95.8% | 88.5% | |
| Purity | 36.0% | 13.1% | 3.7% | 81.8% | 71.6% | 89.5% | 94.3% | 13.8 |
| Case 2: focusing on separations of propyl syringol, isoeugenol, and propyl guaiacol | ||||||||
| Yield | 104.2%a | 101.5%a | 96.9% | 84.9% | 99.3% | 94.6% | 98.4% | Total productivity (g L−1 h−1) |
| Purity | 33.4% | 11.9% | 6.9% | 76.7% | 71.5%a | 95.9% | 91.5% | 12.7 |
Case 2 showed a close relationship between experiment and prediction (Fig. 6C). In this case, the extrusion started 44 mL (3.36 min) later than in case 1. As a result, methyl paraben and propenyl syringol showed similar elution profiles to case 1, but only propyl guaiacol eluted with the extruded stationary phase. As predicted by modeling, propyl syringol, isoeugenol, and propyl guaiacol were fully resolved, achieving high yield and high purity as listed in Table 1 and seen in the traces of UHPLC analyses in Fig. 6D, noted therein as 3, 4, and 5, respectively.
Deviations of monomer yields and purities in both cases were attributed to a combination of coelution with other monomers and unknown impurities and the unique mass transfer rates of each monomer. Although the mass balance of each monomer was nearly 100% in each peak fraction, isoeugenol co-eluted with a small amount of ethyl guaiacol, which was not accounted for in the optimization. Peak boundaries were not accurately separated since effluent fractions were collected in 2.8 min intervals, leading to reduced purities (Fig. S5†). Additionally, minor losses of sample as vapors during solvent drying contributed to inaccuracies in the total mass of the sample. Lastly, the peak broadening of each monomer is different due to different mass transfer resistance properties. Our current models assume each compound has the same mass transfer rate and column efficiency (N) by using the median value among monomers. Despite this simplification, the model proved sufficient for process optimization.
We also conducted NMR spectroscopy of the isolated compounds to further demonstrate the purity of the obtained compounds (Fig. S6 and S7†). The spectra for propyl guaiacol, isoeugenol, propyl syringol, and methyl paraben obtained from case 2 are shown in Fig. 7 above the original oil subjected to separation. Similar to the UHPLC traces, all compounds show only minor to no impurity signals except for methyl paraben where we only obtained a 33.4% purity which is consistent with the NMR trace showing only low intensity and broad impurity signals. Isoeugenol shows sharper impurity signals at an intermediate purity of 71.5%, meaning the impurities can be attributed to a few monomers such as propyl guaiacol, propyl syringol, and ethyl guaiacol (Fig. S5C†).
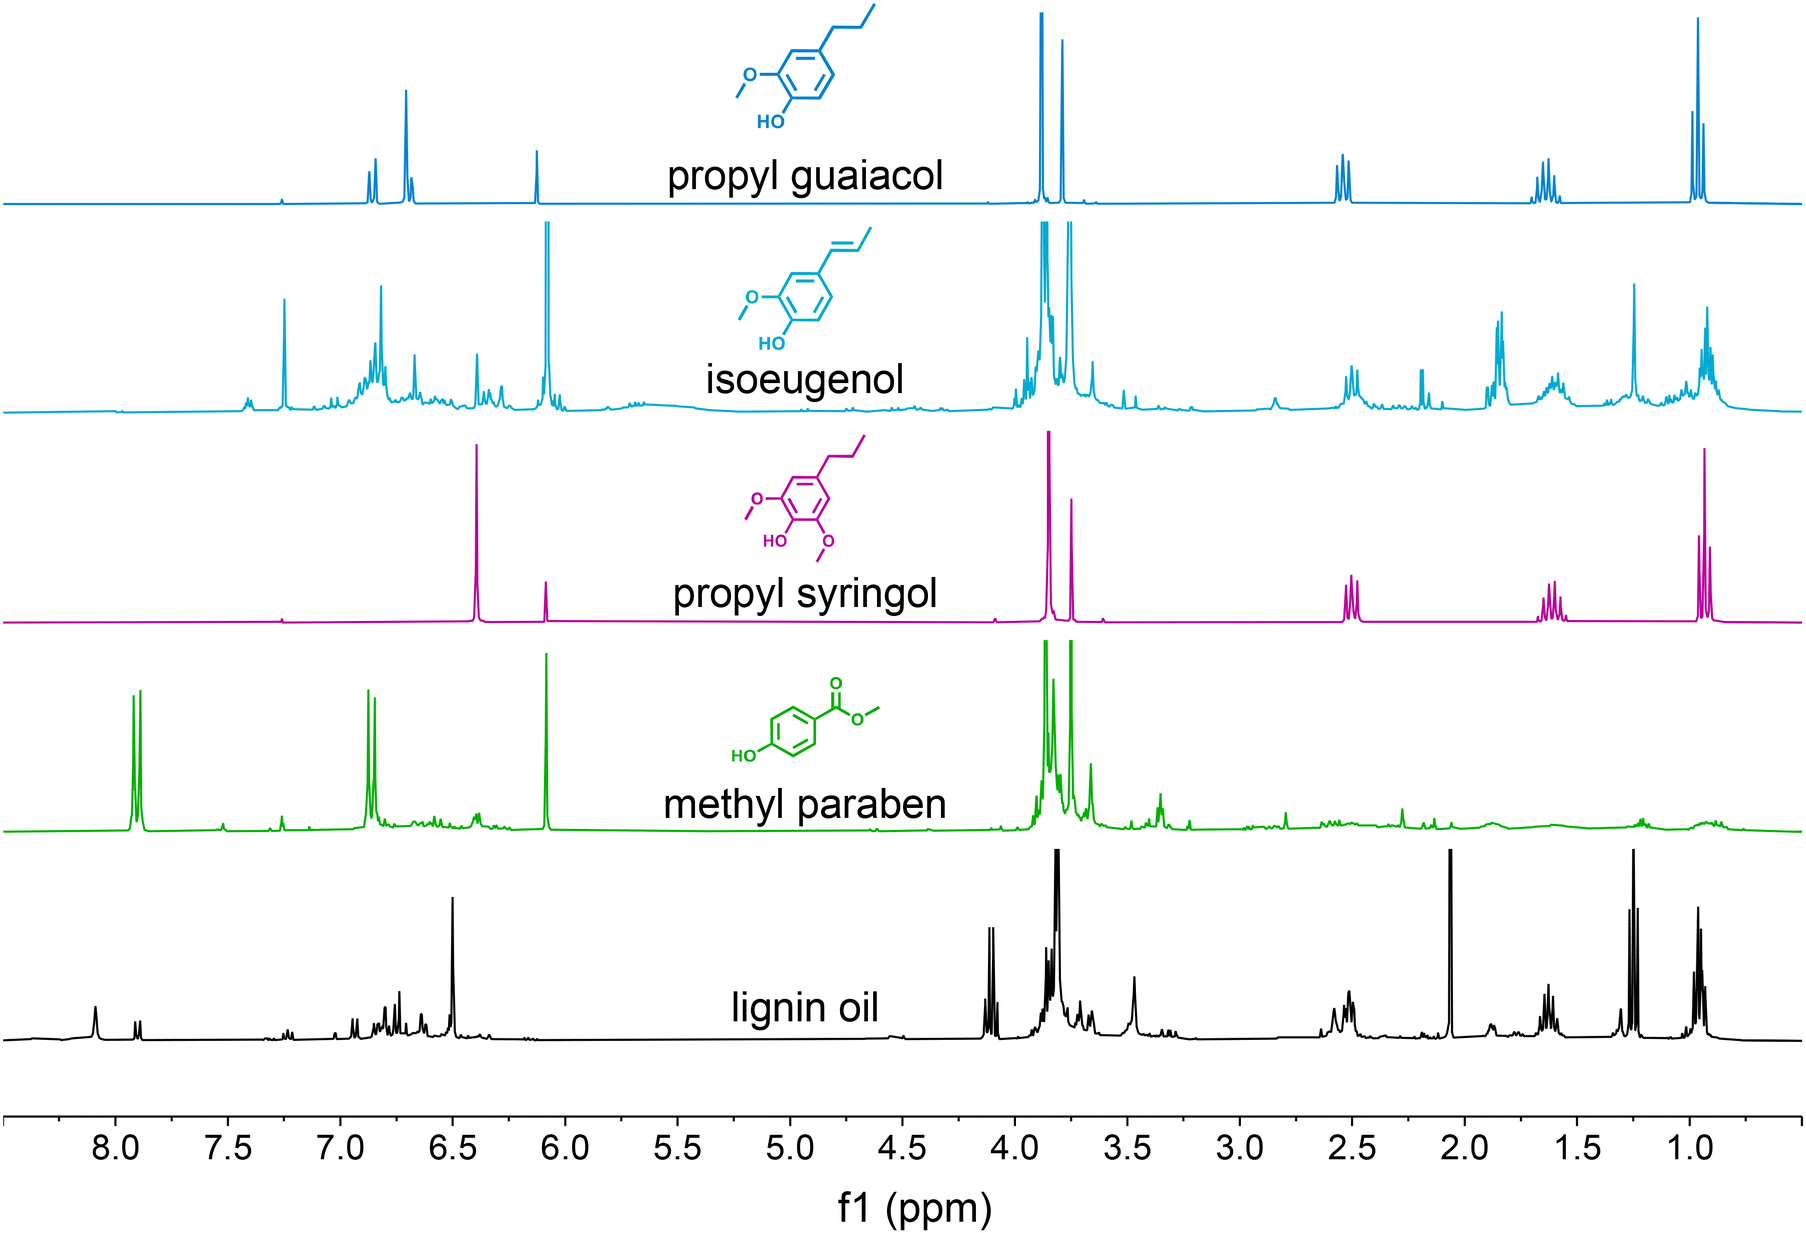 | ||
| Fig. 7 1H-NMR spectroscopy of monomer products in the case 2 CCC experiment. Additional NMR spectra are available in Fig. S6 and S7.† | ||
Effect of propyl-rich feed composition on CCC separation
As shown in the two case studies above, propanol guaiacol and propanol syringol were not effectively separated from the oligomers, suggesting that an oil with fewer propanol-substituted monomers and more propyl-substituted monomers would best leverage the optimized CCC separation with the HEMWat solvent system. Previously, we demonstrated that H2-free RCF using Pt/C and water/methanol mixtures produced an oil rich in monomers with propyl sidechains.35 The propyl-rich oil was prepared in a 300 mL mechanically stirred reactor under an inert atmosphere with 10 g of poplar, 1 g of 5 wt% Pt/C, and 150 mL of solvent (50![[thin space (1/6-em)]](https://www.rsc.org/images/entities/char_2009.gif) :50 v/v methanol/water). The propyl-rich oil was then demonstrated in CCC experiments as “case 3”. As shown in Fig. 8A, the portion of both propanol guaiacol and propanol syringol in the oil were reduced to 1.01 wt% and 0.88 wt% respectively, and isoeugenol and propenyl syringol were not detected. Conversely, propyl guaiacol and propyl syringol concentrations increased to 8.0 wt% and 17.3 wt% respectively, and thus the non-polar monomers from ethyl syringol to propyl guaiacol represented 93% of the total monomer content.
:50 v/v methanol/water). The propyl-rich oil was then demonstrated in CCC experiments as “case 3”. As shown in Fig. 8A, the portion of both propanol guaiacol and propanol syringol in the oil were reduced to 1.01 wt% and 0.88 wt% respectively, and isoeugenol and propenyl syringol were not detected. Conversely, propyl guaiacol and propyl syringol concentrations increased to 8.0 wt% and 17.3 wt% respectively, and thus the non-polar monomers from ethyl syringol to propyl guaiacol represented 93% of the total monomer content.
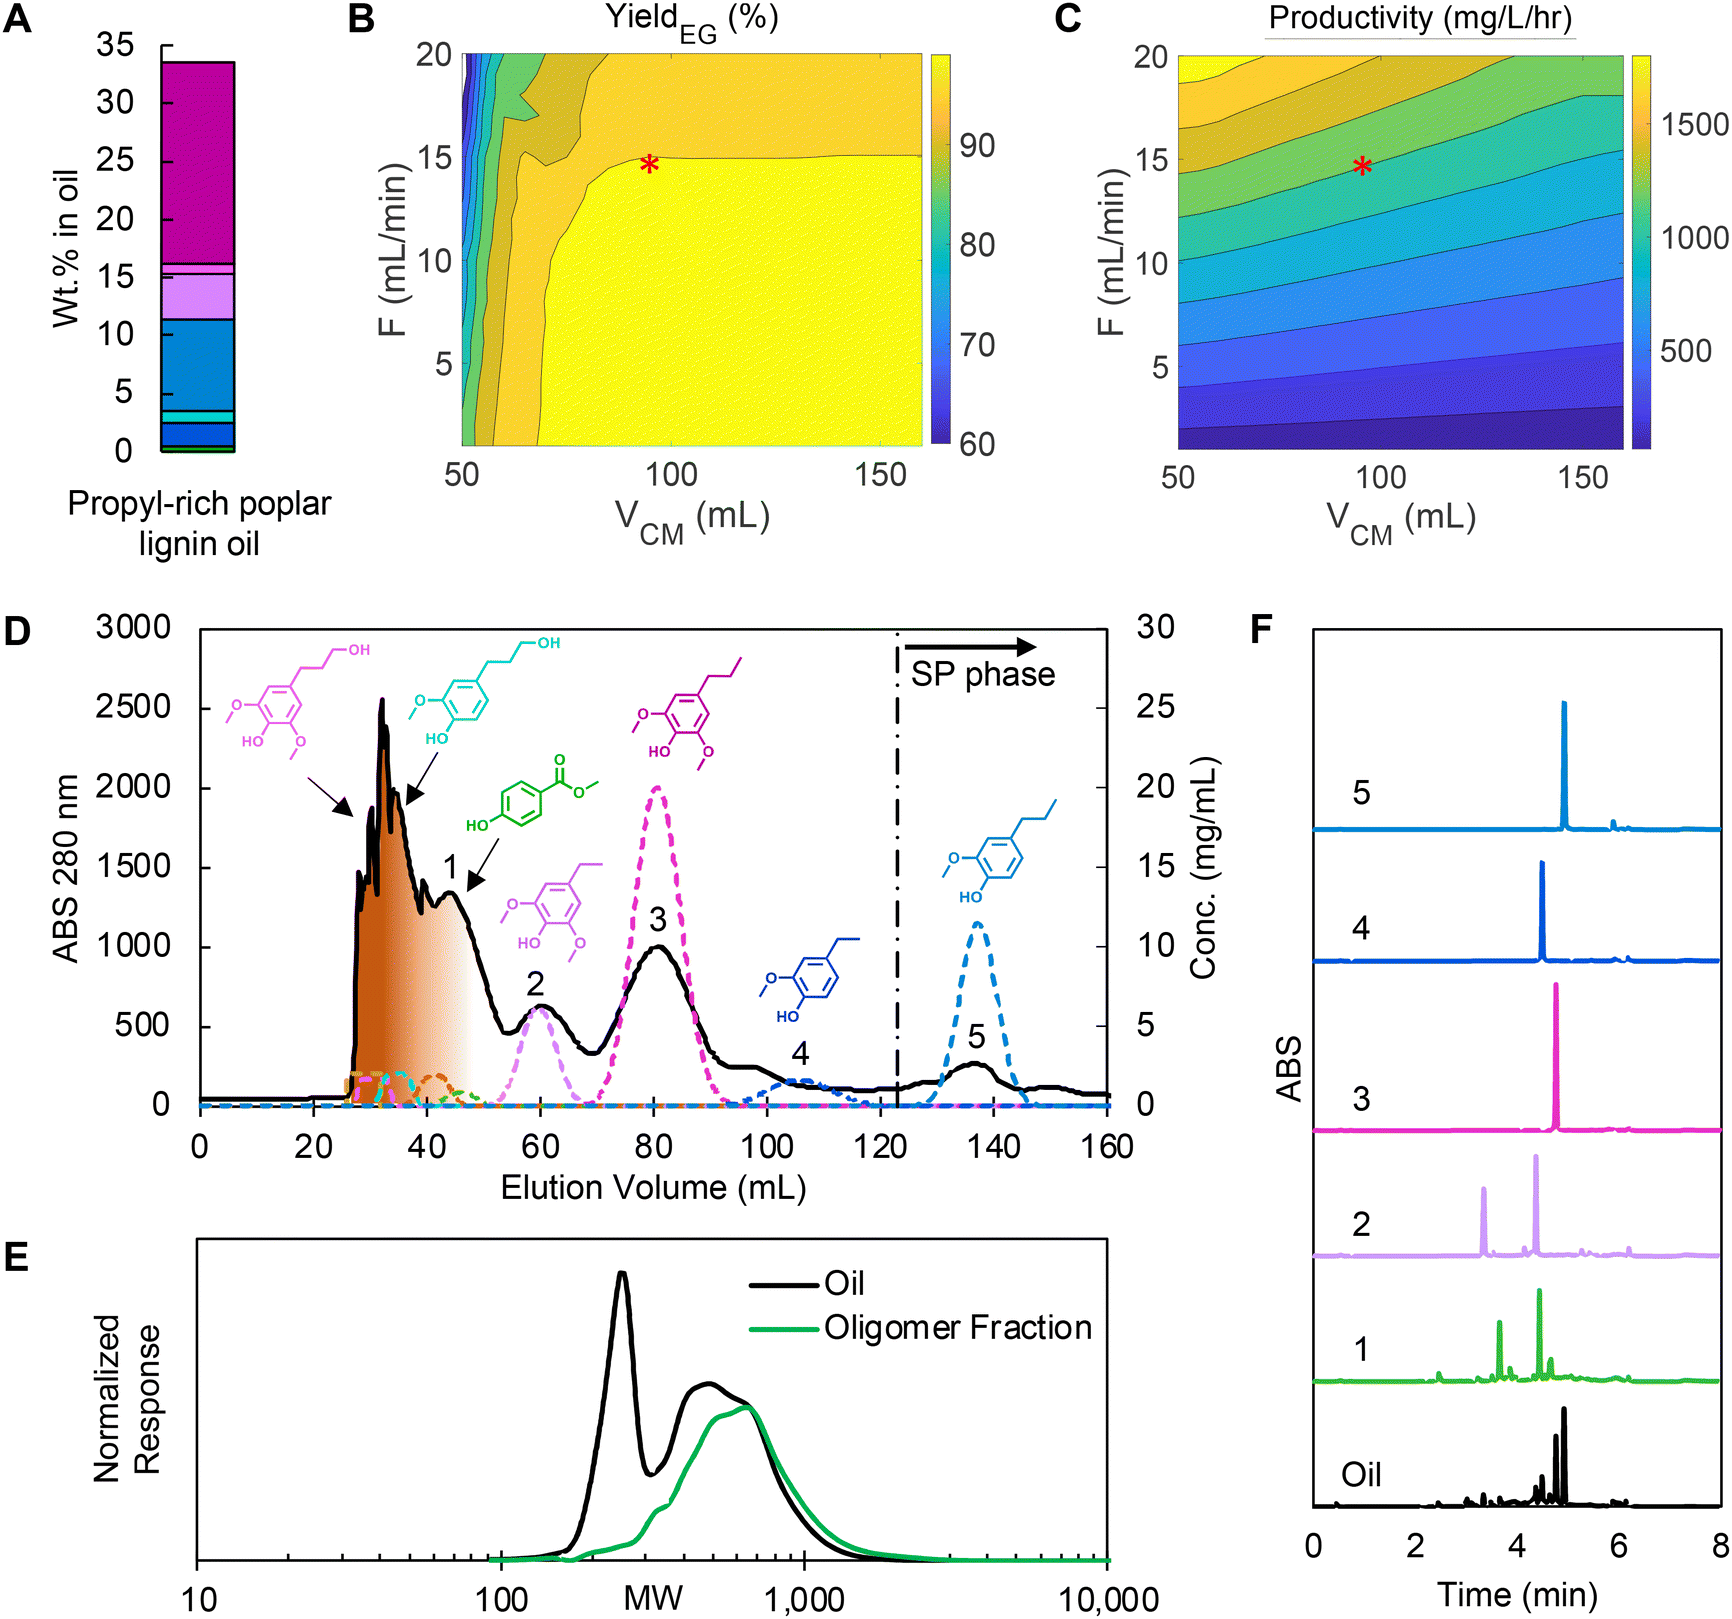 | ||
| Fig. 8 (A) Monomer composition in propyl-rich poplar lignin oil (colors for each compound match that in Fig. 2), (B) yield prediction of isoeugenol by varying VCM and flowrate, (C) productivity prediction of isoeugenol and neighboring pairs by varying VCM and flowrate, (D) CCC chromatogram of the optimized condition, (E) GPC data showing comparison of lignin oil (black) to oligomeric fractions (green), and (F) UHPLC trace analysis of labeled peak fractions in the CCC trace. RCF reaction conditions: 10 g of feedstock, 1 g of Pt/C (5 wt%), 150 mL of methanol/water (50:50 v/v), 225 °C, 1 bar of N2 (at room temperature), and 3 hours after a 30 minutes temperature ramp. CCC operating condition: HEMWat −3 solvent system, head-to-tail flow direction, rotor speed 1400 rpm, feed concentration 200 mg lignin oil per mL, injection volume 6 mL, flowrate 15 mL min−1 and VCM to EECCC 95 mL. The feed composition and simulation parameters are listed in Tables S2 and S4,† respectively. | ||
We applied the same optimization approach targeting high purity and yield for propyl syringol, ethyl guaiacol, and propyl guaiacol for the new oil as we used in case 2 (Table S5†) after recalculating the KP of each monomer from a test injection (Fig. S8†) to account for matrix effects. Overall, the non-polar monomer KP values displayed a 3–6% change relative to the previous experiments. Here, based on the KP values, the challenging separation was anticipated to be isolation of ethyl guaiacol from propyl syringol and propyl guaiacol (Fig. 8B and C). In this RCF oil, the attainable productivity increased 2.1-fold for >99% yield and purity compared to case 2 for two reasons: (1) the concentrations of the non-polar monomers were higher in the feed and (2) we could double the concentration of the feed injected due to the absence of isoeugenol and propenyl syringol, which were the primary co-eluting products targeted by the optimization process in cases 1 and 2.
The CCC separation (Fig. 8D) showed that oligomers were separated from monomers in the first peak as shown in GPC trace (Fig. 8E) and most peaks matched well with the predictions, except ethyl guaiacol. Unlike other monomers, the retention time of ethyl guaiacol was shorter than expected and thus overlapped with propyl syringol. Recently, Gerigk et al. showed that increasing concentrations of a solute eventually leads to non-linear changes to the partition coefficient,36 and we hypothesized ethyl guaiacol is more sensitive compared to the other monomers in this regard. We observed this trend in high feed loading tests (Fig. S9†) as well.
We observed high yields and purities for the target compounds in this experiment, as summarized in Table 2 and conveyed by the clean UHPLC traces (Fig. 8F) and 1H NMR spectra (Fig. S10 and S11†). The yields and purities of methyl paraben and ethyl syringol were lower than predicted due to residual oligomers and other impurities that were not accounted for in the modeling. Nevertheless, the CUP model accurately predicted increases to total productivity, with the experimental value increasing 2.2-fold in case 3 compared to case 2. The average monomer purity was 89.7% in case 3, which was considerably higher than in case 2 (56.6%). The high productivity and purities were mainly attributed to the 41.5% higher content of non-polar monomers in the lignin oil and the doubled feed concentration. The normalized productivity with feed concentration for the target monomers increased by 46.2% in case 3 solely due to using a propyl-rich feed, demonstrating that upstream process design can significantly improve the separation efficiency.
| a Experimental and analytical errors resulted in mass balance errors ±7%. | ||||||
|---|---|---|---|---|---|---|
| Case 3: focusing on separations of propyl syringol, isoeugenol, and propyl guaiacol | ||||||
| Product | Methyl paraben | Ethyl syringol | Ethyl guaiacol | Propyl syringol | Propyl guaiacol | Total productivity (g L−1 h−1) |
| Yield | 104.7%a | 91.1% | 75.5% | 99.6% | 106.3%a | |
| Purity | 6.4% | 60.3% | >99.0% | 98.7% | >99.0% | 28.3 |
Discussion
This work demonstrates that CCC can be used for monomer–monomer and monomer–oligomer separations for multiple lignin oils derived from RCF. Non-polar aromatic monomers can be separated from one another and oligomers simultaneously and effectively with high yield (∼84–99%) and purity (∼73–99%) using the HEMWat −3 solvent system. Using a high concentration propyl-rich feed tailored to the separation, we achieved monomer yields ranging from 75.5 to 99% with purities of 60.3 to 99%, at a productivity of 28.3 g L−1 h−1.CCC-based separation approach is in the early stages of development and has several opportunities for further improvement. The results in Fig. 4 suggest that finding an improved solvent system could achieve higher monomer purity. Notably, the monomer–oligomer separation would improve with upper layer solvents that exhibit a lower solubility of dimers and trimers. Similarly, monomer–monomer separations could be improved with solvents that have higher selectivity among monomers of similar polarities. Another approach is to explore other solvent systems with modifiers, such as pH gradients or salt modifiers, considering that the oils are often pH-sensitive and the oligomer chain/chain interactions are significantly affected by salts. Considering solvent recovery, identifying low-boiling point, low viscosity, and low toxicity solvents will be optimal for process viability.
Since the separation is impacted by feed composition, catalyst selection and reaction conditions can directly influence the ability to recover aromatic monomers, especially with respect to the propanol-substituted RCF products. Reducing the content of the propanol-substituted monomers here led to higher monomer recovery. If polar monomers need to be recovered from oligomers with the HEMWAT −3 system, an additional separation would be required with a polar solvent system as shown in shake flask tests in Fig. 2. Additionally, comparing cases 2 and 3 showed the importance of increasing feed loading to maximize productivity. In our study, elution times were invariant up to high feed loadings of 60% w/v oil injections as shown in Fig. S9.† Thus, a large feed loading either with a large injection volume or high concentration will be desired to reduce the operating cost and energy duty on separations.
As a chromatographic technique, batch mode CCC provides purified products that are diluted two to five times relative to their feed concentration, depending on retention in the column. The product dilution results in large solvent consumption and high energy duty for the subsequent solvent recovery. To overcome product dilution, the product concentration needs to be increased while minimizing solvent consumption, which requires increasing the feed concentration and reducing the solute retention time. Accordingly, the injection feed should be concentrated as demonstrated in Fig. S9† where a high feed loading up to 60% w/v was possible, although the monomer partition coefficients were affected as the loading concentration increased. Additionally, monomer–monomer separation for high purity monomers requires large solvent consumption as shown in case 2. Thus, if recovering a monomer mixture is sufficient for value-added applications, a continuous operating mode can be employed to minimize the elution time and reduce the solvent consumption by a factor of 5–10 fold, which we will pursue in future work.
Various strategies for the isolation of monomers and oligomers from lignin oils obtained from reductive catalytic fractionation have been previously developed. Distillation has been traditionally applied for monomer recovery.12 Organic solvent nanofiltration (OSN) has also been recently studied for lignin oil fractionation.14,16 OSN rejects high molecular weight oligomers in the retentate and recovers monomers in the permeate. Recently, Croes et al. reported that some OSN membranes can achieve 83.5 to 88% purity monomer mixture or as high as 94% pure when using a two-stage filtration system.16 Although OSN has shown efficient oligomer rejection, the monomer loss ranged from 13% to as high as 83.5% depending on the selection of membrane and operating conditions. Additionally, OSN was not able to separate monomers from each other. Liquid–liquid extraction (LLE) with ethyl acetate or dichloromethane and water has been widely used to recover lignin oils and concentrate monomers after RCF reactions.16,27,37,38 Recently, a sequential LLE approach was reported for separating monomers from oligomers.8 This was performed by decreasing the polarity of the organic solvent phase with different ratios of heptane and ethyl acetate during multiple extraction steps. Lastly, acid–base mediated crystallization has been studied by Ren et al. to isolate propyl syringol and propyl guaiacol, yielding high recovery rates between 82.3 to 85.1% with purities ranging from 88.4 to 96.4%.17 Each of these methods can be coupled with CCC as either upstream or downstream purification stages to improve overall outcomes. In particular, upstream membrane filtration can provide a monomer-rich feed and improve the purities of methyl paraben and both propanol derivatives. Membrane filtration can also be used for the solvent recovery to reduce the energy duty on distillation. However, since the filtration often requires sacrificing the monomer recovery yields, it is critical to select an optimal membrane or improve membrane performances to have a high selectivity of monomers against oligomers.
Although this study demonstrated the use of CCC for lignin oil separations, techno-economic analysis (TEA) and life-cycle assessment (LCA) of the full downstream process including product and solvent recovery will be required to evaluate the feasibility of using CCC in comparison to other separations, such as distillation or membrane filtration. Understanding the impact of TEA and LCA on the downstream process can provide important criteria in the selection of a solvent system and elution conditions to reduce cost.
In summary, CCC shows significant benefits in high yield and purity separations of lignin oils. To our best knowledge, this is the first reported example of concomitant monomer–oligomer and monomer–monomer separations of RCF lignin oil using liquid–liquid chromatography, which could not have been achieved by any other unit operation or would have taken multiple unit operations in series to achieve monomer purification and separation from the oligomer fraction. CCC is versatile in handling various types of lignin oils by tuning the polarity of the solvent system. Because of the liquid stationary phase, CCC can handle solids in feed, meaning that there is no need for difficult upfront filtration of lignin oils and has no fouling issues like membranes or adsorbents, meaning high monomer yield recoveries can be achieved as no irreversible adsorption can occur on the stationary phase, providing great promise for utilizing lignin.
Materials and methods
Chemicals
Propanol guaiacol, propanol syringol, and ethyl syringol analytical standards were purchased from Ambeed. Inc. All other chemical reagents were purchased from Sigma-Aldrich and used without further purification.Biomass substrate
Biomass feedstocks of poplar, pine, and corn stover used in this study were provided by Idaho National Laboratory. Hybrid poplar (INL 2021 poplar) was harvested in Morrow County, OR. Pine was harvested in Jasper County, SC. Corn stover was harvested in Boone, IA. All biomasses were knife milled through a 2 mm screen Thomas Scientific Wiley Mill.39Lignin oil production
RCF experiments were conducted in a 75 mL magnetically stirred batch reactor (Parr 5000 series). The vessels were loaded with 3 g of feedstock, 0.3 g of 5 wt% Ru/C, and 30 mL methanol. The vessels were purged with 80 bar of He three times and subsequently pressurized with 30 bar of H2. Once the reactor pressure was equilibrated, the vessels were heated to 225 °C for 30 minutes. After 3 hours of reaction at 225 °C, the vessels were quenched in an ice bath and depressurized. The reaction mixture was then vacuum filtered using a filter funnel with a 10 μm polyethylene frit. The solid residue retained in the filter funnel was washed with 30 mL methanol. The methanol used for washing was filtered and added to the filtrate from the initial reaction mixture. The collected filtrate was filtered again through a 0.2 μm filter and dried using rotary evaporation.To extract lignin from the resulting oil, liquid–liquid extraction was performed with 10 mL of DI water and 10 mL of ethyl acetate. The water fraction underwent sequential extraction with 10 mL ethyl acetate three times. Sodium sulfate was added to the combined ethyl acetate fraction to remove remaining water. Subsequently, the ethyl acetate was removed by rotary evaporation, resulting in lignin oil.
To prepare the propyl-rich lignin oil, a 300 mL mechanically stirred batch reactor (Parker Autoclave Engineers) was used. The reactor was filled with 10 g of hybrid poplar, 1 g of 5 wt% Pt/C, 75 mL DI water, and 75 mL methanol.35 After purging with N2, the pressure of N2 was reduced to ∼1 bar. The reaction was conducted at 225 °C for 3 hours after a 30 minutes heating ramp. The resulting reaction mixture was subjected to filtration, washing, solvent removal, and liquid–liquid extraction, as previously described, to produce propyl-rich lignin oil.
Partition coefficient measurements
A series of 4 mL vials were prepared representing each of the lignin oils in each of the seven HEMWat solvent system ratios to be tested (Table S1†), amounting to 21 samples. We added quantities of the monomers proportional to the concentrations found in the oil analyses (Table S2†). In separate vials, solvent mixtures were prepared by mixing the appropriate proportions of each solvent, sealing the vials, agitating them such that emulsions are formed, and allowing the phases to settle for 5 minutes. The solvent systems were considered sufficiently mixed after three cycles of mixing and settling. Once the layers were allowed to settle for 15 minutes, 2 mL of each layer of the corresponding solvent system were added to each corresponding vial of monomers. Each sample was sealed and agitated to facilitate biphasic partitioning as described during solvent system preparation. Once the samples were allowed to settle, UHPLC samples were prepared from each layer with 10× dilution into methanol and subjected to quantitative analysis.CCC operation
CCC was performed using a Spectrum Series 1000 (Dynamic Extractions) with a semi-preparative column, which is perfluoroalkoxy tubing (o.d. 6 mm and i.d. 4 mm bore) wound around a bobbin. The column volume was 81 mL, and the maximum flowrate was 15 mL min−1 under the column back pressure limit of 250 psi. A chiller connected to the CCC kept the chamber maintained at 25 °C during operation. A selection of reservoirs of the mobile and stationary phase, a sample injection, and a flow direction were controlled by VICI 6-port switching valves as previously reported.29 A Tosoh Octave 100 UHPLC pump was used to pump solvent into the CCC. The effluents were monitored by a diode array detector (ECOM, TOY18DAD) and then periodically collected in a fraction collector (ECOM, ECF2096). The HEMWat −3 (6/4/6/4) solvent system was prepared in a separatory funnel and then each layer was separately stored in the corresponding CCC reservoir. In all operations, before lignin oil separations, a dynamic equilibrium of CCC was reached by rotating the CCC rotor at 1400 rpm and then pumping the lower phase as the mobile phase into a column that was previously filled with the upper phase (stationary phase). The displaced stationary phase was collected into a graduated cylinder during mobile phase equilibration. The operating conditions for each experiment are summarized in Table S4.† To obtain correlations among flowrate, column efficiency (N) and the stationary phase retention factor (Sf), five pulse tests of ethyl guaiacol were conducted at varying flowrates using the HEMWat −3 lower phase as the mobile phase. N and Sf were calculated from the ethyl guaiacol peaks by following the same methods as reported.29To quantify the recovery yields and purities of isolated monomers, the fractions corresponding to each compound were determined by the UV-Vis trace of the CCC effluent and were sampled for UHPLC quantification. Once the identities of the compounds present in each peak were confirmed by UHPLC, the fractions were pooled and concentrated using a stream of N2 gas. The solutions were dried to a constant mass and weighed a final time to obtain the total residue weight. With the weight noted, the solutions were diluted with methanol to 10 mL in a volumetric flask and then submitted to UHPLC analysis. The methanol was then removed by evaporation with N2 gas stream again to generate samples for NMR analysis.
Quantification of RCF monomers using ultra high-performance liquid chromatography
Lignin oils and CCC effluents were analyzed by utilizing an Agilent 1290 series UHPLC (Agilent Technologies) coupled with diode array detection (DAD). A volume of 1.0 μL of samples and standards were injected onto a Phenomenex Luna 2.5 μm, 2 × 100 mm C18(2)-HST column held at 35 °C. Separation was carried out utilizing mobile phases consisting of (A) 0.2% formic acid in water and (B) acetonitrile at a constant flow rate of 0.5 mL min−1. The following gradient was used for separation: 0–0.5 min A: 95% and B: 5%, then changed to A: 72% and B: 28% using a linear gradient until 2.4 min, and then changed to A: 40% and B: 60% using a linear gradient until 4.0 min. This was held from 4–5.2 min. From 5.21–6.5 min A: 95% and B: 5% was maintained before returning to the initial conditions at 6.51 min and held for a total run time of 8.0 min to allow for column equilibration. Analytes monitored for were guaiacol, 4-methylguaiacol, 4-ethylguaiacol, 4-propylguaiacol, 4-propanolguaiacol, isoeugenol, syringol, 4-ethylsyringol, 4-propylsyringol, 4-propanolsyringol, 4-propenylsyringol, phenol, 4-ethylphenol, methyl paraben, 4-hydroxybenzoic acid, ferulic acid, methylferulic acid, methylhydro ferulic acid, p-coumaric acid, methylcoumaric acid, and methylhydro coumaric acid on DAD wavelength 280 nm with a linear quantitation range of 1 μg mL−1 to 500 μg mL−1 and an R2 coefficient of ≥0.995. A standard was analyzed every 10–20 samples to verify calibration consistency and detector stability.Gel permeation chromatography analysis
An appropriate amount of lignin oils or oligomer fractions were dried down to produce 15–20 mg of oil. Samples were then analyzed by GPC with a previously reported method.321H-NMR spectroscopy
All NMR spectroscopy experiments were performed on a Bruker Avance III 400 MHz spectrometer fitted with a 5 mm Prodigy BBO LN2 cryoprobe. A stock solution was prepared by adding 101.4 mg of 1,3,5-trimethoxy benzene followed by a small quantity of CDCl3 to a 10 mL volumetric flask. Once the internal standard is dissolved, the solution was diluted to the mark with more CDCl3. The chloroform solution containing internal standard was used to prepare NMR samples by adding 500 μL of the solution to the pooled and concentrated samples. Inversion recovery experiments were conducted to measure T1 relaxation rates for each signal and the acquired values were used to determine quantitative proton NMR relaxation delays. Relaxation delay (d1) for quantitative 1H acquisitions were set to at least 7 times the longest T1 of interest.Conflicts of interest
There are no conflicts of interest to declare.Acknowledgements
This work was authored by the National Renewable Energy Laboratory, operated by Alliance for Sustainable Energy, LLC, for the U.S. Department of Energy (DOE) under Contract No. DE-AC36-08GO28308. Funding provided by U.S. Department of Energy, Energy Efficiency and Renewable Energy Office, Bioenergy Technologies Office (BETO) under the BETO Bioprocessing Separations Consortium via Contract No. DE-AC36-08GO28308, and also by BETO under Contract No. DE-EE0009767. This material is also based on work supported by the Center for Bioenergy Innovation (CBI), U.S. Department of Energy, Office of Science, Biological and Environmental Research Program under Award Number ERKP886. The U.S. Government retains and the publisher, by accepting the article for publication, acknowledges that the U.S. Government retains a nonexclusive, paid-up, irrevocable, worldwide license to publish or reproduce the published form of this work, or allow others to do so, for U.S. Government purposes. The authors acknowledge the support of Gayle Bentley at BETO. We thank Lauren Valentino at Argonne National Laboratory for her leadership of the Separations Consortium. We also thank Dynamic Extractions for technical support and Lisa Stanley for running the GPC analyses. The views expressed in the article do not necessarily represent the views of the U.S. Department of Energy or the U.S. Government.References
- R. Rinaldi, R. Jastrzebski, M. T. Clough, J. Ralph, M. Kennema, P. C. Bruijnincx and B. M. Weckhuysen, Angew. Chem., Int. Ed., 2016, 55, 8164–8215 CrossRef CAS PubMed.
- T. Renders, S. Van den Bosch, S.-F. Koelewijn, W. Schutyser and B. Sels, Energy Environ. Sci., 2017, 10, 1551–1557 RSC.
- W. Schutyser, a. T. Renders, S. Van den Bosch, S.-F. Koelewijn, G. Beckham and B. F. Sels, Chem. Soc. Rev., 2018, 47, 852–908 RSC.
- Z. Sun, B. Fridrich, A. De Santi, S. Elangovan and K. Barta, Chem. Rev., 2018, 118, 614–678 CrossRef CAS PubMed.
- E. Cooreman, T. Vangeel, K. Van Aelst, J. Van Aelst, J. Lauwaert, J. W. Thybaut, S. Van den Bosch and B. F. Sels, Ind. Eng. Chem. Res., 2020, 59, 17035–17045 CrossRef CAS.
- Y. M. Questell-Santiago, M. V. Galkin, K. Barta and J. S. Luterbacher, Nat. Rev. Chem., 2020, 4, 311–330 CrossRef CAS PubMed.
- M. M. Abu-Omar, K. Barta, G. T. Beckham, J. S. Luterbacher, J. Ralph, R. Rinaldi, Y. Román-Leshkov, J. S. Samec, B. F. Sels and F. Wang, Energy Environ. Sci., 2021, 14, 262–292 RSC.
- K. Van Aelst, E. Van Sinay, T. Vangeel, E. Cooreman, G. Van den Bossche, T. Renders, J. Van Aelst, S. Van den Bosch and B. Sels, Chem. Sci., 2020, 11, 11498–11508 RSC.
- H. D. Thi, K. Van Aelst, S. Van den Bosch, R. Katahira, G. T. Beckham, B. F. Sels and K. M. Van Geem, Green Chem., 2022, 24, 191–206 RSC.
- Z. Sun, J. Cheng, D. Wang, T. Q. Yuan, G. Song and K. Barta, ChemSusChem, 2020, 13, 5199–5212 CrossRef CAS PubMed.
- S. S. Wong, R. Shu, J. Zhang, H. Liu and N. Yan, Chem. Soc. Rev., 2020, 49, 5510–5560 RSC.
- E. Subbotina, T. Rukkijakan, M. D. Marquez-Medina, X. Yu, M. Johnsson and J. S. Samec, Nat. Chem., 2021, 13, 1118–1125 CrossRef CAS PubMed.
- Y. Liao, S.-F. Koelewijn, G. Van den Bossche, J. Van Aelst, S. Van den Bosch, T. Renders, K. Navare, T. Nicolaï, K. Van Aelst and M. Maesen, Science, 2020, 367, 1385–1390 CrossRef CAS PubMed.
- Z. Sultan, I. Graça, Y. Li, S. Lima, L. G. Peeva, D. Kim, M. A. Ebrahim, R. Rinaldi and A. G. Livingston, ChemSusChem, 2019, 12, 1203–1212 CrossRef CAS PubMed.
- V. Polizzi, K. Servaes, P. Vandezande, P. D. Kouris, A. M. Panaite, G. Jacobs, E. J. Hensen, M. D. Boot and K. Vanbroekhoven, Holzforschung, 2020, 74, 166–174 CAS.
- T. Croes, A. Dutta, R. De Bie, K. Van Aelst, B. Sels and B. Van der Bruggen, Chem. Eng. J., 2023, 452, 139418 CrossRef CAS.
- T. Ren, Z. Zhang, S. You, W. Qi, R. Su and Z. He, Green Chem., 2022, 24, 7355–7361 RSC.
- M. Alherech, S. Omolabake, C. M. Holland, G. E. Klinger, E. L. Hegg and S. S. Stahl, ACS Cent. Sci., 2021, 7, 1831–1837 CrossRef CAS PubMed.
- Y. Ito, J. Chromatogr., A, 2005, 1065, 145–168 CrossRef CAS PubMed.
- Y. Ito and R. L. Bowman, J. Chromatogr. Sci., 1970, 8, 315–323 CrossRef CAS.
- T. P. Abbott and R. Kleiman, J. Chromatogr., A, 1991, 538, 109–118 CrossRef CAS.
- A. Marston and K. Hostettmann, J. Chromatogr., A, 1994, 658, 315–341 CrossRef CAS.
- A. Foucault and L. Chevolot, J. Chromatogr., A, 1998, 808, 3–22 CrossRef CAS.
- J. B. Friesen and G. F. Pauli, J. Liq. Chromatogr. Relat. Technol., 2005, 28, 2777–2806 CrossRef CAS.
- A. Marston and K. Hostettmann, J. Chromatogr., A, 2006, 1112, 181–194 CrossRef CAS PubMed.
- K. Skalicka-Woźniak and I. Garrard, Nat. Prod. Rep., 2015, 32, 1556–1561 RSC.
- J. H. Jang, A. R. C. Morais, M. Browning, D. G. Brandner, J. K. Kenny, L. M. Stanley, R. M. Happs, A. S. Kovvali, J. I. Cutler, Y. Román-Leshkov, J. R. Bielenberg and G. T. Beckham, Green Chem., 2023, 3660–3670 RSC , in review.
- M. Chen, Y. Li, F. Lu, J. S. Luterbacher and J. Ralph, ACS Sustainable Chem. Eng., 2023, 11, 10001–10017 CrossRef CAS PubMed.
- H. Choi, N. E. Soland, M. R. Moss, J. Liu, R. R. Prestangen, R. Katahira, S.-J. Lee, M. R. Thorson, C. J. Freeman and E. M. Karp, Sep. Purif. Technol., 2022, 285, 120330 CrossRef CAS.
- E. M. Anderson, R. Katahira, M. Reed, M. G. Resch, E. M. Karp, G. T. Beckham and Y. Román-Leshkov, ACS Sustainable Chem. Eng., 2016, 4, 6940–6950 CrossRef CAS.
- J. Ralph, Phytochem. Rev., 2010, 9, 65–83 CrossRef CAS.
- J. H. Jang, D. G. Brandner, R. J. Dreiling, A. J. Ringsby, J. R. Bussard, L. M. Stanley, R. M. Happs, A. S. Kovvali, J. I. Cutler and T. Renders, Joule, 2022, 6, 1859–1875 CrossRef CAS.
- Y. Liu, P. Kuang, S. Guo, Q. Sun, T. Xue and H. Li, New J. Chem., 2018, 42, 6584–6600 RSC.
- Z. Shen and R. C. Van Lehn, Ind. Eng. Chem. Res., 2020, 59, 7755–7764 CrossRef CAS.
- J. K. Kenny, D. G. Brandner, S. R. Neefe, W. E. Michener, Y. Román-Leshkov, G. T. Beckham and J. W. Medlin, React. Chem. Eng., 2022, 7, 2527–2533 RSC.
- M. Gerigk, G. Dargó, Á. Könczöl, S. V. Luca and M. Minceva, J. Chromatogr., A, 2023, 1691, 463824 CrossRef CAS PubMed.
- M. L. Stone, E. M. Anderson, K. M. Meek, M. Reed, R. Katahira, F. Chen, R. A. Dixon, G. T. Beckham and Y. Román-Leshkov, ACS Sustainable Chem. Eng., 2018, 6, 11211–11218 CrossRef CAS.
- F. Brienza, K. Van Aelst, F. Devred, D. Magnin, B. F. Sels, P. A. Gerin, I. Cybulska and D. P. Debecker, ACS Sustainable Chem. Eng., 2022, 10, 11130–11142 CrossRef CAS.
- N. E. Thornburg, M. B. Pecha, D. G. Brandner, M. L. Reed, J. V. Vermaas, W. E. Michener, R. Katahira, T. B. Vinzant, T. D. Foust, B. S. Donohoe, Y. Roman-Leshkov, P. N. Ciesielski and G. T. Beckham, ChemSusChem, 2020, 13, 4495–4509 CrossRef CAS PubMed.
Footnotes |
| † Electronic supplementary information (ESI) available. See DOI: https://doi.org/10.1039/d4gc00765d |
| ‡ Equal contribution. |
| § Current address: Department of Chemical Engineering, Rowan University, Glassboro, New Jersey 08028, United States. |
| ¶ Current address: Crysalis BioSciences Inc., Louisville CO, USA 80201. |
| This journal is © The Royal Society of Chemistry 2024 |