
 Open Access Article
 This Open Access Article is licensed under a Creative Commons Attribution-Non Commercial 3.0 Unported Licence
A thermodynamically favorable route to the synthesis of nanoporous graphene templated on CaO via chemical vapor deposition†
Kritin
Pirabul‡
a,
Qi
Zhao‡
 b,
Shogo
Sunahiro
c,
Zheng-Ze
Pan
*d,
Takeharu
Yoshii
a,
Yuichiro
Hayasaka
e,
Eddie
Hoi-Sing Pang
b,
Rachel
Crespo-Otero
f,
Devis
Di Tommaso
*bg,
Takashi
Kyotani
a and
Hirotomo
Nishihara
*ad
b,
Shogo
Sunahiro
c,
Zheng-Ze
Pan
*d,
Takeharu
Yoshii
a,
Yuichiro
Hayasaka
e,
Eddie
Hoi-Sing Pang
b,
Rachel
Crespo-Otero
f,
Devis
Di Tommaso
*bg,
Takashi
Kyotani
a and
Hirotomo
Nishihara
*ad
aInstitute of Multidisciplinary Research for Advanced Materials, Tohoku University, 2-1-1 Katahira, Aoba-ku, Sendai, Miyagi 980-8577, Japan. E-mail: hirotomo.nishihara.b1@tohoku.ac.jp
bDepartment of Chemistry, Queen Mary University of London, Mile End Road, London E1 4NS, UK. E-mail: d.ditommaso@qmul.ac.uk
cR & D Strategy Division, Tokai Carbon Co., Ltd, Aoyama Building, 1-2-3 Kita Aoyama, Minato-ku, Tokyo 107-8636, Japan
dAdvanced Institute for Materials Research (WPI-AIMR), Tohoku University, 2-1-1 Katahira, Aoba-ku, Sendai, Miyagi 980-8577, Japan. E-mail: zigzag.mpan@gmail.com; pan.zhengze.e6@tohoku.ac.jp
eThe Electron Microscopy Centre, Tohoku University, 2-1-1 Katahira, Aoba, Sendai, Miyagi 980-8577, Japan
fDepartment of Chemistry, University College London, 2020 Gordon St., London, WC1H 0AJ, UK
gDigital Environment Research Institute, Queen Mary University of London, Empire House, 67-75 New Road, London E1 1HH, UK
First published on 11th April 2024
Abstract
Template-assisted chemical vapor deposition (CVD) is a promising approach for fabricating nanoporous materials based on graphene walls. Among conventional metal oxide templates, CaO, produced through the thermal decomposition of CaCO3, offers improved environmental sustainability and lower production costs, thereby potentially making it a viable candidate for green template materials. Nevertheless, the underlying reaction mechanisms of the interaction on the CaO surface during the CVD process remain indeterminate, giving rise to challenges in regulating graphene formation and obtaining high-quality materials. In this work, a comprehensive experimental–theoretical investigation has unveiled the CVD mechanism on CaO. CaO exhibits efficient catalytic activity in the dissociation of CH4, thereby facilitating a thermodynamically favorable conversion of CH4 to graphene. These findings highlight the potential of using CaO as a substrate for graphene growth, combining both sustainability and cost-effectiveness. When the shell-like graphene layer deposited on CaO particles is released through the dissolution of CaO with HCl, the resulting nanoporous graphene-based materials can be readily compacted by the capillary force of the liquid upon drying. The folded surfaces, however, can become available for electric double-layer capacitance via electrochemical exfoliation under a low applied potential (<1.2 V vs. Ag/AgClO4).
Introduction
Nanoporous graphene-based materials exhibit unique characteristics from the exceptional properties of graphene sheets, along with efficient charge and mass transport within their nanoporous structure.1,2 Thus, they have emerged as highly promising materials for various applications in electrochemical devices.1,3,4 The performance of these materials is strongly influenced by factors such as crystallinity and porosity. One compelling synthesis technique is template-directed chemical vapor deposition (CVD), which offers precise control over the structure of the resulting templated carbons (TCs) by forming thin carbon layers onto template surfaces.5–7 In addition, this approach also affords the ability to achieve high crystallinity and enable scalability.8,9 Previous studies have successfully utilized nanoporous Ni and Cu templates with high catalytic activity to fabricate TCs with excellent crystallinity.10–12 However, controlling the nanoporosity of TCs remains challenging due to the low sintering temperatures of metal templates, which leads to nanostructure collapse during CVD. To overcome this issue, the usage of alternative templates with high thermal stability, such as MgO13 and Al2O3,14 has been explored. These metal oxides offer better control over the nanoporosity of the TCs.Recently, our group has explored the application of CH4-CVD on MgO15 and Al2O316 nanoparticles. Comprehensive research utilizing in situ techniques and quantum chemical calculations was conducted to examine the mechanisms involved in transition-metal-free pyrolytic carbon deposition from CH4 on Al2O3 and MgO.15,17 Notably, the growth rate of the initial graphene layer was found to be significantly higher than that of the subsequent stacked layers in both Al2O3 and MgO. This preferential growth allows the uniform coating of the entire metal oxide nanoparticle surface with single-layer graphene sheets. Following template removal and high-temperature annealing at 1800 °C, the resulting material exhibits a unique combination of developed porosity and a negligible number of carbon edge sites. These seemingly conflicting properties provide them with promising potential in various applications, including a new type of sorbent,18 durable catalyst supports,19 high-voltage supercapacitors,20 all-solid lithium–sulfur batteries,21 lithium–oxygen batteries,22–24 and a new type of heat pump.25
Compared to Al2O3 and MgO, CaO is a more cost-effective template, as it can be easily obtained through the low-cost thermal decomposition of abundant CaCO3.26 Additionally, the utilization of HCl for CaO template removal, as opposed to HF for Al2O3, facilitates an environmentally preferable process. The etching reaction using HCl does not yield toxic fluoride byproducts but instead forms water and benign calcium chloride (CaCl2), thereby minimizing the generation of hazardous secondary waste. Prior research has discussed the synthesis of porous carbons utilizing CaO templates. These templates are derived from the thermal decomposition of CaCO3 nanoparticles at around 800–850 °C and are subsequently utilized in CVD processes at temperatures ranging from 950 to 1200 °C.27–29 However, previous CVD processes were performed empirically, relying on a trial-and-error, because the underlying reaction mechanism governing the graphene formation process has been unclear. Therefore, it was challenging to precisely control carbon layers at the molecular level, and such a concept itself did not exist. As a consequence, these carbon materials exhibit lower specific surface areas and altered properties compared to single-layered nanoporous graphene materials.
In this study, we focus on the reaction mechanisms involved in the CVD process using a CaO substrate generated through the thermal decomposition of CaCO3 nanoparticles. Our experimental and computational investigations reveal the remarkable catalytic activity of the CaO surface for CH4 dissociation reactions, with a lower energy barrier than MgO and Al2O3. These exceptional catalytic properties enable milder CVD conditions, reducing the likelihood of undesirable multi-layered graphene formation. Moreover, the unique properties of the carbon material prepared via CaO-mediated CVD are discussed, especially regarding the formation of loosely stacked structures30 and its re-exfoliation via an electrochemical method.
Experimental
Characterization of CaCO3 and the CaO template
In this work, high-purity CaCO3 nanoparticles with a particle size of ca. 220 nm (SK-I), kindly provided from Shiraishi Central Laboratories Co., Ltd, were used as precursors of the CaO template. The thermal decomposition process from CaCO3 to CaO was analyzed by gas chromatography (GC; Varian, 490-GC) and thermogravimetry (TG; NETZSCH, STA 2500 Regulus). The changes in the crystal structure and surface area before and after the heat treatment at 900 °C (SK-I and SK-I_900) were evaluated by X-ray diffraction (XRD) on a Rigaku MiniFlex600 (Cu-Kα radiation, 40 kV, 15 mA, 1.5418 Å) and N2 adsorption/desorption at −196 °C was evaluated on a volumetric sorption analyzer (BEL Japan, BELSORP MAX), respectively. The Brunauer–Emmett–Teller (BET) method was applied to the N2 adsorption isotherm in the pressure range of P/P0 = 0.05–0.30 to estimate the specific surface area (SBET). The base sites of heat-treated CaO were quantified by temperature-programmed desorption of CO2 (CO2–TPD). First, SK-I was converted into CaO by heating up to 900 °C in a quartz-tube reactor under He flow. After cooling down to room temperature, the sample was exposed to He + CO2 (1 vol%) gas for 30 min to allow the adsorption of CO2 molecules on the base sites. Then, the sample was heated up to 900 °C at a heating rate of 5 °C min−1 under a He flow, and the CO2 desorption was quantified by GC.15 Also, the acid sites of CaO heat-treated at 900 °C were quantified using the NH3-TPD technique similar to that of CO2-TPD, except that the operating temperature of NH3-TPD was above 100 °C.15Analysis of the reaction during CH4-CVD using the CaO template
During the CVD, gas chromatography (CVD-GC) was used to analyze the initial reaction between CaO and methane. SK-I (ca. 1 g) was placed in a tube furnace connected to GC and the sample was heated up to 900 °C with a heating rate of 10 °C min−1 under He flow. To reduce the pressure drop, quartz sand was mixed with the template. It was confirmed beforehand that the quartz sand behaved as an inert background throughout the measurement. When CO2 and H2O emissions from CaCO3 became negligible at 900 °C, the He flow was switched to the mixture gas of He (99 vol%) and CH4 (1 vol%), and the CaO–methane reaction was analyzed. Due to the upper detection limit of CH4, a small CH4 concentration (1 vol%) was used. CH4 was supplied from a highly pure CH4 cylinder (99.99%) through a molecular sieve filter to reduce the amount of CO2, which is inevitably contained as an impurity, down to a negligible level (76 ppm). The gas emission behavior on CaO was compared with those on MgO15 and γ-Al2O3 (TH80/170, Sasol, average particle size is 11 nm).Density functional theory calculations for the C–H activation of CH4 on the CaO template
The experimental investigation of the CH4-to-C conversion on CaO has been complemented by density functional theory (DFT) calculations with the “Vienna ab initio simulation package” (VASP, version 6.1.1).31 We used the generalized gradient approximation (GGA) exchange–correlation functional proposed by Perdew–Burke–Ernzerhof (PBE),32 together with the Grimme's-D3 dispersion correction, to provide a more accurate description of the ion-induced dipole interaction.33 Valence electrons were described by a plane wave basis set with an energy cutoff (Ecut) of 450 eV to optimize the intermediates and locate the intermediates and transition state structures on the reaction energy profile. Optimized intermediates were obtained by minimizing the forces on each ion until they were less than 0.05 eV Å−1. Monkhorst–Pack k-point samplings of (3 × 3 × 1) were employed for optimized geometries and for the calculations of CaO surfaces. The conventional cell of CaO was taken from the Materials Project (ID: mp-1265)34 and fully optimized to obtain the equilibrium crystal structure at the PBE-D3 level of theory. The conjugate gradient scheme was used to minimize the total energy and interatomic forces by modifying the lattice parameters and internal atomic coordinates independently. No symmetry constraint was applied. The lattice parameter of the optimized cubic unit cell (0.4797 nm) was in excellent agreement with the experimental value (0.4810 nm).35 The transition state structures of each elementary step in the CH4 decomposition on CaO were located using the climbing nudged elastic band (NEB) method.36DFT calculations were used to quantify the process of gas desorption leading to the formation of an O vacancy and, consequently, to the activation of the (100), (110) and (111) CaO surfaces. We modelled this process by first computing the intermediates involved in the CH4-to-C conversion process (CH4*, CH3*, CH2*, CH*, and C*) and then considering the CHx (x = 0–3) desorption from the CaO surface with a binding O* on the CaO surface. The CHx desorption energies (Edes) were computed as Edes-CHxO* = E(CHxO) + E(CaO–Vo) – E(CHx*), where the first term is the energy of the isolated CHxO molecule (e.g. CO and HCHO), the second term is the energy of the optimized CaO surface with one O desorbed, and the third term is the energy of the optimized CaO surface with an adsorbed CHx*. Adsorption energies were computed as E(ads) = E(adsorbate+slab) – E(adsorbate) – E(slab), where the first term is the energy of the optimized surface slab with the adsorbate, the second term is the energy of the isolated optimized adsorbate molecule, and the third term is the energy of the optimized bare surface slab. Negative values of Eads correspond to an exothermic adsorption process. We used Edes-CO* and Edes-CH2O as a proxy for the ease of CO and CH2O desorption on CaO and MgO: lower values of Edes-CO* and Edes-CH2O indicate easier activation of the surface. The energies required for transferring O from metal oxides (MO either CaO or MgO) were computed as ΔEO-trans(MO to Gra) = E(O-Gra/MO–Vo) − E(Gra/MO), where the first term is the energy of the optimized structure with one O transferred from MO to Gra, the second term is the energy of the optimized structure with the Gra layer on MO.
Carbon templating
The carbon coated SK-I (C/SK-I) was prepared by a carbon coating process in a similar manner as mentioned before. Specifically, 10 g of SK-I nanoparticles were placed in a rotary kiln reactor and were heated up to 900 °C (10 °C min−1) in an Ar flow. After stabilization for 30 min the gas was switched to a mixture gas of Ar + CH4 (20 vol%), and CVD was carried out for 40 min. The templated carbon (TC_SK-I) was obtained by washing C/SK-I with 5M HCl at room temperature for 5 h, followed by replacing water with acetone and drying at 150 °C. The yield of the deposited carbon was recorded as Ycarbon. The HT annealing was conducted at 1800 °C for 1 h under vacuum to produce annealed templated carbon (TC_SK-I_A).Characterization of the templated carbon
w carbon (gcarbongtemplate−1) onto the CaO template via CVD was estimated from the carbon yield obtained after the template removal process. Wcarbon can be converted into the average stacking number of graphene layers (Nstack) using the following equation. | (1) |
The structures of the samples at each synthetic step were observed using a scanning electron microscope (SEM; S-4800, Hitachi High-Tech Co., Ltd). Transmission electron microscopy (TEM) and scanning transmission electron microscopy (STEM) images were obtained with a Titan G2 60–300 double Cs-corrector (FEI company) at an acceleration voltage of 60 kV. The crystallinity of TC_SK-I and TC_SK-I_A was characterized by XRD (Cu-Kα radiation, 40 kV, 15 mA, 1.5418 Å), and also by Raman spectroscopy on a Jasco NRS-3300FL spectrometer (excitation wavelength was 532.2 nm). The d002 value was calculated using Bragg's law, according to eqn (2).37
 | (2) |
The Raman shift was calibrated by the G-band position (1582 cm−1) of highly oriented pyrolytic graphite (HOPG), and the intensity was normalized by the G-band (1582 cm−1). The porous properties of TC_SK-I and TC_SK-I_A were characterized by N2 adsorption–desorption measured at −196 °C. Total pore volume (Vtotal) was calculated at P/P0 = 0.96. The mesopore-size distribution was calculated by the Barrett–Joyner–Halenda (BJH) method applied to the adsorption isotherm.38 The air-oxidation resistance was characterized by TG in air. The air-oxidation resistance of templated carbon was compared with YP-50F (Kuraray Co., Ltd), which is a water-vapor-activated carbon made from palm shells and used for commercial electric double-layer capacitors (EDLCs) owing to its large surface area (1700 m2 g−1) and good durability. Advanced temperature-programmed desorption (TPD) analysis up to 1800 °C was conducted to evaluate Ngas, which indicates the number of edge sites.39
Electrochemical measurement
The electrochemical behavior of TC_SK-I and TC_SK-I_A were evaluated using a three-electrode cell in 1 M tetraethylammonium tetrafluoroborate (Et4NBF4)/propylene carbonate (PC) electrolyte at 25 °C. The working electrode was prepared by mixing the active carbon (TC_SK-I or TC_SK-I_A), Denka black (DB, Denka Co., Ltd), and PTFE (polytetrafluoroethylene) binder (weight ratio of TC_SK-I![[thin space (1/6-em)]](https://www.rsc.org/images/entities/char_2009.gif) :DB:PTFE = 90:5:5). The 1 cm2 of square electrode sheet was pressed between platinum mesh (80 mesh). In addition, the activated carbon YP-50F working electrode was prepared for comparison. The counter electrode (ca. 10 mg) was prepared from YP-50F (weight ratio of YP-50F:PTFE = 90:10) in the same manner as that for the working electrode. CV was performed under the following conditions: first, the CV pattern was evaluated in the potential range of 0.2 to 0.5 V versus Ag/AgClO4 at the scanning rate of 1 mV s−1. Then, the upper-limit potential was increased by 0.1 V to 1.2 V versus Ag/AgClO4. Each CV scanning was punctuated by the EIS measurement, which was conducted with a frequency loop from 0.01 Hz to 1 MHz using a perturbation amplitude of 10 mV at the potential of 0.2 V versus Ag/AgClO4.
:DB:PTFE = 90:5:5). The 1 cm2 of square electrode sheet was pressed between platinum mesh (80 mesh). In addition, the activated carbon YP-50F working electrode was prepared for comparison. The counter electrode (ca. 10 mg) was prepared from YP-50F (weight ratio of YP-50F:PTFE = 90:10) in the same manner as that for the working electrode. CV was performed under the following conditions: first, the CV pattern was evaluated in the potential range of 0.2 to 0.5 V versus Ag/AgClO4 at the scanning rate of 1 mV s−1. Then, the upper-limit potential was increased by 0.1 V to 1.2 V versus Ag/AgClO4. Each CV scanning was punctuated by the EIS measurement, which was conducted with a frequency loop from 0.01 Hz to 1 MHz using a perturbation amplitude of 10 mV at the potential of 0.2 V versus Ag/AgClO4.
Results and discussion
Formation of the CaO template
In this work, the CaO substrate is spontaneously formed through the thermal decomposition of CaCO3 nanoparticles (SK-I, Shiraishi Central Laboratories Co., Ltd, average particle size ca. 220 nm) during the heating step of the CVD process (Scheme 1). SK-I is highly pure CaCO3, with negligible impurities, as shown in Table S1.† CaCO3 can undergo a one-step reaction (eqn (3)) to produce solid CaO through thermal decomposition.35| CaCO3(s) → CaO(s) + CO2(g) | (3) |
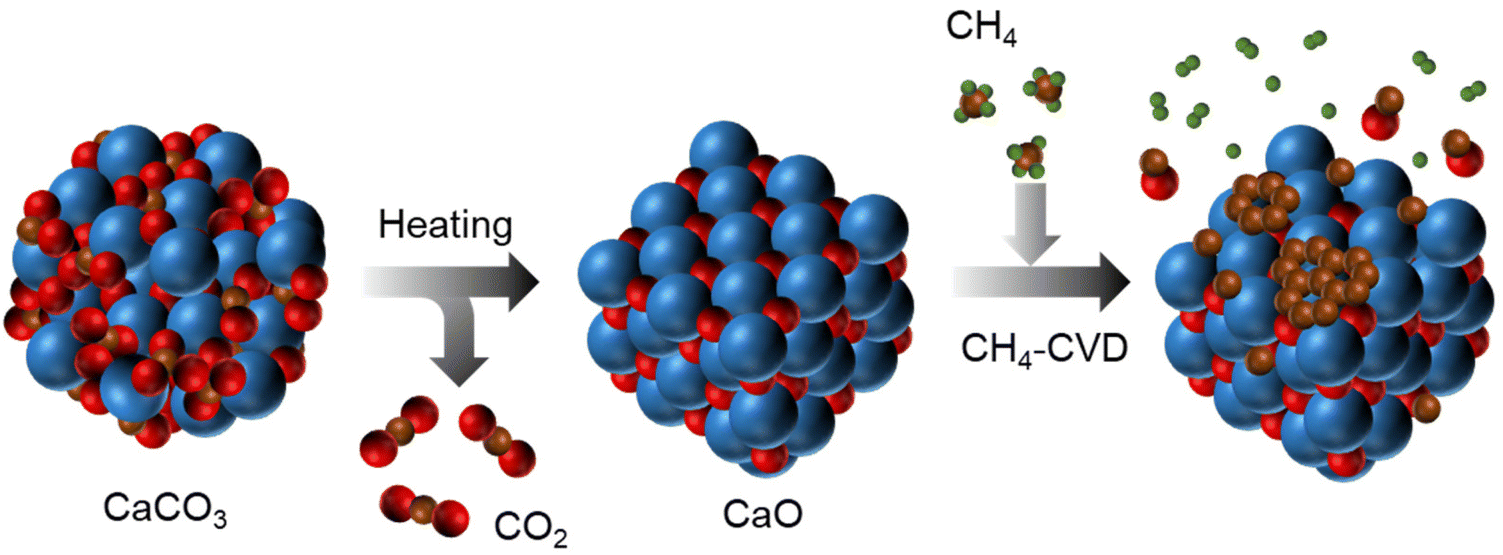 | ||
| Scheme 1 An illustration for the thermal decomposition of CaCO3 into CaO and the subsequent CH4-CVD on to CaO, where the blue, red, brown, and green balls represent Ca, O, C, and H atoms, respectively. | ||
The gas emission during heating of the SK-I nanoparticle up to 900 °C was analyzed using GC, as shown in Fig. 1a. Initially, a small amount of physisorbed water was desorbed. The emission of water observed above 250 °C is attributed to the decomposition of Ca(OH)2, which is present on the CaCO3 surface and can be estimated to be approximately 2.6 wt% from the water desorption amount (0.35 mmol g−1). As the temperature reached 650 °C, significant emission of CO2 from SK-I was observed, following eqn (3). The total amount of desorbed CO2 was measured to be 9.6 mmol g−1, which is very close to the stoichiometric amount of CO2 involved in the CaCO3-to-CaO conversion (9.7 mmol g−1), considering the 2.6 wt% of Ca(OH)2. Furthermore, SK-I exhibited a weight loss value of 43 wt% as depicted in Fig. 1b, corresponding to the stoichiometric weight decrease (43 wt%) during the thermal decompositions of CaCO3 (97.4 wt%) and Ca(OH)2 (2.6 wt%) into CaO. These suggest that the conversion of CaCO3 and a minor portion of Ca(OH)2 into CaO is completed at the CVD temperature.
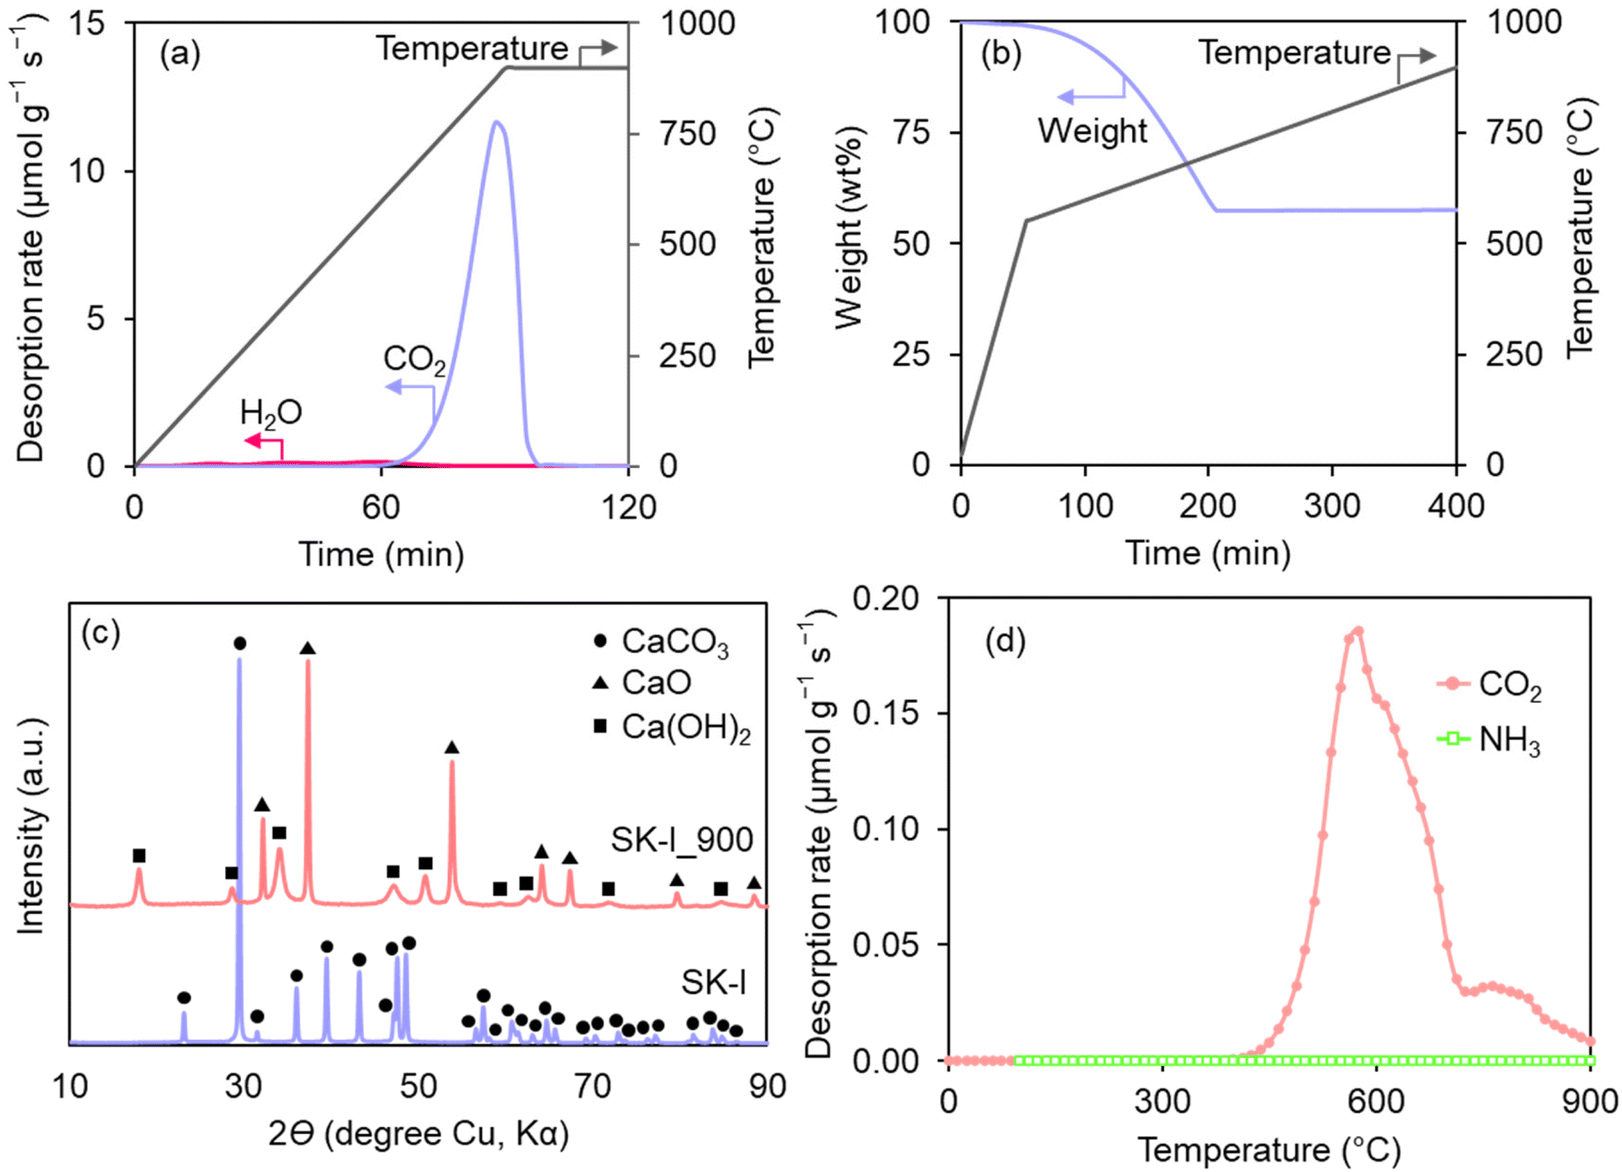 | ||
| Fig. 1 Formation of CaO from CaCO3 (SK-I). (a) Gas evolution and (b) weight change patterns of SK-I during heating up to 900 °C in an inert gas. (c) XRD patterns of SK-I and SK-I_900. (d) The CO2-TPD and NH3-TPD profiles of SK-I_900. | ||
The completion of CaO formation was further confirmed using XRD analysis. The XRD pattern of SK-I after heating at 900 °C (denoted as SK-I_900) clearly demonstrates the formation of the CaO phase, while the CaCO3 phase is absent (Fig. 1c). Additionally, the XRD pattern of SK-I_900 reveals the presence of the Ca(OH)2 phase, attributed to the rapid reaction between the formed CaO and moisture in the air during sample transfer.35
In further characterization of the catalyst properties of the formed CaO, its Lewis base and acid sites were quantified using CO2-TPD and NH3-TPD, respectively. Such characterization reveals the fundamental properties of solid catalysts. As shown in Fig. 1d, NH3-TPD results indicate the absence of acid sites. Conversely, intense CO2 desorption at around 550 °C was detected in the CO2-TPD profile, indicating the presence of solid base sites.40 The total number of base sites is estimated to be 0.38 mmol g−1, significantly higher than 0.22 mmol g−1 observed on the solid base MgO template, which previously demonstrated the catalytic effect on the C–H activation of CH4.15 However, it should be noted that our previous research demonstrated that the CH4-to-C conversion is not primarily catalyzed by base and acid sites but by the oxygen-vacancy sites generated under CVD conditions on Al2O3 and MgO. Thus, the CVD mechanism on CaO is of particular interest.
Underlying mechanism of the CVD process
Generally, the CVD process relies on the decomposition of the carbon precursor gas to form a graphene sheet. In this work, CH4 underwent a series of C–H activation reactions at elevated temperatures during the CVD process, resulting in the coating of the template surface with graphene sheets. The CVD process can be represented by the following basic reaction.15| nCH4 → Cn + 2nH2 | (4) |
Recently, we reported that the catalysis of graphene formation on pristine MgO and Al2O3 is insufficient. However, their surfaces can be activated at elevated temperatures (around 900 °C) by CH4 to generate oxygen-vacancy sites in accordance with the following reaction.15
| M–O + CH4 → M* + CO + 2H2 | (5) |
In eqn (5), M refers to a metal (either Mg or Al), and M* represents the oxygen vacancy site. Subsequently, the created vacancy sites serve as reaction centers for converting CH4 into C, promoting graphene growth. Accordingly, MgO (US3310, US Research Nanomaterials, particle size ca. 30 nm) and Al2O3 (TH 80/170, Sasol, particle size ca. 10 nm) exhibit analogous gas emission patterns during the CVD process (Fig. 2a and b) despite the inherent catalytic difference between Al2O3 (solid acid) and MgO (solid base). Initially, CO emission occurs due to the surface activation process described in eqn (5). The subsequent evolution of H2 originates from the formation of graphene (eqn (4)). Thus, the total amount of deposited carbon per unit area on the substrate (YC [molC m−2]) could be estimated using eqn (6),
| YC = (YH2/2) − YCO | (6) |
 | (7) |
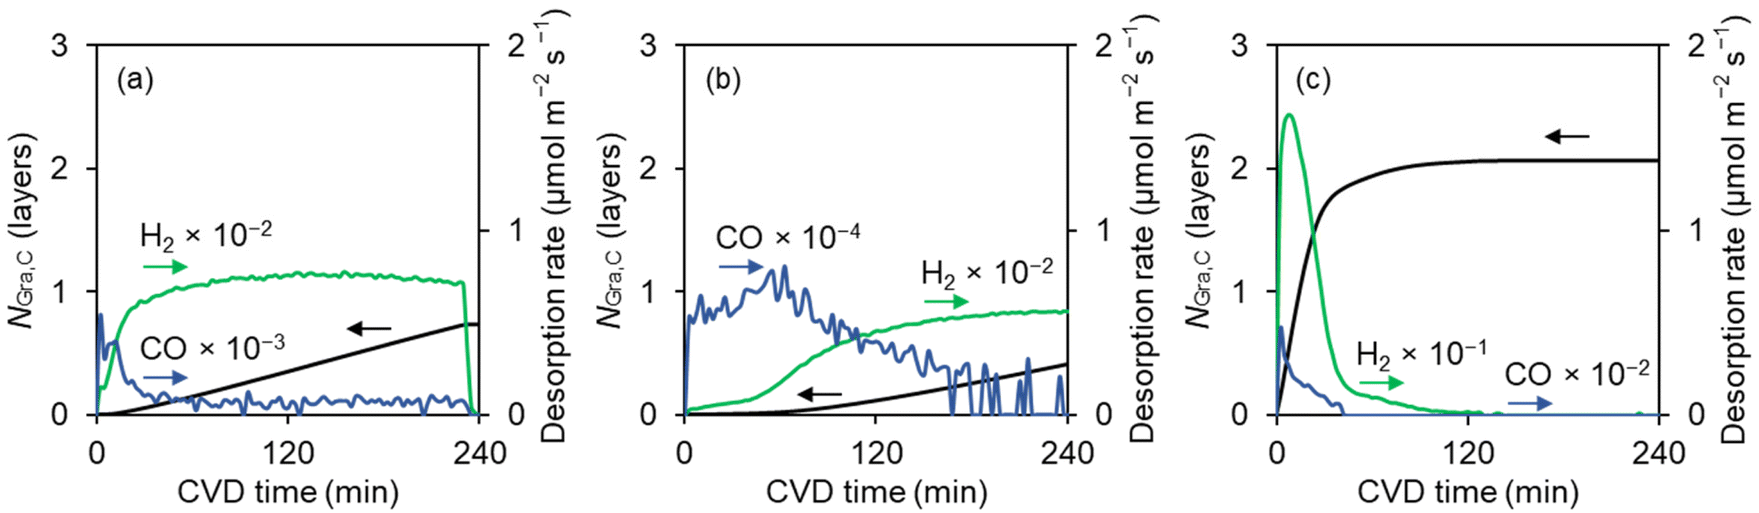 | ||
| Fig. 2 (a–c) Gas products (CO and H2) and graphene growth patterns during the CVD process at 900 °C using (a) MgO, (b) Al2O3, and (c) CaO substrate. The supply of CH4 starts at a CVD time of 0. In all the cases, only H2, CO, and CH4 were detected by a gas chromatograph. The data of the CVD process utilizing the MgO substrate was taken from reference.15 | ||
Fig. 2a and b illustrate the gradual formation of graphene on MgO and Al2O3, achieving NGra,C values of 0.73 and 0.42 after 240 minutes of the CVD process at 900 °C, respectively. On the other hand, CaO derived from SK-I nanoparticles exhibits prompt graphene coating involving an intense H2 generation, attaining an NGra,C value of 1 within 15 minutes of the CVD process (Fig. 2c). The rapid deposition is attributed to its significant catalytic effect on the CH4-to-C conversion. Notably, the intensity of the H2 evolution is an order of magnitude greater than what is observed for MgO and Al2O3. Specifically, the H2 emission per unit surface area during the first 50 minutes of the CVD process follows a distinct order: CaO (248.4 μmol m−2, highest) > MgO (15.6 μmol m−2) > Al2O3 (1.9 μmol m−2, lowest). This trend underscores the superior catalytic activity of CaO in the CH4 dissociation reactions. Moreover, the gas evolution patterns observed during the CH4-CVD process indicate a significant amount of CO emission when using CaO (Fig. 2c). This evolution continues even after NGra,C reaches 1. Specifically, the total CO emitted during CaO-mediated CVD is 4.04 μmol m−2. In contrast, the CO desorption from Al2O3 and MgO is likely to terminate before the NGra,C value reaches 0.5, with total emitted CO amounts of only 0.52 and 1.37 μmol m−2, respectively. The potential origins of these differences will be further discussed in the next section.
The mechanism of CH4 dissociation on CaO was further characterized using DFT calculations. As shown later, a scanning electron microscope (SEM) image of SK-I_900 reveals diverse particle shapes, suggesting the presence of diverse crystallographic planes comprising both flat and stepped surfaces (Fig. S1†). Thus, catalytic CH4-to-C conversion was computed using flat (100) and (111) as well as stepped (110) surfaces (Fig. 3). The energy profiles of the CH4-to-C conversion on flat CaO(100) and CaO(111) surfaces (Fig. 3a and b) show high energy barriers for the homolytic C–H bond dissociation of CH4 of 4.39 and 4.48 eV, respectively. These results imply that CH4 activation is not significantly active on flat-O-sites. In contrast, stepped-O-sites on CaO(110) exhibit substantially lower energy barriers, and therefore, higher activity for the initial dissociation of CH4 than the (100) and (111) surfaces (Fig. 3c). Specifically, the C–H cleavage steps of CH4 to form CH3* and CH2* are spontaneous processes at the top oxygen site, as indicated by nearly zero energy barriers of 0.18 and 0.05 eV, respectively (Fig. 3c). It is important to note that these activation energies on the stepped surface are significantly lower than those on Al2O3 and MgO.15,17 The resultant CH2* species can subsequently undergo conversion to graphene through either the oxidative pathway of C–H activation, involving the formation of CH* and C* with moderate barrier energies of 2.95 and 2.50 eV, respectively (Fig. 3c), or the non-oxidative pathway of C–C coupling.17 These findings align with the observed rapid H2 emission at the start of the CVD process, suggesting that dissociation of CH4 might occur even before O-vacancy sites form.
 | ||
| Fig. 3 The energy profiles for the C–H activation on the (a–c) pristine CaO surface and (d–f) CaO surface with O-vacancy sites. (a and d) CaO(100), (b and e) CaO(111), and (c and f) CaO(110) surfaces. The blue, red, brown, and white balls represent Ca, O, C, and H atoms, respectively. | ||
Next, we discuss the mechanism of the CO emission from CaO in eqn (5). One of the possible pathways involves CH2* species, which can be easily formed on the CaO(110) surface (Fig. 3c). CH2* can react with the nearby oxygens, forming formaldehyde (CH2O) and desorbing favorably from the surface (ΔEdes–CH2O = −3.53 eV), as shown in Fig. 4a. The evolved CH2O can rapidly decompose into CO and H2 at CVD temperatures,41 according to eqn (5). Another possible pathway for CO evolution from C* was also computed. The CO desorption energies (ΔEdes-CO*) from adsorbed C* on CaO with (100), (110), and (111) facets are +1.0, +1.1, and +0.9 eV, respectively (Fig. 4b and S2†). These values are lower than the ΔEdes–CO* of +1.5 eV reported for the dominant MgO(100) surface,15 suggesting the occurrence of the route via C*. Also, it is noteworthy that the CO evolution did not cease even after NGra,C reaches 1. Thus, we also simulated the interaction between a formed graphene layer and the underlying CaO. As displayed in Fig. 4c, the presence of a surface graphene layer destabilizes the oxygen atoms in the CaO and further induces a transfer of oxygen to the outer surface of the graphene layer. The energy required for the oxygen transfer on the stepped CaO(110) surface was calculated to be merely 0.6 eV (Fig. 4d), which is significantly lower than the 5.0 eV for the MgO(110) surface (Fig. S3†), suggesting the unique oxygen desorption pathway in CaO. It should be noted that this oxygen transfer process is self-limiting due to the rearrangement of the CaO structure after deoxygenation (Fig. 4d and Fig. S4†), rendering neighboring sites less active. Following the oxygen transfer process, the CH4 molecule preferably combines with the acquired oxygen to form CH3OH (Fig. 4e) through the reaction shown in eqn (8), which further decomposes to generate CO at the CVD temperature.41 Notably, Fig. 2c reveals that CO emission terminates once the NGra,C value reaches 2.0, implying a dynamic nature of the surface interactions and the influence of the graphene layer in modulating the reaction pathways.
| Graphene-O + CH4 → Graphene + CH3OH | (8) |
 | ||
| Fig. 4 Side and top views of the DFT optimized structural models of (a) CH2* on CaO(110) and (b) C*on CaO(110) with the values of the CH2O desorption energy (ΔEdes-CH2O) and the CO desorption energy (ΔEdes-CO*). (c) The charge density mappings of graphene/CaO(110) (Gra/CaO(110)) and (d) side views of the optimized structural models of Gra/CaO(110) and O* on Gra/CaO(110) with the energy required for transferring O from CaO to the surface graphene (ΔEO-trans(CaO to Gra)). (e) The energy profiles for breaking the C-H bond of the CH4 molecule (blue line) and inserting the CH4 molecule to form CH3OH (green line) on Gra/CaO(110) with O* with the optimized structural models. The blue, red, brown, and white balls represent Ca, O, C, and H atoms, respectively. The yellow and blue regions represent areas with an increase and decrease in charge densities. The green region locates the transferred O. | ||
Since O-vacancy sites could be generated on the CaO surfaces along with the CO evolution, we simulated the CH4 dissociation of the CaO surfaces with oxygen-deficient sites. As shown in Fig. 3d–f, CaO with O-vacancy sites exhibits an energy profile comparable to the pristine CaO surfaces. This further highlights the intrinsic activity of the CaO surface in catalyzing the CH4 dissociation reactions, regardless of the formation of surface vacancy sites, in contrast to the cases of MgO15 and Al2O317 surfaces. These findings offer a comprehensive explanation for the observed gas evolution pattern during CVD utilizing the SK-I substrate (Fig. 2c), where the intensive emission of H2 and CO simultaneously occurred at the onset of CVD. Moreover, the conversion of CH4 to C* on the CaO surface proceeds exothermically (Fig. 3), which is in contrast to the endothermic process observed on Cu,42 Ni,43 MgO,15 and Al2O317 surfaces, further positioning CaO as a distinct catalyst for converting CH4 into graphene via CVD.
Templated carbon and its distinct electrochemical behavior
The feasibility of the CaO substrate for the synthesis of graphene-based porous materials was further assessed. First, a carbon-coated composite (denoted as C/SK-I) was prepared via CVD at 900 °C for 40 min. The resulting composite shows the carbon-loading amount (wcarbon) of 0.92 wt%. Note that wcarbon was estimated from the carbon-recovery amount after template removal, as it was the most reliable method to determine the carbon loading in the experiments performed in this study. The wcarbon value of 0.92 wt% corresponds to an average number of 1.0 stacked layer (Nstack). The detailed calculations for wcarbon and Nstack are provided in the Experimental section. This composite was then subjected to chemical etching, yielding templated carbon (denoted as TC_SK-I). Moreover, its structure evolution by high-temperature (HT) annealing at 1800 °C was also investigated. The resulting sample is denoted as TC_SK-I_A. The SEM images of each synthetic step are shown in Fig. S1.† As described above, SK-I (Fig. S1a†) shows diverse particle shapes. It can be observed that the particle size of the substrate slightly decreased upon heating up to 900 °C under an inert atmosphere (Fig. S1a and b†), as also indicated by the increase in the SBET value from 10 to 12 m2 g−1 (Fig. S5†). The morphology of the C/SK-I composite (Fig. S1c†) resembles that of SK-I_900 (Fig. S1b†) without noticeable localized carbon deposition, suggesting a uniform coverage of the CaO surface with a thin carbon layer. Subsequently, CaO was eliminated through HCl etching, with the pH neutralized using deionized water. The water was then substituted with acetone to mitigate capillary forces during drying. Despite the use of acetone with smaller surface tension than water, the carbon framework experienced considerable contraction after chemical etching, attributed to the significantly soft nature of the large spherical structures consisting of minimally stacked graphene walls (Fig. S1d†).30 On the other hand, the structural change after HT annealing is not evident (Fig. S1d and e†), suggesting the thermal stability of graphene fragments formed via CaO-mediated CVD, which accords to the excellent thermal stabilities of graphene walls formed on Al2O3 and MgO.15 The TEM image of TC_SK-I_A shows the shrunken framework structure (Fig. 5a), resembling those observed in the SEM image. An atomic-resolution TEM image (Fig. 5b) of TC_SK-I_A, alongside a bright-field STEM image (Fig. 5c) and its corresponding fast Fourier transform (FFT) (Fig. 5d), reveals distinct hexagonal patterns indicative of the graphene lattice structure. | ||
| Fig. 5 Characterization results of TC_SK-I, TC_SK-I_A, and HOPG. (a) TEM image, (b) atomic-resolution TEM image, (c) bright-field STEM image, and (d) corresponding FFT of TC_SK-I_A. (e) XRD patterns and (f) Raman spectra. (g) N2 adsorption/desorption isotherms at −196 °C. (g and h) The electrochemical behavior of TC_SK-I and TC_SK-I_A evaluated using a three-electrode cell in 1 M Et4NBF4/propylene carbonate at 25 °C. The dependence of average current density in the potential range of 0.2–0.5 V on an upper limit potential in each CV pattern using (h) TC_SK-I and (i) TC_SK-I_A. The solid and hollow blue squares represent I(+) and I(−), respectively. The solid and hollow red circles represent I(+) and I(−) after applying a potential of 1.2 V, respectively. (j) Schematic illustrations for the concept of the proposed electrochemical exfoliation on loose stacking. The blue and red balls represent negative and positive ions, respectively. | ||
The crystallinity of TC was examined by XRD analysis and Raman spectroscopy. The XRD pattern of TC_SK-I exhibits a carbon 002 peak at around 26° (Fig. 5e), corresponding to the stacked graphene structures. Additionally, TC_SK-I shows 10 (around 44°) and 11 (around 77°) peaks, corresponding to in-plane diffractions of graphene building blocks in turbostratically stacked structures.44,45 TC_SK-I displays an intense 002 peak, though its Nstack value is 1.0 layer. This is attributed to the loosely stacked structures that arise due to structural contraction upon template removal.29 Indeed, the average interlayer spacing (d002) value for TC_SK-I (3.67 Å) is higher than that of highly ordered graphitic carbon (3.34 Å). In previous research, the sizes of Al2O3 (5–7 nm) and MgO (20–40 nm) nanoparticles were much smaller than the current CaO nanoparticles (ca. 150 nm), and the formation of loosely stacked structures is attributed to the larger particle size of CaO. As demonstrated earlier, the CaO surface exhibits a unique catalysis of graphene growth, which is comparable to or even superior to that of Al2O3 or MgO. Consequently, the thermal stability of the loosely stacked structures consisting of graphene formed by CaO-mediated CVD is further investigated. After HT annealing, the 10 and 11 peaks become intense, indicating the development of in-plane crystallinity. Additionally, the d002 value decreased to 3.48 Å, indicating a transition of the loosely stacked structures into more tightly stacked structures.30 The development of ordered structures is consistent with the results of Raman spectroscopy. The G bands become sharper and distinguishable from the D band (Fig. 5f), presenting the enhanced crystallinity of the sp2 carbon network.46,47 The appearance of D and resolved D′ bands in TC_SK-I_A can be attributed to the presence of defect sites.48 As explained later, there are very few edge sites in TC_SK-I_A. Therefore, the observed D and D′ bands can be attributed to the topological defects (5- and 7-membered carbon rings) formed due to the coalescence between neighboring graphene boundaries.16,49 In monolayer or few-layered graphene materials with high two-dimensional crystallinity, the 2D band often exhibits greater or comparable intensity than the G band by a more distinct two-phonon double resonance process.50 Also, the 2D band of rarely stacked graphene downshifts to that of highly oriented pyrolytic graphite (HOPG).51 TC_SK-I_A displays a significantly enhanced and downshifted 2D band, which matches the stated criteria of rarely stacked graphene.
Fig. 5g shows the N2 adsorption–desorption isotherms of the samples. The SBET value of TC_SK-I (469 m2 g−1) is significantly lower than the theoretical value of single-layer graphene (2627 m2 g−1). This is ascribed to the framework shrinkage upon template removal. After the HT treatment, TC_SK-I_A exhibits a slight increase in SBET value (SBET of 612 m2 g−1). This presents the rearrangement of graphene building blocks at high temperature. Conversely, the pore-size distributions remain primarily unchanged upon annealing (Fig. S6†), indicating no significant alterations in the pore structure. The amount of carbon edge sites was quantified through high-sensitivity vacuum temperature-programmed desorption (TPD) up to a high temperature of 1800 °C.39 As shown in Fig. S7a,† TC_SK-I_A released a much smaller amount of gas compared to YP-50F, a commercially available activated carbon by Kuraray Co., Ltd. The total gas emission amount (Ngas) of TC_SK-I_A is as small as 0.23 mmol g−1. This value is much lower than that of YP-50F (3.4 mmol g−1).16 The small number of edge sites imparts a high thermal stability of TC_SK-I_A, showing a high onset combustion temperature (Tonset) of 670 °C (Fig. S7b†). This Tonset is much higher than that of YP-50F (585 °C).
Next, the electrochemical properties of loosely stacked structures consisting of graphene formed via CaO-mediated CVD were investigated.29 We compare the electrochemical behaviors of TC_SK-I, characterized by its loosely stacked structure, and TC_SK-I_A with a tight stacking, using a three-electrode cell in 1 M Et4NBF4/propylene carbonate. Fig. S8a and b† present the cyclic voltammetry (CV) profiles of the TC_SK-I and TC_SK-I_A electrodes, respectively. The capacitance of both electrodes increases as the upper limit potential is expanded from 0.5 V to 1.2 V vs. the Ag/AgClO4 reference electrode. This is typical behavior of graphene-based materials influenced by the reduction in quantum capacitance dependent on the density of states.52 Both voltammograms do not show noticeable anodic peaks, indicating no apparent corrosion reactions up to 1.2 V. The absence of significant corrosion and chemical changes was further supported by the overlapped Nyquist plots (Fig. S9†) throughout the measurement.
To elucidate the alterations observed in CV profiles, we evaluated the average anodic and cathodic currents spanning a potential range of 0.2–0.5 V against Ag/AgClO4 (denoted as I(+) and I(−), respectively), and shown in Fig. 5h and i. The TC_SK-I_A electrode displays a consistent increase in I(−) as the upper limit potential expanded to 1.2 V (Fig. 5i). Conversely, I(+) experienced a slight decrease initially, followed by saturation (Fig. 5i). When the potential range is narrowed again, the values of I(−) and I(+) almost return to their initial values, indicating that the changes of I(−) and I(+) depending on the potential range are both reversible. One possible explanation for this transient shift could be the delayed ion desorption, influenced by the kinetic effects within the narrow pore confines. Conversely, the TC_SK-I electrode demonstrated a progressive rise in both I(+) and I(−) once the upper limit potential surpassed 0.9 V (Fig. 5h). Specifically, at an upper limit potential of 1.2 V, both I(+) and I(−) increased notably by 16.7% and 5.9%, respectively, from their initial values. Such irreversible capacitance enhancement is known as electrochemical activation,53 and it is ascribed that loosely stacked structures are irreversibly expanded by the invasion of ions at an elevated potential (Fig. 5j).
Thus, electrochemical activation has been demonstrated in loosely stacked structures consisting of graphene formed by CaO-mediated CVD. Electrochemical activation at a relatively low potential is valuable to enhance the energy density of an EDLC without undesirable side reactions, as electrochemical activation can create minimal necessary pores inside a dense carbon matrix. On the other hand, once the loosely stacked structures turn into tight stacking structures by HT treatment, the electrochemical activation becomes not applicable. These results provide valuable insight for improving the volumetric energy density of EDLCs using graphene-based highly porous materials which are produced through metal–oxide-mediated CVD.20
Conclusions
In summary, we have elucidated the mechanism of the process of CVD on a sustainable template of CaO nanoparticles derived from the thermal decomposition of CaCO3, a cost-effective and readily available natural resource. CaO exhibits remarkable catalytic activity towards the CH4-to-C conversion even without forming oxygen-vacancy sites, which are necessary in the cases of MgO and Al2O3. Without the need for a prolonged activation period prior to the CVD process, the CaO template proves effective in reducing the duration of the CVD period. Moreover, the CaO template can be efficiently removed with HCl, which precludes the generation of toxic byproducts typically associated with HF etching. This approach is consistent with the tenets of green chemistry, emphasizing the minimization of ecological impact and enhancement of resource efficiency in chemical process design, advancing progress toward manufacturing graphene-based functional materials. Furthermore, upon HT annealing, the resulting material exhibits enhanced oxidation stability while retaining its mesoporosity. Intriguingly, our findings also propose the potential electrochemical exfoliation of loosely stacked graphene sheets at potentials less than 1.2 V vs. Ag/AgClO4, adding a novel aspect to our understanding of the capabilities of the material. These multifaceted benefits, from sustainable synthesis techniques to electrochemical properties, highlight the practical potential of graphene-based materials.Conflicts of interest
There are no conflicts of interest.Acknowledgements
This work was supported by JSPS KAKENHI Grant no. 23H00227; JST SICORP Grant no. JPMJSC2112; UK's Royal Society International Exchanges Cost Share (IEC\R3\193106). We thank Shiraishi Kogyo Kaisha, Ltd and Kuraray Co., Ltd for kindly providing SK-I and YP-50F, respectively. Qi Zhao thanks the China Scholarship Council for financial support. We are grateful to the UK Materials and Molecular Modelling Hub for computational resources, which is partially funded by EPSRC (EP/P020194/1). Via our membership of the UK's HEC Materials Chemistry Consortium, which is funded by EPSRC (EP/L000202), this work used the ARCHER UK National Supercomputing Service (https://www.archer.ac.uk). This research utilized Queen Mary's Apocrita HPC facility, supported by QMUL Research-IT.References
- Y. Anil Kumar, G. Koyyada, T. Ramachandran, J. H. Kim, S. Sajid, M. Moniruzzaman, S. Alzahmi and I. M. Obaidat, Nanomaterials, 2023, 13, 1049 CrossRef CAS PubMed.
- C. Tang, H.-F. Wang, J.-Q. Huang, W. Qian, F. Wei, S.-Z. Qiao and Q. Zhang, Electrochem. Energy Rev., 2019, 2, 332–371 CrossRef CAS.
- H. Jiang, P. S. Lee and C. Li, Energy Environ. Sci., 2013, 6, 41–53 RSC.
- M. Etesami, M. T. Nguyen, T. Yonezawa, A. Tuantranont, A. Somwangthanaroj and S. Kheawhom, Chem. Eng. J., 2022, 446, 137190 CrossRef CAS.
- Z. Sun, S. Fang and Y. H. Hu, Chem. Rev., 2020, 120, 10336–10453 CrossRef CAS PubMed.
- L. Lin, B. Deng, J. Sun, H. Peng and Z. Liu, Chem. Rev., 2018, 118, 9281–9343 CrossRef CAS PubMed.
- R. Muñoz and C. Gómez-Aleixandre, Chem. Vap. Deposition, 2013, 19, 297–322 CrossRef.
- H. Shu, X.-M. Tao and F. Ding, Nanoscale, 2015, 7, 1627–1634 RSC.
- J.-L. Shi, C. Tang, H.-J. Peng, L. Zhu, X.-B. Cheng, J.-Q. Huang, W. Zhu and Q. Zhang, Small, 2015, 11, 5243–5252 CrossRef CAS PubMed.
- Y. Ito, Y. Tanabe, H.-J. Qiu, K. Sugawara, S. Heguri, N. H. Tu, K. K. Huynh, T. Fujita, T. Takahashi, K. Tanigaki and M. Chen, Angew. Chem., Int. Ed., 2014, 53, 4822–4826 CrossRef CAS PubMed.
- L. Zhang, N. T. Alvarez, M. Zhang, M. Haase, R. Malik, D. Mast and V. Shanov, Carbon, 2015, 82, 353–359 CrossRef CAS.
- D. DeArmond, L. Zhang, R. Malik, K. Vamsi Krishna Reddy, N. T. Alvarez, M. R. Haase, Y.-Y. Hsieh, S. N. Kanakaraj, N. Oslin, J. Brunemann, J. Daum and V. Shanov, Mater. Sci. Eng., B, 2020, 254, 114510 CrossRef CAS.
- G. Ning, Z. Fan, G. Wang, J. Gao, W. Qian and F. Wei, Chem. Commun., 2011, 47, 5976–5978 RSC.
- M. Zhou, T. Lin, F. Huang, Y. Zhong, Z. Wang, Y. Tang, H. Bi, D. Wan and J. Lin, Adv. Funct. Mater., 2013, 23, 2263–2269 CrossRef CAS.
- S. Sunahiro, K. Nomura, S. Goto, K. Kanamaru, R. Tang, M. Yamamoto, T. Yoshii, J. N. Kondo, Q. Zhao, A. G. Nabi, R. Crespo-Otero, D. Di Tommaso, T. Kyotani and H. Nishihara, J. Mater. Chem. A, 2021, 9, 14296–14308 RSC.
- H. Nishihara, T. Simura, S. Kobayashi, K. Nomura, R. Berenguer, M. Ito, M. Uchimura, H. Iden, K. Arihara, A. Ohma, Y. Hayasaka and T. Kyotani, Adv. Funct. Mater., 2016, 26, 6418–6427 CrossRef CAS.
- Q. Zhao, M. Yamamoto, K. Yamazaki, H. Nishihara, R. Crespo-Otero and D. Di Tommaso, Phys. Chem. Chem. Phys., 2022, 24, 23357–23366 RSC.
- H. Nishihara, H.-W. Zhao, K. Kanamaru, K. Nomura, M. Ohwada, M. Ito, L.-X. Li, B.-G. An, T. Horikawa and T. Kyotani, Carbon Rep., 2022, 1, 123–135 CrossRef.
- A. Ohma, Y. Furuya, T. Mashio, M. Ito, K. Nomura, T. Nagao, H. Nishihara, H. Jinnai and T. Kyotani, Electrochim. Acta, 2021, 370, 137705 CrossRef CAS.
- K. Nomura, H. Nishihara, N. Kobayashi, T. Asada and T. Kyotani, Energy Environ. Sci., 2019, 12, 1542–1549 RSC.
- M. Yamamoto, S. Goto, R. Tang, K. Nomura, Y. Hayasaka, Y. Yoshioka, M. Ito, M. Morooka, H. Nishihara and T. Kyotani, ACS Appl. Mater. Interfaces, 2021, 13, 38613–38622 CrossRef CAS PubMed.
- W. Yu, T. Yoshii, A. Aziz, R. Tang, Z.-Z. Pan, K. Inoue, M. Kotani, H. Tanaka, E. Scholtzová, D. Tunega, Y. Nishina, K. Nishioka, S. Nakanishi, Y. Zhou, O. Terasaki and H. Nishihara, Adv. Sci., 2023, 10, 2300268 CrossRef CAS PubMed.
- Z. Shen, W. Yu, A. Aziz, K. Chida, T. Yoshii and H. Nishihara, J. Phys. Chem. C, 2023, 127, 6239–6247 CrossRef CAS.
- W. Yu, Z. Shen, T. Yoshii, S. Iwamura, M. Ono, S. Matsuda, M. Aoki, T. Kondo, S. R. Mukai, S. Nakanishi and H. Nishihara, Adv. Energy Mater., 2023, 2303055 Search PubMed , n/a.
- K. Nomura, H. Nishihara, M. Yamamoto, A. Gabe, M. Ito, M. Uchimura, Y. Nishina, H. Tanaka, M. T. Miyahara and T. Kyotani, Nat. Commun., 2019, 10, 2559 CrossRef PubMed.
- B. Xu, L. Peng, G. Wang, G. Cao and F. Wu, Carbon, 2010, 48, 2377–2380 CrossRef CAS.
- H. Wang, J. Wang, S. Xie, W. Liu and C. Niu, Nanoscale, 2018, 10, 6159–6167 RSC.
- H. Gu, D. Cao, J. Wang, X. Lu, Z. Li, C. Niu and H. Wang, Mater. Today Energy, 2017, 4, 75–80 CrossRef.
- C. Tang, B.-Q. Li, Q. Zhang, L. Zhu, H.-F. Wang, J.-L. Shi and F. Wei, Adv. Funct. Mater., 2016, 26, 577–585 CrossRef CAS.
- K. Pirabul, Z.-Z. Pan, R. Tang, S. Sunahiro, H. Liu, K. Kanamaru, T. Yoshii and H. Nishihara, Bull. Chem. Soc. Jpn., 2023, 96, 510–518 CrossRef CAS.
- G. Kresse and J. Furthmüller, Comput. Mater. Sci., 1996, 6, 15–50 CrossRef CAS.
- J. P. Perdew, K. Burke and M. Ernzerhof, Phys. Rev. Lett., 1996, 77, 3865–3868 CrossRef CAS PubMed.
- S. Grimme, J. Antony, S. Ehrlich and H. Krieg, J. Chem. Phys., 2010, 132, 154104 CrossRef PubMed.
- A. Jain, S. P. Ong, G. Hautier, W. Chen, W. D. Richards, S. Dacek, S. Cholia, D. Gunter, D. Skinner and G. Ceder, APL Mater., 2013, 1, 011002 CrossRef.
- K. S. P. Karunadasa, C. H. Manoratne, H. M. T. G. A. Pitawala and R. M. G. Rajapakse, J. Phys. Chem. Solids, 2019, 134, 21–28 CrossRef CAS.
- D. Sheppard, R. Terrell and G. Henkelman, J. Chem. Phys., 2008, 128, 134106 CrossRef PubMed.
- W. H. Bragg and W. L. Bragg, Proc. R. Soc. London, Ser. A, 1913, 88, 428–438 CAS.
- E. P. Barrett, L. G. Joyner and P. P. Halenda, J. Am. Chem. Soc., 1951, 73, 373–380 CrossRef CAS.
- T. Ishii, S. Kashihara, Y. Hoshikawa, J. Ozaki, N. Kannari, K. Takai, T. Enoki and T. Kyotani, Carbon, 2014, 80, 135–145 CrossRef CAS.
- X. He, X. Guo, G. Xia, R. Xu, Y. Wu and X. Luan, Catalysts, 2023, 13(3), 487 CrossRef CAS.
- C. J. M. Fletcher and C. N. Hinshelwood, Proc. R. Soc. London, Ser. A, 1934, 146, 357–362 CAS.
- W. Zhang, P. Wu, Z. Li and J. Yang, J. Phys. Chem. C, 2011, 115, 17782–17787 CrossRef CAS.
- J. Li, E. Croiset and L. Ricardez-Sandoval, J. Mol. Catal. A: Chem., 2012, 365, 103–114 CrossRef CAS.
- J. Biscoe and B. E. Warren, J. Appl. Phys., 1942, 13, 364–371 CrossRef CAS.
- P. K. Mubari, T. Beguerie, M. Monthioux, E. Weiss-Hortala, A. Nzihou and P. Puech, C, 2022, 8(1), 4 CAS.
- A. Gupta, G. Chen, P. Joshi, S. Tadigadapa and P. C. Eklund, Nano Lett., 2006, 6, 2667–2673 CrossRef CAS PubMed.
- A. C. Ferrari, Solid State Commun., 2007, 143, 47–57 CrossRef CAS.
- A. C. Ferrari, J. C. Meyer, V. Scardaci, C. Casiraghi, M. Lazzeri, F. Mauri, S. Piscanec, D. Jiang, K. S. Novoselov and S. Roth, Phys. Rev. Lett., 2006, 97, 187401 CrossRef CAS PubMed.
- T. Xia, T. Yoshii, K. Nomura, K. Wakabayashi, Z.-Z. Pan, T. Ishii, H. Tanaka, T. Mashio, J. Miyawaki, T. Otomo, K. Ikeda, Y. Sato, M. Terauchi, T. Kyotani and H. Nishihara, Chem. Sci., 2023, 14, 8448–8457 RSC.
- X. Díez-Betriu, S. Álvarez-García, C. Botas, P. Álvarez, J. Sánchez-Marcos, C. Prieto, R. Menéndez and A. de Andrés, J. Mater. Chem. C, 2013, 1, 6905–6912 RSC.
- A. Jorio and L. G. Cançado, Solid State Commun., 2013, 175, 3–12 CrossRef.
- R. Tang, K. Nomura, K. Inoue, M. Kotani, T. Kyotani and H. Nishihara, Electrochim. Acta, 2022, 429, 141009 CrossRef CAS.
- Y.-T. Lu, W.-Y. Jao, C.-W. Tai and C.-C. Hu, J. Taiwan Inst. Chem. Eng., 2023, 104978 Search PubMed.
Footnotes |
| † Electronic supplementary information (ESI) available: Related energy profiles, optimized structures, SEM images, N2 adsorption/desorption isotherms, and Nyquist plots. See DOI: https://doi.org/10.1039/d4gc00116h |
| ‡ Equally contributed and regarded as co-first authors. |
| This journal is © The Royal Society of Chemistry 2024 |