
 Open Access Article
 This Open Access Article is licensed under a Creative Commons Attribution-Non Commercial 3.0 Unported Licence
Facile synthesis of electrocatalytically active Cu/graphite using the negative electrode of spent Li-ion batteries†
Hiroshi
Itahara
 *,
Naonari
Sakamoto
,
Naoko
Takahashi
,
Satoru
Kosaka
and
Yasuhiro
Takatani
*,
Naonari
Sakamoto
,
Naoko
Takahashi
,
Satoru
Kosaka
and
Yasuhiro
Takatani
Toyota Central R&D Labs., Inc., 41-1 Yokomichi Nagakute, Aichi 480-1192, Japan. E-mail: h-itahara@mosk.tytlabs.co.jp
First published on 11th January 2024
Abstract
We demonstrate that graphite-powder-supported Cu-based fine particles, which exhibit unique electrocatalytic performance, are facilely producible at room temperature using the graphite negative electrode of a spent Li-ion battery. A majority of impurity substances containing Li, F, and P, which are the elements attributable to the solid electrolyte interphase formed on the surface of spent graphite powder, were removed by washing with water. By contrast, when the spent graphite was dispersed into a CuCl2 aqueous solution, P remained along with deposited Cu species, whereas Li and F were similarly removed. Synchrotron and microstructural analyses revealed that the fine particles deposited onto graphite powder were mainly composed of copper oxides such as Cu3(PO4)2 and CuO, which were subsequently reduced by an electrochemical treatment at room temperature, resulting in metallic Cu particles with a needle-like morphology. The thus-obtained Cu/graphite powder was found to be active toward the electrochemical synthesis of C2+ products (i.e., C2H4, C2H5OH and C3H7OH). The results also showed that such catalytically active Cu-based compounds were not formed on graphite in the case where a pristine graphite powder was used, suggesting that the use of a spent graphite negative electrode would open an environmentally benign route to the synthesis of electrocatalysts.
1. Introduction
With the rapid increase in demand for Li-ion batteries (LIBs) as power sources for electrical vehicles and electrical power storage systems, the development of recycling technologies for spent LIBs has been attracting increasing attention. The current commercial pyrometallurgical or hydrometallurgical recycling process targets mainly the recovery of valuable metals from the positive electrodes (e.g., Co and Ni) and current collectors (Cu and Al) of spent LIBs.1,2 By contrast, carbon species such as graphite from the negative electrodes and conductive carbon additives are consumed as energy resources and reducing agents or are wasted as part of slags or filtrate residues in the positive-electrode recycling processes.2,3 The spent negative electrodes account for 12–21 wt% of LIBs4 and contain, in general, Li-, F-, and P-based impurity compounds; thus, burning or disposing of them raises environmental concerns from the perspective of not only losing carbon resources but also generating toxic compounds and CO2.Studies aimed at recovering the spent graphite negative electrodes have only recently been conducted. Regenerating them as a negative electrode material typically includes removing the aforementioned impurities, followed by a high-temperature heat treatment (typically >1000 °C) for graphitization.5,6 Fine tuning the microstructure of the graphite (e.g., B-doped7 and P-doped8 and amorphous carbon-coated graphite9,10) has also been attempted, with the objective of improving the electrochemical storage capacity or cycle performance of the regenerated negative electrodes. In addition, researchers have been exploring methods of using spent graphite by adding new value, such as the ability to be used as catalysts and adsorbents for environmental purification (e.g., copper-based compounds,11,12 Mg(OH)2,13 or MnO2![[thin space (1/6-em)]](https://www.rsc.org/images/entities/char_2009.gif) 14 supported on carbon powder).
14 supported on carbon powder).
A previous study11 described the preparation of CuO powders by calcining the spent negative electrode composed of a graphite electrode layer and a copper current-collector substrate at 650 °C in air, with the objective of developing a Cu-based catalyst for organic pollutant degradation. In another study,12 Cu/graphene oxide composite powders were prepared by transforming the graphite in the electrode layer detached from the collector into graphene powders via the Hummers’ method using concentrated aqueous sulfuric acid in conjunction with KMnO4. The thus-obtained powder was dispersed into a copper sulfate (Cu2+) aqueous solution that was separately prepared using a Cu current collector as a copper source. These studies provide insights into possible applications other than regenerated negative electrodes and into methods that also utilize the Cu in spent LIBs.
Cu-based compounds, such as elemental Cu metal and Cu oxides, can be used as electrochemical catalysts for C–C coupling reactions15 to produce C2+ products (i.e., C2H4, C2H5OH and C3H7OH) used as fuels or industrial raw materials. Various synthesis methods, including heating copper oxide,16 chemical treatment of a thin film,17 colloidal synthesis,18 and electrodeposition onto a substrate,19 have been developed to prepare Cu-based catalyst particles. These methods typically use high temperatures (>500 °C) or environmentally hazardous substances (e.g., surfactant and concentrated acidic and alkaline solutions). Thus, room exists for developing more environmentally benign synthesis routes.
In the current study, we demonstrate the facile room-temperature synthesis of Cu-based fine particles supported on a graphite catalyst. As a model for the spent graphite negative electrode, we used the negative electrode removed from a commercial LIB after a cycle test. The Cu-based fine particles supported on graphite powder were obtained by simply dispersing the spent graphite powder into a weakly acidic aqueous solution containing Cu2+ ion, whereas such powder-supported Cu species could not be obtained in the alternative case using pristine graphite powder. We subsequently conducted an electrochemical treatment (ECT) at room temperature and a heat treatment at temperatures as high as 450 °C to prepare catalytically active materials. We carried out the same procedure using commercial (pristine) graphite and copper particles as a control sample and compared its electrochemical properties with those of the samples prepared from materials recovered from a spent LIB.
2. Experimental
2.1. Model of the spent graphite negative electrode
As a model for spent LIBs, we used a commercial cylindrical battery (Panasonic, NCR18650B) after 575 cycles under galvanostatic charge/discharge conditions at 0.5C between 2.5 and 4.2 V at 60 °C. The initial capacity and the capacity after cycling were 3398.5 and 2627.0 mA h, respectively (i.e., the capacity retention was 77%). Here, the LIB consisted of a LiNi0.8Co0.15Al0.05O2 (NCA) positive electrode and a graphite negative electrode.20 Such high-temperature cycling conditions have been reported to accelerate the growth of a solid-electrolyte interphase (SEI) at the surface of the negative electrode material.21,22After the commercial LIB was discharged at a constant current (0.1C) and maintained at 0 V for 5 h, it was manually disassembled in an Ar-filled glovebox to isolate the negative electrode from the other components (e.g., the positive electrode and separator). The voltage of the battery immediately before disassembly was 0.79 V. The negative electrode (i.e., the electrode layer coated on a current-collector substrate) was immersed into dimethyl carbonate for 15 s to remove the attached electrolyte species. After the electrode was allowed to dry at room temperature, the active materials layer composed mainly of graphite and binder was mechanically peeled from the current collector using a spatula and then ground using a mortar and pestle to obtain a powdered sample (S-NE sample). The thus-obtained powder was used as a raw material to prepare the graphite-supported copper-based fine particles (Cu/graphite) powder under ambient atmosphere via the methods described in the next section. As a reference sample, a specimen of the S-NE sample powder (250 mg) was dispersed in ultrapure water (100 mL), ultrasonicated for 15 min at room temperature, filtered, and then dried under vacuum at 80 °C for 2 h (W-NE sample).
2.2. Synthesis of composite powder containing Cu and graphite
[Cu-NE_RT sample] A sample of the S-NE powder (250 mg) was dispersed into a CuCl2 aqueous solution (7.4 mM, 100 mL) and ultrasonicated for 15 min at room temperature; the product was collected by filtration and dried under vacuum at 80 °C for 2 h.[Cu-NE_HT sample] A sample of the Cu-NE_RT powder was heat-treated (HT) as follows. The powder (50 mg) was placed in a BN pot, and the pot was placed in a stainless steel cell (inner volume of ∼10 cm3) under an Ar atmosphere; the powder was then heat-treated for 2 h at 150, 300, or 450 °C (resulting in samples Cu-NE_HT150, Cu-NE_HT300, and Cu-NE_HT450, respectively). After being washed with water, the samples were dried under vacuum at 80 °C for 2 h.
[Cu-NE_ECT sample] A sample of the Cu-NE_RT powder was electrochemically treated (ECT) as follows. The powder (∼1 mg) was placed evenly in a ∼1 cm2 region on the microporous surface layer of a carbon paper (Avcarb, GDS3250). We used a membrane electrode assembly (MEA) cell electrolyzer (Dioxide Materials, Carbon Dioxide Electrolyzer), which is composed of two flow plates for the sample/carbon paper (cathode) and Ni-foam (anode) electrodes, Teflon spacers, and an anionic-exchange membrane (AEM; Sustainion® X37-50 Grade RT). Dry CO2 was fed to the cathode at 10 standard cubic centimeters per minute (SCCM) while a recirculated 1 M KOH solution was fed to the anode at a flow rate of 100 mL min−1. The Cu-NE_ECT sample was prepared by applying a constant negative potential to the cathode (−2.5 V vs. anode) for 1 h.
[Cu-Gr_imp sample] As a reference sample, we prepared the powder by using the conventional impregnation method which is one of the typical synthetic methods to obtain supported metal catalysts. A commercial graphite powder (250 mg, Osaka Gas Chemical, OMAC 1s) was dispersed into a CuCl2 aqueous solution (7.4 mM, 100 mL), and then, water was removed from the dispersion solution using an evaporator. The thus-obtained impregnation preparation mixture powder was placed in a quartz boat in a tube furnace (inner diameter of ca. 50 mm) and heat-treated at 450 °C for 2 h under a H2 (4 vol%)/Ar mixture flowing at 500 mL min−1 at atmospheric pressure.
[Cu-Gr_mix sample] The mixture powder sample was prepared as a reference sample by mechanically mixing graphite (Osaka Gas Chemical, OMAC 1s) and Cu powder (Kojundo Chemical, ∼1 μm) as reagents.
[nanoCu-Gr_mix sample] As a typical example of nanosized Cu catalyst, we used a commercial Cu nano-powder (Sigma-Aldrich, ∼25 nm). Cu nano-powder and graphite (Osaka Gas Chemical, OMAC 1s) were dispersed in ultrapure water, ultrasonicated for 15 min at room temperature, and then, water was removed from the dispersion solution using an evaporator.
2.3. Characterization
Crystalline phases were identified using powder X-ray diffraction (XRD; Rigaku, RINT-TTR). The microstructural properties were evaluated by scanning electron microscopy (SEM; Hitachi High-Technologies, SU3500, S4800, and SU7000), high-angle annular dark-field scanning transmission electron microscopy (HAADF-STEM; Thermo Fisher Scientific, Talos F200X), and STEM with energy-dispersive X-ray spectroscopy (STEM-EDX). Composition analysis was conducted by inductively coupled plasma mass spectrometry (ICP-MS, Agilent Technologies, Agilent 8900) and combustion ion chromatography (IC) using a combination of an automated combustion unit (Nittoseiko Analytech, AQF-100) and an IC system (Thermo Fisher Scientific, ICS-1100). The thermal decomposition behaviors of the S-NE and W-NE sample powders were analyzed using differential thermogravimetric analysis (TG; Rigaku, THERMO PLUS); the samples were heated to 800 °C at a heating rate of 10 °C min−1 under flowing air (500 mL min−1).Hard X-ray photoelectron spectroscopy (HAXPES) measurements were conducted at the BL16XU beamline of Super Photon Ring 8 GeV (SPring-8). The photon energy was set to 7.942 keV. The photoelectrons were detected using a hemispherical analyzer (Scienta, R4000). The photoelectrons were determined at a photoelectron take-off angle of 80°. Here, the angle perpendicular to the surface is defined as 90°. Cu K-edge X-ray absorption near edge structure (XANES) spectra were acquired in transmission mode using the BL16B2 beamline at SPring-8. The angle between the sample surface and the direction vector of incident X-rays was 90°.
As a demonstration of a potential application of the synthesized powders, we attempted electrochemical C2+ product synthesis using the aforementioned MEA in the same configuration. A potentiostat/galvanostat (Bio-Logic Science Instruments, SP-150) was used for electrochemical measurements. All applied potentials and voltages were determined without iR compensation. Gases produced while a constant potential was applied at the cathode (−2.5 V vs. anode) with dry CO2 gas supplied (10 SCCM) were measured in situ23 using a gas chromatograph (GC, SRI Instruments, Multiple Gas Analyzer #5) equipped with an autosampler and Molecular Sieve SA and Hayesep-D columns, which were connected to the MEA cell. The gas was fed to the gas analysis GC after passing through a trap vessel filled with ultrapure water. The trap vessel was intended to collect the liquid product from the cathode. The amount of alcohol products was determined by GC–mass spectrometry (GC-MS; GCMS-QP2020 NX and HS-20 NX Trap headspace sampler system, Shimadzu Corporation) with a CP-Volamine column using the water in the trap container and the anolyte. The amount of HCOO− was determined using ion chromatography (Dionex, ICS-2100) with IonPacAS15 and IonPacAG15 columns, where the column temperature was maintained at 308 K.
3. Results and discussion
3.1. Characterization of S-NE sample
The XRD pattern of the S-NE sample powder was assigned to graphite with no impurity phases (Fig. 1(a) and Fig. S1 in the ESI†). SEM images (Fig. 1(b), S2, and S3†) show that the microstructure of the sample was composed of spherical secondary particles 10–15 μm in size, which were granulated primary graphite platelets. SEM-EDX mapping images (Fig. 1(c)–(f)) show that O, F, and P were present in the slit-like spaces between stacked primary platelets and gaps between round secondary particles.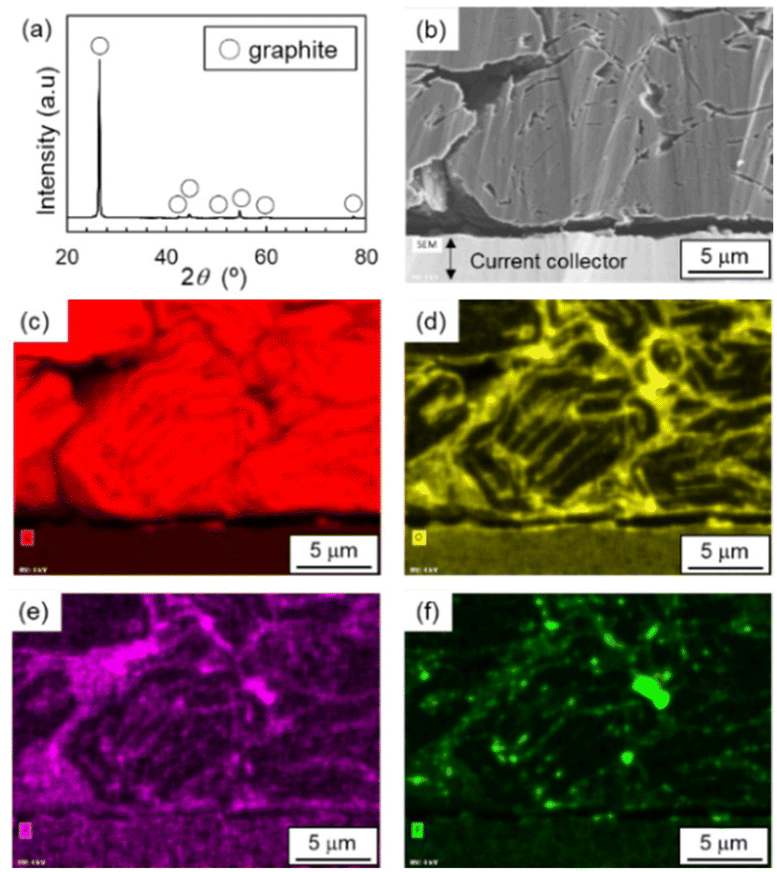 | ||
| Fig. 1 (a) Powder XRD pattern, (b) cross-sectional SEM image, and (c–f) SEM-EDX mapping images of (c) C, (d) O, (e) P, and (f) F for the S-NE sample. | ||
The concentrations of Li, F, and P were 1.3, 1.1, and 0.37 wt%, respectively (Fig. 2(a) and Table S1†); trace amounts of contaminant elements attributable to the positive electrode material and the current collectors (i.e., Ni, Co, Al, and Cu) were also detected (Table S1†). More than 90% of the Li, F, and P included in the S-NE sample was removed by washing with water (W-NE sample: Fig. 2(a) and Table S1†), consistent with previously reported results.5 According to TG data acquired under flowing air (Fig. 2(b)), the weight loss observed for the S-NE sample began at a lower temperature than the weight loss of the W-NE sample. The amount of residue after the TG measurement of the S-NE sample was greater than that after the measurement of the W-NE sample, where all the carbon species were burnt out during heating to 800 °C under flowing air. In addition, peaks assigned to LiF and Li2CO3 were observed in the XRD pattern of the S-NE sample after the sample was heated at 600 °C in flowing N2 (Fig. 2(c)), whereas no crystalline phases other than graphite were detected in the W-NE sample treated under the same conditions (Fig. 2(d)).
 | ||
| Fig. 2 (a) Contents of impurities and (b) thermal decomposition behaviours for S-NE and W-NE samples; (c and d) XRD patterns for (c) S-NE and (d) W-NE samples after the samples were heated at 600 °C under flowing N2. | ||
The amount of Li (1.3 wt%) detected in the S-NE sample is similar to that reported for a sample of spent graphite recovered from a commercial LIB after normal use.6 An SEI film containing LixPOyFz, Li2O, LiF, and Li2CO3, which are derived from electrolyte decomposition, is known to form on the surface of a spent graphite negative electrode.24 The majority of the components included in the SEI film were considered to be removed by washing with water (W-NE sample); thus, the amount of residue after the heat treatment of the W-NE sample was smaller than that of the S-NE sample (Fig. 2(b)). Here, we note that a negative electrode layer was immediately detached from the Cu current collector when the current collected was immersed into water and that the layer loosened into powder form, coloring the water yellow (Fig. S4†). By contrast, the layer remained attached even after it was immersed into N-methyl pyrrolidone for 24 h. Thus, we speculate that the spent negative electrode used in this study contained a water-based binder and plasticizer that were washed out with water. This interpretation is consistent with the observation that the weight loss for the S-NE sample started at a lower temperature than that of the W-NE sample (Fig. 2(b)). The water-based binder and plasticizer typically used in LIBs (e.g., styrene–butadiene rubber and carboxymethyl cellulose, respectively) start to decompose at temperatures of 250 and 350 °C,25 respectively, which are substantially lower than the decomposition temperature of graphite (>500 °C).5
3.2. Deposition behavior of Cu species on graphite powder
The peaks in the powder XRD pattern of the Cu-NE_RT sample were assigned to graphite; no other crystalline phases were detected (Fig. S5†). In the case of the Cu-NE_RT sample, Li and F were removed, similar to the case of the W-NE sample; however, compared with the amount of P that remained on the graphite in the W-NE sample, that in the Cu-NE_RT sample was substantially greater (Table S1†). In addition, the distributions of P and Cu were nearly overlapped in the Cu-NE_RT sample (Fig. 3(a)–(d)). The HAXPES (Fig. 3(e)) and XANES (Fig. 3(f) and S6†) spectra of Cu in the Cu-NE_RT sample were similar to the spectra of Cu in Cu3(PO4)2 and CuO. | ||
| Fig. 3 (a) SEM image, (b–d) SEM-EDX mapping images of (b) C, (c) Cu, and (d) P, and (e) HAXPES and (f) Cu K-edge XANES spectra for the Cu-NE_RT sample (metallic Cu and copper oxides are commercial samples). | ||
The interlayer spacings and the number of defects in graphite platelets have been reported to be increased by washing with a strong acid solution (e.g., HCl or citric acid) to remove impurities from spent graphite negative electrodes.4,26 The XRD patterns and Raman spectra of the Cu-NE_RT sample are similar to those of the S-NE sample (Fig. S5 and S7†). The CuCl2 aqueous solution used to prepare the Cu-NE_RT sample was only slightly acidic (pH = 5.0); thus, an acid-induced increase of the interlayer spacing was unlikely.
In order to gain an in-depth understanding of the deposition behavior of Cu species on graphite particles, we measured the pH of the aqueous solutions in the present synthesis process. First, the pH of the CuCl2 aqueous solution (Cu: 7.4 mM) was 5.0. The supernatant solution obtained in the case where S-NE powder (250 mg) was dispersed in ultrapure water (100 mL) was slightly alkaline with a pH of 9.3 (P: 0.38 mM). A pH of 5.6 was measured for the filtrate obtained after S-NE powder (250 mg) was dispersed in CuCl2 aqueous solution (100 mL) for preparation of the Cu-NE_RT sample. Based on the potential-pH diagram for the copper–phosphate–water system,27 the stable pH values for Cu3(PO4)2 and CuO are about 5–7 and 7–14, respectively, under the deposition conditions used (Cu: 7.4 mM, P: 0.38 mM). This is consistent with the result that the Cu-NE_RT sample was mainly composed of Cu3(PO4)2 and CuO (Fig. 3(e) and (f) and Fig. S6†). In contrast, no Cu-containing fine particles were deposited when an aqueous H3PO4 solution (pH: 0.79) was mixed with CuCl2 aqueous solution (pH: 5.0) with the same Cu and P concentrations. In addition, these Cu oxides were not deposited when the W-NE sample and reagent graphite powders were used instead of the S-NE powder (Fig. S8 and S9†). These results suggest that co-existence of Li and P tunes the pH of the solution to produce Cu3(PO4)2 and CuO, and that the spent graphite negative electrode is useful for this purpose. Furthermore, we found that fine particles containing transition metals other than Cu, namely Fe, Co and Ni, were similarly deposited using a spent graphite negative electrode in the same process (Fig. S10†).
3.3. Microstructures and electrochemical properties of synthesized composite powders
Fine particles containing Cu (bright contrast) and graphite particles (dark contrast) were observed in the cross-sectional STEM image of the Cu-NE_RT sample (Fig. 4). The Cu-containing particles can be divided into two types of particles: isolated particles with sizes of ∼50 nm (e.g., denoted as no. 1–3 in Fig. 4(a)) and agglomerates composed of finer particles (e.g., no. 4 and 5 in Fig. 4(a)). The molar ratios of P/Cu and O/Cu were 0.01 and 0.01–0.03 for the former particles and 0.24–0.25 and 0.63–0.67 for the latter particles, respectively (Fig. S11†). The electron diffraction (ED) pattern for the former particles corresponds to Cu metal (Fig. S12(a)†), whereas that for the latter particles suggests that more than two substances agglomerated (Fig. S12(b)†). The interplane spacings derived from the ED pattern (Fig. S12(b)†) correspond to those of Cu3(PO4)2 and CuO. Although the main products were Cu3(PO4)2 and CuO, as indicated by the HAXPES and XANES spectra (Fig. 3(e) and (f)), a small amount of elemental Cu metal particles (size ∼50 nm) may also have been formed by reduction of copper ions on the spent graphite surface.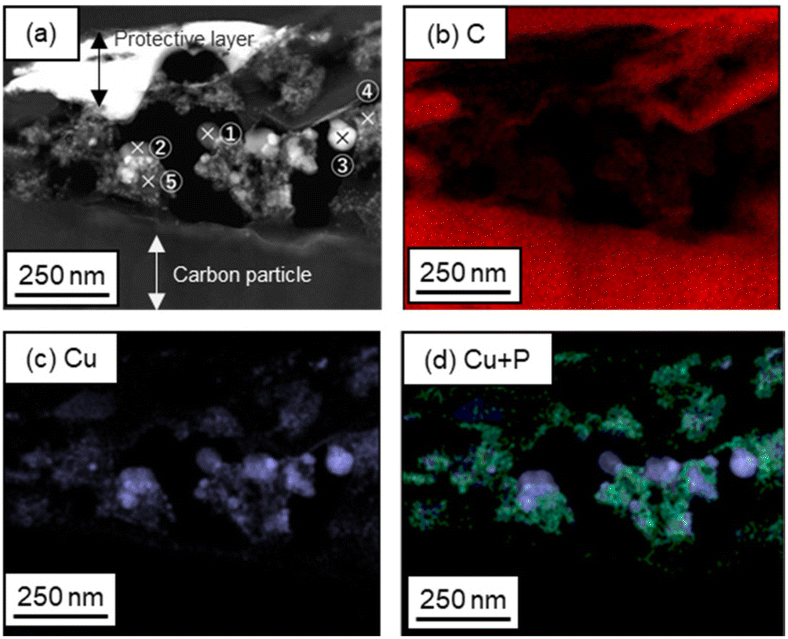 | ||
| Fig. 4 (a) Cross-sectional STEM image, (b and c) STEM-EDX mapping images of (b) C and (c) Cu, and (d) a STEM-EDX overlap image of Cu + P for the Cu-NE_RT sample. | ||
A reduction treatment of copper oxides is one of the methods used to activate Cu-based catalysts.19 In the present study, the Cu-NE_RT sample was subjected to heat treatment (HT) under an inert atmosphere at elevated temperatures and an electrochemical treatment (ECT) at a negative potential applied at room temperature.
First, Fig. 5 shows the changes in the characteristics of a Cu-NE_RT sample heated to various HT temperatures. The XRD patterns of both the Cu-NE_RT (before HT) and Cu-NE_HT150 (after HT at 150 °C) samples show peaks corresponding to graphite, with no peaks of other crystalline phases (Fig. 5(a)). By contrast, the XRD patterns of the Cu-NE_HT300 and HT450 samples (HT at 300 and 450 °C, respectively) show peaks corresponding to graphite and Cu metal. The XANES spectra gradually changed from spectra similar to those of Cu3(PO4)2 and CuO to a spectrum similar to that of metallic Cu as the HT temperature was increased (Fig. 5(b) and Fig. S13†).
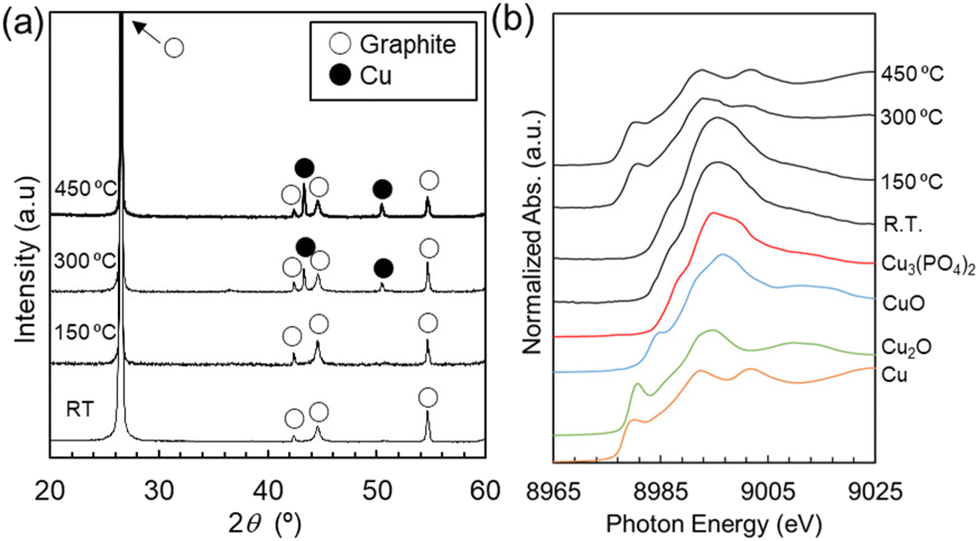 | ||
| Fig. 5 (a) XRD patterns and (b) Cu–K-edge XANES spectra for the Cu-NE_RT, HT150, HT300, and HT450 samples (metallic Cu and copper oxides are commercial samples). | ||
The amount of Cu was the same before and after the HT at temperatures as high as 450 °C (Table S1†). According to the SEM images (Fig. 6(a)–(c)), granular particles composed of mainly Cu were observed in the Cu-NE_HT450 sample. The HAXPES (Fig. 6(d)) and XANES spectra (Fig. 5(b)) are identical to those of Cu metal, suggesting that Cu–P intermetallic compounds28 or P-doped Cu29 was not formed under the current preparation conditions. Here, the reference Cu-Gr_imp and Cu-Gr_mix samples for catalytic activity measurements had a similar Cu loading (3.0 wt%) and a microstructure composed of micron-sized Cu and graphite particles (Fig. S14 and S15†).
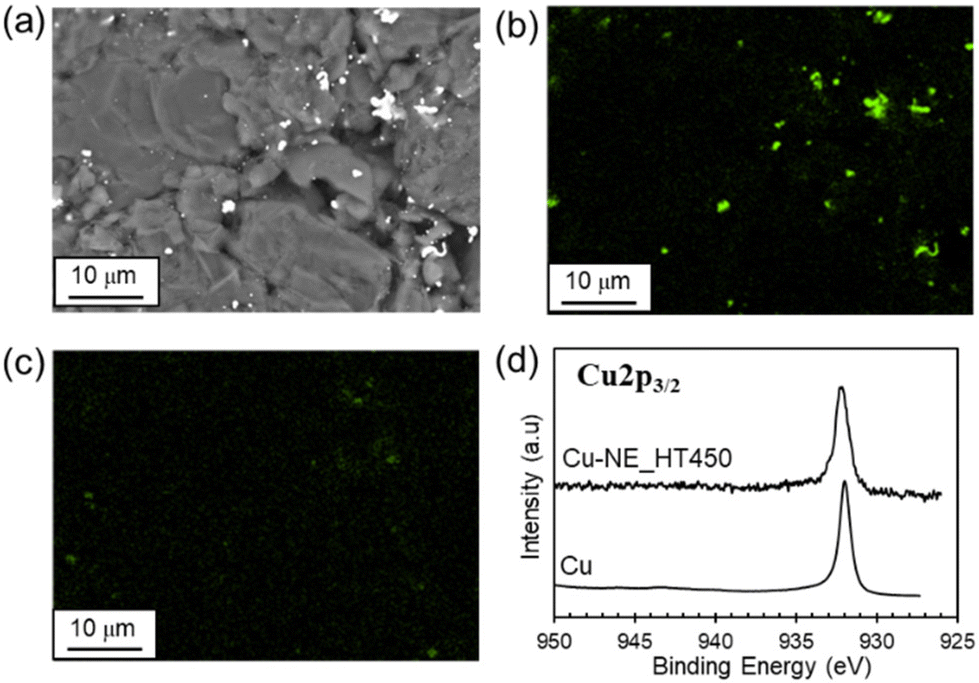 | ||
| Fig. 6 (a) SEM image, (b and c) SEM-mapping images of (b) Cu and (c) P, and (d) the HAXPES spectrum for the Cu-NE_HT450 sample (Cu: reference commercial sample). | ||
Second, Fig. 7 shows the characteristics of the Cu-NE_ECT sample. The electrolyte component K was widely distributed over the carbon paper support and the graphite particles (Fig. 7(a) and (b) and Fig. S16†). The particles containing Cu in the Cu-NE_ECT sample exhibited a needle-like morphology (Fig. 7(c) and Fig. S16†). Notably, the shape of the Cu-containing particles clearly differs from that of the Cu-containing particles in the Cu-NE_HT450 sample (granular particles: Fig. 6(a) and (b), Fig. S17 and S18†); however, the HAXPES spectra for both samples correspond to metallic Cu (Fig. 6(d) and 7(d), respectively).
 | ||
| Fig. 7 (a and c) SEM images, (b) the SEM-EDX mapping overlap image for K, Cu, and O, and (d) the HAXPES spectrum for the Cu-NE_ECT sample (Cu: reference commercial sample). | ||
A trace amount of copper was detected in the anolyte solution after the electrochemical treatment (ECT, Table S2†), indicating that some Cu was dissolved during reduction of the copper oxide particles in the ECT process. It has been reported that application of a negative electric field induces a rearrangement of Cu atoms.30,31 Cu particles were reported to grow anisotropically under mass transport-limited conditions32 so that the composition and size of the Cu-containing particles in these samples would affect their morphology.
Finally, we observed gaseous and liquid products, such as C1 (i.e., CO, CH4 and HCOOH) and C2+ (i.e., C2H4, C2H5OH and C3H7OH) products, both of which are formed from CO2 as a carbon source. A small amount of these products was produced in cases where the cathode was composed of S-NE and W-NE sample powders (Fig. S19†), suggesting that contaminant components from the positive electrode (e.g., Ni, Co, and Al) did not show catalytic activity. By contrast, a reductive current related to the formation of these products was observed when Cu-containing powders (i.e., Cu-NE_ECT, Cu-NE_HT450, and reference Cu-Gr_imp and Cu-Gr_mix samples) were used as cathode materials in an MEA (Fig. S20†). Table S3† shows the current efficiency for C1 (i.e., CO, CH4 and HCOOH) and C2+ (i.e., C2H4, C2H5OH and C3H7OH) products, which is defined as the ratio between the amount of electricity consumed for the formation of each product and the total amount of electricity that flowed through the cathode. The Cu-NE_ECT sample showed comparable or higher C2+ product selectivity than the reference Cu-Gr_imp and Cu-Gr_mix samples for a similar amount of Cu (Table S3†).
In order to examine the usefulness of the current synthetic method, we compared the catalytic performance of the Cu-NE_ECT sample with those of typical Cu-based bulk catalysts and Cu nanoparticles. First, the bulk catalysts used were a commercial Cu powder (Kojundo Chemical, ∼1 μm, Fig. S21†) and the previously reported CuO powder11 (∼1–5 μm, Fig. S22†) prepared from a spent graphite negative electrode. The CuO powder was obtained by calcining an electrode composed of a graphite electrode layer and a copper current-collector substrate (see ESI† for details). These Cu and CuO catalyst powders (∼3 mg) were placed onto the carbon paper used in the MEA and were found to show catalytic activity for the formation of both C1 and C2+ products (Fig. S23 and Table S4†). However, the utilization ratio for the catalysts was extremely low: i.e., the amount of Cu in these samples (∼3 mg) was ∼100 times larger than that in the Cu-NE_ECT sample (∼0.04 mg with ∼1.2 mg graphite), but the amount of evolved product was only 2–3 times larger than that for the Cu-NE_ECT sample (Fig. S24†). This suggests that the graphite powder contained in the Cu-NE_ECT sample worked well as a conductive additive. Additives such as carbon powder and ionomer are typically mixed with catalyst powders.33 Second, we compared the catalytic performance of the Cu-NE_ECT sample with that of the sample with Cu nanoparticles. Cu nanoparticles are typically synthesized by solution chemistry route.34 Here, we prepared the reference nanoCu-Gr_mix sample by dispersing commercial Cu nanoparticle and graphite powders in water. The nanoCu-Gr_mix sample showed higher catalytic activities when compared to Cu-NE_ECT sample (Fig. S25 and Table S5†). Although nano- and macroscale factors including the surface state of the catalyst particles35 and the catalyst layer structure33 affect the observed catalytic activity and selectivity, it was demonstrated that the electrocatalytically active Cu particles were facilely producible at room temperature by using a spent graphite negative electrode. In addition, such catalytic active Cu-based compounds were not formed when pristine graphite powder was used in the same synthesis procedure (Fig. S9†). The impregnation prepared mixture powder of copper salt and pristine graphite powder can be used as a precursor for Cu/graphite catalyst; however, the high-temperature heat-treatment is necessary to convert copper salt into Cu catalyst (Fig. S14 and S20†). These results suggest that the current synthetic method could widen the application range of spent graphite negative electrodes.
4. Conclusions
We developed an effective synthesis route to obtain electrocatalytically active Cu fine particles supported on graphite powder using a spent negative graphite electrode. As a model for a spent LIB, we used a commercial cylindrical battery that had been cycle tested. The negative electrode was manually removed from the battery and simply dispersed into a CuCl2 aqueous solution at room temperature, resulting in the formation of copper oxides (mainly Cu3(PO4)2 and CuO) on the surface of the graphite powder. The P originated from the SEI film grown on the surface of the spent graphite. As a second step, an electrochemical treatment at room temperature was conducted to reduce the copper oxides on the graphite, resulting in metallic Cu supported on graphite (Cu/graphite) powder. Such Cu/graphite powder could not be obtained using pristine graphite or spent graphite powders that did not contain P washed out of the SEI with water. The Cu/graphite powder exhibited electrocatalytic activity toward the formation of C2+ products (i.e., C2H4, C2H5OH and C3H7OH), suggesting that spent graphite negative electrodes can be used in an environmentally benign synthetic route to obtain electrocatalysts.Conflicts of interest
There are no conflicts to declare.Acknowledgements
The authors thank Ms Mio Shibata of Toyota Central R&D Labs., Inc. for HAXPES measurements. The synchrotron radiation experiments of HAXPES and XAFS were performed at SPring-8 with the approval of the Japan Synchrotron Radiation Research Institute (JASRI) (BL16XU and 16B2; proposal no. 2022B5070, 2023A5070, 2022A5371, 2022B5371 and 2023A5371).References
- H. Pinegar and Y. R. Smith, Recycling of End-of-Life Lithium Ion Batteries, Part I: Commercial Processes”, J. Sustainable Metall., 2019, 5, 402–416 CrossRef.
- M. Abdollahifar, S. Doose, H. Cavers and A. Kwade, Graphite Recycling from End-of-Life Lithium-Ion Batteries: Processes and Applications, Adv. Mater. Technol., 2022, 8, 2200368 CrossRef.
- C. Yi, L. Zhou, X. Wu, W. Sun, L. Yi and Y. Yang, Technology for Recycling and Regenerating Graphite from Spent Lithium-ion Batteries”, Chin. J. Chem. Eng., 2021, 39, 37–50 CrossRef CAS.
- Y. Yang, S. Song, S. Lei, W. Sun, H. Hou, F. Jiang, X. Ji, W. Zhao and Y. Hu, A Process for Combination of Recycling Lithium and Regenerating Graphite from Spent Lithium-Ion Battery, Waste Manage., 2019, 85, 529–537 CrossRef CAS PubMed.
- H. Wang, Y. Huang, C. Huang, X. Wang, K. Wang, H. Chen, S. Liu, Y. Wu, K. Xu and W. Li, Reclaiming Graphite from Spent Lithium Ion Batteries Ecologically and Economically, Electrochim. Acta, 2019, 313, 423–431 CrossRef CAS.
- Y. Guo, F. Li, H. Zhu, G. Li, J. Huang and W. He, Leaching Lithium from the Anode Electrode Materials of Spent Lithium-ion Batteries by Hydrochloric Acid (HCl), Waste Manage., 2016, 51, 227–233 CrossRef CAS PubMed.
- B. Markey, M. Zhang, I. Robb, P. Xu, H. Gao, D. hang, J. Holoubek, D. Xia, Y. Zhao, J. Guo, M. Cai, Y. S. Meng and Z. Chen, Effective Upcycling of Graphite Anode: Healing and Doping Enabled Direct Regeneration, J. Electrochem. Soc., 2020, 167, 160511 CrossRef CAS.
- X. Yang, H. Zhen, H. Liu, C. Chen, Y. Zhong, X. Yang, X. Wang and L. Yang, Environmental-Friendly and Effectively Regenerate Anode Material of Spent Lithium-ion Batteries into High-performance P-doped Graphite, Waste Manage., 2023, 161, 52–60 CrossRef CAS PubMed.
- Z. Ma, Y. Zhuang, Y. Deng, X. Song, X. Zuo, X. Xiao and J. Nan, From Spent Graphite to Amorphous sp2+sp3 Carbon-Coated sp2 Graphite for High-performance Lithium Ion Batteries, J. Power Sources, 2018, 376, 91–99 CrossRef CAS.
- D. Ruan, F. Wang, L. Wu, K. Du, Z. Zhang, K. Zou, X. Wu and G. Hu, A High-performance Regenerated Graphite Extracted from Discarded Lithium-ion Batteries, New J. Chem., 2021, 45, 1535–1540 RSC.
- Y. Zhao, H. Wang, X. Li, X. Yuan and X. Chen, Recovery of CuO/C Catalyst from Spent Anode Material in Battery to Activate Peroxymonosulfate for Refractory Organic Contaminants Degradation”, J. Hazard. Mater., 2021, 420, 126552 CrossRef CAS PubMed.
- W. Zhang, Z. Liu, C. Xu, W. He, G. Li, J. Huang and H. Zhu, Preparing Graphene Oxide–Copper Composite Material from Spent Lithium Ion Batteries and Catalytic Performance Analysis, Res. Chem. Intermed., 2018, 44, 5075–5089 CrossRef CAS.
- Y. Zhang, X. Guo, F. Wu, Y. Yao, Y. Yuan, X. Bi, X. Luo, R. Shahbazian-Yassar, C. Zhang and K. Amine, Mesocarbon Microbead Carbon-Supported Magnesium Hydroxide Nanoparticles: Turning Spent Li-ion Battery Anode into a Highly Efficient Phosphate Adsorbent for Wastewater Treatment, ACS Appl. Mater. Interfaces, 2016, 8, 21315–21325 CrossRef CAS PubMed.
- T. Zhao, Y. Yao, M. Wang, R. Chen, Y. Yu, F. Wu and C. Zhang, Preparation of MnO2-Modified Graphite Sorbents from Spent Li-Ion Batteries for the Treatment of Water Contaminated by Lead, Cadmium, and Silver, ACS Appl. Mater. Interfaces, 2017, 9, 25369–25376 CrossRef CAS PubMed.
- J. Yu, J. Wang, T. Ma, J. Zhou, Y. Wang, P. Lu, J. Yin, R. Ye, Z. Zhu and Z. Fan, Recent Progresses in Electrochemical Carbon Dioxide Reduction on Copper-Based Catalysts toward Multicarbon Products, Adv. Funct. Mater., 2021, 31, 2102151 CrossRef CAS.
- M. Ma, K. Djanashvili and W. A. Smith, Selective Electrochemical Reduction of CO2 to CO on CuO-derived Cu Nanowires, Phys. Chem. Chem. Phys., 2015, 17, 20861–20867 RSC.
- Y. Peng, W. Tia, S. Libo, J. M. V. Nsanzimana, A. C. Fisher and X. Wang, Selective Electrochemical Reduction of CO2 to Ethylene on Nanopores-Modified Copper Electrodes in Aqueous Solution, ACS Appl. Mater. Interfaces, 2017, 9(38), 32782–32789 CrossRef CAS PubMed.
- K. Rossi and R. Buonsanti, Shaping Copper Nanocatalysts to Steer Selectivity in the Electrochemical CO2 Reduction Reaction, Acc. Chem. Res., 2022, 55, 629–637 CrossRef CAS PubMed.
- P. D. Luna, R. Quintero-Bermudez, C.-T. Dinh, M. B. Ross, O. S. Bushuyev, P. Todorović, T. Regier, S. O. Kelley, P. Yang and E. H. Sargent, Catalyst Electro-redeposition Controls Morphology and Oxidation State for Selective Carbon Dioxide Reduction, Nat. Catal., 2018, 1, 103–110 CrossRef.
- M. Hagen, D. Hanselmann, K. Ahlbrecht, R. Maça, D. Gerber and J. Tübke, Lithium–Sulfur Cells: The Gap between the State-of-the-Art and the Requirements for High Energy Battery Cells, Adv. Energy Mater., 2015, 5, 1401986 CrossRef.
- M. B. Pinsona and M. Z. Bazant, Theory of SEI Formation in Rechargeable Batteries: Capacity Fade, Accelerated Aging and Lifetime Prediction, J. Electrochem. Soc., 2013, 160, A243–A250 CrossRef.
- E. Prada, D. D. Domenico, Y. Creff, J. Bernard, V. Sauvant-Moynot and F. Huet, A Simplified Electrochemical and Thermal Aging Model of LiFePO4-Graphite Li-ion Batteries: Power and Capacity Fade Simulations, J. Electrochem. Soc., 2013, 160, A616–A628 CrossRef CAS.
- N. Sakamoto, Y. F. Nishimura, T. Nonaka, M. Ohashi, N. Ishida, K. Kitazumi, Y. Kato, K. Sekizawa, T. Morikawa and T. Arai, Self-assembled Cuprous Coordination Polymer as a Catalyst for CO2 Electrochemical Reduction into C2 Products, ACS Catal., 2020, 10, 10412–10419 CrossRef CAS.
- Y. Chu, Y. Shen, F. Guo, X. Zhao, Q. Dong, Q. Zhang, W. Li, H. Chen, Z. Luo and L. Chen, Advanced Characterizations of Solid Electrolyte Interphases in Lithium-Ion Batteries, Electrochem. Energy Rev., 2020, 3, 187–219 CrossRef.
- J. Zhang, X. Li, D. Song, Y. Miao, J. Song and L. Zhang, Effective Regeneration of Anode Material Recycled from Scrapped Li-ion Batteries, J. Power Sources, 2018, 390, 38–44 CrossRef CAS.
- J. Yang, E. Fan, J. Lin, F. Arshad, X. Zhang, H. Wang, F. Wu, R. Chen and L. Li, Recovery and Reuse of Anode Graphite from Spent Lithium-Ion Batteries via Citric Acid Leaching, ACS Appl. Energy Mater., 2021, 4, 6261–6268 CrossRef CAS.
- S. Aksu, Electrochemical Equilibria of Copper in Aqueous Phosphoric Acid Solutions, J. Electrochem. Soc., 2009, 156, C387–C394 CrossRef CAS.
- J. Zhu, E. Jiang, X. Wang, Z. Pan, X. Xu, S. Ma, P. K. Shen, L. Pan, M. Eguchi, A. K. Nanjundan, J. Shapter and Y. Yamauchi, Gram-Scale Production of Cu3P-Cu2O Janus Nanoparticles into Nitrogen and Phosphorous Doped Porous Carbon Framework as Bifunctional electrocatalysts for overall water splitting, Chem. Eng. J., 2022, 427, 130946 CrossRef CAS.
- H. Chen, Z. Wang, X. Wei, S. Liu, P. Guo, P. Han, H. Wang, J. Zhang, X. Lu and B. Wei, Promotion of Electrochemical CO2 Reduction to Ethylene on Phosphorus-doped Copper Nanocrystals with Stable Cuδ+ Sites, Appl. Surf. Sci., 2021, 544, 148965 CrossRef CAS.
- H. Itahara, N. Sakamoto, T. Arai, N. Takahashi, S. Kosaka and Y. Takatani, Dealloyed Intermetallic Cu5Ca Fine Powders as Nanoporous Electrocatalysts for CO2 Reduction, ACS Appl. Nano Mater., 2022, 5, 11991–11996 CrossRef CAS.
- G. H. Simon, C. S. Kley and B. R. Cuenya, Potential-Dependent Morphology of Copper Catalysts During CO2 Electroreduction Revealed by In Situ Atomic Force Microscopy, Angew. Chem., Int. Ed., 2021, 60, 2561–2568 CrossRef CAS PubMed.
- J. Zhao, L. Sun, S. Canepa, H. Sun, M. N. Yesibolati, M. Sherburne, R. Xu, T. Sritharan, J. S. C. Loo, J. W. Ager, J. Barber, K. Mølhave and Z. J. Xu, Phosphate Tuned Copper Electrodeposition and Promoted Formic Acid Selectivity for Carbon Dioxide Reduction, J. Mater. Chem. A, 2017, 5, 11905–11916 RSC.
- B. A. W. Mowbray, D. J. Dvorak, N. Taherimakhsousi and C. P. Berlinguette, How Catalyst Dispersion Solvents Affect CO2 Electrolyzer Gas Diffusion Electrodes, Energy Fuels, 2021, 35, 19178–19184 CrossRef CAS.
- M. B. Gawande, A. Goswami, F.-X. Felpin, T. Asefa, X. Huang, R. Silva, X. Zou, R. Zboril and R. S. Varma, Cu and Cu-Based Nanoparticles: Synthesis and Applications in Catalysis, Chem. Rev., 2016, 116, 3722–3811 CrossRef CAS PubMed.
- Y. Li, F. Cui, M. B. Ross, D. Kim, Y. Sun and P. Yang, Structure-Sensitive CO2 Electroreduction to Hydrocarbons on Ultrathin 5-fold Twinned Copper Nanowires, Nano Lett., 2017, 17, 1312–1317 CrossRef CAS PubMed.
Footnote |
| † Electronic supplementary information (ESI) available: Details of experimental procedures and characterization of the synthesized samples. See DOI: https://doi.org/10.1039/d3gc04472f |
| This journal is © The Royal Society of Chemistry 2024 |