
 Open Access Article
 This Open Access Article is licensed under a
 Creative Commons Attribution 3.0 Unported Licence
Upgrading AquaSolv Omni (AqSO) biorefinery: access to highly ethoxylated lignins in high yields through reactive extraction (REx)†‡
Davide
Rigo
 *a,
Nadine
Kohlhuber
b,
Lukas
Fliri
a,
Daryna
Diment
a,
Mijung
Cho
a,
Ivan
Sumerskii
c,
Michael
Hummel
a,
Antje
Potthast
b and
Mikhail
Balakshin§
a
*a,
Nadine
Kohlhuber
b,
Lukas
Fliri
a,
Daryna
Diment
a,
Mijung
Cho
a,
Ivan
Sumerskii
c,
Michael
Hummel
a,
Antje
Potthast
b and
Mikhail
Balakshin§
a
aDepartment of Bioproducts and Biosystems, Aalto University, Vuorimiehentie 1, Espoo, 02150, Finland. E-mail: davide.rigo@unive.it
bDepartment of Chemistry, Institute of Chemistry of Renewable Resources, University of Natural Resources and Life Sciences, Vienna (BOKU), Konrad-Lorenz-Strasse 24, 3430 Tulln an der Donau, Austria
cCore Facility of Analysis of Lignocellulosics (ALICE), University of Natural Resources and Life Sciences, Vienna, Konrad-Lorenz-Strasse 24, 3430, Tulln an der Donau, Austria
First published on 24th January 2024
Abstract
Chemical modification of lignin (i.e., ethoxylation) improves its properties for specific applications. Reactive extraction (REx)—the simultaneous functionalization and extraction of lignin from biomass—is a green, simple, and powerful solution to minimize subsequent steps in biorefinery operations, while upgrading the isolated products (i.e., lignin or lignin-carbohydrate hybrids). In this work, we successfully introduced REx into our recently reported AquaSolv Omni (AqSO) integrated biorefinery. Here, hydrothermally treated wood solids were refluxed with various EtOH![[thin space (1/6-em)]](https://www.rsc.org/images/entities/char_2009.gif) :H2O mixtures (70–99 v/v%) in the presence of catalytic amounts of H2SO4 (c = 0.15–1.2 M). The effects of the process variables on the structures and properties of the obtained lignins and residual solids were elucidated by comprehensive NMR analyses (HSQC, quantitative 13C and 31P), differential scanning calorimetry (DSC), and gel permeation chromatography (GPC). In addition, we discuss different analytical approaches—NMR vs. chromatographic methods for the quantification of ethoxy groups in lignin. Implementing REx allowed the isolation of ethoxylated lignins in 27–52% yields (based on the initial lignin content) and to tune the degree of substitution (DS) up to 40.8 EtO-groups/100 Ar (based on quantitative 13C NMR)—which is approximately five times higher compared to other established organosolv processes (i.e., Alcell). Moreover, solution state NMR analysis of residual solids after REx showed that ethoxylation also occurs in the cellulose-rich fraction. REx highly ethoxylated lignins produced through a simple and green process enhanced the performance of polyurethane (PU) adhesive formulations compared to formulations using non-ethoxylated lignins.
:H2O mixtures (70–99 v/v%) in the presence of catalytic amounts of H2SO4 (c = 0.15–1.2 M). The effects of the process variables on the structures and properties of the obtained lignins and residual solids were elucidated by comprehensive NMR analyses (HSQC, quantitative 13C and 31P), differential scanning calorimetry (DSC), and gel permeation chromatography (GPC). In addition, we discuss different analytical approaches—NMR vs. chromatographic methods for the quantification of ethoxy groups in lignin. Implementing REx allowed the isolation of ethoxylated lignins in 27–52% yields (based on the initial lignin content) and to tune the degree of substitution (DS) up to 40.8 EtO-groups/100 Ar (based on quantitative 13C NMR)—which is approximately five times higher compared to other established organosolv processes (i.e., Alcell). Moreover, solution state NMR analysis of residual solids after REx showed that ethoxylation also occurs in the cellulose-rich fraction. REx highly ethoxylated lignins produced through a simple and green process enhanced the performance of polyurethane (PU) adhesive formulations compared to formulations using non-ethoxylated lignins.
Introduction
Lignin as one of the main constituents of lignocellulosic biomass is the most abundant aromatic biopolymer in nature. Consequently, lignin is considered as one of the most promising sustainable and renewable feedstocks for the substitution of aromatic fuels and materials.1 Today, Kraft pulping is the most common industrial process, in which the isolation of Kraft lignin (KL) is technically limited to 5–15%,2 which corresponds only to about 1–5% of the original biomass input. The Kraft process and other well established pulping processes (i.e., sulfite pulping, etc.) are mainly focused on the production of high-grade pulp leaving little to no space for lignin optimization (i.e., tuning of the properties of the isolated technical lignin). As a consequence, the utilization of Kraft lignin in materials applications is still limited due to its complex and poorly understood structure.3Recently, lignin-first biorefining has gained increased research interest. Such approaches follow a conceptually different strategy compared to well-established pulping processes (e.g., Kraft pulping).4–6 However, to unlock the full potential of biorefining, it is important to achieve value from all the biomass constituents.7 In this regard, our group recently developed a parameter-controlled type of biorefinery where it is possible to tailor the product properties by adjusting the reaction conditions for custom-designed products.8,9 This emerging process—called AquaSolv Omni (AqSO)—consists of a parameter controlled hydrothermal treatment (HTT) of birch wood based on process severity (P-factor) followed by solvent extraction of the resulting solids at ambient temperature. AqSO can be easily coupled with other biorefinery streamlines and allows a straightforward and environmentally friendly tuning of lignin characteristics.
Certain lignin modifications (i.e. alkylation, acylation, ethoxylation, etc.) are able to upgrade lignin towards particular applications, such as thermoplastic blends, carbon fibers, surfactants, and sorbents.10–15 For example, acetylation of Softwood Kraft lignin enabled dry spinning of its concentrated solutions in acetone (75 wt%).14 Full acetylation of softwood Kraft lignin prior to depolymerization was proposed as a strategy to debottleneck pulping mills.16 A combined acetylation and poly-esterification of Kraft lignin allowed the synthesis of fully renewable thermosets with tunable mechanical properties.17 Furthermore, it has been reported that the ethoxylation of lignin increases the hydrophobicity, thermal mobility, and spinnability of lignin.18–22
When lignin modification is performed, usually a degree of substitution (DS) of 100% is targeted, i.e., all available hydroxyl groups are converted into their corresponding acetylated or alkylated derivatives. However, quantitative lignin modifications typically require expensive and/or toxic chemicals (i.e., dichloroethane,23 1,6-dibromohexane24 and dimethyl sulfate (DMS)25) and, therefore, are often not feasible on an industrial scale. However, most applications may not require complete substitution. For instance, Sumerskii et al. reported that partially methylated lignins performed better in polyurethane (PU) adhesive formulations than fully methylated lignins.23
Reactive extraction (REx) allows for the simultaneous functionalization and extraction of lignin from biorefinery residues and represents an inexpensive, straightforward, and scalable method to obtain partially derivatized lignins. In a recently patented approach,26 lignin was extracted under solvent reflux with either aqueous ethanol (or other alcohols, such as methanol and propanol) or acetic acid (or other small organic acids) in the presence of catalytic amounts of a strong acid (i.e., H2SO4). This approach allowed the incorporation of up to 23% ethyl or acetyl groups per 100 Ar.26 Lawoko et al. reported a similar but more laborious procedure—where the hydrothermal treatment of wood was combined with a cyclic organosolv extraction.4,27 Other research groups focused on simultaneous lignin extraction and functionalization by avoiding recombination reactions between lignin units28,29 or mild organosolv extractions.30 Despite the recent efforts of various research groups, the development of the REx concept is still far from being optimized. In particular, a thorough investigation of the effects of different process variables together with a comprehensive lignin characterization is still missing in the literature.
We herein demonstrate the possibility of integrating REx within our developed AqSO biorefinery,8 which allows us to simultaneously upgrade/functionalize and extract lignins with tunable functionalities and properties. Throughout this study the effects of multiple variables (time, solvent-reagent concentration, and catalyst amount) on the yields, chemical structure and composition of the major products have been elucidated, with particular focus on the degree of substitution (DS) with ethoxy groups in lignin. The extracted lignins were comprehensively characterized by wet chemistry methods, NMR (HSQC, 13C and 31P), differential scanning calorimetry (DSC), and gel permeation chromatography (GPC). The major strengths of REx will be discussed. An outlook for the REx integrated biorefinery is depicted in Fig. 1. There are two major products of REx: (i) reactive extracted (ethoxylated) lignin (REL) and (ii) residual (ethoxylated) solids (RS).
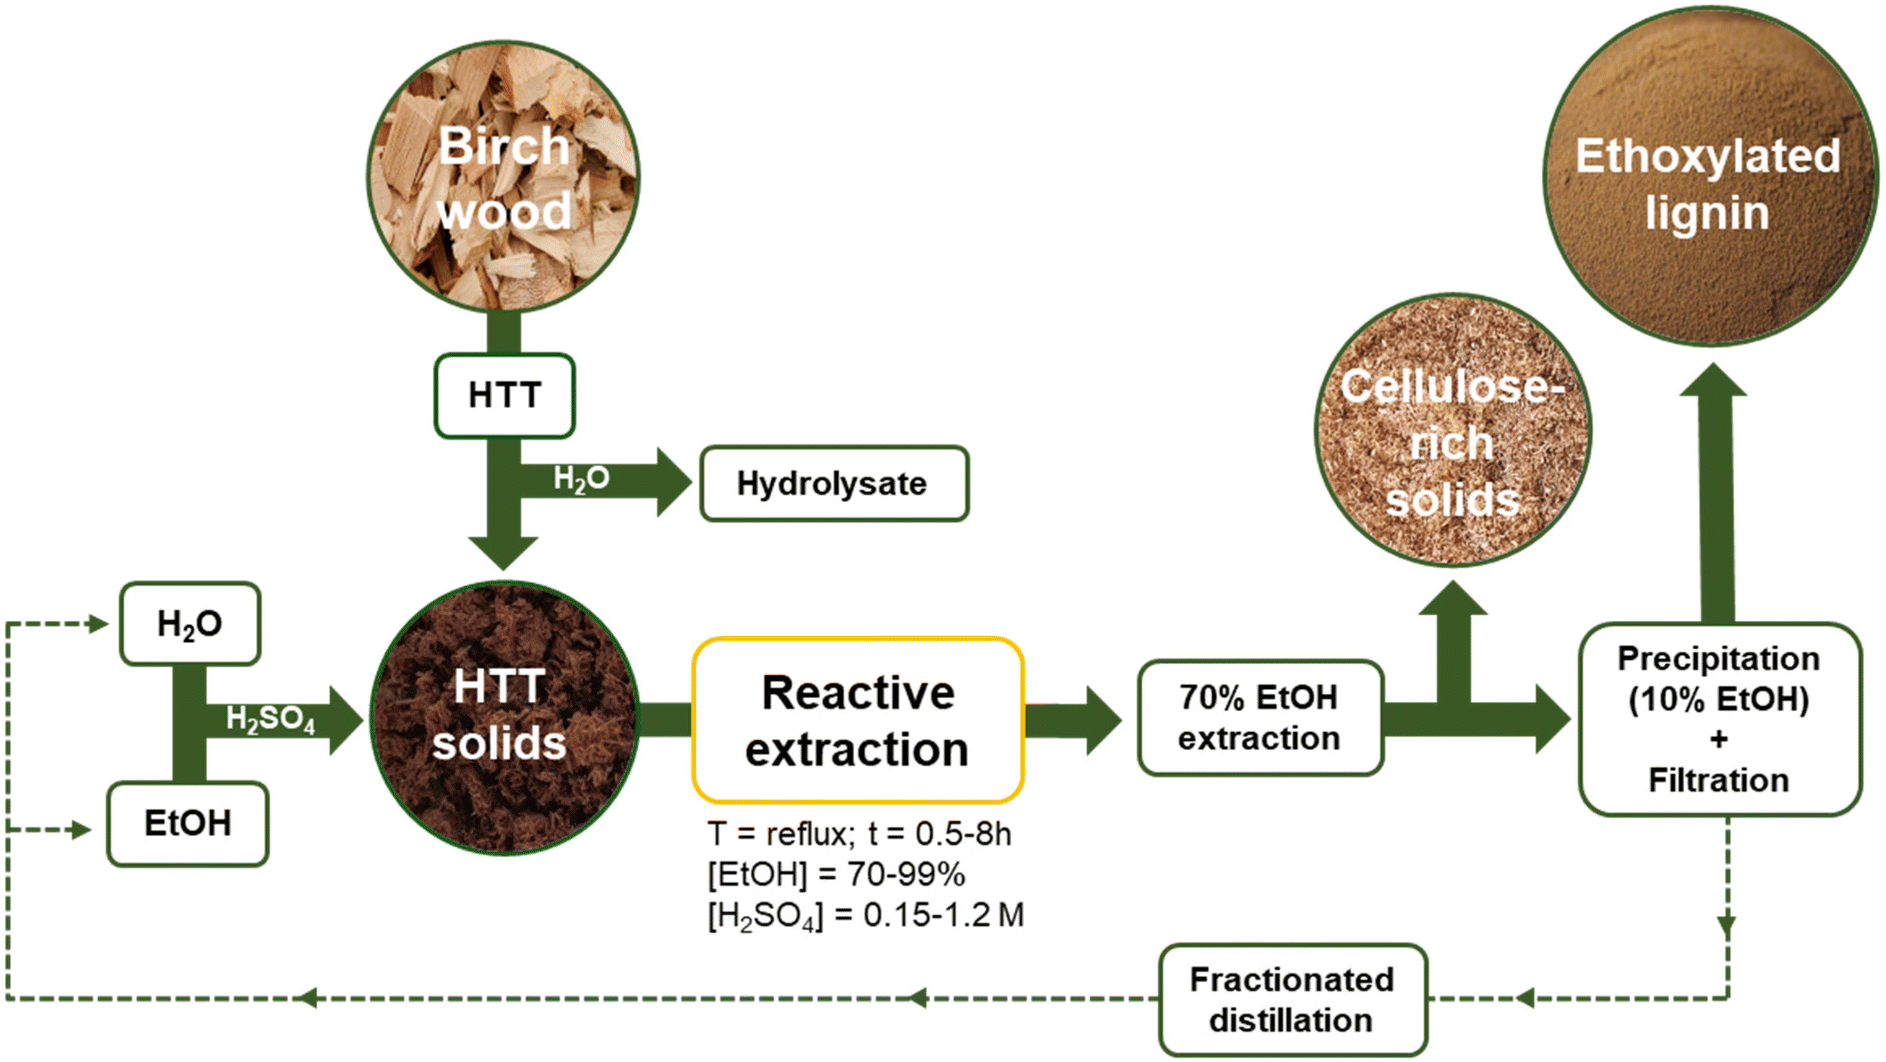 | ||
| Fig. 1 Schematic representation of reactive extraction (REx). | ||
Experimental
General
Silver birch (Betula Pendula) wood chips were supplied by VTT (Espoo, Finland). Wood material was ground into sawdust using a Wiley mill M02 with a screen size of less than 0.5 mm and further screened with a Retsch AS 300 Control Vibratory Sieve Shaker – RAMI (0.55–0.15 mm particle size). EtOH, H2SO4, HI, methyl iodide, ethyl iodide, propyl iodide, DMSO-d6, CDCl3, pyridine, and 2-chloro-4,4,5,5-tetramethyl–1,3,2-dioxaphospholane were purchased from Sigma Aldrich (Merck) and used without any further purification. The tetra-n-butylphosphonium acetate [P4444][OAc] – DMSO-d6 direct dissolution electrolyte for solution state NMR investigations of the cellulosic fractions was either prepared according to published procedures31 or sourced from Innotope. The solvent free polymeric diphenylmethane diisocyanate (pMDI) with an average functionality of 2.7 and an NCO content of 30–32 wt% was obtained from BorsodChem Zrt. (Kazincbarcika, Hungary).Hydrothermal treatment (HTT) of birch wood
Prior to reactive extraction, hydrothermal treatment of birch wood was performed by adjusting our previously reported procedure.8 In brief, birch wood sawdust (31.6 g with 4.9% moisture content corresponding to 30.0 g o.d. wood) was placed inside a stainless-steel autoclave together with the required amount of water (28.5 g) to reach a liquid-to-solid ratio (L/S) of 1. The reactor was then closed and the mixture was allowed to react until the desired process severity (P-factor) of 500 was reached (T = 180 °C). More details about the P-factor calculation are reported in our previous works.8,9 Once the reaction was complete, the reactor was cooled down fast (from 180 °C to T < 100 °C within 2 min) and the treated solids were exhaustively washed with deionized water. The hydrothermally treated solids (P-factor = 500) were labelled as S-500.Reactive extraction (REx)
REx was performed under different conditions with the apparatus depicted in the ESI (Table S1 and Fig. S1‡). In a typical experiment, a round bottom flask was filled with S-500 (4 g dry matter), EtOH:H2O mixtures (70–99%; 50 mL), and variable amounts of H2SO4 as the catalyst (c = 0.15–1.2 M). Then, the mixture was set to reflux for variable time periods (0.5–8 h). Once the reaction was complete, the residual solids (RS) were filtered through a glass crucible (porosity 4) and exhaustively extracted with a 70% EtOH:H2O mixture (200 mL) to maximize the lignin yield.32 Lignins were then precipitated by diluting 70% EtOH:H2O to 10% EtOH content. In the case of the control sample (refluxing S-500 with EtOH (99% aq.) for 4 h) the isolation was performed by rotary evaporation of the extracted lignin due to the lack of lignin precipitation. The yield of reactive extracted lignins (RELs) was evaluated gravimetrically. The reactive extracted lignins were then analyzed by chromatography methods, DSC, and GPC. For selected samples additional 2D HSQC, quantitative 13C and 31P NMR analyses were performed (see the ESI‡).
Methoxy/ethoxy group determination by chromatography
Methoxy/ethoxy groups of the residual solid (RS) fraction and RELs were determined in duplicates according to the procedures of Goto et al.33 and by Sumerskii et al.34 In brief, around 1 mL of HI acid (57%) was added to a 10 mL headspace screw cap vial containing 10–15 mg of lignin and 2–5 mg of internal standards (i.e., 4-(methoxy-d3)-benzoic acid, 4-(ethoxy-d5)-benzoic acid, and propyl iodide). The vials were immediately sealed with an aluminum screw cap with a PTFE covered silicone septum and heated for 3 h at 110 °C. After cooling, the samples were neutralized by injecting 4 mL of H2O through the septum. The quantification of iodomethane (CH3I) and iodoethane (C2H5I) was carried out by headspace GC-MS and GC-FID upon calibration.Analysis of the reactive extracted lignins (RELs)
Nuclear magnetic resonance (NMR) spectroscopy
| G + S = G2 + S2,6/2 = 100 Ar |
This assumption implies that the condensation (substitution) at positions G2 and S2,6 of lignin is insignificant. However, it is still valuable for relative comparison with the literature data as this normalization is used when only HSQC spectra of lignins are available.35,40 A typical HSQC spectrum is reported in the ESI.‡
:lignin = 0.3 μmol mg−1) together with 50 μl of a relaxation agent (Cr(acac)3) solution in 1.6/1 (v/v) pyridine/CDCl3 (C = 11.4 mg mL−1). Prior to the 31P NMR measurement, 100 μL of phosphitylation reagent (2-chloro-4,4,5,5-tetramethyl–1,3,2-dioxaphospholane) was added to the mixture and stirred vigorously. The acquisition time and the relaxation delay were 1 s and 5 s, respectively; 128 scans were collected. More details on how integrations and calculations were performed and the 31P NMR spectra are reported in the ESI.‡
Molar mass characterization by GPC-MALLS785nm-RI in DMSO/LiBr (0.5 w/v %)
The molas mass characterization was performed in accordance with Zinovyev et al.43 In brief, 10 mg of the dry lignin samples were dissolved in 1 mL of the eluent (DMSO/LiBr, 0.5 w/v %) and filtered through 0.45 μm PTFE syringe prior the measurement. The following GPC setup was used for the analysis: an Ultimate 3000 autosampler and a column oven (Thermo Fisher Scientific Inc., Waltham, MA; USA); a Dionex HPLC Pump Series P580 (Dionex Softron GmbH, Germany), a Dawn Heleos II MALLS detector, λ = 785 nm; and an Optiplab T-rEX differential refractive index detector, λ = 660 nm (both Wyatt Technology, Santa Barbara, CA, USA). For the separation a PolarGel M guard column (7.5 × 50 mm) and three PolarGel M columns (7.5 × 300 mm, 5 μm particle size) were used. The GPC system was operated under the following conditions: flow rate, 0.5 mL min−1; injection volume, 10 μL; run time, 65 min; temperature, 35 °C. Data evaluation was carried out using Astra software (version 7.3.0, Wyatt Technology, Santa Barbara, CA, USA).Glass transition temperatures (Tg)
The determination of glass transition temperatures was performed on a DSC 250 (TA Instruments, USA) differential scanning calorimeter (DSC). All samples were dried before the analysis for 24 h at 40 °C in a vacuum oven under P2O5. Following that, each sample (ca. 7 mg) was subjected to heating under a nitrogen flow (50 mL min−1) at a rate of 10 °C min−1 from 25 °C to 150 °C and isothermally held for five minutes to erase the thermal history of the sample and to remove any remaining moisture. Subsequently, the samples were cooled to 25 °C and heated to 200 °C at the same rate. The Tg was determined based on the second heating curve using the TA Universal Analysis software.Analysis of the residual cellulosic solid fraction
Compositional analysis
The compositional analysis of residual solids (RS) included the quantification of acid insoluble lignin (AIL), acid soluble lignin (ASL) and carbohydrate composition using standard protocols.44 A dry sample (ca. 0.3 g) was hydrolyzed with 3 mL of 72% H2SO4 at 30 °C for 1 h. The acid solution was then diluted to 4% H2SO4 concentration and autoclaved at 121 °C for 1 h. The amount of AIL was determined gravimetrically upon filtration, while ASL was evaluated by UV spectrophotometry at 205 nm. The carbohydrate monomers released by acid hydrolysis were analyzed using a Dionex ICS 3000A ion chromatography system equipped with a CarboPac PA1 column. The compositional analysis of RS is reported in the ESI.‡NMR spectroscopy
:DMSO-d6 (1:4 wt%) electrolyte closely following the reported protocol.31 In comparison to previous reports,45,46 the measuring concentration had to be reduced from 5 wt% to 2.5 wt%, in order to obtain solutions with suitable viscoelastic properties. This is a consequence of the high molecular mass of the cellulosic fractions in the cellulosic solids. All samples of different solids incorporated minor insoluble fractions, presumably associated with not completely transformed wood starting material. Only after bleaching a completely soluble material was obtained. The recorded spectra are summarized in the ESI.‡
Application test of reactive extracted lignins (RELs)
Cohesive strength evaluation of REL/pMDI based adhesives
The evaluation of the cohesive strength of REL/pMDI adhesives was carried out according to ASTM-D799-15 using an automated bonding strength evaluation system (ABES). In brief, around 250 g m−2 REL/pMDI adhesive was applied on a birch veneer (thickness, 0.6–0.8 mm; width, 20 mm; overlap, 5 mm) and pressed at 120 °C for 5 min.23,47 The REL/pMDI binder consisted of 0.25:0.25:0.5 wt% parts of REL:H2O:pMDI.
Results and discussion
General
The aim of the present work was to implement REx into our AqSO biorefinery concept. Thereby, we wanted to investigate the effects of certain variables, such as time, EtOH concentration, and catalyst (H2SO4) amount on the yields, structure, and properties of the reactive extracted lignins (RELs) and the residual solids (RS), with focus on their degree of substitution (DS) with ethoxy groups.Our previous study demonstrated that process severity (P-factor) and the liquid-to-solid (L/S) ratio are key parameters to tune the characteristics of AqSO biorefinery lignins.8 Since lignin carbohydrate complexes (LCCs) are gaining attention,48 in the present study we focus on the reactive extraction of LCC-rich lignins. For this reason, the P-factor was set at 500 and L/S = 1 for the preparation of the starting material, so called hydrothermal treated solids-500 (S-500), which was found to be the optimal conditions for the preparation of LCCs.8 As a subsequent step, REx was carried out using different EtOH:H2O mixtures (70–99%) and variable catalytic amounts of H2SO4 (c = 0.15–1.2 M) for different time frames (0.5–8 h) at reflux temperature. The reaction conditions are summarized in Table S1.‡ RELs were then isolated through precipitation followed by filtration (Fig. 1 and experimental).
Effects of parameters on the yields and degree of substitution (DS)
A fast and reproducible way to measure the DS with ethoxy groups in lignin is via chromatography.34 Thus, it has been selected as the most suitable analytical protocol to investigate the effects of variables on the DS. In this part of the study the aim was two-fold: maximizing both the lignin yield and the DS with ethoxy groups.S-500 was initially set to react with a 70% EtOH:H2O solution in the presence of a catalytic amount of H2SO4 (C = 0.15 M) at reflux temperature for 0.5–8 h. The real time analysis shows that the yields of RELs slightly increase until 4 h up to 48% with respect to the initial lignin content (Fig. 2b), and then remain constant for longer times. Consistently, an opposite trend was observed for the yield of residual lignin (RL), which decreases until 4 h (74 wt%; Fig. 2b) while remaining constant from this instant on. As expected, an increase of the reaction time increases the number of ethoxy groups present in RELs, reaching an equilibrium value of 11–12/100 Ar after 4 h. (Fig. 2a). Intriguingly, ethoxylation occurred in the residual solids as well, which will be discussed in more detail towards the end of the manuscript.
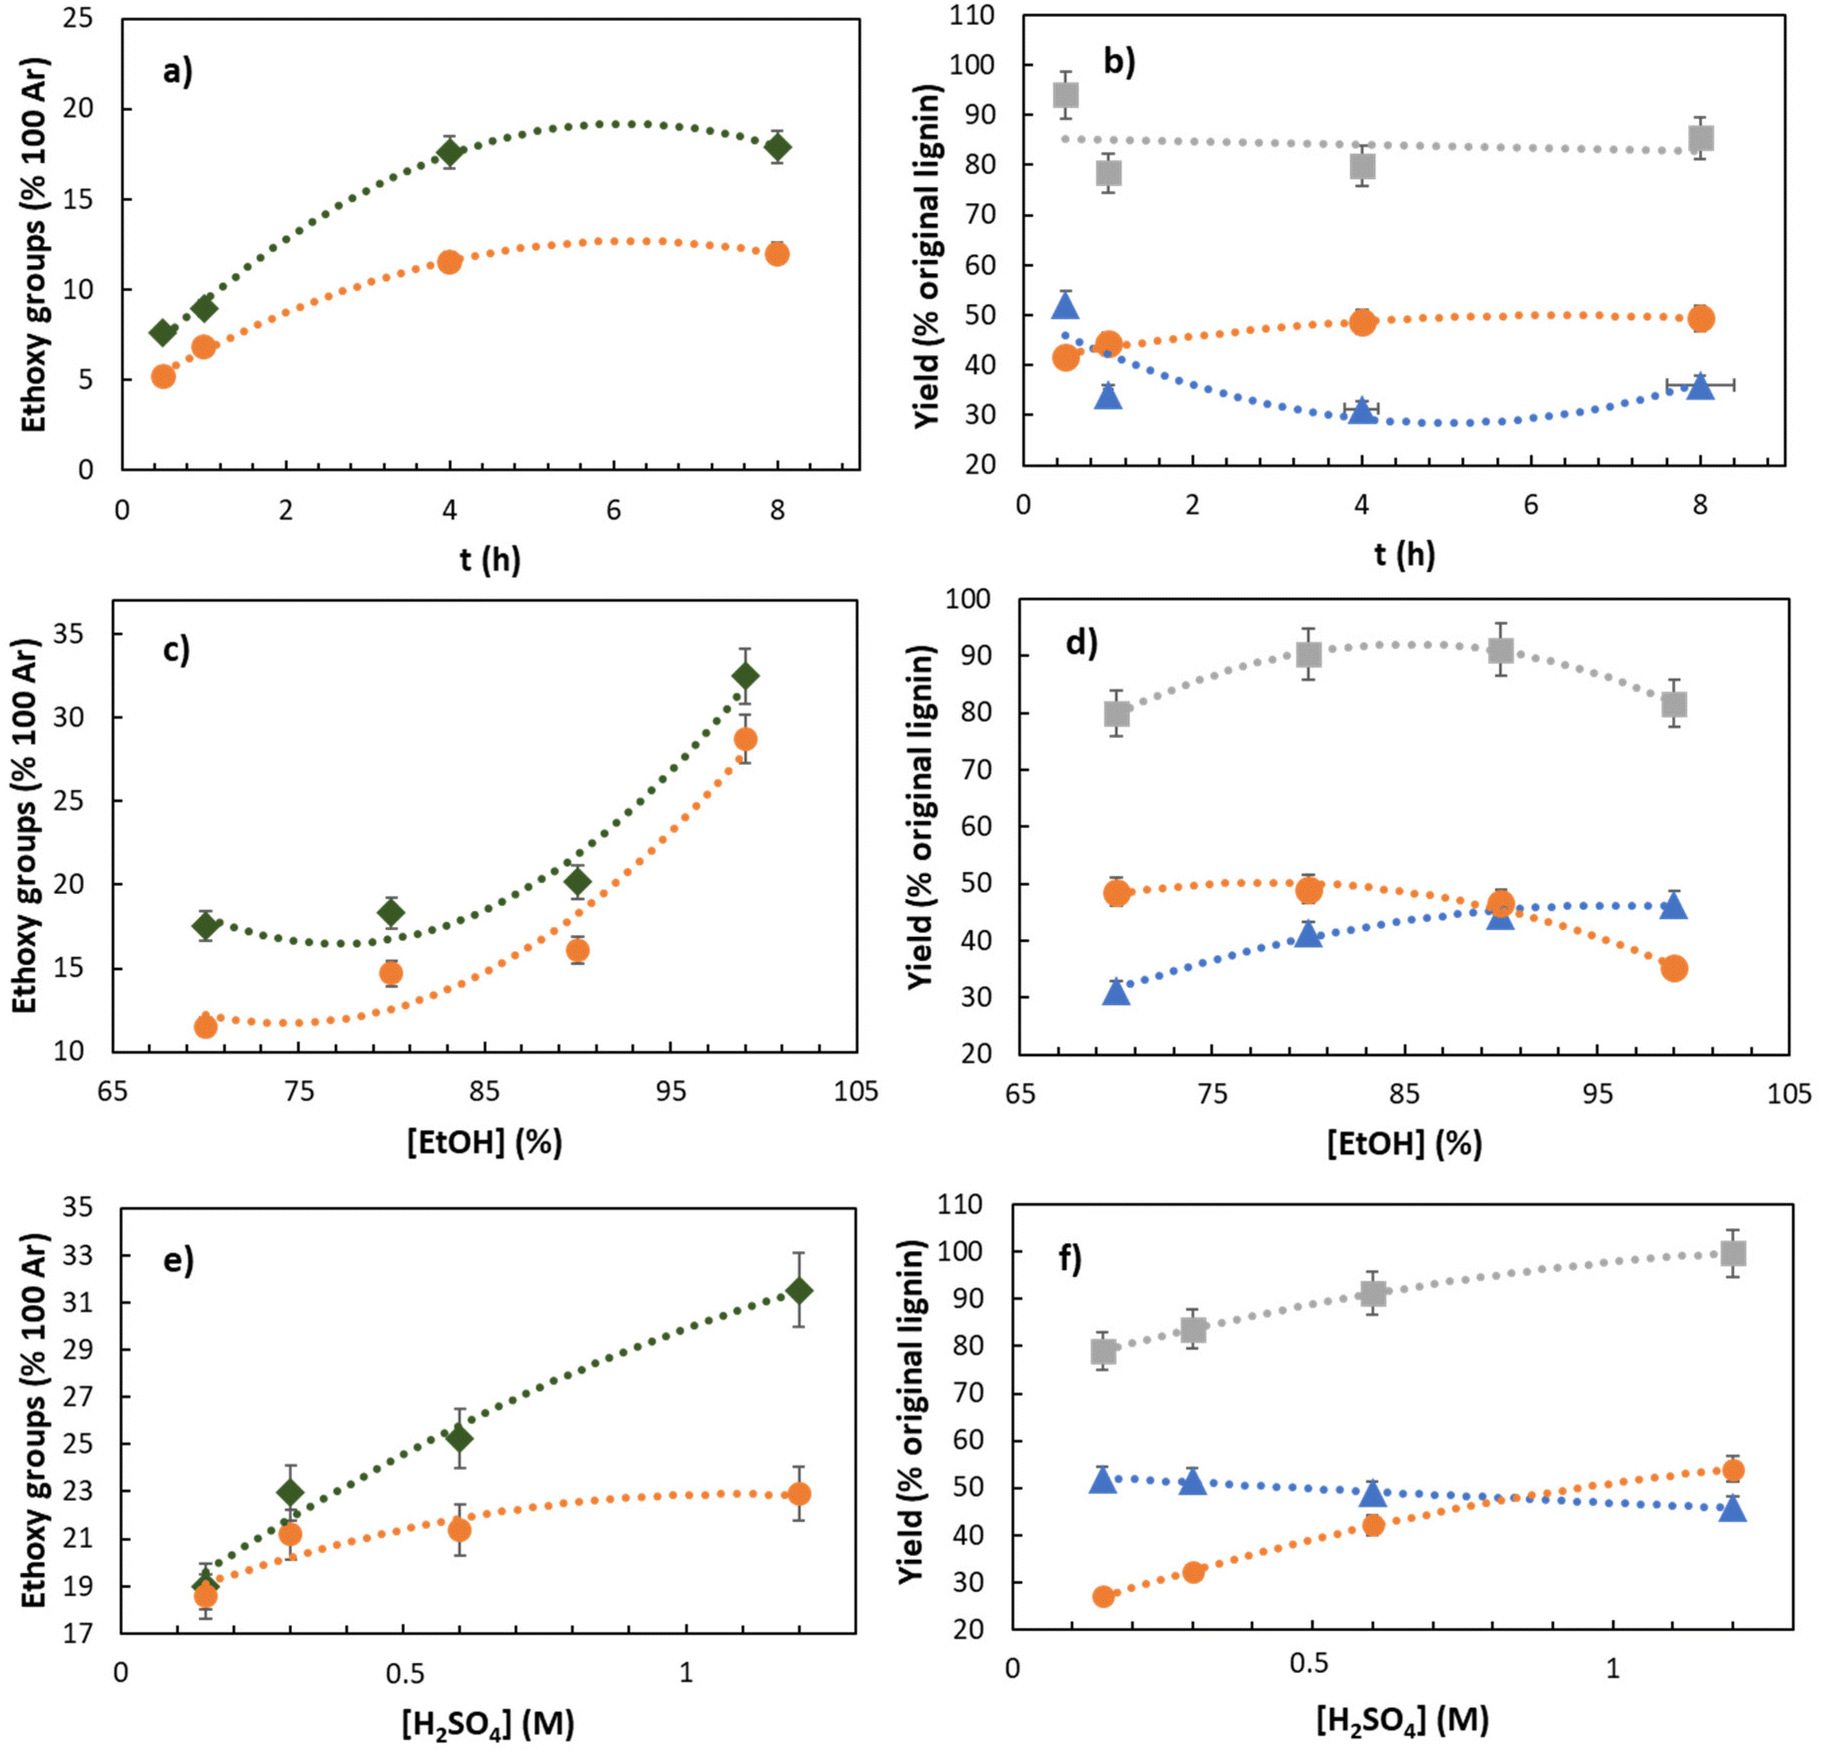 | ||
| Fig. 2 The effects of time (a and b), [EtOH] (c and d), and [H2SO4] (e and f) on the outcome of REx. at reflux. Other conditions: a and b: [H2SO4] = 0.15 M, [EtOH] = 70%; c and d: t = 4 h, [H2SO4] = 0.15 M; e and f: t = 0.5 h, [EtOH] = 99%. -●- REL = reactive extracted lignin. -◆- RS = residual solids. -▲- RL = residual lignin. -■- REL + RL. EtO-data were obtained according to wet chemistry methods.34 For convenience and better comparison, data of RS are expressed per 100 Ar based on the lignin content of the solids. The yield of products is intended with respect to the lignin content in the starting material (S-500). | ||
Based on the latter results, the reaction time was set to 4 h and the effect of the aqueous ethanol concentration was then investigated in the range of 70–99%. EtOH was found to be a crucial parameter for improving the DS of both REL and RS. The DS of REL was increased by a factor of 2.5 by increasing the EtOH concentration from 70 to 99%, where the ethoxy group content increased from 11 to 28/100 Ar, respectively (Fig. 2c). This is consistent with a competition between H2O and EtOH in favor of EtOH when its concentration was close to 99%. A similar trend was observed in RS, in which the DS increased from 17 to 32/100 Ar passing from the 70% to 99% EtOH:H2O mixture, respectively. An even higher DS of 40.8/100 Ar was obtained from quantitative 13C NMR analysis, which exceeds typical data from organosolv pulping (Table 3; entry 4) by a factor of 3.3.49 Additional considerations and data correlation of different analytical techniques are discussed in the following section. Consistently, within the same EtOH concentration range (70–99%), the yields of REL and RL have opposite ∼30% decreasing and increasing trends from 48% to 33% and from 31% to 45%, respectively.
To keep the REx conditions as close as possible to a simple extraction – meaning minimizing the extraction time while maximizing the DS – in 99% EtOH we set t = 0.5 h and simultaneously increased the amount of catalyst in the range [H2SO4] = 0.15–1.2 M. As expected, the best outcome for both yield and DS of REL was achieved with the highest H2SO4 concentration. Within a really short time (0.5 h) we were able to isolate REL in 54% yield (with respect to the initial content), while incorporating EtO-groups up to 23/100 Ar by chromatographic quantification34 (Fig. 2e) and 33.7/100 Ar by quantitative 13C NMR (Table 3, entry 3). Intriguingly, under the latter conditions (t = 0.5 h, [EtOH] = 99%, [H2SO4] = 1.2 M) the mass balance (REL + RL) is around 97%, meaning that we were able to recover almost all lignin by precipitation/filtration (Fig. 2f). In addition, fractionated distillation of the EtOH and H2O allowed to fully recover (yield >98%) the solvent reagents in more than 99% purity (by GC), providing a proof-of-concept for the recycling/reuse of used solvents. The effects of variables on the compositional analysis of the residual solids was very subtle (see the ESI‡).
Structural characterization of reactive extracted lignins (RELs)
1H–13C heteronuclear single quantum coherence spectroscopy (HSQC) analysis revealed the most important structural changes in the lignin structure during REx (Fig. 3). Spectra of a control sample obtained from the direct extraction of S-500 with 70% aqueous ethanol and of a REL sample with the highest DS (conditions: t = 4 h, [EtOH] = 99%, [H2SO4] = 0.15 M, T = reflux) are compared and discussed.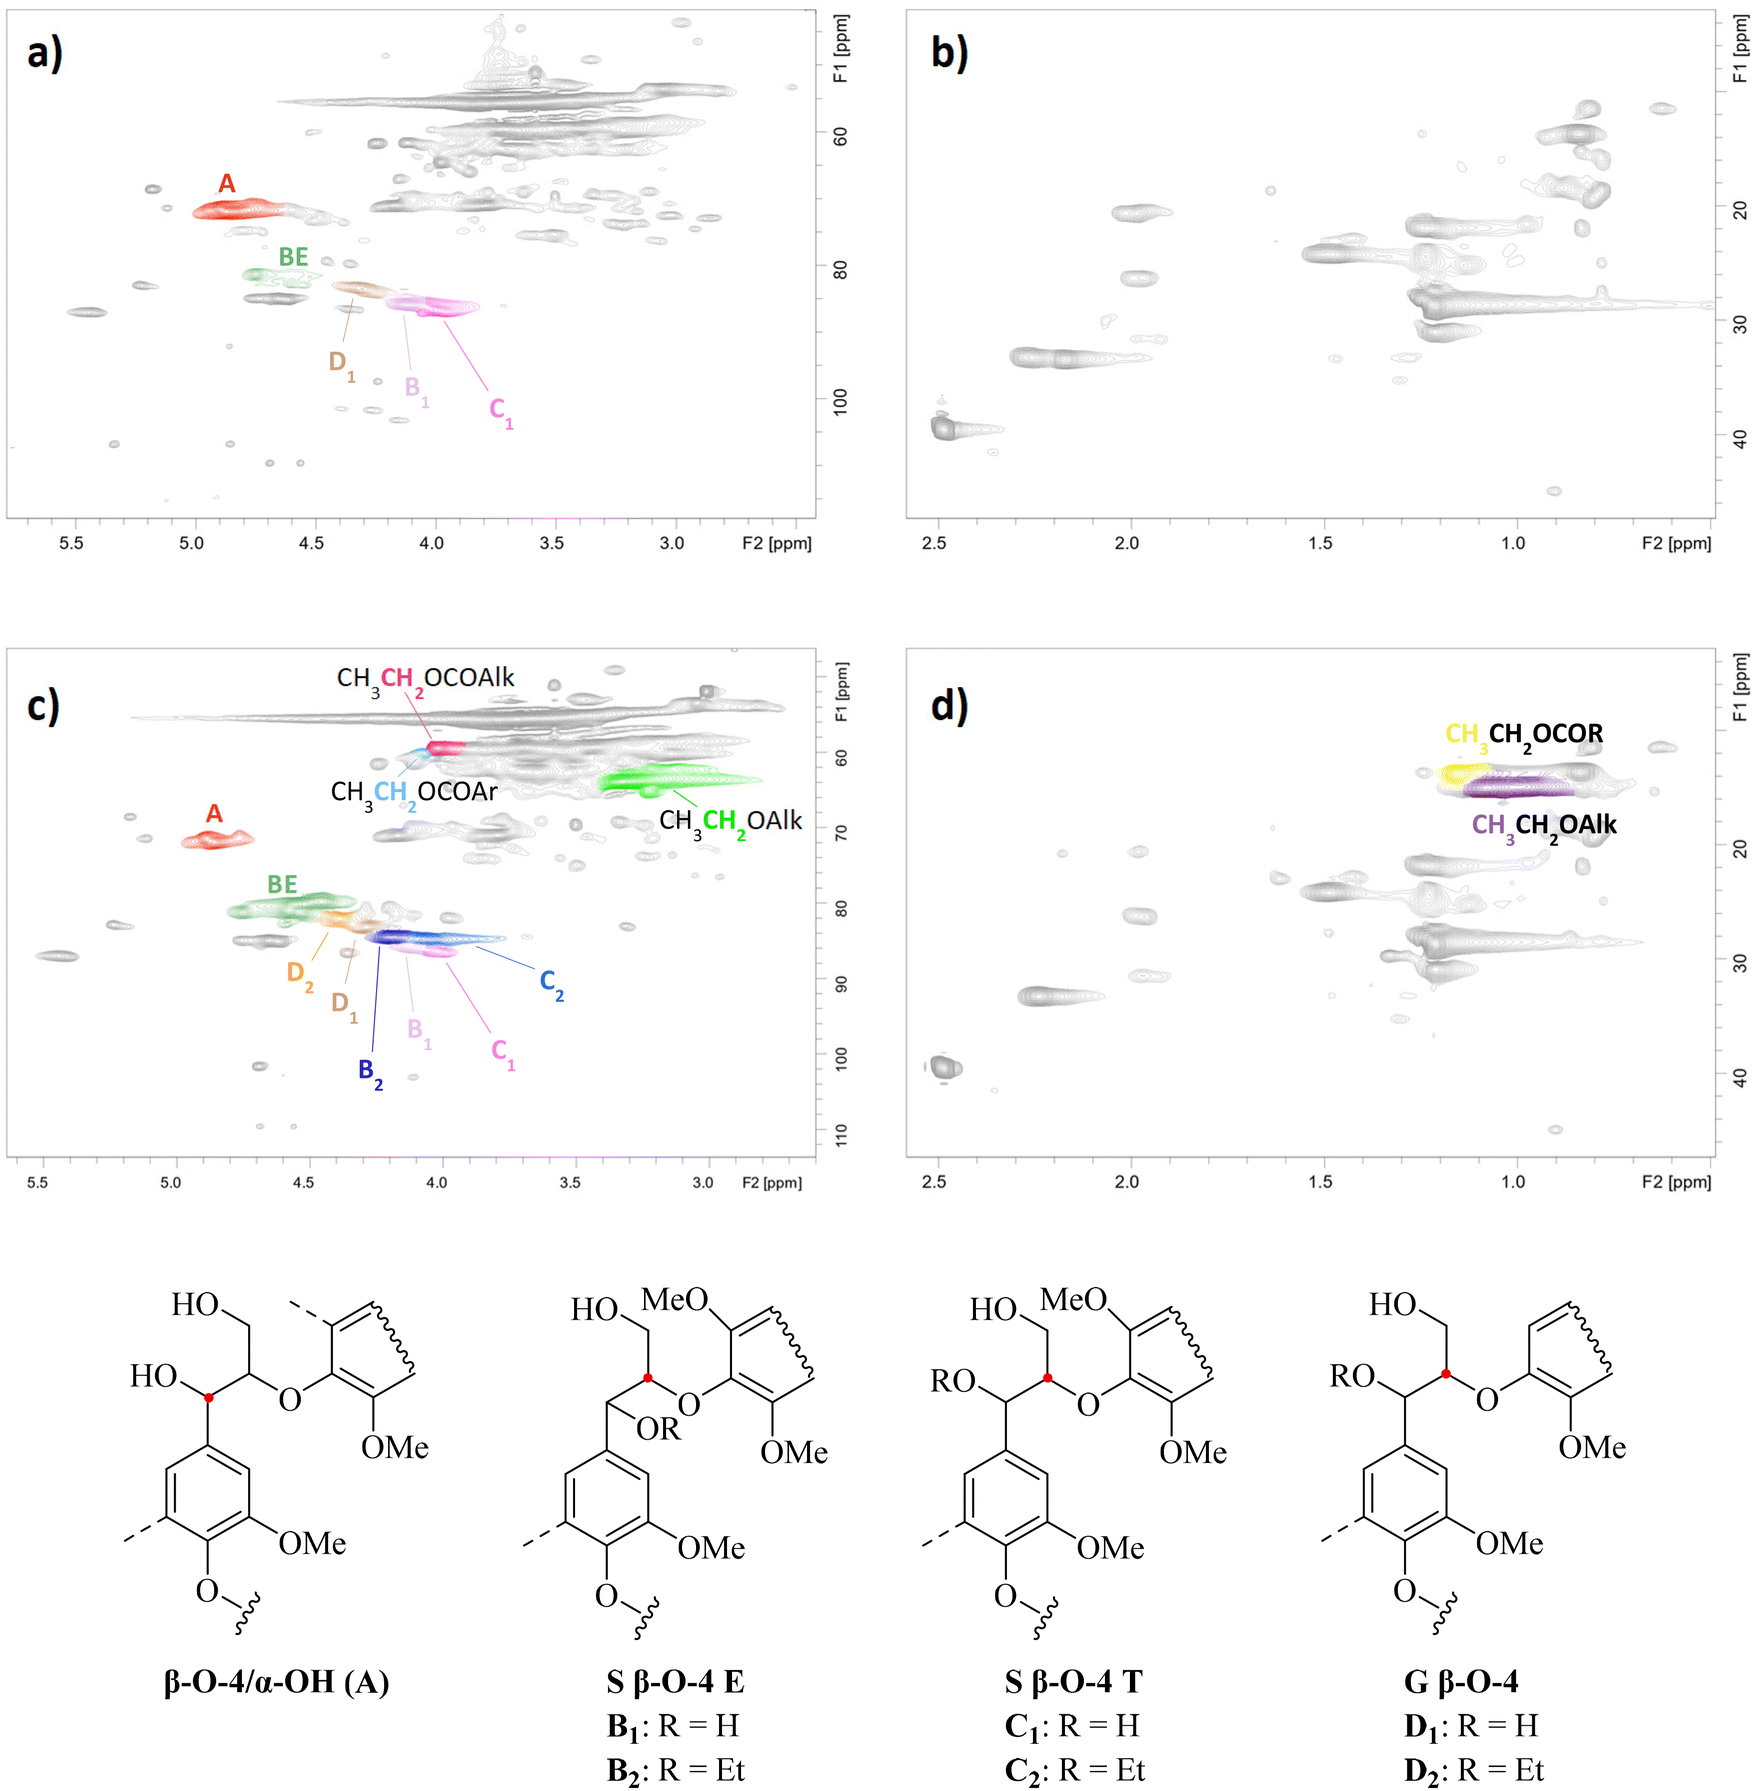 | ||
| Fig. 3 2D HSQC spectra of ethanol extracted lignin (EEL; a and b) and reactive extracted lignin (REL; c and d). Reaction conditions to produce REL: t = 4 h, [EtOH] = 99%, [H2SO4] = 0.15 M, T = reflux. | ||
The appearance of cross peaks assigned to –CH2– and CH3– groups in ethoxy alkyl ethers (Table 2, entries 1 and 3) and ethoxy alkyl esters (entry 2) after REx unveils that ethoxylation of aliphatic –OH occurred together with esterification (Fig. 3). This result was further confirmed by the decrease in both aliphatic –OH and –COOH groups obtained for the ethoxylated samples compared to blank experiments by 31P NMR analysis (compare S1 and S3–4 in Table 1). Cross peaks were assigned based on the literature data50–52 and Chemdraw simulations. In addition, a signal at δH/δC = 4.0–4.1/58.9–60.1 was detected with good separation and tentatively assigned to the –CH2– group in ethoxy aryl esters (CH3CH2OCOR with R = aryl; Table 2, entry 4) based on Chemdraw simulations and the literature data.52 The same signal could also be attributed to cinnamyl alcohol units as reported elsewhere.53
| Entry | Label | [EtOH] (%) | t (h) | [H2SO4] (M) | –OH/–COOH (per 100 Ar) | ||||||
|---|---|---|---|---|---|---|---|---|---|---|---|
| Aliphatic | PhOH (5-substituted) | PhOH (G-type n.c.) | PhOH (H-type) | COOH | Total Ph-OH | Total –OH | |||||
| a Isolated by rotary evaporation. n.c. = non-conjugated. | |||||||||||
| 1 | S1 | 70 | — | — | 69.2 | 45.4 | 13.1 | 3.0 | 7.4 | 61.5 | 130.7 |
| 2 | S2a | 99 | 4 | — | 63.4 | 56.4 | 14.5 | 2.6 | 6.8 | 73.5 | 136.9 |
| 3 | S3 | 99 | 0.5 | 1.2 | 54.8 | 44.0 | 14.0 | 3.0 | 3.5 | 61.0 | 115.8 |
| 4 | S4 | 99 | 4 | 0.15 | 48.1 | 43.7 | 13.6 | 2.9 | 2.5 | 60.3 | 108.3 |
| Entry | Moiety | Integration range (1H/13C) |
|---|---|---|
| 1 | ![[C with combining low line]](https://www.rsc.org/images/entities/char_0043_0332.gif) ![[H with combining low line]](https://www.rsc.org/images/entities/char_0048_0332.gif) 3-CH2-O-Alk 3-CH2-O-Alk |
0.8–1.1/14.0–15.9 |
| 2 | 3-CH2-OCO-R |
1.1–1.2/12.9–14.6 |
| 3 | CH3-2-O-Alk |
3.0–3.4/62.1–64.9 |
| 4 | CH3-2-OCO-Alk |
3.9–4.0/58.1–60.6 |
| 5 | CH3-2-OCO-Ar |
4.0–4.1/58.9–60.1 |
| 6 | Hα in β-O-4/α-OH | 5.3–4.6/73.7–69.7 |
| 7 | Hβ in S β-O-4 E | B1: 4.0–3.8/87.7–84.8 |
| B2: 4.1–4.3/83.6–85.4 | ||
| 8 | Hβ in S β-O-4 T | C1: 4.3–4.0/88.1–84.8 |
| C2: 3.9–4.1/83.9–85.3 | ||
| 9 | Hβ in G β-O-4 (E + T) | D1: 4.4–4.1/84.5–82.0 |
| D2: 4.3–4.4/81.2–83.0 |
No evidence for ethoxylation on phenolic –OH groups (PhOH) was found, as typical cross peaks of –CH2– and CH3– groups in EtO-Ar units were not present in the HSQC spectra at δH/δC = 4.0–4.2/65.0–69.0 and δH/δC = 1.3–1.4/14.0–15.0,54,55 respectively (Fig. S3‡). The same outcome was obtained by 31P NMR analysis, as the amount of PhOH was constant despite changing the reaction conditions (Table 1). This is consistent with an E1 reaction mechanism, plausible under acid catalysis,56 which cannot occur for PhOH.
Even though HSQC analysis provides data in a semi-quantitative way, it represents a valuable tool to relatively compare data obtained from similar lignin samples. In light of this, we quantified key lignin subunits and expressed the number per 100 Ar to provide further insights into REx (see also the Experimental section). During the course of the reaction, the number of β-O-4/α-OH units decreased from 22.6/100 Ar before REx (Table 2, entry 1) to 10.5 and 8.7/100 Ar under the harshest conditions tested (Table 2, entries 3 and 4, respectively). Parallelly, an increase in benzyl ether (BE) units at δH/δC = 4.3–4.8/78.3–82.053 from 4.1/100 Ar to 23.7 and 21.3, respectively, was found, suggesting that ethoxylation occurred on the α-position of β-O-4 bonds. More specifically, the signal at δH/δC = 4.4–4.6/78.8–80.8 can be assigned to β-O-4/α-OEt moieties considering the literature data53 and ChemDraw simulations. In turn, a chemical shift of the signal of the CHα/β moiety in β-O-4/α-OH units was expected. Consistently, additional cross peaks appeared at δH/δC = 4.1–4.3/83.6–85.4 and 3.9–4.1/83.9–85.3 after REx which are attributed to the erythro and threo isomers of β-O-4/α-OEt units, respectively, (structures B2-D2 shown in Fig. 3) considering the literature data52 and Chemdraw simulations. No proof for ethoxylation on the γ-position of β-O-4/α-OH units was found due to the overlap of multiple signals at in the characteristic area at δH/δC = 3.5–4.0/70–65.39,57–61
As far as other lignin moieties are concerned, the effect of REx on the amount of resinol and phenylcoumaran units was insignificant, not depending on the reaction conditions (see the ESI, Fig. S4 and Table S3‡). The presence of lignin carbohydrate complexes (LCCs), like phenyl glycoside, benzyl ether and glucuronic ester bonds, was detected in RELs, even though in low amounts (see the ESI, Fig. S5 and Table S3‡). Most likely, the majority of LCC linkages are present in the non-precipitated lignin.
Correlation of analytical methods for the evaluation of EtO-groups
Various methods are reported in the literature for the quantitative measurement of the EtO-group content in lignin, such as wet chemistry coupled with chromatography33,34 and quantitative 13C NMR.62 Even though HSQC is only known as a semi-quantitative NMR technique, it showed in some cases good correlation with quantitative 13C NMR9,62 and could thus be considered for the quantification of EtO-groups. However, to the best of our knowledge, no reports on the comparison of quantitative data from different techniques are present in the literature.For this reason, we compared quantitative 13C and 2D HSQC NMR with conventional methods based on hydroiodic acid (HI) treatment followed by chromatography33,34 and correlated the quantitative data. For HSQC, the –CH2– and –CH3 moieties of EtOH-groups were separately considered for quantification and are presented as the number of EtO-groups/100 Ar. We analyzed samples under four different extraction conditions (Table 3):
(i) blank sample, extraction with 70% EtOH (S1, entry 1);
(ii) catalyst-free REx with 99% EtOH for 4 h (S2, entry 2);
(iii) REx with 99% EtOH and 1.2 M H2SO4 for 0.5 h (S3, entry 3);
(iv) REx with 99% EtOH and 0.15 M H2SO4 for 4 h (S4, entry 4).
| Entry | Label | [EtOH] (%) | t (h) | [H2SO4] (M) | Yield (% original content) | 2D HSQC | Quantitative 13C | Chromatographic | ||||||||||||
|---|---|---|---|---|---|---|---|---|---|---|---|---|---|---|---|---|---|---|---|---|
| Subunit | Ethers | Alkyl esters | Aryl esters | Total CH3 | Total CH2 | Ethers | Esters | Total | Method 134 | Method 233 | ||||||||||
| β-O-4 a-OH | BE | BE + β-O-4 | CH3a | CH2b | CH3a | CH2b | CH2b | |||||||||||||
| a Quantified using CH3– moiety of EtO-group. b Quantified using –CH2– moiety of EtO-group. c Sample obtained through rotary evaporation. | ||||||||||||||||||||
| 1 | S1 | 70 | — | — | 28.1 | 22.6 | 4.1 | 26.7 | 1.6 | 2.3 | 0.2 | 0.5 | 0.1 | 1.9 | 2.9 | — | — | — | 0.1 | 1.4 |
| 2c | S2 | 99 | 4 | — | 51.9 | 23.7 | 4.4 | 28.1 | 2.0 | 3.6 | 0.2 | 0.6 | 0.1 | 2.3 | 4.3 | — | — | — | 2.0 | 2.0 |
| 3 | S3 | 99 | 0.5 | 1.2 | 54.0 | 10.5 | 23.7 | 34.2 | 27.1 | 21.4 | 6.8 | 9.4 | 0.5 | 34.2 | 31.3 | 21.9 | 11.8 | 33.7 | 22.9 | 23.0 |
| 4 | S4 | 99 | 4 | 0.15 | 35.2 | 8.7 | 21.3 | 30.0 | 33.2 | 24.6 | 6.9 | 9.7 | 0.5 | 40.5 | 34.8 | 28.5 | 12.3 | 40.8 | 28.7 | 24.8 |
As expected, the blank sample after extraction with 70% aqueous EtOH showed only a negligible presence of EtO-groups (<3%) by all methods (entry 1). However, quantification by HSQC was affected by signal overlap to a certain degree, resulting in comparably higher values (–CH2– 2.9/100 Ar; –CH3 1.9/100 Ar EtO-groups; see Table 3). The results from the catalyst-free extraction (entry 2) suggest that ethoxylation may scantly occur even without a catalyst (t = 4 h), since only slightly higher EtO-group contents were achieved compared to the blank sample. Although sample recovery may have an influence in this particular case (see the Experimental section). REx using H2SO4 as the catalyst led to a significant increase in EtO-groups (34.2–40.5/100 Ar and 33.7–40.8/100 Ar for entries 3 and 4, respectively). Nevertheless, the presence of extractives could contribute to some extent to the EtO-group content. In this regard, dedicated work must be performed to determine the exact contribution. In addition, the decrease in vinyl structures (Fig. S4 and Table S3‡) with an increase in DS suggests that incorporation of EtO-groups might occur through the addition of C![[double bond, length as m-dash]](https://www.rsc.org/images/entities/char_e001.gif) C double bonds as well.
C double bonds as well.
Interestingly, 2D HSQC and 13C NMR correlated well in the case of the –CH3 moiety (4.4% and 0.7% deviation for entries 3 and 4, respectively). This is in line with our recent results on the correlation of HSQC and 13C data for the quantification of LCCs.9 The HI methods produced consistently lower values than the NMR methods, but correlated quite well with each other (entry 2, Table 3). However, the method based on HS GC-MS is regarded as more precise and accurate due to a lesser number of steps during the analysis (i.e., lower risk of escape of volatile species during sample manipulation).63
In HI approaches, only ethoxy ethers (and not esters) contribute to the quantification of EtO-groups via the formation of methyl-/ethyl-iodide,64 resulting in lower values compared to NMR approaches. Quantitative 13C NMR data supports this, as the number of ethoxy ethers (not esters) are very close to the HI acid values (see Table 2). In addition, one should consider that the treatment of lignin with aqueous HI (57%) may promote hydrolysis of esters to form ethanol, which is not detected according to these methods.33,34
Overall, a good correlation between HSQC and quantitative 13C was found using our pulse sequences described in the Experimental section. Moreover, evidence for the sole contribution of ethers (and not esters) in the quantification of ethoxy groups by HI-based wet chemistry methods was presented. In light of this, our suggestion is to use NMR techniques to achieve quantitative data on the total amount of EtO-groups (esters and ethers), while for a fast track of EtO-ethers, wet chemistry seems to be the most suitable methodology.
Effects of the process variables on the molar mass distribution
GPC–MALLS785nm was used to determine the influence of the process variables (i.e., reaction time, EtOH, and H2SO4 concentration) on the molar mass of the obtained RELs. The MMDs and statistical moments are given in the ESI (Fig. S9 and Table S6‡).Adding H2SO4 to the extracting agent (EtOH) had the greatest influence on the molar mass. Lignins extracted with EtOH and H2SO4 (independent of the concentration) have higher molar masses than those extracted solely with EtOH (Fig. S9‡). We propose that the increase in molar mass is mainly due to condensation reactions – known to occur during lignin extraction with EtOH under acidic conditions.65 Adding H2SO4 initiates acid catalysis, causing hydrolysis of benzyl ether linkages (at Cα) and the formation of reactive benzyl carbocations. The introduced benzyl carbocations can easily form a bond with the aromatic ring of a neighboring lignin unit.65 This suggestion is further supported by the earlier reported HSQC measurements (e.g., a decrease of β-O-4/α-OH).
Moreover, the applied EtOH concentration influenced the molar mass of RELs. Lignins extracted with absolute EtOH (99%) show lower dispersity in molar mass (ĐM; i.e., are more homogeneous) compared to RELs extracted with aqueous EtOH (70, 80 and 90%) solutions (Fig. S9b‡). We propose that the variation in the molar mass is mostly due to the difference in polarity of the used EtOH solutions. Similar effects of the EtOH concentration on the molar mass of lignins have been reported in the literature.66–69 However, process parameters such as reaction time and concentration of H2SO4 do not influence on the molar mass of RELs.
Effects of process variables on the thermal properties
As the glass transition temperature (Tg) of lignin is known to be affected by the molar mass distribution70 and by plasticizing substituents,71 it is expected that both the molar mass distribution and the quantity of OEt-groups would influence the Tg of the lignin samples. As a general trend, it was found that RELs with higher molar masses contain smaller numbers of OEt-groups and vice versa (see MMD, Table S6 and Fig. S9‡). This implies that it is hard to discriminate if the Tg variation in RELs is ascribed to an increase in the DS and/or in the molar mass. Nevertheless, a negative linear correlation between Tg and the DS was found (Fig. 4) which can be correlated to both a plasticizing effect of ethoxy groups and a decrease in the molar mass.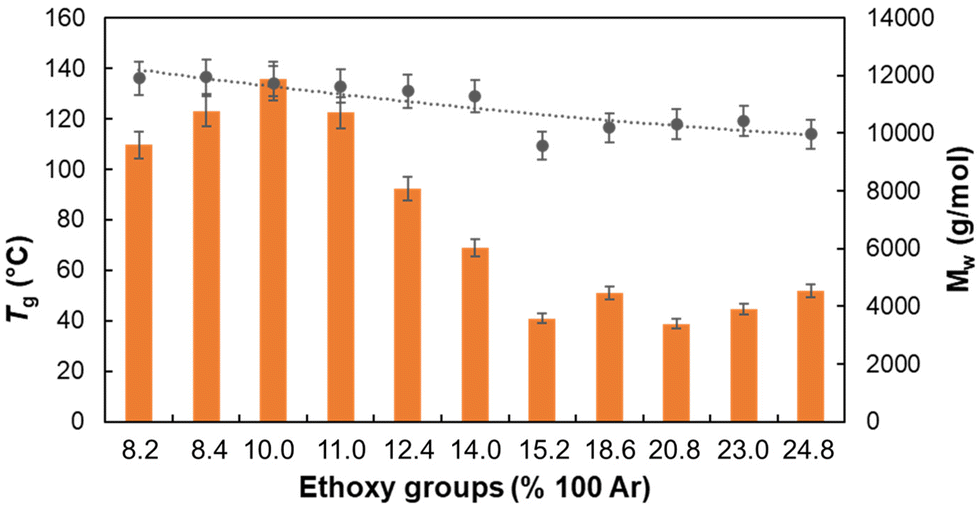 | ||
| Fig. 4 The correlation between EtO-groups content, MW and resulting Tg values. -●- Tg values -■- Mw. | ||
While the concentration of the catalyst (H2SO4) and the reaction time did not profoundly affect the Tg, the concentration of EtOH played a crucial role in determining the glass transition temperature (Fig. S10‡). More in detail, a sharp decrease in Tg from 134.0 to 109.5 °C was detected by increasing the EtOH concentration from 90% to 99%, in line with the simultaneous decrease in molar mass (Fig. S9b‡). In contrast, a smoother effect was found in the ethanol concentration range 70–90%. Overall, in order to produce more “thermoplastic” lignins with lower Tg both a higher DS and lower molar mass should be targeted.
Bonding strength of REL/pMDI adhesives
The use of different lignins (i.e., Kraft, lignosulfonates, organosolv, etc.) in adhesive formulations is one of the most promising utilization of lignin.72,73 Intriguingly, Sumerskii et al. reported recently that partially modified lignins (i.e. partially alkylated) have performed the best in the preparation of lignin-based PU binders.23 In this context, the performance of RELs in PU adhesives for wood veneers was investigated. Therefore, REL was mixed with polymeric methylene diphenyl diisocyanate (pMDI) and tested with an Automated Bond Evaluation System (ABES). For the ABES experiments REL samples with different EtO-groups contents were selected together with two control samples (pMDI and pMDI + non-ethoxylated lignin). The obtained results are reported in Table 4.| Sample | Conditionse | EtO-groupsd (% 100 Ar) | σ (N mm−2) | ||
|---|---|---|---|---|---|
| [EtOH] (%) | t (h) | [H2SO4] (M) | |||
| The REL/pMDI binder consisted of 0.25:0.25:0.5 wt% parts of REL:H2O:pMDI.a Control experiment with pMDI and without lignin.b Sample obtained from direct extraction with aqueous EtOH (70%) of lignin from S-500.c Reactive extracted lignins (RELs).d Data obtained from wet chemistry.e Conditions for the preparation of RELs. |
|||||
| pMDIa | — | — | — | — | 0.6 ± 0.2 |
| S1b | — | — | — | 1.2 | 2.6 ± 0.5 |
| S2c | 99 | 0.5 | 0.15 | 18.6 | 4.3 ± 0.8 |
| S3c | 99 | 0.5 | 1.2 | 23.0 | 4.0 ± 0.1 |
| S4c | 99 | 4 | 0.15 | 28.7 | 5.2 ± 0.7 |
As expected, ethoxylated lignins performed better than both the non-ethoxylated sample and the pMDI control. In addition, a clear performance improvement was found when the number of EtO-groups was increased: the highest bonding strength was measured for the sample with the highest DS (28.7 EtO-groups/100 Ar by wet chemistry; entry 4). As recently discussed,23 this is consistent with higher solubility of lignin in pMDI, which is a crucial parameter to facilitate the curing process when the use of a solvent is avoided. These results provide a new opportunity for the valorization of RELs in wood adhesive formulations.
To conclude this section, a comparison of different procedures for the development of lignin-based polyurethane adhesives is given (Table 5). However, the large variations in applied lignin substrates and adhesive formulations do not allow a reliable (numerical) comparison of the adhesive performance between studies.74 Consequently, the discussion will mainly focus on the differences in used additives, solvents, and catalysts as well as the advantages/disadvantages of each study.
| Entry | Lignin substrate | Formulation (wt:wt:wt)a |
Additives/solvents/catalyst | Curing T and t | Advantages | Drawbacks | Ref. |
|---|---|---|---|---|---|---|---|
| a Components of the adhesive formulation in addition to lignin. List of abbreviations: TDI = toluene diisocyanate; THF = tetrahydrofuran; HDI = hexamethylene diisocyanate; PO = propylene oxide; DMF = dimethyl formamide; CO = castor oil; n.a. = not available. | |||||||
| 1 | REx | Lignin:pMDI:H2O (0.25:0.25:0.5) |
None | T = 120 °C; t = 5 min | - Highly soluble lignins in pMDI | - Low lignin % (non-optimized) | This work |
| - Simple process and non-toxic reagents for lignin ethoxylation | |||||||
| - No additives | |||||||
| - Cat. Free | |||||||
| - Short curing time | |||||||
| 2 | Modified Kraft | Lignin:pMDI:H2O (0.33:0.33:0.33) |
None | T = 120 °C; t = 5 min | - Highly soluble lignins in pMDI | - Low lignin % | Sumerskii et al.23 |
| - No solvent | - Toxic reagents for lignin methylation | ||||||
| - Cat. Free | |||||||
| - Short curing time | |||||||
| 3 | Alkali lignin | Lignin:TDI:PEG (n.a.) |
Solvent: THF; Cat.: stannous octanoate | T = r.t.; t = 48 h | - No lignin modification requested | - Low lignin % | Chahar et al.76 |
| - Toxic solvent | |||||||
| - Catalyst needed | |||||||
| - Long curing time | |||||||
| 4 | Kraft, organosolv, steam explosion, acid hydrolysis and hydroxyalkyl lignins | Lignin:pMDI (0.6:0.4) |
Additive: H2O or emulsifying agent (Scripset 700); Solvent: MEK | T = 27 °C; t = 36 h | - No lignin modification requested | - Toxic solvents | Glasser et al.77 |
| - Different lignin substrates | - Use of additives | ||||||
| - Long curing time | |||||||
| 5 | Kraft and alkali lignins PO co-polymers (LPO) | LPPO:pMDI:HDI (n.a.) |
Solvents: benzene or DMF | T = 105 °C; t = n.a. | - Different lignin substrates | - Very toxic/carcinogenic solvents | Glasser et al.78 |
| - Use of additives | |||||||
| - Two-steps procedure | |||||||
| 6 | Kraft | Lignin:CO:MDI (0.1:0.3:0.6) |
None | T = r.t.; t = 7 days | - No additives | - Very low lignin content | Tavares et al.75 |
The major advantage of the approach presented herein is the simplicity of the procedure which does not require any additives, solvents, and catalysts, while being effective in very short curing times (t = 5 min, entry 1). As stated earlier, the high degree of ethoxylation made REx lignin samples directly soluble in pMDI, facilitating the synthesis of polyurethane adhesives in a single step. The procedure by Sumerskii et al. (entry 2) is overall similar but it is based on toxic and more expensive reagents like alkyl halides and anhydrides.23 In other words, REx represents a greener and more sustainable alternative to other lignin modification procedures. Another solvent and catalyst-free procedure was reported by Tavares et al.75 However, they needed very long curing times (t = 7 days, entry 6), thus making their approach less economical. Even though in all other procedures unmodified lignin samples were used, the need for a solvent – even very toxic ones – to solubilize lignin prior to curing poses important drawbacks from a sustainability standpoint (entries 3–5). In addition, in some cases a catalyst was added (entry 3) or a pre-polymer was synthesized prior to curing (entry 5).
Overall, the procedure we proposed seems, to date, among the most attractive. The partial modification of lignin avoids the use of solvents while maintaining lignin activity. On the other hand, solvents and/or long curing times are generally requested when unmodified lignin is used. However, it should be mentioned that in our protocol a non-optimized low lignin content (25 wt%) in the formulation was used and this aspect should be improved in further studies.
NMR analysis of the residual solids (RS)
Although the presented approach is focused on lignin, every biorefinery concept must consider full valorization of the biomass input.7 Thus, the fate of the cellulose and hemicellulose constituents during REx is also important. The obtained residual solids (RS) showed the incorporation of ethoxy functionalities according to chromatography methods (Fig. 2). Consequently, we were interested in whether a chemical modification of the polysaccharide fractions occurred during the reactive extraction protocol, or if the determined ethoxy group content was associated with non-extractable modified lignin fractions or solely EtOH impurities. For this endeavor both solid state CP MAS 13C NMR and solution state NMR protocol using direct dissolution of the ionic liquid electrolyte31 were tentatively conducted on certain RS showing high DS values (Fig. 5). Both approaches suffered from peak superposition issues. The ethoxy CH2 signal was in the same spectral range as the polysaccharide backbone. Owing to the intrinsically low resolution in the solid state 13C NMR spectra leading to broad peaks, the acetyl CH3 peaks of the hemicellulose content could not be sufficiently differentiated from potential ethoxy CH3 moieties (Fig. S12 and S13‡). In the solution state NMR spectra (Fig. S14 and S17‡) significant peak superposition with the signals of [P4444][OAc] in the electrolyte was encountered. Only in the diffusion edited 1H NMR experiment where signals of low molecular weight compounds are effectively suppressed in the spectra31 the appearance of an additional broad peak at around 1.0–1.3 ppm (ethoxy CH3) in the residual solids (RS) clearly indicated the covalent modification of some of the polymeric fractions to a minor extent. However, as the RS proved to be partially insoluble and the diffusion edited 1H experiment uses a non-quantitative pulse program which significantly overestimates signals of lower molecular weight compounds,31 cross validation of the values obtained from chromatography analyses (see above) was not possible. Comparison of the relative intensities of the lignin peaks observed in the solid state 13C NMR spectrum (Fig. S12‡) with the signals apparent in the solution state spectra (Fig. S17‡) suggested that the insolubles predominantly consisted of fractions with high residual lignin content.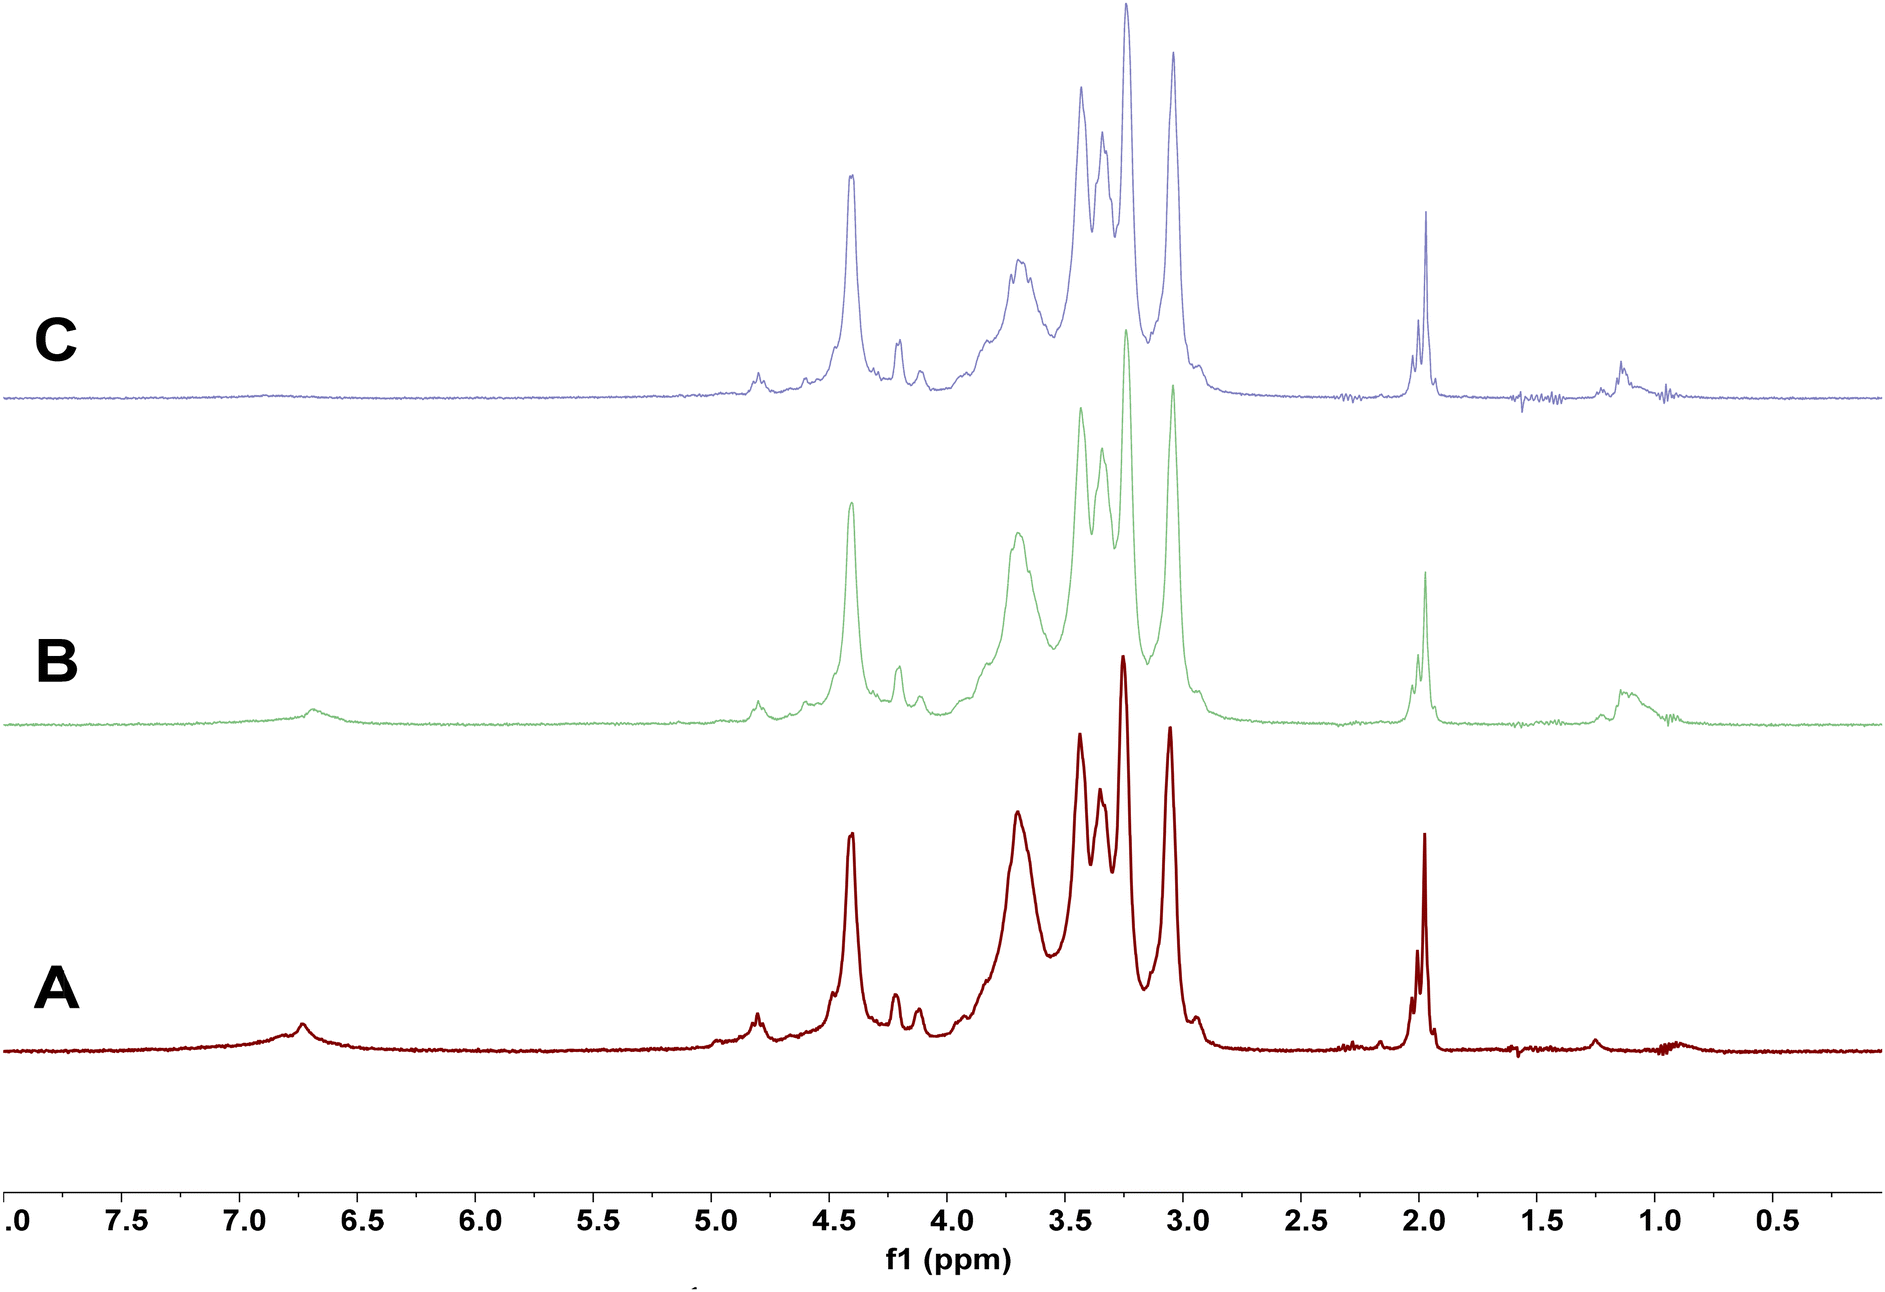 | ||
| Fig. 5 Stack of diffusion edited 1H spectra ([P4444][OAc]:DMSO-d6, 1:4 wt%; 400 MHz; 65 °C) of cellulose-rich solids (measuring concentration 2.5 wt%) obtained on the RS of the S-500 control sample (A), RS after reactive extraction with the highest DS (conditions: [EtOH] = 99%, [H2SO4] = 0.15 M, t = 4 h) unbleached (B) and bleached (C). Despite the presence of insolubles in the measuring solutions, spectra A and B were not drastically different from previous reports on pulp samples obtained in used or similar electrolytes. Comparing spectra A and B it becomes evident that higher severity factors lead to the incorporation of ethoxy functionalities also in the polymeric fractions according to an additional peak at around 1 ppm characteristic of an ethoxy CH3 moiety. After additional bleaching of the high severity HTT solid (C) the lignin fractions are effectively removed, while the ethoxy peak at least partly remains. This indicates that the modification partially occurred on the polysaccharide fractions of the RS, presumably on the hemicelluloses. | ||
To further investigate if the modification occurred on cellulose, hemicellulose or lignin – all present in the RS after REx – the residual lignin content was removed by extractive ball milling or bleaching (more details are given in the ESI‡). In the lignins isolated through ball milling a relatively strong ethoxy CH3 peak indicated a derivatization during REx (see Fig. S23‡). The obtained cellulosic fraction after ball milling proved to be completely insoluble in the electrolyte system, presumably due to strong mechanical cross linking, thereby preventing comparison of the spectra.
The bleached sample gave completely dissolved NMR samples and showed that even after the removal of lignin a small ethoxy CH3 peak remained, proving that also the polysaccharide fractions were at least slightly modified during REx. The shape of the peak slightly changed with the disappearance of a shoulder at lower frequencies (around 1.0 ppm), presumably caused by the removed lignin ethoxy moieties. Investigation of the HSQC spectrum and comparison with the unbleached sample showed that the polysaccharide fractions were not visibly affected by the bleaching. There were no signs of etherification reactions in the cellulose backbone when comparing the obtained 1H–13C HSQC spectra with the thorough reports on methylcelluloses.79 However, given the apparent rather minor overall derivatization and high viscosity of the sample necessitating a reduction of the measuring concentration, the absence can admittedly also be ascribed to the insufficient signal to noise ratio. As expected for a hardwood pulp, the hemicellulose fractions predominantly consisted of xylans with a high proportion of acetylated moieties, indicated by four distinct peaks for acetyl CH3 groups at around 2 ppm in the diffusion edited 1H spectra. While the peaks appear almost as intensive as the cellulose backbone, it should be noted that the signals obtained in this pulse program are heavily influenced by the relaxation times of the functionalities and the molecular weight of the polymer. In pulp samples the intensities of hemicellulose constituents can thus be drastically overestimated.31 Given the low peak intensities of the ethoxy CH3 moiety and the absence of signals of a modified cellulose backbone, we suspect that the ethoxylation during REx of the polysaccharide fractions of the RS is also predominantly occurring on the xylans. Although we admittedly do not have solid proof for this assumption, the carboxylic acid functionalities, e.g., of the methylglucoronic acid sidechains represent a favorable side of attack through esterification.
In conclusion, the ethoxy functionalities in the RS determined by chromatography methods, are likely predominantly present in non-extractable lignin fractions and to a low extent in the hemicelluloses.
Conclusions
Reactive extraction (REx) allowed the isolation of ethoxylated lignins in yields up to 52% with respect to the initial lignin content with a DS of up to 40.8/100 Ar. The effects of process parameters, i.e., reaction time, solvent (EtOH) and catalyst (H2SO4) concentration, on the lignin structure and properties have been thoroughly discussed. An increase of the solvent and catalyst concentration improved the incorporation of EtO-groups, while decreasing the molar mass and Tg of the lignin samples. NMR experiments of RELs showed that REx causes ethoxylation and esterification of aliphatic –OH groups while phenolic –OH groups are not affected. Moreover, the analysis of the cellulose-rich fraction by wet chemistry and NMR approaches showed that ethoxylation also partially occurs in the polysaccharide fraction. Comparing different methods (HI-based vs. NMR) of ethoxy group quantification in lignin revealed that quantitative 13C NMR works best for the quantification of the total ethoxy group (ethers and esters) content. On the other hand, the HI method based on HS GC-MS is the best for the quantification of ethoxy-ethers. Furthermore, utilizing ethoxylated lignins could improve the performance of lignin-based PU adhesives.The major strength of the REx approach is its simplicity. REX allows for a simultaneous functionalization and extraction of lignin from hydrothermally treated wooden biomass. This avoids tedious steps of lignin separation from biomass prior to functionalization. In addition, the use of non-toxic and inexpensive reagents, i.e., ethanol and sulfuric acid—which can be almost fully recycled—opens the potential of the production of highly ethoxylated lignins on an industrial scale.
To summarize, different concomitant aspects are decisive for the high yield production of highly ethoxylated lignins:
(i) The hydrothermal treatment carried out before REx allowed biomass component fractionation, making lignin easily accessible by the ethanol solvent-reagent during REx.
(ii) As discussed throughout the text, ethoxylation occurs mostly at the α-position of β-O-4 bonds. Based on our previous reports,8,9 the combination of a low liquid-to-solid ratio (L/S = 1) and low severity (P-factor = 500) leads to the isolation of β-O-4 rich lignins. Thus, the high number of β-O-4 moieties maintained after the hydrothermal treatment favored the occurrence of ethoxylation at the α-position of β-O-4 moieties.
(iii) The comprehensive investigation of the effects of process parameters (t, [EtOH], and catalyst amount) on the degree of substitution allowed for an optimization of the process targeting both high lignin yield and high degree of substitution with ethoxy groups. Overall, we found that to achieve highly ethoxylated lignin, the purity of ethanol is the most crucial parameter, while the time and the catalyst amount affect the outcome to a minor extent.
(iv) Ethoxylation of extractives was hypothesized as an additional contribution to the number of ethoxy groups in RELs. This will be further confirmed by dedicated future studies.
In light of all these considerations, in our vision, REx is a general approach which can be applied for the production of ethoxylated lignins starting from various biomass sources. More specifically, to enhance the degree of substitution, pure solvents should be used with low catalyst loading for a short time. In addition, to further highlight the general potential of REx, other modifications (i.e., acetylation) may be developed in future studies.
Author contributions
D.R.: investigation, conceptualization, funding acquisition, supervision, and writing – review & editing; N.K.: investigation, methodology, and writing – original draft; L.F.: investigation, methodology, and writing – original draft; D.D.: investigation and methodology; M.C.: investigation and methodology; I.S.: investigation and methodology; M.H.: funding acquisition, supervision, and review & editing; A.P.: funding acquisition, supervision, and review & editing; M.B.: funding acquisition and supervision.Conflicts of interest
There are no conflicts of interest to declare.Acknowledgements
The authors thank Madina Muratova (Aalto University) for her help in the compositional analysis of wood solids and Oliver Musl (Institute of Chemistry of Renewable Resources; BOKU, Vienna) for the useful discussion and feedback. D. R. gratefully acknowledges the support from the Academy of Finland's Flagship Programme under Projects No. 318890 and 318891 (Competence Center for Materials Bioeconomy, FinnCERES). D. D., M. C. and M. B. gratefully acknowledge the support from the Academy of Finland (grant 341586). D. R. acknowledges FinnCERES for its support through GoGlobal mobility fundings.References
- F. G. Calvo-flores and J. A. Dobado, ChemSusChem, 2010, 3, 1227 CrossRef CAS PubMed.
- L. Dessbesell, M. Paleologou, M. Leitch, R. Pulkki and C. (Charles) Xu, Renewable Sustainable Energy Rev., 2020, 123, 109768 CrossRef CAS.
- F. S. Chakar and A. J. Ragauskas, Ind. Crops Prod., 2004, 20, 131–141 CrossRef CAS.
- M. Karlsson, V. L. Vegunta, R. Deshpande and M. Lawoko, Green Chem., 2022, 24, 1211 RSC.
- Y. Wang, P. Liu, G. Zhang, Q. Yang, J. Lu, T. Xia, L. Peng and Y. Wang, Renewable Sustainable Energy Rev., 2021, 137, 110586 CrossRef CAS.
- R. Zhang, H. Gao, Y. Wang, B. He, J. Lu, W. Zhu, L. Peng and Y. Wang, Bioresour. Technol., 2023, 369, 128315 CrossRef CAS PubMed.
- M. Y. Balakshin, E. A. Capanema, I. Sulaeva, P. Schlee, Z. Huang, M. Feng, M. Borghei, O. J. Rojas, A. Potthast and T. Rosenau, ChemSusChem, 2021, 14, 1016 CrossRef CAS PubMed.
- D. Tarasov, P. Schlee, A. Pranovich, A. Moreno, L. Wang, D. Rigo, M. H. Sipponen, C. Xu and M. Balakshin, Green Chem., 2022, 24, 6639 RSC.
- P. Schlee, D. Tarasov, D. Rigo and M. Balakshin, ChemSusChem, 2023, 16, e2023005 CrossRef PubMed.
- J. H. Lora and W. G. Glasser, J. Polym. Environ., 2002, 10, 39 CrossRef CAS.
- D. A. Baker and T. G. Rials, J. Appl. Polym. Sci., 2013, 130, 713 CrossRef CAS.
- Y. Li and S. Sarkanen, Macromolecules, 2005, 38, 2296 CrossRef CAS.
- S. Laurichesse and L. Avérous, Prog. Polym. Sci., 2014, 39, 1266 CrossRef CAS.
- M. Zhang and A. A. Ogale, Carbon, 2013, 69, 626 CrossRef.
- W. G. Glasser, Front. Chem., 2019, 7, 1 CrossRef PubMed.
- D. Di Francesco, C. Dahlstrand, J. Löfstedt, A. Orebom, J. Verendel, C. Carrick, Å. Håkansson, S. Eriksson, H. Rådberg, H. Wallmo, M. Wimby, F. Huber, C. Federsel, M. Backmark and J. S. M. Samec, ChemSusChem, 2021, 14, 2414 CrossRef CAS.
- D. Di Francesco, D. Rigo, R. Baddigam, A. P. Mathew, N. Hedin, M. Selva and J. S. M. Samec, ChemSusChem, 2022, 15, e2022003 CrossRef PubMed.
- X. Meng, S. Bhagia, Y. Wang, Y. Zhou, Y. Pu, J. R. Dunlap, L. Shuai, A. J. Ragauskas and C. G. Yoo, Ind. Crops Prod., 2020, 146, 112144 CrossRef CAS.
- O. Hosseinaei, D. P. Harper, J. J. Bozell and T. G. Rials, Int. J. Mol. Sci., 2017, 18, 1410 CrossRef PubMed.
- Y. Huang, S. Sun, C. Huang, Q. Yong, T. Elder and M. Tu, Biotechnol. Biofuels, 2017, 10, 1–11 CrossRef PubMed.
- S. Kubo and J. F. Kadla, Macromolecules, 2004, 37, 6904 CrossRef CAS.
- C. Chew, Solvolytic extraction of lignin from wood, Department of Chemistry McGill University, Montreal, Canada, 1968 Search PubMed.
- I. Sumerskii, P. Solt, H. W. G. Van Herwijnen, I. Sulaeva, T. Thomas, T. Rosenau and A. Potthast, Lenzinger Ber., 2022, 97, 109 CAS.
- X. Jiang, Z. Tian, X. Ji, H. Ma, G. Yang and M. He, Int. J. Biol. Macromol., 2022, 201, 400 CrossRef CAS PubMed.
- H. Sadeghifar, C. Cui and D. S. Argyropoulos, Ind. Eng. Chem. Res., 2012, 51, 16713 CrossRef CAS.
- M. Y. Balakshin, E. A. Capanema, M. Colakyan and F. Lipiecki, US Patent Nr10240006B2, 2019 Search PubMed.
- M. Karlsson, N. Giummarella, A. Lind and M. Lawoko, ChemSusChem, 2020, 13, 4666 CrossRef CAS PubMed.
- S. Bertella and J. S. Luterbacher, Green Chem., 2021, 23, 3459 RSC.
- L. Shuai, M. T. Amiri, Y. M. Questell-Santiago, F. Héroguel, Y. Li, H. Kim, R. Meilan, C. Chapple, J. Ralph and J. S. Luterbacher, Science, 2016, 354, 329 CrossRef CAS PubMed.
- D. S. Zijlstra, C. W. Lahive, C. A. Analbers, M. B. Figueireido, Z. Wang, C. S. Lancefield and P. J. Deuss, ACS Sustainable Chem. Eng., 2020, 8, 5119 CrossRef CAS.
- L. Fliri, K. Heise, T. Koso, A. R. Todorov, D. Rico, S. Hietala, J. Fiskari, I. Kilpeläinen, M. Hummel and A. W. T. King, Nat. Protoc., 2023, 18, 2084 CrossRef CAS.
- Y. Ni and Q. Hu, J. Appl. Polym. Sci., 1995, 57, 1441–1446 CrossRef CAS.
- H. Goto, K. Koda, G. Tong, Y. Matsumoto and G. Meshitsuka, J. Wood Chem. Technol., 2006, 26, 81 CrossRef CAS.
- I. Sumerskii, T. Zweckmair, H. Hettegger, G. Zinovyev, M. Bacher, T. Rosenau and A. Potthast, RSC Adv., 2017, 7, 22974 RSC.
- C. S. Lancefield, H. L. J. Wienk, R. Boelens, B. M. Weckhuysen and P. C. A. Bruijnincx, Chem. Sci., 2018, 9, 6348 RSC.
- M. Balakshin, E. Capanema, H. Gracz, H. Min Chang and H. Jameel, Planta, 2011, 233, 1097 CrossRef CAS PubMed.
- M. Y. Balakshin, E. A. Capanema and H. M. Chang, Holzforschung, 2007, 61, 1 CAS.
- M. Y. Balakshin, E. A. Capanema, C.-L. Chen and H. S. Gracz, J. Agric. Food Chem., 2003, 51, 6116 CrossRef CAS PubMed.
- J. Ralph and L. L. Landucci, Lignin and Lignans: Advances in Chemistry, 2010, pp. 137–243 Search PubMed.
- M. M. Abu-Omar, G. T. Beckham, J. S. Luterbacher, J. Ralph, R. Rinaldi, Y. Roman-Leshkov, J. S. M. Samec, B. F. Sels and F. Wang, Energy Environ. Sci., 2021, 14, 262 RSC.
- A. Granata and D. S. Argyropoulos, J. Agric. Food Chem., 1995, 43, 1538 CrossRef CAS.
- M. Balakshin and E. Capanema, J. Wood Chem. Technol., 2015, 35, 220 CrossRef CAS.
- G. Zinovyev, I. Sulaeva, S. Podzimek, D. Rössner, I. Kilpeläinen, I. Sumerskii, T. Rosenau and A. Potthast, ChemSusChem, 2018, 11, 3259 CrossRef CAS PubMed.
- A. Sluiter, B. Hames, R. Ruiz, C. Scarlata, J. Sluiter, D. Templeton and D. Crocker, Determination of Structural Carbohydrates and Lignin in Biomass, 2005 Search PubMed.
- T. Koso, D. R. del Cerro, S. Heikkinen, T. Nypelö, J. Buffiere, J. E. Perea-Buceta, A. Potthast, T. Rosenau, H. Heikkinen, H. Maaheimo, A. Isogai, I. Kilpeläinen and A. W. T. King, Cellulose, 2020, 27, 7929 CrossRef CAS.
- A. W. T. King, V. Ma, S. A. Kedzior, T. Laaksonen, G. J. Partl, S. Heikkinen, H. Koskela, H. A. Heikkinen, A. J. Holding, E. D. Cranston and I. Kilpela, Biomacromolecules, 2018, 19, 2708 CrossRef CAS PubMed.
- P. Solt, S. Libowitzky and H. W. G. Van Herwijnen, Wood Sci. Technol., 2020, 54, 7 CrossRef CAS.
- D. Tarasov, M. Leitch and P. Fatehi, Biotechnol. Biofuels, 2018, 11, 1 CrossRef PubMed.
- R. El, N. Brosse, P. Sannigrahi and A. Ragauskas, Polym. Degrad. Stab., 2010, 95, 997 CrossRef.
- K. Sutoh, K. Kobata and T. Watanabe, J. Agric. Food Chem., 2001, 49, 4026 CrossRef CAS PubMed.
- S. S. Mochalov, A. N. Fedotov, E. V. Trofimova and N. S. Zefirov, Russ. J. Org. Chem., 2016, 52, 503 CrossRef CAS.
- S. Ralph, U. F. Service and J. Ralph, NMR Database of Lignin and Cell Wall Model Compounds, 2009 Search PubMed.
- M. Y. Balakshin, E. A. Capanema, X. Zhu, I. Sulaeva, A. Potthast, T. Rosenau and O. J. Rojas, Green Chem., 2020, 22, 3985–4001 RSC.
- K. Tanaka, Chem. Pharm. Bull., 1977, 57, 364–370 Search PubMed.
- https://www.chemicalbook.com/SpectrumEN_103-73-1_1HNMR.htm (Accessed: 29/09/2023).
- E. Adler, Wood Sci. Technol., 1977, 11, 169 CrossRef CAS.
- M. Y. Balakshin and E. A. Capanema, RSC Adv., 2015, 5, 87187 RSC.
- B. G. J. Leary, D. A. Sawtell and H. Wong, Holzforschung, 1983, 37, 213 CrossRef.
- J. Sipilä and G. Brunow, Holzforschung, 1991, 45, 275 CrossRef.
- G. Brunow, J. Sipilä and T. Mäkelä, Holzforschung, 1989, 43, 55 CrossRef CAS.
- F. Lu and J. Ralph, Org. Biomol. Chem., 2008, 6, 3681 RSC.
- E. A. Capanema, M. Y. Balakshin and J. F. Kadla, J. Agric. Food Chem., 2005, 53, 9639 CrossRef CAS PubMed.
- H. Li, X. Chai, M. Liu and Y. Deng, J. Agric. Food Chem., 2012, 60, 5307 CrossRef CAS PubMed.
- S. M. Baker, Holzforschung, 1996, 50, 573 CAS.
- T. J. Mcdonough, The Chemistry of Organosolv Delignification, IPST Technical Paper Series No. 455, 1992 Search PubMed.
- A. S. Jääskeläinen, T. Liitiä, A. Mikkelson and T. Tamminen, Ind. Crops Prod., 2017, 103, 51 CrossRef.
- X. Pan, J. F. Kadla, K. Ehara, N. Gilkes and J. N. Saddler, J. Agric. Food Chem., 2006, 54, 5806 CrossRef CAS PubMed.
- J. R. Meyer, H. Li, J. Zhang and M. B. Foston, ChemSusChem, 2020, 13, 4557 CrossRef CAS PubMed.
- W. M. Goldmann, J. Ahola, M. Mikola and J. Tanskanen, Sep. Purif. Technol., 2019, 209, 826 CrossRef CAS.
- B. S. Kubo, Y. Uraki and Y. Sano, Holzforschung, 1996, 50, 144–150 CrossRef.
- S. Sen, S. Patil and D. S. Argyropoulos, Green Chem., 2015, 17, 4862 RSC.
- A. Vishtal and A. Kraslawski, BioResources, 2011, 6, 3547 Search PubMed.
- M. Alinejad, S. Nikafshar, A. Gondaliya, S. Bagheri, N. Chen, S. K. Singh, D. B. Hodge and M. Nejad, Polymers, 2019, 11, 1202 CrossRef PubMed.
- D. Diment, O. Tkachenko, P. Schlee, N. Kohlhuber, A. Potthast, T. Budnyak, D. Rigo and M. Balakshin, Biomacromolecules, 2024, 25(1), 200 CrossRef CAS PubMed.
- L. B. Tavares, C. V. Boas, G. R. Schleder, A. M. Nacas, D. S. Rosa and D. J. Santos, eXPRESS Polym. Lett., 2016, 10, 927 CrossRef CAS.
- S. Chahar, M. G. Dastidar, V. Choudhary and D. K. Sharma, J. Adhes. Sci. Technol., 2004, 18, 169 CrossRef CAS.
- W. H. Newman and W. G. Glasser, Holzforschung, 1985, 39, 345 CrossRef CAS.
- W. G. Glasser, V. P. Saraf and W. H. Newman, J. Adhes., 1982, 14, 233 CrossRef CAS.
- H. Kono, S. Fujita and K. Tajima, Carbohydr. Polym., 2017, 157, 728 CrossRef CAS PubMed.
Footnotes |
| † In memory of Prof. of Practice Mikhail Balakshin. |
| ‡ Electronic supplementary information (ESI) available. See DOI: https://doi.org/10.1039/d3gc03776b |
| § Deceased, 2022. |
| This journal is © The Royal Society of Chemistry 2024 |