
 Open Access Article
 This Open Access Article is licensed under a Creative Commons Attribution-Non Commercial 3.0 Unported Licence
Co-fermentation improves the functional properties and nutritional quality of infant complementary food products
Luigi
Moriconi
a,
Elena
Vittadini
a,
Anita R.
Linnemann
 b,
Vincenzo
Fogliano
b and
Ruth T.
Ngadze
*b
b,
Vincenzo
Fogliano
b and
Ruth T.
Ngadze
*b
aSchool of Biosciences and Veterinary Medicine, Università degli Studi di Camerino, Camerino, MC, Italy
bFood Quality and Design group, Wageningen University and Research, Wageningen, The Netherlands. E-mail: ruth.ngadze@wur.nl
First published on 10th September 2024
Abstract
Food-to-food fortification and fermentation are effective strategies to enhance the product functionality and nutrient density of infant complementary foods. However, their effectiveness hinges on a deep understanding of ingredient combinations. Our research focused on the physicochemical and techno-functional aspects of sorghum–baobab blends, comparing two processes: ‘co-ferment-cook’ and ‘ferment-cook-fortify’. The results show that both techniques improved the water absorption capacity by 17–20% and the water solubility index increased by over 100% while maintaining a comparable nutritional composition and energy density. The calculated energy density (2048.8–2345 kJ day−1) was sufficient for both blends for infants 6–11 months old with an average breast milk intake. Viscosity, another crucial factor for complementary feeding, improved significantly (P < 0.05) after co-ferment-cook compared to ferment-cook-fortify reaching a value suitable for children older than 18 months. Starch digestibility increased with co-ferment-cook, while protein digestion increased with fortified non-fermented foods. In conclusion, our findings emphasize that combining fermentation and fortification processing steps is optimal for balancing the nutritional and techno-functional properties of sorghum porridges for infant complementary foods. Processing parameters must be optimized to reach the viscosity suitable for complementary feeding at the assigned soluble solid contents for the age group 6–24 months.
1. Introduction
Child malnutrition in sub-Saharan Africa (SSA) is exacerbated by climate change, manifested by recurrent droughts that threaten the food and nutritional security of vulnerable population groups.1,2 Climate-resilient crops (CRCs), especially small grains such as sorghum, contain high amounts of essential amino acids, fibre and micronutrients and have been used as an alternative to mainstream cereal crops to overcome the double-edged impact of droughts and malnutrition.3 Sorghum is culturally significant in many African societies, where it is often incorporated into traditional diets and culinary practices, including complementary foods.4 The goal of complementary feeding during weaning is to consume nutritionally complete and balanced foods that adapt to the culture of the family and the country.5Sorghum's nutritional value is comparable to other staple cereals such as wheat, rice, and corn.6 Its protein content ranges from 11 to 13%.6 The most representative amino acids are glutamic acid and non-polar amino acids (proline, leucine, and alanine), but there is a deficiency of lysine, tryptophan, methionine, cysteine, isoleucine, valine, and threonine.7,8 Some scholars have classified sorghum as a low nutritional value food because it contains anti-nutrients such as phytic acid.9 The chelating properties of phytic acid cause mineral ion deficiencies in human nutrition.10 In addition to that, phytic acid hinders enzymatic activities for protein degradation in the small intestine and stomach.11 For this reason, reducing the phytic acid content is crucial to improving the nutritional characteristics of sorghum or foods obtained from this cereal, especially if they are intended for weaning children.
Infants have limited oromotor abilities, making them unable to chew and swallow thick and viscous foods. Therefore, porridge is usually cooked and diluted with water, decreasing its nutrient and energy density. Consequently, infants must consume large quantities of porridge to have adequate nutrient intake, but their reduced gastric capacity limits the amount they can consume.12 For an easy-to-swallow, semi-liquid porridge considered suitable for infants, a viscosity limit of 3 Pa s has been suggested, commonly measured with an assumed oral shear rate of 50 per s and temperatures of 30–40 °C.12
Cost-effective strategies such as spontaneous fermentation have been useful in overcoming these challenges. Spontaneous fermentation is based on uncontrolled fermentation conditions in the presence of a consortium of bacteria, fungi and/or yeasts indigenous to the raw materials used as the inoculum.13 According to recent work,14 spontaneous fermentation and food-to-food fortification are two strategies that could improve sorghum porridge viscosity for consumption by >18 months old infants. However, the viscosity of the fermented sorghum porridge is not significantly improved compared to that of unfermented porridge. Yet, fermentation improves the nutritional profile as it decreases the phytic acid content and increases the digestibility of starch, although it does not have the same effect on the digestibility of proteins,14 which are insufficient to meet infant growth and development needs.
To meet the requirements of complementary food, cereal-based foods may be enriched with food ingredients that are high in limiting nutrients. A potential ingredient for sorghum-based porridges is fruit pulp or juice from indigenous, climate-resistant fruit trees.15,16 Baobab is a promising ingredient used to fortify sorghum porridge to improve its nutritional value and sensory properties.17 Nevertheless, despite the reported improvement in the nutritional quality of fortified fermented cereal-based foods, infants’ nutrient needs are still unmet due to the porridges’ high viscosities that limit adequate intake.4
Another strategy, co-fermentation, has emerged as a promising method for producing foods with high energy density and appropriate viscosity specifically designed for household use in sub-Saharan Africa.14 Notwithstanding the unfolding benefits of co-fermentation, the cumulative complexity of final product quality in this category of foods still needs to be fully explored, starting with the viscosity and energy density. It is critical to establish the underlying principles of how spontaneous co-fermentation changes the techno-functional properties of the raw materials to which they are applied. Therefore, this research studied the effect of spontaneous fermentation on nutritional and techno-functional properties using sorghum and baobab as ingredients. To achieve this aim, we compared co-ferment-cook and ferment-cook-fortify as processing technologies to analyse physicochemical, functional and anti-nutritional properties, viscosity and starch/protein digestion. These results will provide insights into the impact of fermentation production steps on the nutritional and functional quality of the processed raw materials.
2. Materials and methods
2.1 Sample preparation
Hulled, finely milled sorghum meal and baobab fruit pulp were purchased from a local market in Zimbabwe. The dry baobab pulp powder was removed from the seeds by blending and passed through a sieve (frame diameter 200 mm, mesh size 900 μm) (Retsch, Haan, Germany). Sorghum porridge (SP), fermented sorghum porridge (FSP), baobab pulp-fortified sorghum porridge BFoSP, co-fermented baobab pulp-fortified sorghum porridge (FoCFSP), and baobab pulp-fortified fermented sorghum porridge (FoFSP) were produced as shown in Fig. 1. Specifically, sorghum flour was mixed with tepid water in a 1![[thin space (1/6-em)]](https://www.rsc.org/images/entities/char_2009.gif) :3 ratio (i.e., 67 g and 200 g, respectively) to obtain a slurry that was cooked (continuous agitation, 65 °C, 15 min) as determined from previous studies and described.14 During this process, 100 ml of water was added to obtain a sorghum porridge (SP). For fermentation, the slurry was allowed to spontaneously ferment at 25 °C for 48 h before cooking to produce fermented sorghum porridge (FSP). BFoSP and FoCFSP were first produced as described for SP and FSP, respectively. Thereafter, they were allowed to spontaneously ferment by the endogenous bacteria in the sorghum, baobab and environment. For FoCFSP, sorghum flour was replaced by sorghum and baobab pulp powder mixture (i.e. 56.67 g of sorghum + 10.0 g of baobab pulp). For BFoFSP, baobab pulp powder (10.0 g) was added to FSP cooled to 50 °C.
:3 ratio (i.e., 67 g and 200 g, respectively) to obtain a slurry that was cooked (continuous agitation, 65 °C, 15 min) as determined from previous studies and described.14 During this process, 100 ml of water was added to obtain a sorghum porridge (SP). For fermentation, the slurry was allowed to spontaneously ferment at 25 °C for 48 h before cooking to produce fermented sorghum porridge (FSP). BFoSP and FoCFSP were first produced as described for SP and FSP, respectively. Thereafter, they were allowed to spontaneously ferment by the endogenous bacteria in the sorghum, baobab and environment. For FoCFSP, sorghum flour was replaced by sorghum and baobab pulp powder mixture (i.e. 56.67 g of sorghum + 10.0 g of baobab pulp). For BFoFSP, baobab pulp powder (10.0 g) was added to FSP cooled to 50 °C.
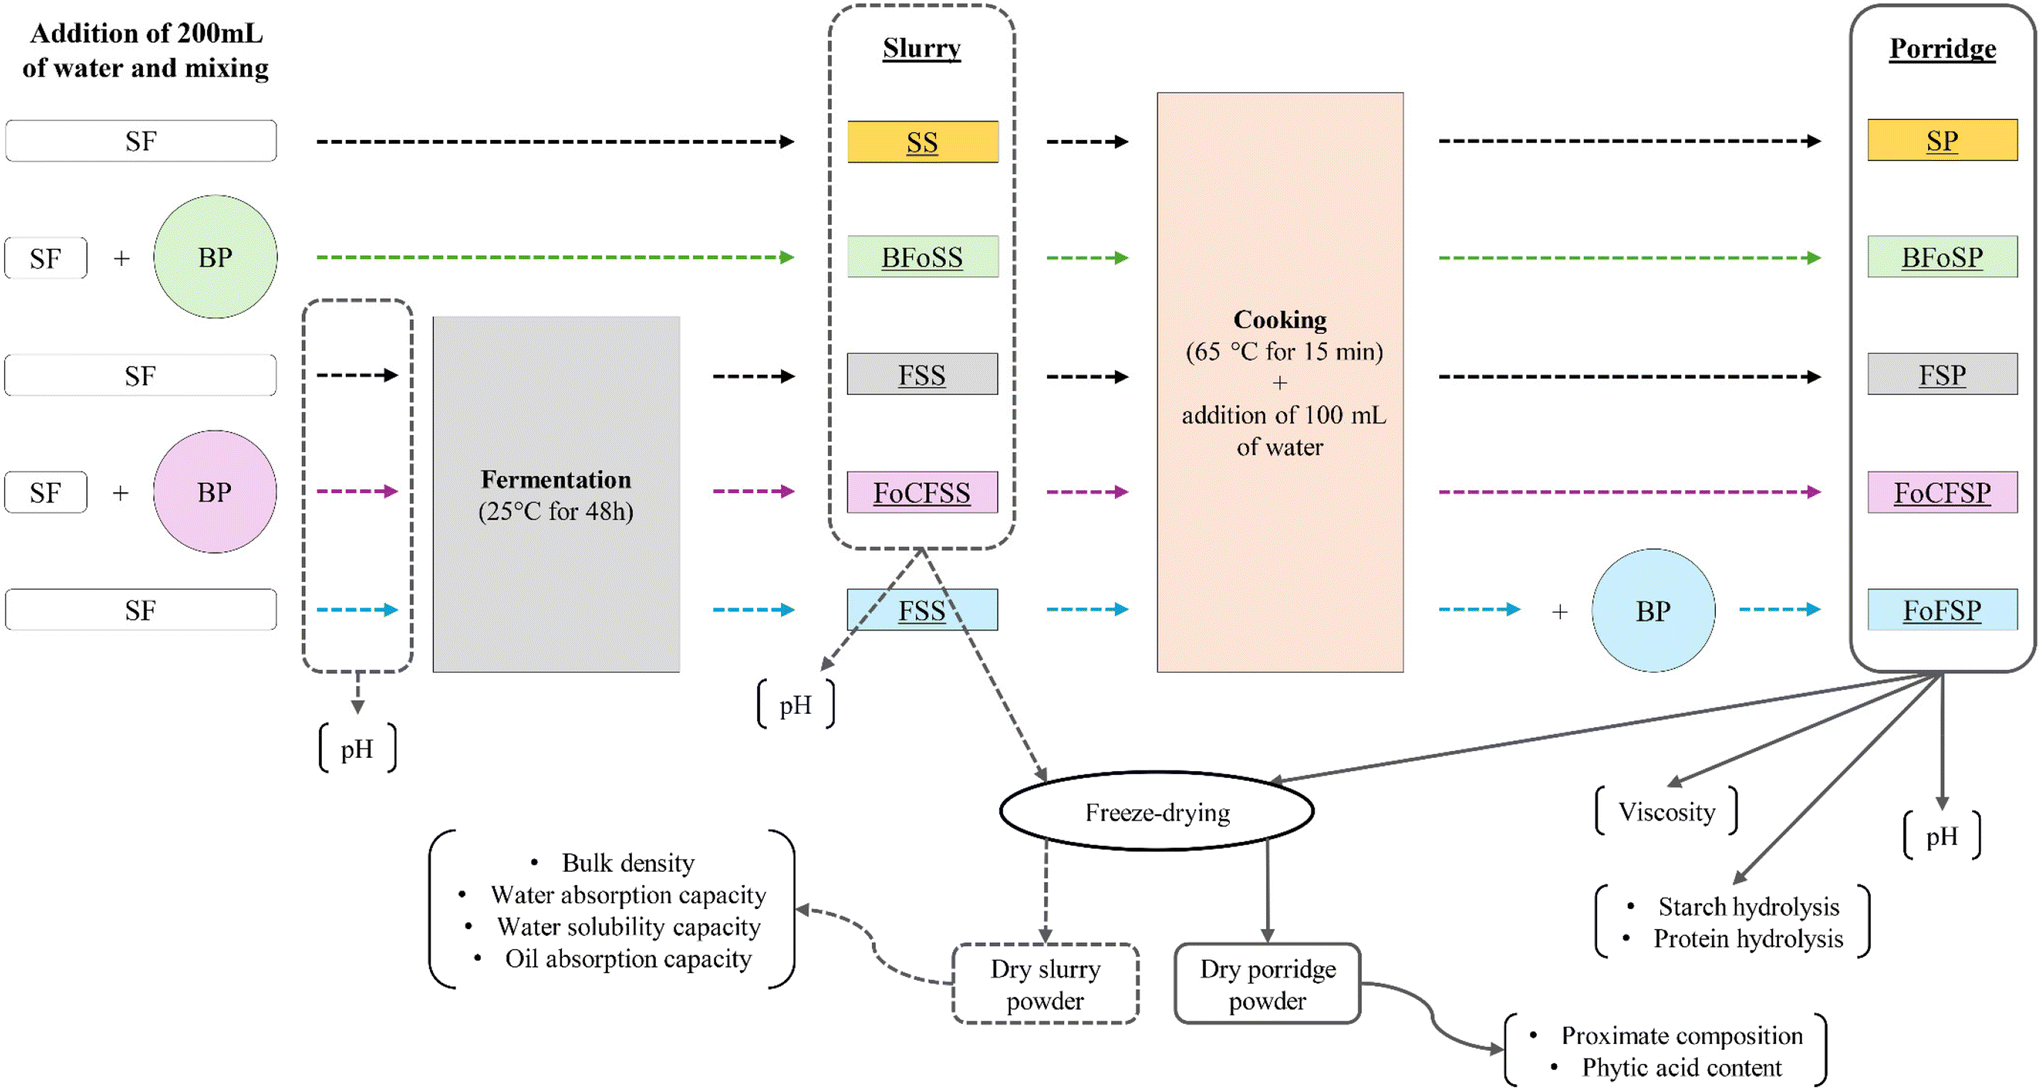 | ||
| Fig. 1 Scheme of the sample preparation and summary of the analyses carried out. SF; sorghum flour; BP: baobab pulp; SS: sorghum slurry; FSS: fermented sorghum slurry; BFoSS: sorghum slurry fortified with baobab pulp; FoCFSS: co-fermented sorghum slurry fortified with baobab pulp; SP: sorghum porridge; FSP: fermented sorghum porridge; BFoSP: sorghum porridge fortified with baobab pulp; FoCFSP: co-fermented sorghum porridge fortified with baobab pulp; FoFSP: sorghum porridge fortified with baobab pulp added after cooking. | ||
Depending on the particular analysis, samples were either freeze-dried with liquid nitrogen to obtain a dry slurry/porridge powder or used as wet slurry.
2.2 Characterization of sorghum samples
2.3 Biochemical analysis

2.4 Viscosity
The viscosity of the porridges was measured using a GmbH viscometer (Anton Paar, GmbH, Austria) equipped with a 50 mm measuring plate and a 1 × 0.5, Groove probe (A-8054 Graz, Anton Paar, GmbH, Austria), subjecting the sample to increasing shear rates. The test, shear rate range, plate and probe settings were chosen following the method of Makame et al.12 Porridge viscosity at a 50 s−1 shear rate was taken to represent in-mouth handling of the bolus by infants,23 and as porridge texture suitable for infant dysphagia management.242.5 Simulated in vitro gastrointestinal digestion
In vitro digestion was carried out on 5 g of freshly produced porridge. Simulated gastric fluid (SGF) and simulated intestinal fluid (SIF) were used for in vitro digestion according to Minekus et al.25 Aliquots were taken at different gastric and intestinal digestion times, i.e., SGP at 0 and 2 h, and SIP at 15, 30, 60 and 120 min. Enzyme inactivation was performed by adding absolute ethanol for starch digestion, then resting for 30 min at room temperature before centrifugation at 10000g for 10 min. Enzyme inactivation for protein digestion was performed by adding 25 μL pefabloc© (0.1 M). Samples were left for 30 min at room temperature after which 0.83 mL 5% TCA was added, followed by centrifugation at 10000g for 10 min. Supernatants were collected and stored at −20° C for further analysis. As a blank, 5 ml MilliQ water was digested.
2.6 Statistical analysis
One-way analysis of variance (ANOVA) and post-hoc Tukey's (HSD) test were performed using Excel Stat software for comparing the mean differences of samples at a significance level of p < 0.05.3. Results and discussion
3.1 Effect of co-fermentation on functional properties
| Sample | WAC (g g−1) | WSI (g g−1) | OAC (g g−1) | Bulk density (g ml−1) |
|---|---|---|---|---|
| Different superscripts in the same column denote a statistically significant difference (P < 0.05). WAC: water absorption capacity; WSI: water solubility index; OAC: oil absorption capacity; BD: bulk density. SS: sorghum slurry; FSS: fermented sorghum slurry; BFoSS: sorghum slurry fortified with baobab pulp; FoCFSS: co-fermented sorghum slurry fortified with baobab pulp. | ||||
| BP | 4.41 ± 0.27b | 16.26 ± 1.32a | 1.99 ± 0.09a | 0.47 ± 0.03c |
| SS | 5.51 ± 0.26a | 4.44 ± 0.59c | 1.01 ± 0.05b | 0.79 ± 0.02ab |
| FSS | 4.45 ± 0.16b | 3.14 ± 0.17c | 0.91 ± 0.12bc | 0.80 ± 0.03ab |
| BFoSS | 4.37 ± 0.28b | 9.21 ± 0.75b | 0.85 ± 0.06c | 0.72 ± 0.07b |
| FoCFSS | 4.57 ± 0.09b | 9.46 ± 1.16b | 0.84 ± 0.02c | 0.84 ± 0.04a |
Results show a decreased OAC when compared to unfermented/unfortified samples. However, there was no significant difference between the FoCFSS, FSS and BFoSS samples (P < 0.05). OAC is the binding of fat by the non-polar side chain of proteins.32 Thus, OAC is high when protein content is high, which agrees with the results for FSS. However, fortification significantly lowered the OAC (Table 1), due to the lower protein content of the fortified samples (Table 2). Since the oil absorption rate is high in matrices with high protein content, the assumption is that the fortified samples have fewer hydrophobic interaction sites than SS. According to another study,33 fermentation causes a slight decrease in OAC. Moreover, Onyeneke34 reported that a higher OAC would be beneficial for flavour retention and mouth feel, both characteristics that are critical for infant feeding. A low OAC could be advantageous for viscosity because unabsorbed oil helps separate the particles, reducing their interaction and allowing them to move more independently, thus reducing friction and resistance within the mixture. However, this depends on several factors, such as the proportion of monomeric or polymeric proteins, type and concentration of oil, amylose/amylopectin ratio, and starch content, which are primary contributors to final viscosity35–37 therefore warranting further investigation for these ingredients.
| Porridge type | Apparent viscosity (Pa s) | pH | ||
|---|---|---|---|---|
| Shear rate (50 s−1) | Shear rate (87 s−1) | Before cooking | After cooking | |
| The viscosity was measured at shear rates (50 s−1 and 87 s−1) that are compatible with infant chewing and swallowing. The optimal viscosity is: 3 Pa s for children under 10 months; 10 Pa s for children over 18 months. pH measurements were carried out before and after cooking to see the influence of cooking on pH. Different superscripts in the same column denote a statistically significant difference (P < 0.05). SP: sorghum porridge; FSP: fermented sorghum porridge; BFoSP: sorghum porridge fortified with baobab pulp; FoCFSP: co-fermented sorghum porridge fortified with baobab pulp; FoFSP: sorghum porridge fortified with baobab pulp added after cooking. | ||||
| SP | 4.06 ± 0.20b | 2.58 ± 0.11c | 6.33 ± 0.03a | 6.23 ± 0.02a |
| FSP | 12.26 ± 2.15a | 7.36 ± 1.20ab | 3.84 ± 0.07b | 3.93 ± 0.09b |
| BFoSP | 4.65 ± 0.41b | 3.07 ± 0.24c | 3.78 ± 0.02bc | 3.92 ± 0.03b |
| FoCFSP | 7.81 ± 3.32ab | 4.90 ± 1.98bc | 3.66 ± 0.02d | 3.81 ± 0.08b |
| FoFSP | 12.17 ± 2.23a | 7.75 ± 1.26a | 3.73 ± 0.09cd | 3.43 ± 0.13c |
Regarding bulk density, a significant difference was observed between BFoSS and FoCFSS, where FoCFSS had the highest BD in the order FoCFSS > FSS > SS > BFoSS. The bulk density increased by 15% with co-fermentation. The bulk density of fermented sorghum flour aligned with that found by Ojha et al.9 but is inconsistent with the findings of Ea et al.,43 where BD decreased with sorghum and sorghum blend fermentation. Bulk density (BD), or packing density, represents the weight of powder per unit volume.39 Thus, a higher BD translates to more flour at a constant volume,44 which limits nutrient and calorie intake. A relatively lower bulk density is beneficial for infant feeding preparations31 since it helps to reduce porridge thickness and viscosity, which is important for swallowing.
Porridge viscosities at a consumption temperature of 40 °C at shear rates compatible with chewing and swallowing23 are reported in Table 2. The results show no significant difference between the viscosities of BFoSP and FoCFSP. The lower viscosity is related to the reduced WAC (Table 1) and low pH after cooking. The gelatinization of the starch molecules depends on several factors, such as pH and salt, sugar, and protein concentrations. Sugars compete with starch for water, while hydrophobic fats and protein coat starch, decreasing water absorption and resulting in less granular swelling and reduced paste viscosity.32 The acidic nature of baobab, in combination with heat, may have caused starch hydrolysis, resulting in the gelatinized starch paste being thinner for BFoSP and FoCFSP. Thus, the acid effect is minimized by rapid heating or adding baobab after heat treatment, as indicated by the high viscosity of FoFSP.
The viscosity of SP and BFoSP was found to be suitable for 6–11-month-old infants, while fermented porridges had viscosities that were slightly above the suggested limit.46 There is currently no consensus on which range of shear rates constitutes the most representative conditions concerning chewing and swallowing processes, although a shear rate value of 50–90 s−1 is considered a reasonable order of magnitude for in-mouth handling of the bolus,23 suitable also for dysphagic infants.24 However, the increase in shear rate caused a rapid decrease in apparent viscosity for all samples as observed in the study of Zhang et al.47 for the curdlan and myofibrillar blends. As reported by Trèche,48 1 and 3 Pa s correspond approximately to the limits for drinkable (<1 Pa s), spoonable (>1 Pa s and <3 Pa s), and thick (>3 Pa s) gruel, with the indication that food suitable for children aged 6–11 months (in most contexts, particularly in Africa) should have a viscosity below 4.5 Pa s.
3.2 Effect of co-fermentation on the content of phytic acid
No significant difference was found in phytic acid contents in SP and BFoSP (Fig. 2). However, a significantly lower phytic acid content was observed for FoFSP (i.e., ferment-cook-fortify), which confirms that adding baobab pulp after fermentation and cooking causes a significant phytic acid reduction (P < 0.05). Fermentation decreases the phytic acid content of sorghum porridge (FSP < SP) and baobab-fortified sorghum porridge (FoCFSP < BFoSP), as previously reported.29,49 The reduction in phytic acid was probably because of the increased microbial phytate activity in fermented products or by interactions between phytic acid and other components, such as fibre, thus leading to reduced recovery.50 Additionally, baobab reportedly has high content of, namely ascorbic acid and citric acid.51,52 Acidic conditions (pH 2.5–4.5) trigger the endogenous phytase enzyme.53,54 Furthermore, soaking increases water activity in the matrix during spontaneous fermentation, which activates phytase. As reported by Vidal-Valverde et al.,55 a 37% reduction in phytic acid was observed in lentils soaked in acidic conditions. Phytic acid creates insoluble complexes with essential micronutrients such as Fe, Mn, Ca, and Zn, making them unavailable for absorption into the bloodstream. Phytase hydrolyses the hexa form of phytic acid into phosphate esters (IP5-IP), inferior forms of phytic acid with a lower affinity for metal ions like Fe and Zn.56 Reducing phytic acid is necessary for low-protein foods, especially for children who suffer from health problems such as stunting and cannot get the complete intake of micronutrients from other sources. Further studies are required to assess the mineral absorption from the products of these treatments. | ||
| Fig. 2 Phytic acid contents of blended porridges. Different superscripts denote a statistically significant difference (P < 0.05). SP: sorghum porridge; FSP: fermented sorghum porridge; BFoSP: sorghum porridge fortified with baobab pulp; FoCFSP: co-fermented sorghum porridge fortified with baobab pulp; FoFSP: sorghum porridge fortified with baobab pulp added after cooking. | ||
3.3 Biochemical properties of co-fermented and fortified sorghum porridges
Table 3 shows the proximate composition and estimated energy intakes for infants (6–8, 9–11 and 12–24 months old) of the co-fermented and fortified porridges.| Porridge type | Moisture (g per 100 g) | Fibre (g per 100 g) | Ash (g per 100 g) | Protein (g per 100 g) | Fat (g per 100 g) | Carbohydrate (g per 100 g) | Energy (kJ per 100 g) | Energy intake (kJ day−1) | ||
|---|---|---|---|---|---|---|---|---|---|---|
| 6–8 months | 9–11 months | 12–24 months | ||||||||
| Different superscripts in the same column denote a statistically significant difference (P < 0.05). SP: sorghum porridge; FSP: fermented sorghum porridge; BFoSP: sorghum porridge fortified with baobab pulp; FoCFSP: co-fermented sorghum porridge fortified with baobab pulp; FoFSP: sorghum porridge fortified with baobab pulp added after cooking. BME: breast milk energy, RDI: recommended daily intake. Estimated energy intakes were calculated using 16.67 g of solid contents per 100 g of porridge at 3 meals per day for functional gastric capacities of 249 g, 285 g and 345 g per meal for 6–8, 9–11 and 12–24 month old children respectively.65 | ||||||||||
| SP | 9.43 ± 1.06a | 14.98 ± 3.76a | 1.50 ± 0.07b | 10.55 ± 0.45ab | 0.52 ± 0.10b | 78.52 ± 1.26b | 1508.81 ± 21.42c | 1878.84 | 2150.48 | 2603.22 |
| FSP | 6.84 ± 1.52b | 15.18 ± 11.41a | 1.62 ± 0.18b | 11.13 ± 0.71a | 2.25 ± 0.08a | 80.40 ± 1.70b | 1614.94 ± 29.27b | 2011.00 | 2301.75 | 2786.33 |
| BFoSP | 3.34 ± 0.17c | 19.36 ± 1.23a | 2.20 ± 0.11a | 9.45 ± 0.92b | 2.44 ± 0.99a | 85.01 ± 0.90a | 1671.16 ± 38.74a | 2081.01 | 2381.88 | 2883.33 |
| FoCFSP | 3.58 ± 0.26c | 33.28 ± 10.94a | 2.14 ± 0.18a | 9.42 ± 0.97b | 1.83 ± 0.41a | 84.86 ± 0.84a | 1645.30 ± 11.68ab | 2048.81 | 2345.02 | 2838.71 |
| FoFSP | 3.44 ± 0.19c | 20.95 ± 2.77a | 2.06 ± 0.27a | 9.48 ± 0.58b | 1.66 ± 0.07a | 85.02 ± 0.64a | 1642.40 ± 2.89ab | 2045.20 | 2340.89 | 2833.71 |
| RDI Low BME | 2310 | 2933 | 4301 | |||||||
| RDI Average BME | 1490 | 2004 | 3230 | |||||||
Fermentation also did not influence fibre content, although fermenting microorganisms, which completely or partially can hydrolyse fibre by enzymatic degradation, can decrease the fibre content. The addition of baobab pulp was expected to result in a higher fibre content because the fibre content of baobab pulp is approximately 70–80% of its dry mass59 whereas that of sorghum is 19%.60
3.4 Digestibility
 | ||
| Fig. 3 Starch (A) and protein (B) hydrolysis as a function of time during gastric and intestinal in vitro digestion phase for protein and intestinal phase only for starch. Values are mean ± SD of four independent samples. SP: sorghum porridge; FSP: fermented sorghum porridge; BFoSP: sorghum porridge fortified with baobab pulp; FoCFSP: co-fermented sorghum porridge fortified with baobab pulp; FoFSP: sorghum porridge fortified with baobab pulp added after cooking. | ||
4. Conclusion
Fermentation and fortification significantly improve the nutritional and functional qualities of infant complementary foods when using sorghum–baobab blends. More specifically, the co-fermentation of sorghum and baobab improves the functional properties of the porridge despite the absence of significant changes from a biochemical point of view. Furthermore, co-fermentation represents a fortification strategy that guarantees a product with higher digestibility of starch and proteins. Both co-ferment-cook and ferment-cook-fortify have improved the energy density, making them beneficial for complementary foods for infants 6–24 months old. Nutritionally, ferment-cook-fortify provided better results than co-fermentation. The findings cement the applicability of these food processing methods and the blending of sorghum with baobab in infant complementary food production, depending on the specific general outcome purpose and age group. Therefore, when optimally processed and composited with other ingredients, sorghum can result in a nutrient-dense complementary food with the potential to counteract the problem of malnutrition. These findings contribute to ascertaining the role of processing practices and bring new information about their impact on the nutritional and functional quality of the end product. Recent economic, productive and social trends have led to the rediscovery of the potential of spontaneous fermentation in improving the unique quality of fermented products. The exploitation of indigenous bacteria and yeasts as a commercial option presents a strategy to restore traditional artisanal practices that have the potential for scaling up. Modern microbial biotechnologies should be sought to reconcile fermented food safety with instances of an enhanced contribution of microbes associated with spontaneous fermentation. In parallel, further studies on food processing and technology are needed to ensure adequate consistency, as infants reject food textures that cannot be swallowed and exacerbate malnutrition.Author contributions
Luigi Moriconi: formal analysis, investigation, data curation, and writing – review and editing. Elena Vittadini: funding acquisition, supervision, and writing – review and editing. Anita R. Linnemann: conceptualization, supervision, visualization, and writing – review and editing. Vincenzo Fogliano: funding acquisition, resources, supervision, and writing – review and editing. Ruth T. Ngadze: project administration, conceptualization, methodology, supervision, visualization, and writing – original draft, review and editing.Data availability
The data supporting this article have been included as part of the ESI.†Conflicts of interest
The authors declare that they have no known competing financial interests or personal relationships that could have appeared to influence the work reported in this paper.Acknowledgements
The authors would like to thank Silvana van de Stappen for her help with the experiments.References
- FAO, IFAD, UNICEF, WFP and WHO, in Brief to The State of Food Security and Nutrition in the World 2021, FAO, 2020 Search PubMed.
- B. J. Akombi, K. E. Agho, D. Merom, A. M. Renzaho and J. J. Hall, PLoS One, 2017, 12, e0177338 CrossRef PubMed.
- R. P. Singh, S. Qidwai, O. Singh, B. R. Reddy, S. Saharan, S. K. Kataria, H. Tiwari, R. K. Naresh and L. Kumar, Int. J. Plant Soil Sci., 2022, 939–953 Search PubMed.
- M. A. Abeshu, A. Lelisa and B. Geleta, Complementary Feeding: Review of Recommendations, Feeding Practices, and Adequacy of Homemade Complementary Food Preparations in Developing Countries – Lessons from Ethiopia, Front. Nutr., 2016, 3, 1–9 Search PubMed.
- C. Schwartz, P. A. Scholtens, A. Lalanne, H. Weenen and S. Nicklaus, Appetite, 2011, 57, 796–807 CrossRef.
- N. Chhikara, B. Abdulahi, C. Munezero, R. Kaur, G. Singh and A. Panghal, Exploring the nutritional and phytochemical potential of sorghum in food processing for food security, Nutr. Food Sci., 2018, 49(2), 318–332 CrossRef.
- N. J. de Mesa-Stonestreet, S. Alavi and S. R. Bean, J. Food Sci., 2010, 75(5), 90–104 CrossRef PubMed.
- J. Hansen, D. Knabe and K. Burgoon, J. Anim. Sci., 1993, 71, 452–458 CrossRef CAS.
- P. Ojha, R. Adhikari, R. Karki, A. Mishra, U. Subedi and T. B. Karki, Food Sci. Nutr., 2018, 6, 47–53 CrossRef CAS.
- F. Grases, R. M. Prieto and A. Costa-Bauza, in Clinical Aspects of Natural and Added Phosphorus in Foods, ed. O. M. Gutiérrez, K. Kalantar-Zadeh and R. Mehrotra, Springer, New York, NY, 2017, pp. 175–183 Search PubMed.
- A. K. Kies, L. H. De Jonge, P. A. Kemme and A. W. Jongbloed, J. Agric. Food Chem., 2006, 54, 1753–1758 CrossRef CAS.
- J. Makame, H. De Kock and N. M. Emmambux, LWT, 2020, 133, 109978 CrossRef CAS.
- E. J. Smid and M. Kleerebezem, Annu. Rev. Food Sci. Technol., 2014, 5, 313–326 CrossRef CAS PubMed.
- L. Moriconi, E. Vittadini, A. R. Linnemann, V. Fogliano and R. T. Ngadze, Food Funct., 2023, 14, 9194–9203 RSC.
- E. Nago, J. O. Agossadou, F. J. Chadare, S. Houndji and D. J. Hounhouigan, Afr. J. Food, Agric., Nutr. Dev., 2020, 20, 16622–16637 CAS.
- R. T. Ngadze, A. R. Linnemann, V. Fogliano and R. Verkerk, Food Res. Int., 2019, 116, 870–877 CrossRef CAS PubMed.
- M. Affonfere, Y. E. Madode, F. J. Chadare, P. Azokpota and D. J. Hounhouigan, Sci. Afr., 2021, 9(7), 3824–3835 CAS.
- K. Simonyan, A. El-Okene and Y. Yiljep, Agric Eng Int., 2007, IX, 1–15 Search PubMed.
- M. Kaur and N. Singh, Food Chem., 2005, 91, 403–411 CrossRef CAS.
- K. Kaur and N. Singh, Food Chem., 2000, 71, 511–517 CrossRef CAS.
- Official Methods of Analysis of AOAC International, AOAC 51 International, Gaithersburg, MD, USA, 19 edn, 2012.
- R. Bazaz, W. N. Baba and F. A. Masoodi, Cogent Food Agric., 2016, 2, 1154714 Search PubMed.
- S. Popa Nita, M. Murith, H. Chisholm and J. Engmann, Dysphagia, 2013, 28, 245–252 CrossRef CAS PubMed.
- J. Frazier, A. H. Chestnut, A. Jackson, C. E. A. Barbon, C. M. Steele and L. Pickler, Dysphagia, 2016, 31, 672–679 CrossRef.
- M. Minekus, M. Alminger, P. Alvito, S. Ballance, T. Bohn, C. Bourlieu, F. Carrière, R. Boutrou, M. Corredig and D. Dupont, Food Funct., 2014, 5, 1113–1124 RSC.
- K. F. Miraji, A. R. Linnemann, V. Fogliano, H. S. Laswai and E. Capuano, Food Funct., 2020, 11, 7611–7625 RSC.
- M. Zahir, V. Fogliano and E. Capuano, Food Funct., 2018, 9, 6326–6336 RSC.
- S. Alka, Y. Neelam and S. Shruti, Int. J. Agric. Food Sci., 2012, 2, 66–70 Search PubMed.
- A. B. Makawi, A. I. Mustafa, O. Q. Adiamo and I. A. Mohamed Ahmed, Food Sci. Nutr., 2019, 7(2), 689–699 CrossRef CAS.
- J. O. G. Elechı, A. C. Smah, J. I. Sule, N. Rimamcwe, A. Eunice, S. Eno-obong, E. O. Faith, E. Onyekajah, I. Nwiyi, E. Oboh and A. J. Adeleke, Eur. Food. Sci. Eng., 2023, 4, 61–74 CrossRef.
- R. Parvin, M. A. Satter, S. A. Jabin, N. Abedin, F. Islam, M. Kamruzzaman and D. K. Paul, Int. J. Innovation Appl. Stud., 2014, 9, 974 Search PubMed.
- C. G. Awuchi, V. S. Igwe and C. K. Echeta, Int. J. Adv. Acad. Res., 2019, 5, 139–160 Search PubMed.
- A. E. O. Elkhalifa, B. Schiffler and R. Bernhardt, Food Chem., 2005, 92, 1–5 CrossRef CAS.
- E.-B. Onyeneke, J. Agric. Food Sci., 2019, 17, 1–17 Search PubMed.
- A. Adebowale, L. O. Sanni and S. Awonorin, Food Sci. Technol. Int., 2005, 11, 373–382 CrossRef CAS.
- N. Singh, A. Kaur, M. Katyal, S. Bhinder, A. K. Ahlawat and A. M. Singh, Food Chem., 2016, 197, 316–324 CrossRef CAS PubMed.
- A. Devi, R. Sindhu and B. S. Khatkar, J. Food Sci. Technol., 2020, 57, 3836–3842 CrossRef CAS.
- N. Yousf, F. Nazir, R. Salim, H. Ahsan and A. Sirwal, J. Pharmacogn. Phytochem., 2017, 6, 2165–2168 CAS.
- H. Ding, B. Li, I. Boiarkina, D. I. Wilson, W. Yu and B. R. Young, Foods, 2020, 9, 1024 CrossRef PubMed.
- A. W. Mwangi, C. N. Kunyanga and C. M. Onyango, CyTA-J. Food, 2023, 21, 198–208 CrossRef CAS.
- A. Mpofu, A. R. Linnemann, M. J. R. Nout, M. H. Zwietering and E. J. Smid, Ecol. Food Nutr., 2014, 53, 24–41 CrossRef.
- J. Saka, I. Rapp, F. Akinnifesi, V. Ndolo and J. Mhango, Int. J. Food Sci. Technol., 2007, 42, 836–841 CrossRef CAS.
- E.A Msheliza, J.B Hussein, J. Ilesanmi and I. Nkama, J. Nutr. Food Sci., 2018, 8(2), 1–7 Search PubMed.
- A. Makawi, A. Mustafa, O. Adiamo and I. M. Ahmed, Int. Food Res. J., 2019, 26, 1707–1715 CAS.
- Z. Zhang, M. Lahti, F. P. Douillard, H. Korkeala and M. Lindström, Sci. Rep., 2020, 10, 21571 CrossRef CAS.
- S. Treche, Int. J. Food Sci. Nutr., 1999, 50, 117–125 CrossRef CAS.
- C. Zhang, L. Chen and H. Teng, Food Chem., 2024, 437, 137839 CrossRef CAS PubMed.
- S. Trèche and C. Mouquet-Rivier, Int. J. Food Sci. Nutr., 2001, 52(5), 389–400 CrossRef.
- A. O. Makokha, R. K. Oniang'o, S. M. Njoroge and O. K. Kamar, Food Nutr. Bull., 2002, 23, 241–245 CrossRef.
- H. W. Lopez, F. Leenhardt, C. Coudray and C. Remesy, Int. J. Food Sci. Technol., 2002, 37, 727–739 CrossRef CAS.
- F. J. Chadare, A. R. Linnemann, J. D. Hounhouigan, M. J. R. Nout and M. A. J. S. Van Boekel, Crit. Rev. Food Sci. Nutr., 2008, 49, 254–274 CrossRef.
- D. T. Tembo, M. J. Holmes and L. J. Marshall, J. Food Compos. Anal., 2017, 58, 40–51 CrossRef CAS.
- A. Diouf, F. Sarr, C. Ndiaye, N. Ayessou and S. Fall, Int. J. Food Sci. Nutr. Eng., 2020, 10, 37–41 Search PubMed.
- L. A. Perlas and R. S. Gibson, J. Sci. Food Agric., 2002, 82, 1115–1121 CrossRef CAS.
- C. Vidal-Valverde, J. Frias, I. Estrella, M. J. Gorospe, R. Ruiz and J. Bacon, J. Agric. Food Chem., 1994, 42, 2291–2295 CrossRef CAS.
- S. Sarkhel and A. Roy, J. Food Process Eng., 2022, 45, e14030 CrossRef CAS.
- B. Stadlmayr, J. Wanangwe, C. G. Waruhiu, R. Jamnadass and K. Kehlenbeck, J. Food Compos. Anal., 2020, 94, 103617 CrossRef CAS.
- F. Adzqia, S. Suwonsichon and M. Thongngam, Foods, 2023, 12, 4113 CrossRef CAS.
- M. F. Chiacchio, S. Tagliamonte, A. Visconti, R. Ferracane, A. Mustafa and P. Vitaglione, Molecules, 2022, 27, 5563 CrossRef CAS PubMed.
- R. Tanwar, A. Panghal, G. Chaudhary, A. Kumari and N. Chhikara, Food Chem. Adv., 2023, 3, 100501 CrossRef.
- S. Monteiro, F. H. Reboredo, M. M. Lageiro, V. M. Lourenço, J. Dias, F. Lidon, M. Abreu, A. P. L. Martins and N. Alvarenga, Plants, 2022, 11, 2272 CrossRef CAS PubMed.
- O. Y. Adetola, J. Kruger, Z. White and J. R. N. Taylor, LWT, 2019, 106, 92–97 CrossRef CAS.
- T. D. Cirkovic Velickovic and D. J. Stanic-Vucinic, Compr. Rev. Food Sci. Food Saf., 2018, 17(1), 82–103 CrossRef CAS PubMed.
- A. Adelekan and A. Saleh, Niger. J. Microbiol., 2020, 34, 4998–5006 Search PubMed.
- K. G. Dewey and K. H. Brown, Food Nutr. Bull., 2003, 24, 5–28 CrossRef PubMed.
- National Research Council, Lost crops of Africa: volume I: grains, National Academies Press, 1996 Search PubMed.
- S. Dhital, R. R. Bhattarai, J. Gorham and M. J. Gidley, Food Funct., 2016, 7, 1367–1379 RSC.
- M. H. Dicko, M. Searle-van Leeuwen, G. Beldman, O. Ouedraogo, R. Hilhorst and A. Traore, Appl. Microbiol. Biotechnol., 1999, 52, 802–805 CrossRef CAS.
- G. Zhang and B. R. Hamaker, Cereal Chem., 1998, 75, 710–713 CrossRef CAS.
- A. M. Rovalino-Córdova, V. Fogliano and E. Capuano, Food Chem., 2019, 286, 557–566 CrossRef PubMed.
- B. B. Ismail, Y. Pu, M. Guo, X. Ma and D. Liu, Food Chem., 2019, 277, 279–288 CrossRef CAS PubMed.
- M. H. Dicko, H. Gruppen, A. S. Traoré, A. G. J. Voragen and W. J. H. Van Berkel, Afr. J. Biotechnol., 2006, 5, 384–395 CAS.
- S. Zhang and J. Lv, J. Food Sci. Technol., 2014, 51, 1185–1190 CrossRef CAS.
- M. L. Silva, K. Rita, M. A. Bernardo, M. F. de Mesquita, A. M. Pintão and M. Moncada, Nutrients, 2023, 15, 2170 CrossRef CAS.
- N. Wang, D. W. Hatcher, R. T. Tyler, R. Toews and E. J. Gawalko, Food Res. Int., 2010, 43, 589–594 CrossRef CAS.
| This journal is © The Royal Society of Chemistry 2024 |