
 Open Access Article
 This Open Access Article is licensed under a Creative Commons Attribution-Non Commercial 3.0 Unported Licence
Black bean (Phaseolus vulgaris L. cv. “Tolosa”) polyphenolic composition through cooking and in vitro digestion†
Marianela Desireé
Rodríguez
ab,
María Luisa
Ruiz del Castillo
a,
Gracia Patricia
Blanch
 *a and
Sonia
de Pascual-Teresa
*a
*a and
Sonia
de Pascual-Teresa
*a
aInstitute of Food Science, Technology and Nutrition (ICTAN), Spanish Research Council (CSIC), Jose Antonio Novais 6, 28040 Madrid, Spain. E-mail: s.depascualteresa@csic.es; gpblanch@ictan.csic.es
bFacultad de Ciencias Agropecuarias, Universidad Nacional de Córdoba, Córdoba 5001, Argentina
First published on 29th May 2024
Abstract
In this study, five different black bean (Phaseolus vulgaris L. cv. Tolosa) populations cultivated in different geographical areas including Oiartzun, Andoain, Azkoitia, San Esteban and Amasa Villabona, were studied and their polyphenolic content was determined. Two food products were prepared from the five different bean populations, cooked “Tolosa” beans and a hummus made with “Tolosa” cooked beans. Moreover, the variations of total polyphenol content (TPC), total anthocyanin content (TAC) and free radical scavenging activity by the 1,1-diphenyl-1-picrylhydrazyl (DPPH) method were analyzed for raw beans, cooked beans, and “Tolosa” beans hummus. Polyphenolic detailed composition was determined by means of HPLC-MS-QTOF analysis. The “Tolosa” bean population richest in polyphenols was selected in order to study the effect of in vitro digestion on the polyphenolic content and antioxidant effect and the degradation of the main anthocyanins was followed during the in vitro digestion. Finally, the effect of the different phases of digestion on the cytotoxicity in Caco-2 cells was determined. The results suggest that cooking “Tolosa” black beans results in an increase in the bioaccessibility of polyphenols and their antioxidant activity, which, additionally has a positive effect on Caco-2 intestinal cell viability.
1. Introduction
Black beans (Phaseolus vulgaris L.) are one of the main sources of dietary protein in many countries. Different black bean varieties are highly consumed in different areas of Africa and America and not as much in Asia, Australia, and Europe. Additionally to their nutritional and gastronomic value, black beans are consumed worldwide because they provide health benefits due to their chemical and functional properties.1–3 Black beans contain a high concentration of nutritional components. They are an important source of polyphenolic compounds showing diverse biological activities. Summing up the results from various studies,4–6 there is an association between the consumption of beans and cardiovascular disease prevention, obesity control and diabetes alleviation. These advantages are attributed mainly to their polyphenolic compounds with antioxidant capacity. A favorable association with bean consumption, shortfall nutrient intakes, weight outcomes, and diet quality has been demonstrated in adults consuming bean as part of their diet compared to those with no bean consumption, including a greater intake of dietary fiber, potassium, and calcium.4 Some authors have evaluated the ability of black beans to attenuate postprandial metabolic oxidative stress, and inflammatory responses and determine relative contribution of dietary fiber and antioxidant capacity of black beans to the decrease of cardiovascular risk.5 Moreover, anthocyanidins, which are found in black beans, have been shown to inhibit α-amylase, maltase, and sucrase activity, which lower postprandial blood glucose.6Polyphenolic compounds are one of the important bioactive components in black beans due to their diverse biological properties as antioxidants, antimicrobial and anti-inflammatory, which are associated with phenolic acids, flavonoids, and proanthocyanidins present in the whole seed.7 The composition of these polyphenols can vary depending on the black bean variety, agricultural practices, and geographical origin. While complex carbohydrates are the main bioactive component in beans, they can interact with other nutrients, including polyphenols, affecting their absorption.
Understanding the bioavailability of these polyphenols is crucial for evaluating their potential health benefits. Digestion plays a significant role in determining how much and how well these compounds are absorbed by the body. The INFOGEST method is a widely accepted standard for in vitro digestion studies, despite limitations in directly translating results to human or animal bioavailability.8,9 Given these considerations, this study utilizes the INFOGEST method to assess the bioaccessibility of polyphenols in cooked black beans and derived food products (cooked beans and hummus).
Some authors have shown the nutritional importance of bean consumption in the Brazilian diet, based on their bioactive constituents (phytosterols, tocopherols, and essential fatty acids), showing that bean oils from different bean varieties when submitted to maceration and boiling, conserve a significant content in all three groups of lipid bioactive.10 Additionally, Hernández-Salazar et al.11 evaluated the polyphenolic content and antioxidant capacity of the indigestible fraction of three pulses, including black beans, showing that some condensed tannins were retained in the indigestible fraction and contributed to the retained antioxidant activity. However, no studies about the polyphenolic profile of different geographic “Tolosa” black beans cultivar have been reported and in no case, the effect of cooking and in vitro digestion has been explored. Some studies have investigated the polyphenolic content of black beans, highlighting their potential health benefits.1,4,7 However, a comprehensive characterization of their polyphenolic profile is essential for a deeper understanding of these benefits. To achieve this, liquid chromatography coupled with mass spectrometry (LC-MS) to identify and quantify the specific polyphenolic compounds present in black beans can be used. LC-MS emerges as a powerful analytical tool for this endeavor, offering significant advantages over traditional methods. Its high sensitivity and selectivity enable the precise identification and quantification of complex mixtures,12 such as those found in natural products like grapes,13 berries or14 purple maize,15 among others.
Therefore, the purpose of this research was twofold, first to characterize the polyphenolic composition of “Tolosa” black beans cultivars of different geographical origins within the “Tolosa” appellation of origin (Oiartzun, Andoain, Azkoitia, San Esteban and Amasa Villabona). Then, to evaluate the changes in the chemical properties, compositional differences in polyphenolic profile, antioxidant power, and their behavior along in vitro digestion for raw “Tolosa” beans, cooked beans, and bean hummus, as processed food.
2. Materials and methods
2.1. Materials
Five samples of the Spanish black Tolosa beans (Phaseolus vulgaris L. cv. “Tolosa”) of different geographical origins in Guipúzcoa (Oiartzun, Andoain, Azkoitia, San Esteban and Amasa Villabona) were studied (ESI Fig. 1†). All of the samples were kindly supplied by Tolosako Babarruna Elkartea (Gipúzcoa). A portion of the seeds was pulverized in the laboratory using a grinder. Subsequently, the grounded samples and the seeds were promptly stored at −20 °C until analysis or further food processing.2.2. Elaboration of products
2.3. Polyphenol extraction
Polyphenols were extracted from raw, cooked beans and bean hummus samples. A portion of 3.0 g of each sample was used for each experiment. Extractions were carried out by adding 30 mL of MeOH![[thin space (1/6-em)]](https://www.rsc.org/images/entities/char_2009.gif) :H2O (70:30, v:v) H2O acidified with HCL (1%). The resulting mixture was homogenized for 5 min with the blender and then centrifuged (2500 rpm, 15 °C, 10 min). Subsequently, the extract was dried using a rotary evaporator. The extractions were carried out three times for each food product and each bean variety. All the dry extracts were stored at −20 °C until analysis. The analysis of the extracts was performed as explained below.
:H2O (70:30, v:v) H2O acidified with HCL (1%). The resulting mixture was homogenized for 5 min with the blender and then centrifuged (2500 rpm, 15 °C, 10 min). Subsequently, the extract was dried using a rotary evaporator. The extractions were carried out three times for each food product and each bean variety. All the dry extracts were stored at −20 °C until analysis. The analysis of the extracts was performed as explained below.
For the digestion assay, total polyphenols were extracted from raw beans, cooked black beans and bean hummus samples, the different digestion steps used the method described by Chamorro et al.16 Sample collection was done as follows, 0.50 mL of aliquots taken from each phase were placed in an Eppendorf and suspended in 0.50 mL of methanol (acidified with formic acid. 0.10%).
2.4. Determination of the total polyphenol content (TPC)
For “Tolosa” beans, raw, cooked, and bean hummus the total polyphenol content was measured by using a Beckman Coulter DU-800 spectrophotometer (Barcelona, Spain). Briefly, a 0.50 mL of Folin–Ciocalteu reagent and 10 mL of a sodium carbonate solution (75 g L−1) was added to a 0.10 mL volume of the extract (20 mg mL−1). The final mixture was filled up to 25 mL with distilled water. After 1 h, the absorbance was measured at 750 nm against a blank. The blank consisted of the same mixture without the sample. The results were expressed as milligrams of gallic acid equivalents (GAE) per g of dry weight (DW) sample. All the analyses were carried out in triplicate.For the digestion assay, total polyphenol content (TPC) of raw beans, cooked black beans, bean hummus, and the different digestion steps extracts were carried out by the Folin–Ciocalteu reagent method in 96 well plates according to Silván et al.17
The calibration curve was performed with gallic acid, and the absorbance was recorded at 725 nm in a BioTek Synergy HT multi-mode microplate reader (BioTek Instruments Inc., Winooski, VT, USA). Results were expressed as milligrams of gallic acid equivalents per gram of sample on a dry basis (mg GAE per g DW).
2.5. Determination of the total anthocyanin content (TAC)
TAC was quantified in all samples using the pH differential method reported by Wrolstad et al.18 Samples were diluted with 0.025 M potassium chloride buffer solutions at pH 1.0 and 0.40 M sodium acetate buffer at pH 4.5. Two measurements at 520 and 700 nm were carried out by using a spectrophotometer de (Beckman Coulter DU-800, Barcelona, Spain). Total absorbance (Abst) for each sample was measured by using the equation:| Abst = (Abs520nm − Abs700nm)pH=1 − (Abs520nm − Abs700nm)pH=4.5. |
TAC was calculated by applying the following equality:
| TAC (mg L−1) = (Abs × Mw × DF × 103)/(ε × l) |
900 L cm−1) and l is the cell length. TAC was expressed as milligrams of cyanidin-3-glucoside (Cy3G) equivalents per 100 g DW of sample. Analysis was done in triplicate.
2.6. Determination of the antioxidant activity (AA)
:H2O (70:30) (about 30 g L−1), this solution (20 μL) and ACL reagent were mixed and it was placed into the Photochem device. Results were calculated based on a standard Trolox curve as mg equivalents per g DW sample (mg Trolox eq. per g DW).
For the digestion assay, the free radical scavenging activity was determined by the 96 well plate DPPH* assay.21 All samples were measured in triplicate, using Trolox (Sigma-Aldrich) as standard, results were expressed as μmol of Trolox equivalents per grams of sample in dry basis (μmol of Trolox eq. per g DW).
2.7. Identification of polyphenols and tryptophan using HPLC-QTOF-MS
The identification and quantification of polyphenolic and anthocyanin compounds in raw beans, cooked beans, and bean hummus were conducted through high-performance liquid chromatography coupled with mass spectrometry detection (HPLC-MS) using an Agilent 1200 system (Agilent Technologies). This system comprised of a quaternary pump (G1311A), diode array detector (Agilent G1315B), and a C18 analytical column (Phenomenex Luna, 3 μm, 4.6 mm × 150 mm) maintained at a constant temperature of 25 °C. The mobile phase consisted of water/formic acid (99.9:0.1, v/v, solvent A) and acetonitrile/formic acid (99.9:0.1, v/v, solvent B). The flow rate was maintained at 0.5 mL min−1. The gradient program was as follows: 90% A/10% B for 0–30 min; 70% A/30% B for 30–35 min; 65% A/35% B for 35–45 min; 60% A/40% B for 45–50 min; 90% A/10% B for 50–60 min.23 The injection volume for all samples and standards was 5.0 μL.
Peaks were identified by comparing their retention time with corresponding standards. Mass spectrometric analysis was performed using an Agilent 6530 Accurate-Mass QTOF LC/MS with Electrospray Ionization (ESI) and Jet Stream technology (operated at 325 °C). The capillary voltage and nebulizer gas flow were set to 4000 kV and 45 psi, respectively. Nitrogen served as the drying gas at a flow rate of 8.0 L min−1. Fragmented ions were detected in positive and negative modes for extra certainty in molecular mass determination. Mass (MS) and tandem mass spectrometry fragmentation spectra (MSMS) experiments were conducted and spectral signal data were acquired at 280, 320, and 520 nm.
For MSMS experiments, a collision energy of 20 V was used to target the most abundant ions from a first MS scan. Data acquisition and processing were conducted using Masshunter Data Acquisition (B.05.01) and Masshunter Qualitative Analysis (B.07.00 SP2) software. Compounds were identified by comparing mass spectra and retention time with corresponding standards, if available. For compounds without standards, identification was based on predicting chemical formulas from accurate ion mass measurements, confirmed by comparing MSMS with data from relevant literature references (see Table 1). Quantification involves interpolation into the calibration curve of a standard or structurally related compound used for quantification (equivalent). Results were expressed as μg per g of dry weight for cyanidin-3-O-glucoside (cyanidin derivatives, pelargonidin derivatives, and peonidin-3-glucoside), caffeic acid (cinnamoyl-quinic acids, and citric acid), quercetin (quercetin derivatives and morin), kaempferol (kaempferol derivatives), phloroglucinol (pyrogallol), and tryptophan (tryptophan).
| Beans origin | TPC (mg GAE per g DW) processing | ||
|---|---|---|---|
| Raw | Cooked | Hummus | |
| Different lowercase letters in the same row indicate differences at p < 0.05 between different procedures within the same beans. Different uppercase letters in the same column indicate differences at p < 0.05 between different origins at the same procedure. | |||
| Oiartzun | 2.14 ± 0.22Ab | 1.27 ± 0.05Aa | 1.11 ± 0.12Aa |
| Andoain | 2.85 ± 0.10Ac | 1.65 ± 0.01Bb | 1.09 ± 0.02Aa |
| Azkoitia | 5.15 ± 0.35Cc | 2.12 ± 0.21Cb | 1.29 ± 0.15Ba |
| San Esteban | 4.33 ± 0.21Bc | 1.59 ± 0.10Bb | 1.21 ± 0.17Ba |
| Amasa Villabona | 3.76 ± 0.22Bb | 1.62 ± 0.0.32Ba | 1.56 ± 0.26Ca |
2.8. Quantitative analysis of anthocyanins in the digestion samples
Quantitative analysis of anthocyanins in the samples during, and after digestion was carried out using an Agilent 1200 series liquid chromatograph with a quaternary pump and a photodiode array detector equipped with a Phenomenex Luna C18 column (3 μm; 4.6 mm × 150 mm) set at 25 °C. Aqueous 0.10% formic acid (solvent A) and 0.10% formic acid acetonitrile (solvent B) were used at a flow rate of 0.50 mL min−1. Starting with 90% A/10% B, 0–30 min to 68% A/32% B, 30–35 min to 62% A/38% B, 35–40 min to 53% A/47% B, and followed by an additional 5.0 min isocratically at 47% B and 10 min column stabilization at 10% B previous to the next analysis. Anthocyanins were detected at 520 nm and their peak areas were referred to a calibration curve obtained with cyanidin-3-glucoside. Limits of detection and quantification were calculated in every case below 0.10 μg mL−1.2.9. Static in vitro digestion model
In vitro digestion emulating adult conditions was performed in black bean flour, cooked beans, and bean hummus only for the “Amasa Villabona” Tolosa beans according to INFOGEST protocol. In all three cases, only one of the black beans “Tolosa” geographical samples was selected based on the richness of anthocyanins. Flour beans were used as a control. Oral, gastric, and intestinal phases were included and the enzymes used for each gastrointestinal phase were salivary amylase (75 U per mL of a final mixture, A1031 Sigma), pepsin (2000 U per mL of a final mixture, P7012 Sigma), pancreatin from porcine pancreas (100 U trypsin activity per mL of a final mixture, P7545 Sigma) and porcine bile extract (10 mM, B8631 Sigma). Finally, the digestion was stopped by heating for 15 min at 85 °C. Aliquots of 0.50 mL were removed from oral and gastric phases while the intestinal digest was centrifuged at 5000 rpm for 10 min, and the supernatants were placed in 2.0 mL Eppendorf. All samples were stored at −20 °C until further analysis.2.10. Bioactivity analysis
:10, 1:100, 1:250, and 1:500. All dilutions were suspended in serum-free DMEM.
After 18 hours of exposure, the culture medium was removed, and the cells were sequentially washed with PBS. Subsequently, 200 μl of serum-free DMEM was added to each well, and 20 μL of an MTT solution (5 mg mL−1 in PBS) was introduced. The cells were then incubated for an additional 2 hours at 37 °C in 5% CO2. Formazan crystals that developed in the wells were solubilized in 200 μL of DMSO (dimethyl sulfoxide). Measurement was conducted by recording the absorbance at a wavelength of 570 nm using a microplate reader (PowerWave™ XS) in a UV Spectrophotometer (BioTek Instruments, Inc., Winooski, VT, USA).
The assay was replicated in two independent experiments and viability was calculated relative to control experiments where a solvent control was substituted for polyphenols, serving as a 100% viable reference.23 Dilution was achieved by combining one-part intestinal aliquot with one-part DMEM (sample: DMEM). The control sample comprised an intestinal aliquot of the digestion blank, wherein flour was replaced with water and in vitro digestion was conducted.
2.11. Statistical analysis
Analysis of variance for TPC, TAC, DPPH, and FRAP data, as well as individual polyphenolic content, was conducted using the one-way analysis of variance (ANOVA) method statistical analyses were performed using Statgraphics Centurion XVI® (StatPoint Technologies, Inc., Warrenton, VA, USA). The results are presented as the average of all values obtained, along with the corresponding standard deviation (mg per kg weight ± SD). The statistical analysis included data from raw beans, cooked beans, and bean hummus. Differences were considered significant at p < 0.05.3. Results and discussion
3.1. Effect of cooking and hummus formulation on TPC
Black beans have been shown to possess several bioactive compounds that make them an interesting dietary element in order to reach a balanced and healthy diet. Different authors have shown the presence of fat-soluble bioactives such as γ-tocopherol, stigmasterol, β-sitosterol, and α-linolenic acid in beans.10 The presence of water-soluble bioactives, including anthocyanidins, has also been described in black beans.25In our work, the content of total polyphenolic compounds was in the range between 2.14 and 5.15 mg GAE per g DW for the raw black bean samples (Table 1). Comparison between different geographical provenance beans showed the highest content being that of Azkoitia followed by San Esteban, Amasa Villabona, Andoain and Oiartzun, with significant differences between them (p < 0.05). These variations can only be attributed to agronomic or geographic differences since all of them belong to the “Tolosa” variety and hold the Basque label identity. However, no data on this black bean cultivars TPC has been previously reported. Our results might be considered in line with the ones published for the extracts of various black beans by-product (mostly seed coats) extracts from Mexico (82.33 to 9.93 mg GAE per g extract),26 Mexican black bean seed coat (27.0 to 61.0 mg GAE per g),27 Guajardo-Flores et al. or red kidney beans, pinto beans, black-eyed peas, raw, after soaking and after cooking (between 9.5 and 3.4 GAE per g).28
Moreover, Table 1 shows the total polyphenolic content of cooked beans and the elaborated product. Hummus was elaborated at ICTAN's pilot plant and tasted by a group of consumers only to verify its acceptability. Regarding TPC in cooked beans, a significant decrease was found related to raw values. This decrease was as high as 40%. The content range was between 2.12 and 1.27 mg per g DW for cooked Azkoitia and Oiartzun, respectively. The highest decreases, more than 57%, were found in cooked San Esteban, Amasa Villabona, and Azkoitia geographical precedence in relation to raw beans. This behavior is considered to be due to the polarity of the polyphenolic compounds present, water solubility and temperature factors might contribute to this reduction. Similar results were reported by Almanza-Aguilera et al.29 which analyzed 16 genotypes of black bean and demonstrated a high content of polyphenolic compounds in the raw seed that were invariably reduced after the cooking (50%) and frying (64%) processes, although this decrease was different among genotypes.
Table 2 shows the results of total anthocyanin content expressed as mg of cyanidin-3-O-glucoside per 100 g DW sample in raw beans, cooked beans, and bean hummus elaborated from “Tolosa” black beans of different geographical origins. No significant differences (p < 0.05) were found between the Azkoitia and San Esteban raw beans. Amasa Villabona beans had the higher value followed by Oiartzun (4.66 and 4.14 mg per 100 g DW) and the lowest value was found in San Esteban (1.94 mg per 100 g DW). As expected, a significant reduction in TAC was observed when beans were cooked. No detectable TAC was shown in all the cooked black beans, except for Oiartzun. However, although detectable the decrease between raw and cooked Oiartzun beans TAC represented more than 85% of the initial values. The drop of TAC from raw to cooked Oiartzun beans was from 4.14 to 0.61 mg per 100 g DW. These decreases might be associated with the lack of stability of anthocyanins and anthocyanidins under the thermal conditions used. Moreover, anthocyanins are water-soluble pigments that are susceptible to removal in the water during the overnight maceration and the cooking process. Beans are always ingested after boiling; even if they are eaten fried, they need to be boiled before. Moreover, anthocyanins are very sensitive to heat and can easily convert to the colorless chalcone during heating.18
| Beans origin | TAC (mg Cy3G per 100 g DW) | ||
|---|---|---|---|
| Raw | Cooked | Hummus | |
| Different lowercase letters in the same row indicate differences at p < 0.05 between different procedures within the same beans variety. Different uppercase letters in the same column indicate differences at p < 0.05 between different beans variety within same procedure. | |||
| Oiartzun | 4.14 ± 0.28Ca | 0.61 ± 0.01b | nd |
| Andoain | 2.49 ± 0.06B | nd | nd |
| Azkoitia | 2.04 ± 0.10A | nd | nd |
| San Esteban | 1.94 ± 0.02A | nd | nd |
| Amasa Villabona | 4.66 ± 0.16D | nd | nd |
In the present study, the anti-oxidant activities of samples were measured by the 2,2-diphenyl-1-picrylhydrazyl (DPPH) radical scavenging assay. The calibration curves were established by plotting the percent of inhibition against the concentrations of the extracts with linear regression analysis. All of the black bean extracts demonstrate the dose-dependent scavenging rate of the extracts against DPPH radicals (R2 = 0.999). The regression equations were used for quantifying the IC50 value of the five black bean extracts; the IC50 values were calculated. Table 3 shows the AA results in terms of DPPH* (expressed as IC50, mg mL−1) and PCL (expressed as mg Trolox per L) of raw beans, cooked beans, and bean hummus of the five different originated black beans studied. A significant difference between raw black beans was observed in their IC50 values. As seen in Table 3, three of the studied geographical origins did not show significant differences (i.e., Andoain, San Esteban, and Amasa Villabona). However, Oiartzun and Azkoitia, not only were statistically different from the other three varieties but also were significantly different between them. It is noticeable, the drop in AA, when the beans are either cooked or processed as hummus. i.e. Oiartzun from 4.23 to 47.71 to 64.84 mg mL−1; Andoain from 5.59 to 201.52 to 290.67 mg mL−1; Azkoitia from 7.16 to 259.17 to 321.71 mg mL−1; San Esteban from 5.84 to 289.53 to 271.13 mg mL−1 and Amasa Villabona from 5.51 to 291.19 to 361.52 mg mL−1. Table 3 also shows the results obtained by PCL assay. They are in accordance with the ones obtained by the DPPH assay in the trend. The DPPH assay determines the ability of a compound to act as a free radical scavenger or hydrogen donor and the PCL assay allows the evaluation of the antiradical activity of a compound in the presence of a superoxide anion-radical, which is a human physiological ROS. However, both methods agree on the effect of beans cooking on the decrease of AA values obtained, which in every case follow the same trend as that of TPC and TAC.
| Beans origin | Procedure | |||||
|---|---|---|---|---|---|---|
| Raw | Cooked | Hummus | ||||
| IC50 (mg mL−1) | PCL (mg TE eq. per g DW) | IC50 (mg mL−1) | PCL (mg TE eq. per g DW) | IC50 (mg mL−1) | PCL (mg TE eq. per g DW) | |
| PCL values correspond to Trolox equivalents (TE). Values are expressed as mean ± standard deviation (n = 3). Different lowercase letters in the same row indicate differences at p < 0.05 between different procedure within same geographical bean and same assay. Different uppercase letters in the same column indicate differences at p < 0.05 between different beans from different geographical origins and the same assay. | ||||||
| Oiartzun | 4.23 ± 0.45Aa | 3.73 | 47.71 ± 1.30Ab | 2.47 | 64.84 ± 1.1Ac | 2.04 |
| Andoain | 5.59 ± 0.20Ba | 3.10 | 201.52 ± 2.50Bb | 1.78 | 290.67 ± 5.8Cc | 1.69 |
| Azkoitia | 7.16 ± 0.49Ca | 2.70 | 259.17 ± 1.51Cb | 2.95 | 321.71 ± 6.8Dc | 2.23 |
| San Esteban | 5.84 ± 0.50Ba | 3.16 | 289.53 ± 0.55Dc | 1.54 | 271.13 ± 2.1Bb | 2.06 |
| Amasa Villabona | 5.51 ± 0.30Ba | 2.73 | 291.19 ± 1.91Db | 2.40 | 361.52 ± 5.9Ec | 2.50 |
When looking at the data obtained, a possible association between TPC and TAC values with the AA was evaluated. However, in view of the results, no association between TPC and DPPH could be finally established and a moderate correlation was found between TAC and DPPH (inverse correlation with a R2 = 0.5852). This indicates that anthocyanins might be responsible for the antiradical activity measured in the black bean samples included in this study. This result could be expected considering that anthocyanins are one of the most powerful antioxidants among polyphenolic compounds.
3.2. Characterization of the composition by HPLC-QTOF-MS
A total of thirteen compounds present in the extracts obtained from “Tolosa” raw beans, cooked beans, and bean hummus were identified and quantified. The study of these compounds is crucial due to their specific beneficial biological effects, acting as antioxidants, antimicrobials, anti-inflammatory, and/or vasodilators.7 In the literature, different amounts of total polyphenolic content have been reported in black beans in the range of not detectable to 48710 μg GAE per g DW.30 In this study, using HPLC-MSMS, a total of polyphenolic compounds in ranges of 100.0 to 337.4 μg per g DW was quantified in bean raw flour, 41.5 to 201.5 μg per g DW in cooked beans, and 23.4 to 163.9 μg g−1 in bean hummus (Table 4). Additionally, we identified the presence of an amino acid, tryptophan (Table 4). The polyphenol content in black beans is variable, depending on the cultivar, growth conditions, ripening, methods of analysis, and processing to which they are subjected, such as cooking, grinding, or mixing with other ingredients, among others.27
| Beans origin | Oiartzun | Andoain | Azkoitia | San Esteban | Amasa Villabona | ||||||||||
|---|---|---|---|---|---|---|---|---|---|---|---|---|---|---|---|
| Samples | Raw | Cooked | Hummus | Raw | Cooked | Hummus | Raw | Cooked | Hummus | Raw | Cooked | Hummus | Raw | Cooked | Hummus |
| Compound | (μg per g DW) | (μg per g DW) | (μg per g DW) | (μg per g DW) | (μg per g DW) | ||||||||||
| Cy, cyanidin; Glu, glucoside; Pg, pelargonidin; Delp, delphinidin. nd: compounds not detected. | |||||||||||||||
| Cy-3,5-diGlu | 1.67 | nd | nd | 7.80 | nd | nd | 2.83 | nd | nd | 3.28 | nd | nd | 6.04 | nd | nd |
| Pyrogallol | nd | 83.17 | 91.55 | 27.39 | 7.42 | 32.88 | 6.85 | 200.38 | 74.48 | 30.35 | 41.51 | 23.40 | 99.65 | 61.76 | 162.43 |
| Catechin-3-Glu | 10.30 | nd | nd | nd | nd | nd | nd | nd | nd | nd | nd | nd | nd | nd | nd |
| Delp-3-Glu | 1.19 | nd | nd | 17.14 | nd | nd | 2.76 | nd | nd | 3.03 | nd | nd | 13.93 | nd | nd |
| Pg-3,5-O-diGlu | 0.52 | nd | nd | 4.86 | nd | nd | 0.54 | nd | nd | 1.07 | nd | nd | 4.42 | nd | nd |
| Tryptophan | 5.61 | 0.0130 | 0.0142 | 0.1381 | 0.4422 | nd | 0.04 | 0.0559 | 0.0181 | 0.0257 | nd | nd | 0.0582 | 0.0736 | 0.0725 |
| Cy-3-O-Glu | 23.34 | 0.53 | 0.06 | 83.12 | 93.11 | 0.0239 | 38.33 | 1.11 | 0.07 | 31.77 | nd | 0.0104 | 80.11 | nd | 0.2763 |
| Pg-3-O-Glu | 50.89 | nd | 0.18 | 100.19 | nd | 0.0048 | 44.03 | nd | 0.13 | 43.51 | nd | nd | 111.40 | nd | 1.17 |
| Catechin | 3.80 | nd | nd | 0.11 | nd | nd | nd | nd | nd | 0.21 | nd | nd | 0.76 | nd | nd |
| Cy | nd | nd | nd | 4.13 | nd | nd | 1.46 | nd | nd | 1.80 | nd | nd | 7.37 | nd | nd |
| Pg | nd | nd | nd | 5.24 | nd | nd | 2.08 | nd | nd | 2.86 | nd | nd | 12.36 | nd | nd |
| Quercetin-3-O-Glu | 1.83 | nd | nd | 0.11 | 0.81 | nd | nd | nd | nd | nd | nd | nd | nd | nd | nd |
| Quercetin | 0.85 | nd | nd | 1.77 | 11.62 | nd | 1.81 | nd | nd | 1.35 | nd | nd | 1.35 | nd | nd |
| Total | 100.0 | 83.7 | 91.8 | 252.0 | 113.4 | 32.9 | 100.7 | 201.5 | 74.7 | 119.3 | 41.5 | 23.4 | 337.4 | 61.8 | 163.9 |
The quantification of all compounds was carried out by HPLC-MS/MS using available standards and based on bibliographic references.25 Therefore, the quantification of the total polyphenol content at this point was based on various standards and not just on a single one (gallic acid in general) as it is done in the spectrophotometric method (Folin–Ciocalteu). The spectrophotometric method is nonspecific and tends to overestimate the polyphenol content compared to the chromatographic method, mainly because some non-polyphenolic compounds present in the extracts interfere with the spectrophotometric analysis. However, it is important to study both methods, since there are compounds present in the chromatographic method that have not yet been identified, making their quantification difficult. The polyphenolic compounds quantified in all bean samples are summarized in Table 4.
Among the polyphenolic compounds identified in our study, there are anthocyanins, responsible for the deep purple-black colour of “Tolosa” beans and recognized for their health benefits. The anthocyanidin (aglycons) present in beans were cyanidin and pelargonidin, which are substituted with sugars and organic acids to generate anthocyanins. The raw flour exhibited the highest concentration of anthocyanins, whereas the cooked samples and bean hummus showed important reductions in these compounds. These results highlight the impact of cooking and processing on this group of compounds.
“Tolosa” raw bean flour exhibited a peculiar anthocyanin profile, with the presence of cyanidin-3,5-diglucoside, delphinidin-3-glucoside, pelargonidin-3,5-diglucoside, cyanidin-3-O-glucoside, pelargonidin-3-O-glucoside, cyanidin, and pelargonidin. While the anthocyanin profile remained consistent regardless of the geographical origin of the beans, there was significant variation in the concentration of each compound. Furthermore, differences were observed in the profile regarding the presence or absence of Cy and Pg; these anthocyanidins were found in all samples except for Oiartzun. The most abundant anthocyanin was pelargonidin-3-O-glucoside with values between 43.51 to 111.40 μg per g DW and was followed by cyanidin-3-O-glucoside in the range from 23.34 to 83.12 μg per g DW. The anthocyanin profile of the cooked bean samples is completely lost, with the disappearance of all anthocyanins, except for cyanidin-3-O-glucoside, which survives the processing of these samples. Cyanidin-3-O-glucoside was quantified cooked beans of Oiartzun, Andoain, and Azkoitia, with a lower concentration between from 0.53 to 93.11 μg per g DW, compared to its content in raw “Tolosa” flour. This last, is also reflected in the color, as the beans retained their color after cooking. Some authors have established that pelargonidin and cyanidin are known to provide reddish colors to red fruits, while delphinidin is responsible for providing the blue color.31 While some studies suggest processing can lead to significant anthocyanin loss, our findings indicate otherwise for bean hummus. In contrast to cooked beans, bean hummus exhibited the least anthocyanin degradation. Both cyanidin-3-glucoside and pelargonidin-3-glucoside were present in bean hummus, except San Esteban hummus which lacked pelargonidin-3-glucoside. This suggests that bean hummus preparation may offer some protection for these beneficial compounds.
Catechin, a compound belonging to the flavanol family, was identified only in bean flour. However, the glucosylated derivative of catechin, catechin-3-glucoside was only detected in one of the raw samples (Oiartzun) with a high amount. This compound has only been detected so far in lentils (Dueñas et al.)32 and surprisingly was present in only one of the geographical origin samples.32 This aspect needs further research since in our opinion the agronomical and environmental conditions should not modify the polyphenolic composition within the same variety and cultivar in such an extent. The results also revealed an interesting observation regarding pyrogallol. Unlike the anthocyanins, which decreased with processing, pyrogallol, a compound commonly found in processed foods like beer, cocoa, and coffee33 showed a variation in pyrogallol concentration that increased in cooked beans and hummus if compared with the concentration found in raw or cooked “Tolosa” beans. In Oiartzun, pyrogallol was not detected in the raw flour, but was found in cooked beans (83.17 μg per g DW) and bean hummus (91.55 μg per g DW). This suggests possible pyrogallol formation during processing or its introduction from other hummus ingredients. In addition, in Andoain, Azkoitia, and Amasa Villabona pyrogallol concentration in hummus increased by 17%, 91%, and 39%, respectively, compared to raw flour beans, while in San Esteban the pyrogallol concentration in bean hummus decreased by 23% compared to raw flour beans. However, an increase of 27% in pyrogallol concentration was observed in cooked San Esteban beans. An increasing trend of pyrogallol in cooked beans is observed, supporting the hypothesis of its formation during processing. These results suggest that the formation of this compound during processing where the heat and other conditions during cooking may generate pyrogallol from precursors present in the beans. Other possibilities are the introduction of pyrogallol from other ingredients, some bean hummus ingredients, such as tahini or spices, may contain pyrogallol. Different bean varieties could have different levels of pyrogallol precursors, explaining the differences in their final concentration. Studies are needed to better understand the mechanisms of pyrogallol formation during bean processing. It is important to determine the source of pyrogallol in bean hummus and evaluate its impact on human health.
Another interesting finding was the detection of tryptophan, an essential amino acid found in a wide variety of foods such as red meats, fish, eggs, dairy, legumes, and nuts. Tryptophan serves as a precursor to serotonin, melatonin, and niacin.34 It was observed that tryptophan was present in raw beans regardless of their origin, with concentrations ranging from 0.0142 to 5.61 μg per g DW. Furthermore, it survived processing, albeit at lower concentrations in cooked bean samples compared to raw beans, except for San Esteban where it disappeared. As for bean hummus, there was also a decrease in this compound, with it disappearing in samples from Andoain and San Esteban, but interestingly showing a 20% increase in the Amasa Villabona sample.
The detailed characterization of the compounds obtained by HPLC-MSMS underlined their variability in “Tolosa” black beans, highlighting the influence of the agronomical conditions as well as the processing method. Specifically, cooking and hummus preparation led to significant changes in the anthocyanin profile, with widespread losses. This study contributes to the understanding of the variability in the polyphenolic composition of black beans and their derived products, highlighting the importance of considering the impact of processing on the preservation of health-beneficial compounds. These findings provide a valuable basis for future research and for the improvement of culinary practices that seek to maximize the content of polyphenolic compounds in plant-based foods by modifying the cooking time and temperature and the use or not of the maceration water for cooking.
3.3. Influence of in vitro digestion on total polyphenol content (TPC) of black beans foodstuffs
In the first analysis of results, the impact of processing on black bean products was investigated. Given that the beans from Amasa Villabona exhibited the best preservation of the studied compounds (see Table 4), and that the bean hummus showed a significant increase in the total quantified compounds, it was deemed appropriate to continue working solely with this sample and investigate its digestion process. The results revealed that the total polyphenol content in cooked black beans did not differ significantly from black bean flour (Table 5). However, a 25% decrease in total polyphenolic content (p < 0.05) was observed in bean hummus compared to black bean flour. These findings underline the influence of the preparation process, indicating that direct exposure of black beans to cooking could protect polyphenolic compounds, which are extremely thermolabile. In contrast, bean hummus processing, which involves grinding and mixing with other ingredients, modifies the initial matrix, negatively influencing total polyphenols. This phenomenon highlights the importance of considering both the nature of processing and the food matrix when preserving bioactive compounds in bean-based products.| Total polyphenol content (TPC) (mg GAE per g DW) | ||||
|---|---|---|---|---|
| Samples | Undigested matrix | Oral phase | Gastric phase | Intestinal phase |
| Different letters within a line indicate statistically significant differences in the DGS test (p < 0.05). DW: dry weight, GAE: gallic acid equivalent. | ||||
| Black bean flour | 2.15 ± 0.28b | 1.1 ± 0.2a | 2.1 ± 0.3b | 1.4 ± 0.2a |
| Cooked black bean | 2.02 ± 0.03b | 1.3 ± 0.1a | 2.3 ± 0.3b | 10.4 ± 1.2d |
| Bean hummus | 1.63 ± 0.07a | 0.9 ± 0.1a | 2.5 ± 0.3b | 4.6 ± 0.6c |
In the second phase, an analysis of the total polyphenolic content was carried out during the in vitro digestion of each sample. During the oral phase, a decrease in total polyphenolic content (TPC) was recorded in black bean flour, cooked beans, and bean hummus, reaching values of 1.1, 1.3, and 0.9 mg GAE per g DW, respectively, compared with the undigested samples that presented values of 2.15, 2.02, and 1.63 mg GAE per g DW, respectively. In the gastric phase, no significant differences were observed between any of the samples and the control samples. This finding is particularly interesting since many bioactive compounds are usually sensitive to changes in the pH, and in this particular case, a certain resistance to these conditions is evident.
At the end of digestion, in the intestinal phase, raw black beans experienced a significant decrease of 35% compared to undigested flour, suggesting greater susceptibility of polyphenolic compounds to intestinal conditions. In contrast, cooked black beans and bean hummus showed a significant increase of 416% and 186%, respectively, compared to cooked black beans and undigested bean hummus. These results indicate that the matrices of these foods somehow protect polyphenolic compounds during in vitro digestion, releasing them and increasing bioaccessibility at the end of the process. It stands out that cooked black beans presented the highest amount of bioaccessible bioactive compounds, in terms of total polyphenols, attributable, in part, to the initial effect of the integrity of the whole grains.
Despite the significant decrease in TPC in bean hummus before digestion, during digestion, an increase was observed towards the end of the process, highlighting the positive effect of the bean hummus matrix by protecting against degradation and allowing the release of bioactive compounds. The higher TPC values in the intestinal and gastric phases, compared to the values in the undigested matrix, suggest the gradual release of bioactive compounds during digestion, boosting their bioaccessibility.
3.4. Influence of in vitro digestion on ferric reducing power (FRAP) and antiradical activity (DPPH) of black beans foodstuffs
Cooking and In vitro digestion not only affect the content of bioactive compounds but also their antioxidant activity, as illustrated in Fig. 1 and 2. Fig. 1 represents the antioxidant activity in terms of FRAP in raw black bean flour, cooked black beans, and bean hummus, before, during and at the end of the in vitro digestion. Regarding the effect of cooking, a significant decrease of 50% is evident in the case of cooked beans and 65% in bean hummus, compared to raw black bean flour. The antioxidant activity, measured in terms of DPPH, is presented in Fig. 2. It is interesting to note that the polyphenolic compounds in the processed products experienced a total loss of antiradical activity compared to raw bean flour. These results are consistent with the findings for TPC; although cooked beans did not show a decrease in TPCs compared to raw bean flour, cooking affected them, which is also reflected in the bean hummus, adding to the grinding and loss of structure mentioned above. | ||
| Fig. 1 Influence of in vitro digestion on ferric reducing power (FRAP) of black beans foodstuffs in undigested matrix-control (blue color), oral phase (orange color), gastric phase (grey color), and intestinal phase (yellow color). | ||
 | ||
| Fig. 2 Influence of in vitro digestion on antiradical activity (DPPH) of black beans foodstuffs in undigested matrix-control (blue color), oral phase (orange color), gastric phase (grey color), and intestinal phase (yellow color). | ||
Regarding in vitro digestion, in the oral phase a decrease in the reducing power of iron was observed in the samples of raw bean flour, cooked beans, and bean hummus, with values of 8.1, 4.5, and 3.9 μmol Trolox eq. per g DW, respectively, compared to controls that presented values of 21.2, 10.5, and 7.5 μmol Trolox eq. per g DW, respectively. In contrast, antioxidant compounds in the gastric phase presented a substantial decrease in the reducing power of iron, with values around 95% in the three samples compared to their controls. Finally, in the intestinal phase, there was a significant increase in the iron-reducing power of cooked beans by 36% compared to undigested cooked beans, while bean hummus did not present significant differences compared to undigested bean hummus and bean flour showed a 49% decrease in this phase.
On the other hand, regarding antiradical activity, it was observed that the products presented different behaviors. In the oral phase, bean flour showed a decrease of 49% compared to undigested bean flour. In contrast, in cooked beans and bean hummus, the antiradical activity of polyphenolic compounds increased substantially. The ability to act as a free radical scavenger of polyphenolic compounds in the intestinal phase showed a decrease in bean flour, with a value of 8.8 μmol Trolox eq. per g DW compared to the control that had a value of 14.8 μmol Trolox eq. per g DW. In contrast, cooked beans and bean hummus showed a significant increase in this phase, with values of 11.0 and 4.7 μmol Trolox eq. per g DW, respectively. These results were similar to what was obtained in the analysis of the reducing power of iron in these samples, where the highest antioxidant activity was presented by the sample of cooked beans, which also presented the highest content of polyphenolic compounds. Accordingly, the values obtained for TPC, FRAP and DPPH, show a certain correlation, that is, the total polyphenol compounds presented a positive correlation with the iron reduction power (r = 0.4, p < 0.01) and with the antiradical activity (r = 0.4, p < 0.01), in turn, FRAP and DPPH presented a positive correlation between them (r = 0.49, p < 0.01).
3.5. Anthocyanin resistance to the in vitro digestion and bioaccessibility
Anthocyanins, known for their antioxidant activity and potential health benefits, are plant pigments that contribute to the characteristic color of black beans. Exploration of its behavior under in vitro digestion conditions sheds light on its stability and availability, providing valuable insights into its absorption and possible physiological impact. An analysis of the anthocyanin extracts was carried out at each stage of in vitro digestion by HPLC-DAD in order to evaluate changes in the anthocyanin profile and content. Four compounds were monitored, cyanidin-3-glucoside (Cy-3-Glu), pelargonidin-3-glucoside (Pg-3-Glu), cyanidin (Cy), and pelargonidin (Pg), during the in vitro digestion, as shown in Table 6.| Samples | Undigested matrix | Oral phase | Gastric phase | Intestinal phase | ||||||||||||
|---|---|---|---|---|---|---|---|---|---|---|---|---|---|---|---|---|
| Cy-3-Glu | Pg-3-Glu | Cy | Pg | Cy-3-Glu | Pg-3-Glu | Cy | Pg | Cy-3-Glu | Pg-3-Glu | Cy | Pg | Cy-3-Glu | Pg-3-Glu | Cy | Pg | |
| Concentration (μg per g DW) | Concentration (μg per g DW) | Concentration (μg per g DW) | Concentration (μg per g DW) | |||||||||||||
| Cyanidin 3-O-glucoside (Cy-3-Glu), pelargonidin 3-O-glucoside (Pg-3-Glu), cyanidin (Cy), and pelargonidin (Pg). Different letters within a line indicate statistically significant differences in the DGS test (p < 0.05). DW: dry weight. nd: compounds not detected. nq: compounds not quantified. | ||||||||||||||||
| Black bean flour | 224.7c | 190.0c | nd | nd | 141.3b | 142.5b | nq | nq | 6.3a | 4.2a | nq | nq | nq | 3.5a | nq | nq |
| Cooked black bean | nq | nq | nd | nd | nq | nq | nd | nd | nq | nq | nd | nd | nd | nd | nd | nd |
| Bean hummus | nd | nq | nd | nd | nd | nq | nd | nd | nd | nq | nd | nd | nd | nd | nd | nd |
Initially, before digestion, the concentration of the four selected compounds was determined using HPLC-DAD. Comparing these values with those obtained by HPLC-MSMS in Table 4 reveals discrepancies in the determination of these four anthocyanic compounds, possibly attributable to differences in extraction methods and detection techniques. In agreement with the findings shown in Table 4, the predominant anthocyanins in “Tolosa” bean flour were Cy-3-Glu and Pg-3-Glu. However, while the same compounds were present in cooked beans, only Pg-3-Glu was detected in bean hummus.
In the oral phase, the digested raw bean flour contained the four selected compounds. Compared to the undigested control, Cy-3-Glu and Pg-3-Glu decreased by 37% and 25% (p < 0.05), respectively. Even though Cy and Pg were detected in the digested oral phase of raw bean flour they are under the limit of quantification. This decrease in their concentration could be explained by the higher instability of anthocyanidins. Cooked bean and bean hummus samples displayed lower concentrations, with only Cy-3-Glu and Pg-3-Glu detectable (but not quantifiable) in cooked beans and only Pg-3-Glu in bean hummus.
In the gastric phase and compared to the control raw beans, Cy-3-Glu and Pg-3-Glu decreased significantly (97% and 98%, respectively). These compounds were detectable but not quantifiable in cooked beans, and only Pg-3-Glu was detectable in bean hummus. Cy and Pg were absent except in raw bean flour. This suggests a high susceptibility of Cy-3-Glu and Pg-3-Glu to gastric conditions. However, and in agreement with the literature,35 such a decrease in anthocyanin content in the gastric phase was not expected taking into consideration the low pH in this phase of the digestion. In this sense, this result can be explained by the reactions that take place during this digestion between anthocyanins and other compounds present in the food matrix, maybe leading to a decrease in their extractability. Further research is needed to identify the specific reactions involved and to better understand how the food matrix affects the stability of anthocyanins during digestion. Finally, in the intestinal phase, all four anthocyanins were detected in raw bean flour, but Pg-3-Glu showed a further 98% decrease compared to the control (p < 0.05). No anthocyanins were detected in cooked beans or bean hummus in the intestinal phase, suggesting complete loss due to processing and digestion. Cy and Pg were only detected in raw bean flour during this phase, potentially resulting from further breakdown of the original anthocyanins.
In comparison to the present results, in our previous work, Moragro black corn showed Cy-3-Glu retention at the end of the digestion process, although with a significant decrease from its initial concentration. This observation could be associated with the higher initial concentration of Cy-3-Glu (around 300 μg per g DW) in black maize, which, although affected by digestion (93% reduction), still allowed for the detection of the anthocyanin at the end of the process.15
In general, it can be concluded that Cy-3-Glu and Pg-3-Glu have a high susceptibility to degradation due to food processing, such as cooking and crushing, as well as to digestion. Anthocyanins exhibit greater stability in the oral phase but degrade significantly in the gastric phase. Pg-3-Glu appears to be more resistant to digestion compared to other anthocyanins. Encouragingly, anthocyanins were detectable following in vitro digestion, despite the initial use of only 1 g of wet weight food material. This suggests that anthocyanins, at least to some extent, exhibit resistance to digestive conditions. To further explore this aspect, employing larger sample sizes would be advantageous. This would overcome current quantification limitations and enable a more comprehensive understanding of anthocyanin behavior during digestion.
3.6. Bioactivity analysis and cell viability assay
Caco-2 cells viability after being exposed to digested aliquot of bean flour, cooked beans, and bean hummus was assessed for cytotoxicity determination. Fig. 3 illustrates the impact of bioaccessible compounds of black beans at different dilutions. A significant difference was observed at a 1:100 dilution between cooked black beans and bean hummus, with viability increasing by 62% and 104%, respectively, compared to the control. In contrast, bean flour did not show significant differences compared to the control, indicating that the compounds present did not positively affect cell viability, unlike cooked beans and bean hummus. At a dilution of 1:250, significant differences were observed with 37% and 67% cell viability for cooked beans and bean hummus, respectively, compared to the control sample. However, at a dilution of 1:500, only bean hummus showed significant differences with the control, showing a 69% increase in cell viability, while the cooked bean compounds were unable to exert their protective effect due to the high dilution. The results obtained suggest that the compounds present in cooked beans and bean hummus have a protective effect, since the cytotoxic effect of the control sample remains constant, possibly explained by the presence of the different reagents used in the in vitro digestion.
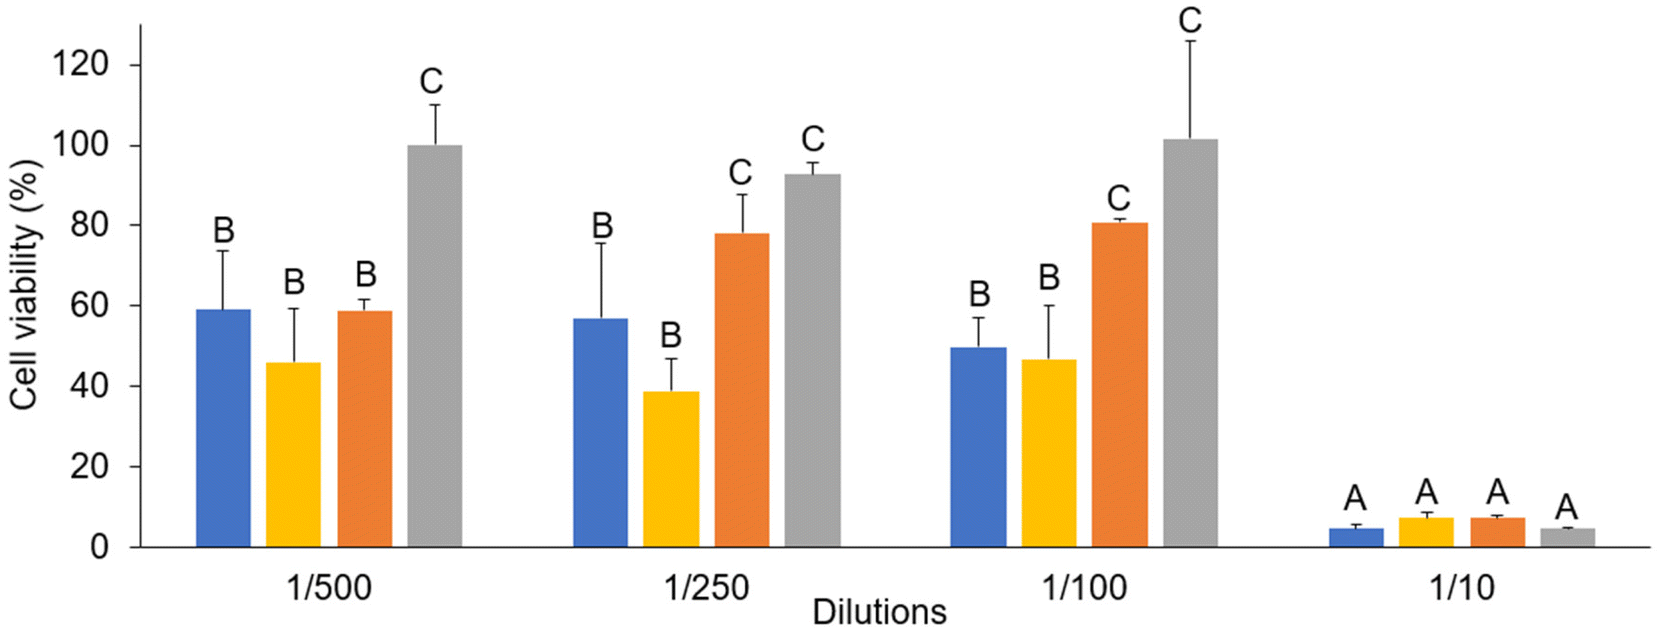 | ||
| Fig. 3 Cell viability assays in Caco-2 of control (blue bars) and intestinal aliquots of black bean flour (yellow bars), cooked bean flour (orange bars), and bean hummus (grey bars). Different letters indicate statistically significant differences in the DGS test (p < 0.05). | ||
In addition to our findings, several studies highlight the diverse health benefits associated with polyphenolic compounds. For example, research suggests that specific polyphenolics, particularly anthocyanins in black beans, may possess antidiabetic properties.36 Another study demonstrates the promising potential of black bean polyphenols as anti-aging ingredients in cosmetics.37 Furthermore, a recent investigation indicates that black bean extracts offer potential benefits in managing hyperglycemia, oxidative stress, and inflammation, paving the way for nutraceutical applications.26 Considering our protective effects and these studies, further research is necessary to delve deeper into the specific effects and mechanisms of action of the compounds present in black beans.
The results suggest that cooking “Tolosa” black beans leads to an increase in bioaccessible polyphenols and their antioxidant activity, which positively impacts cell viability. Interestingly, despite a decrease in antioxidant activity in the bean hummus sample, the remaining compounds appear to retain their protective effects even at high dilutions.
In conclusion, this study demonstrates that foods made with “Tolosa” black beans retain bioaccessible and bioactive polyphenols after various processing steps and in vitro digestion, although anthocyanins are almost fully lost during this process. This research is valuable for designing functional foods with potential health benefits. It also highlights the importance of exploring strategies to preserve the polyphenol content and potentially enhance the functionality of black bean polyphenols.
Author contributions
Conceptualization: S. d. P.-T.; methodology: S. d. P.-T., G. P. B., M. D. R. and M. L. R. d. C.; investigation: M. D. R. and M. L. R. d. C.; data curation: M. D. R., M. L. R. d. C. and S. d. P.-T.; writing and original draft preparation: M. D. R. and G. P. B.; writing and review and editing: S. d. P.-T., G. P. B. and M. D. R.; funding acquisition: S. d. P.-T. and G. P. B.Conflicts of interest
The authors declare that there is no conflict of interest.Acknowledgements
This work was funded by the Spanish Ministry of Science and Innovation, Spain (PID2019-107009RB-I00) and by COST Action INFOGEST and CSIC i-LINK Program 2019 (LINKA20292), through FA1005-STSM-2021-001 to M. D. R. We are grateful to Tolosako Babarruna Elkartea (Guipúzcoa) for supplying the “Tolosa” black beans and S. Menendez and D. Brinduse for their laboratory assistance. Authors are grateful to the Analysis Service Unit (USTA) facilities of ICTAN for the analysis of Chromatography and Mass Spectrometry. All authors have read and agreed to the published version of the manuscript.References
- M. Nicolás-García, M. Perucini-Avendaño, C. Jiménez-Martínez, M. de Jesús Perea-Flores, M. B. Gómez-Patiño, D. Arrieta-Báez and G. Dávila-Ortiz, Bean phenolic compound changes during processing: Chemical interactions and identification, J. Food Sci., 2021, 86, 643–655 CrossRef PubMed.
- R. Bulyaba, D. M. Winham, A. W. Lenssen, K. J. Moore, J. D. Kelly, M. A. Brick, E. M. Wright and J. B. Ogg, Genotype by location effects on yield and seed nutrient composition of common bean, Agronomy, 2020, 10, 347 CrossRef CAS.
- M. Sandoval-Peraza, D. Betancur-Ancora and L. Chel-Guerrero, Physicochemical and bioactive properties of the fibrous fraction of hard-to-cook black bean (Phaseolus vulgaris L. var. Jamapa), J. Food Nutr. Res., 2014, 53, 127–136 CAS.
- Y. Papanikolaou, J. Slavin and V. L. Fulgoni, Adult dietary patterns with increased bean consumption are associated with greater overall shortfall nutrient intakes, lower added sugar, improved weight-related outcomes and better diet quality, Nutr. J., 2024, 23, 36 CrossRef CAS PubMed.
- E. J. Reverri, J. M. Randolph, F. M. Steinberg, C. T. Kappagoda, I. Edirisinghe and B. M. Burton-Freeman, Black beans, fiber, and antioxidant capacity pilot study: examination of whole foods vs. functional components on postprandial metabolic, oxidative stress, and inflammation in adults with metabolic syndrome, Nutrients, 2015, 7, 6139–6154 CrossRef CAS PubMed.
- K. Damián-Medina, D. Milenkovic, Y. Salinas-Moreno, K. F. Corral-Jara, L. Figueroa-Yáñez, E. Marino-Marmolejo and E. Lugo-Cervantes, Anthocyanin-rich extract from black beans exerts anti-diabetic effects in rats through a multi-genomic mode of action in adipose tissue, Front. Nutr., 2022, 9, 1019259 CrossRef PubMed.
- M. Nicolás-García, M. Perucini-Avendaño, D. Arrieta-Báez, M. J. Perea-Flores, C. Jiménez-Martínez, M. Beatriz Gómez-Patiño and G. Dávila-Ortiz, Phenolic compounds profile by UPLC-ESI-MS in black beans and its distribution in the seed coat during storage, Food Chem., 2022, 395, 133638 CrossRef PubMed.
- M. E. Eker, K. Aaby, I. Budic-Leto, S. R. Brncic, S. N. El, S. Karakaya, S. Simsek, C. Manach, W. Wiczkowski and S. de Pascual-Teresa, A review of factors affecting anthocyanin bioavailability: Possible implications for the inter-individual variability, Foods, 2019, 9, 2 CrossRef PubMed.
- A. Brodkorb, L. Egger, M. Alminger, P. Alvito, R. Assunção, S. Ballance, T. Bohn, C. Bourlieu-Lacanal, R. Boutrou, F. Carrière, A. Clemente, M. Corredig, D. Dupont, C. Dufour, C. Edwards, M. Golding, S. Karakaya, B. Kirkhus, S. Le Feunteun, U. Lesmes, A. Macierzanka, A. R. Mackie, C. Martins, S. Marze, D. J. McClements, O. Ménard, M. Minekus, R. Portmann, C. N. Santos, I. Souchon, R. P. Singh, G. E. Vegarud, M. S. J. Wickham, W. Weitschies and I. Recio, INFOGEST static in vitro simulation of gastrointestinal food digestion, Nat. Protoc., 2019, 14, 991–1014 CrossRef CAS PubMed.
- W. M. Umeda, D. M. Moreno Luzia and N. Jorge, Evaluation of bioactive compounds in bean oils (Phaseolus vulgaris L.), Pérola and BRS valente varieties, Curr. Nutr. Food Sci., 2017, 14, 40–46 CrossRef.
- M. Hernández-Salazar, P. Osorio-Diaz, G. Loarca-Piña, R. Reynoso-Camacho, J. Tovar and L. A. Bello-Pérez, In vitro fermentability and antioxidant capacity of the indigestible fraction of cooked black beans (Phaseolus vulgaris L.), lentils (Lens culinaris L.) and chickpeas (Cicer arietinum L.), J. Sci. Food Agric., 2010, 90, 1417–1422 CrossRef PubMed.
- A. Mir-Cerda, O. Nuñez, M. Granados, S. Sentellas and J. Saurina, An overview of the extraction and characterization of bioactive phenolic compounds from agri-food waste within the framework of circular bioeconomy, TrAC, Trends Anal. Chem., 2023, 161, 1169 CrossRef.
- M. D. Rodríguez, J. García-Cordero, D. Suárez-Coca, M. L. Ruiz del Castillo, G. P. Blanch and S. de Pascual-Teresa, Varietal effect on composition and digestibility of seedless table grapes (Vitis vinifera L.) under in vitro conditions, Foods, 2022, 11, 3984 CrossRef PubMed.
- M. C. Bustos, D. Rocha-Parra, I. Sampedro, S. de Pascual-Teresa and A. E. León, The influence of different air-drying conditions on bioactive compounds and antioxidant activity of berries, J. Agric. Food Chem., 2018, 66, 2714–2723 CrossRef CAS PubMed.
- M. D. Rodriguez, L. Monsierra, P. S. Mansilla, G. T. Pérez and S. de Pascual-Teresa, Phenolic characterization of a purple maize (Zea mays cv. “Moragro”) by HPLC–QTOF-MS and study of its bioaccessibility using a simulated in vitro digestion/Caco-2 culture model, J. Agric. Food Chem., 2024, 72, 6327–6338 CrossRef CAS PubMed.
- S. Chamorro, R. Cueva-Mestanza and S. de Pascual-Teresa, Effect of spray drying on the polyphenolic compounds present in purple sweet potato roots: Identification of new cinnamoylquinic acids, Food Chem., 2021, 345, 128679 CrossRef CAS PubMed.
- J. M. Silván, E. Mingo, M. Hidalgo, S. de Pascual-Teresa, A. V. Carrascosa and A. J. Martinez-Rodriguez, Antibacterial activity of a grape seed extract and its fractions against Campylobacter spp., Food Control, 2013, 29, 25–31 CrossRef.
- R. E. Wrolstad, R. W. Durst, M. M. Giusti and L. E. Rodriguez-Saona, Analysis of anthocyanins in nutraceuticals, Quality Management of Nutraceuticals, ACS Symposium Series, 2002, vol. 803, pp. 42–62 Search PubMed.
- M. Wesołowsk and M. Dżugan, The use of the PHOTOCHEM device in evaluation of antioxidant activity of polish honey, Food Anal. Methods, 2017, 10, 1568–1574 CrossRef.
- R. C. Smith and J. C. Reeves, Antioxidant properties of 2-imidazolones and 2-imidazolthiones, Biochem. Pharmacol., 1987, 36, 1457–1460 CrossRef CAS PubMed.
- M. C. Puell and S. de Pascual-Teresa, The acute effect of cocoa and red-berries on visual acuity and cone-mediated dark adaptation in healthy eyes, J. Funct. Foods, 2021, 81, 104435 CrossRef CAS.
- A. Soriano-Maldonado, M. Hidalgo, P. Arteaga, S. de Pascual-Teresa and E. Nova, Effects of regular consumption of vitamin C-rich or polyphenol-rich apple juice on cardiometabolic markers in healthy adults: a randomized crossover trial, Eur. J. Nutr., 2014, 53, 1645–1657 CrossRef CAS PubMed.
- N. Carballeda-sangiao, S. Chamorro and S. de Pascual-Teresa, A red-berry mixture as a nutraceutical: Detailed composition and neuronal protective effect, Molecules, 2021, 26, 3210 CrossRef CAS PubMed.
- I. Hubatsch, E. G. E. Ragnarsson and P. Artursson, Determination of drug permeability and prediction of drug absorption in Caco-2 monolayers, Nat. Protoc., 2007, 2, 2111–2119 CrossRef CAS PubMed.
- G. A. Macz-Pop, J. C. Rivas-Gonzalo, J. J. Pérez-Alonso and A. M. González-Paramás, Natural occurrence of free anthocyanin aglycones in beans (Phaseolus vulgaris L.), Food Chem., 2006, 94, 448–456 CrossRef CAS.
- K. L. Moreno-García, M. Antunes-Ricardo, M. Martínez-Ávila, J. Milán-Carrillo and D. Guajardo-Flores, Evaluation of the antioxidant, anti-inflammatory and antihyperglycemic activities of black bean (Phaseolus vulgaris L.) by-product extracts obtained by supercritical CO2, J. Supercrit. Fluids, 2022, 183, 105560 CrossRef.
- D. Guajardo-Flores, S. O. Serna-Saldívar and J. A. Gutiérrez-Uribe, Evaluation of the antioxidant and antiproliferative activities of extracted saponins and flavonols from germinated black beans (Phaseolus vulgaris L.), Food Chem., 2013, 141, 1497–1503 CrossRef CAS PubMed.
- J. Boateng, M. Verghese, L. T. Walker and S. Ogutu, Effect of processing on antioxidant contents in selected dry beans (Phaseolus spp. L.), LWT – Food Sci. Technol., 2008, 41, 1541–1547 CrossRef CAS.
- E. Almanza-Aguilera, I. Guzmán-Tovar, J. A. Acosta-Gallegos and S. H. Guzmán-Maldonado, Content of phytochemicals in beans of cooked and refried black beans, Report of the International Congress of Industry and Food Technology, Puebla, Mexico, 31 August 2006.
- Q. Q. Yang, R. Y. Gan, Y. Y. Ge, D. Zhang and H. Corke, Polyphenols in common beans (Phaseolus vulgaris L.): chemistry, analysis, and factors affecting composition, Compr. Rev. Food Sci. Food Saf., 2018, 17, 1518–1539 CrossRef CAS PubMed.
- F. S. Hosseinian and T. Beta, Saskatoon and wild blueberries have higher anthocyanin contents than other Manitoba berries, J. Agric. Food Chem., 2007, 55, 10832–10838 CrossRef CAS PubMed.
- M. Dueñas, T. Hernández and I. Estrella, Changes in the content of bioactive polyphenolic compounds of lentils by the action of exogenous enzymes. Effect on their antioxidant activity, Food Chem., 2007, 101, 90–97 CrossRef.
- R. Lang, C. Mueller and T. Hofmann, Development of a stable isotope dilution analysis with liquid chromatography-tandem mass spectrometry detection for the quantitative analysis of di- and trihydroxybenzenes in foods and model systems, J. Agric. Food Chem., 2006, 54, 5755–5762 CrossRef CAS PubMed.
- S. Barik, Evolution of protein structure and stability in global warming, Int. J. Mol. Sci., 2020, 21, 1–22 Search PubMed.
- K. Wojtunik-Kulesza, A. Oniszczuk, T. Oniszczuk, M. Combrzyński, D. Nowakowska and A. Matwijczuk, Influence of in vitro digestion on composition, bioaccessibility and antioxidant activity of food polyphenols—A non-systematic review, Nutrients, 2020, 12, 1401 CrossRef CAS PubMed.
- K. Damián-Medina, Y. Salinas-Moreno, D. Milenkovic, L. Figueroa-Yáñez, E. Marino-Marmolejo, I. Higuera-Ciapara, A. Vallejo-Cardona and E. Lugo-Cervantes, In silico analysis of antidiabetic potential of phenolic compounds from blue corn (Zea mays L.) and black bean (Phaseolus vulgaris L.), Heliyon, 2020, 6, 3 CrossRef PubMed.
- D. Fonseca-Hernández, E. D. C. Lugo-Cervantes, A. Escobedo-Reyes and L. Mojica, Black bean (Phaseolus vulgaris L.) polyphenolic extract exerts antioxidant and antiaging potential, Molecules, 2021, 26, 6716 CrossRef PubMed.
Footnote |
| † Electronic supplementary information (ESI) available. See DOI: https://doi.org/10.1039/d4fo01238k |
| This journal is © The Royal Society of Chemistry 2024 |