
 Open Access Article
 This Open Access Article is licensed under a
 Creative Commons Attribution 3.0 Unported Licence
Pomegranate supplementation alleviates dyslipidemia and the onset of non-alcoholic fatty liver disease in Wistar rats by shifting microbiota and producing urolithin-like microbial metabolites†
Guadalupe
Sánchez-Terrón
a,
Remigio
Martínez
b,
David
Morcuende
a,
Víctor
Caballero
a and
Mario
Estévez
 *a
*a
aTECAL Research Group, Meat and Meat Products Research Institute (IPROCAR), Universidad de Extremadura (UEX, ROR-ID 0174shg90), Cáceres, 10003, Spain. E-mail: mariovet@unex.es
bAnimal Health Department, Animal Health and Zoonoses Research Group (GISAZ), UIC Zoonosis and Emergent Diseases (ENZOEM Competitive Research Unit), Universidad of Córdoba (UCO, ROR-ID 05yc77b46), Córdoba, 14014, Spain
First published on 5th April 2024
Abstract
Non-alcoholic fatty liver disease (NAFLD), obesity and related chronic diseases are major non-communicable diseases with high mortality rates worldwide. While dietary sugars are known to be responsible for insulin resistance and metabolic syndrome (MetS), the underlying pathophysiological effects of sustained fructose consumption require further elucidation. We hypothesize that certain bioactive compounds (i.e. punicalagin and ellagic acid) from dietary pomegranate could counteract the harmful effects of sustained fructose consumption in terms of obesity and liver damage. The present study aimed to elucidate both the molecular mechanisms involved in the pathophysiology associated with fructose intake and the effect of a punicalagin-rich commercial pomegranate dietary supplement (P) used as a nutritional strategy to alleviate fructose-induced metabolic impairments. Thus, nineteen Wistar rats fed on a basal commercial feed were supplemented with either 30% (w/v) fructose in drinking water (F; n = 7) or 30% (w/v) fructose solution plus 0.2% (w/v) P (F + P; n = 6) for 10 weeks. The results were compared to those from a control group fed on the basal diet and provided with drinking water (C; n = 6). Body weight and energy intake were registered weekly. P supplementation decreased fat depots, counteracted the dyslipidemia caused by F and improved markers of liver injury including steatosis. The study of the microbiota by metagenomics and urine by untargeted MS-based metabolomics revealed microbial metabolites from P that may be responsible for these health benefits.
1. Introduction
Fructose consumption has increased strongly in the last decades, despite the efforts of governments and health organizations to alert populations on the health risks linked to sustained intake of simple sugars. The World Health Organization (WHO) recommends consuming less than 5% of total calories in the form of reducing sugars.1 Extensive literature supports the connection between fructose intake and several metabolic impairments associated with metabolic syndrome (MetS), such as obesity, adiposity, dyslipidemia, non-alcoholic fatty liver disease (NAFLD), insulin resistance, type 2 diabetes mellitus (T2DM), gout, hyperuricemia and cardiometabolic diseases, likely related to disturbances of liver metabolism.2Impaired hepatic energy metabolism and lipid deposition might be responsible for the negative outputs related to high fructose consumption. Excessive stimulation of glycolysis and gluconeogenesis pathways together with decreased activity of fatty acid oxidation pathways appear to be the basis of these impairments.3 However, it is known that many pathophysiological effects of sustained sugar consumption are associated with events occurring at the gastrointestinal (GIT) level.4 Our previous in vivo study illustrated the deleterious effects of dietary fructose on glycoxidative stress in both the intraluminal contents and GIT tissues and on impaired protein digestibility, as well as its negative impact on the microbiota and the intraluminal colonic metabolome.5 The glycoxidative reactions (or pro-glycoxidative status) promoted by excess fructose consumption could also potentially adversely contribute to fructose-associated metabolic impairments, but other factors are involved. At 0.5 g per kg body mass, fructose is transported into epithelial cells through facilitative glucose transporter 5 (GLUT5) and metabolized in the small intestine to other species (glucose, lactate, and/or glycerate), which are subsequently released into the portal blood to the liver. Higher levels of dietary fructose (>1 g per kg body mass) are known to induce not only overexpression of GLUT5,3 but also the translocation of basolateral facilitative glucose transporter 2 (GLUT2) to the apical membrane, optimizing fructose intestinal uptake.6 Despite this, high intakes of fructose could overwhelm the intestinal clearance mechanisms and pass to later GIT stages, as well as reaching the liver via portal circulation.2 In the liver, GLUT5 is not expressed at high levels, and GLUT2 is likely the major membrane transporter.3,7
Phenolic-rich dietary supplements are commonly marketed along with health claims of protecting against numerous health disorders and enhancing health status. Yet, the molecular mechanisms of their potential bioactivities as well as the actual effectiveness of some of these supplements require further elucidation. Pomegranate is rich in a variety of phenolic compounds and its consumption is related to assorted health benefits including anti-obesity, antidiabetic and hepatoprotective effects.8,9 Punicalagin (PU) is a member of the ellagitannin family naturally present in pomegranate, together with ellagic acid (EA), which makes punicalagin a component of great importance from the point of view of health, and the interaction between the compound and the gut microbiota seems to be the key to its beneficial effects.10,11 EA is a bioactive compound with antioxidant properties which is further biotransformed into urolithins (U), with these latter microbial metabolites having a remarkable positive impact on human health.12 Several studies have linked PU supplementation with improvements in metabolic pathologies such as T2DM through their ability to interact with intestinal GLUT2.13 Other authors related the inhibition of intestinal GLUT5 with several plant extracts like green tea and chamomile,2 so this encouraged us to gain further insight into the unknown impact of PU on the metabolism of fructose during an in vivo experiment and the consequences in terms of liver health. We hypothesize that the above-mentioned bioactive compounds (i.e. PU and EA) from pomegranate could counteract the harmful effects of sustained fructose consumption in terms of obesity and liver damage. To prove whether this hypothesis was correct or not, Wistar rats were supplemented for 10 weeks with fructose and a PU-rich commercial pomegranate dietary supplement. Hence, this study aims to decipher the adverse effects of sustained fructose consumption on hepatic metabolism and the mechanisms of the potential hepatoprotective effects of a PU-rich commercial pomegranate dietary supplement (P).
2. Materials and methods
2.1. Chemicals
All chemicals used in the high-performance liquid chromatography (HPLC) were provided by Fisher Scientific S.L. (Madrid, Spain). External standards of urolithins A and B, ellagic acid, α-aminoadipic and γ-glutamic semialdehydes (α-AS and γ-GS, respectively), and pentosidine were acquired from Sigma-Aldrich (St Louis, USA), similar to the rest of the reagents used in the analysis. Punicalagins A and B (mixture) were purchased from Phytolab GmbH & Co. KG (Germany). The standard of delphinidin chloride was provided by Extrasynthese (Genay, France). Ultrapure water was prepared using a Milli-Q water purification system (Millipore Corp., Bedford, MA, USA).2.2. Animals, feeds, and other materials
Nineteen male Wistar breed rats of the Rattus norvegicus species were used in our experiment according to Spanish legal requirements (RD 53/2013), the bioethics committee of the University of Extremadura (137-2020) and the approval of the Board of Extremadura (EXP20200904). The design and performance of the experiment, including animal manipulation and euthanasia, were carried out by licensed veterinarians with all requirements by legal authority (Dirección General de Sanidad Animal, Junta de Extremadura, Spain). The rats were supplied by the Animal Experimentation Station from the University of Extremadura (Caceres, Spain). At the beginning of the assay, they were 6–7 weeks old and weighed 186 g on average. During the entire study period, the same rodent basal feed was used, which was the “Teklad Global Diet 2014”, supplied by ENVIGO (Madison, WI, USA), with a crude protein content of 14.3%. Detailed information on the composition of feeds is provided in Table S1 from the ESI.† The PU-rich pomegranate supplement (Granatum Plus, "Punicalagina Plus con Pomanox®) was provided by “Antioxidantes Naturales del Mediterráneo S.L.” as pills (Murcia, Spain).2.3. Characterization of punicalagin-rich pomegranate pills
To determine the chemical composition of the encapsulated pomegranate powder, HPLC analysis was conducted. The pre-treatment of the product for the analysis is illustrated as Fig. S1 from the ESI† for a better understanding of the procedure. The filtrates were subjected to HPLC using a Shimadzu Prominence HPLC (Shimadzu Corp., Japan) equipped with a quaternary solvent delivery system (LC-20AD), a DGU-20AS online degasser, an SIL-20A autosampler and a SPD-M20A diode array detector. The column used was a reversed-phase Agilent Poroshell 120 SB-C18 column (150 × 4.6 mm, particle size 2.7 μm). Solutions of MilliQ water with 0.1% (v/v) formic acid (A) and acetonitrile 100% with 0.1% (v/v) trifluoracetic acid (B) were used as eluents, and the flow rate was maintained at 0.5 mL min−1. The column was eluted with the following gradients: 0 min, 7% B; 20 min, 25% B; 35 min, 40% B; 40 min, 60% B, and from 41 to 50 min, 7% B was maintained. The photodiode array detector was set to measure at a wavelength of 379 nm and external standards of isomers of punicalagins A and B (mixture), ellagic acid and delphinidin were used for the identification and quantification of the compounds. Quantification was based on the external calibration curves of each standard with a concentration range over 12.5–100 μg mL−1 for punicalagins (A + B), 25–200 μg mL−1 for ellagic acid, and 25–200 μg mL−1 for delphinidin chloride.Each pill, on average, had 231.7 mg of punicalagins (A + B), 7.29 mg of ellagic acid and 0.26 mg of anthocyanins (750 mg of pomegranate extract). Chromatograms of both punicalagin samples analyzed and the standard are detailed in Fig. S2 of the ESI.†
2.4. Experimental design
During a 1-week adaptation period, the rats were individually identified by means of a perforation code in the auditory pavilion and maintained in ventilated cages, with water and feed ad libitum, under controlled climatic conditions (20–22 °C temperature, 40–50% humidity and 12–12 hours light/dark cycle).Once the adaptation period had finished, the animals were randomly allocated to one of these three experimental groups: (i) the control group (C), which received the basal feed and drinking water during the entire assay (n = 6); (ii) the fructose group (F), in which drinking water was replaced by 30% (w/v) fructose solution (n = 7); and (iii) the fructose and P group (F + P), in which drinking water was replaced by 30% (w/v) fructose solution along with 0.2% (w/v) pomegranate supplement (n = 6). The number of animals was fixed in accordance with previous statistical assessments to guarantee enough statistical power to discriminate differences in the assessed parameters at a significance level (p) of less than 0.05.
The experiment was conducted for 10 weeks. Animals were checked daily to ensure safety and well-being. During the treatment, food and water/solution consumption were gravimetrically monitored every time they were refilled in order to calculate the energy intake. This procedure was performed depending on the demand of the animals (every two or three days, approximately). Body weights were registered weekly.
On average, rats from the F group consumed 9 g fructose per kg live bodyweight per day. Based on the total amounts of PU (referring to the sum of punicalagins A and B) in P, and the quantities of fructose-solution with P consumed by the rats, the animals ingested an average of 23.68 mg PU per kg bodyweight per day. The dosages provided to animals by oral administration are compatible with both the recommended dosage suggested by the pomegranate pill supplier and the intake of fructose by human beings.14
2.5. Slaughter, necropsy and sampling
The Wistar rats were euthanized at the end of the experimental period at an approximate age of 16–17 weeks-old and an average weight of 437 grams. Euthanasia was performed by exsanguination via cardiac puncture. Previously, the animals were anaesthetized using 5% inhaled isoflurane. All the blood was collected in tubes with EDTA and subsequently stored at −80 °C. Fatty tissues were taken, and the fat depots of the animals were weighed according to type and location. The subcutaneous adipose tissue (SAT) as well as the visceral adipose tissue (VAT) were gently removed and individually weighed. The VAT was dissected from different locations in the abdomen of the rats (retroperitoneal, perirenal, gonadal and inguinal). The sum of the weight of both depots was considered as white adipose tissue (WAT).15 Moreover, the fat depots from the interscapular region were also removed and weighed as brown adipose tissue (BAT). The liver of the animals was promptly dissected from the corpses, dispensed in a suitable container, and stored immediately at −80 °C. A portion of the tissue was preserved in 5% formalin for microscopic analyses. The urine was aseptically collected through puncture of the bladder and properly stored. Feces from the rectum were aseptically dispensed in Eppendorf tubes and stored at −80 °C until analyses were performed.2.6. Analytical procedures
2.6.1.1. Protein carbonylation. The detection and quantification of α-aminoadipic (α-AS) and γ-glutamic semialdehydes (γ-GS) were performed through HPLC technologies in order to evaluate the accretion of protein carbonyls in the liver as described previously.16 Thus, 500 mg of tissue was homogenized with 0.5 mL of PBS solution and the remaining steps of the procedure were the same as those reported in the above-mentioned study. The results from the quantification of α-AS and γ-GS were expressed individually and as total primary protein carbonyls (PPC) (nmol carbonyl per mg protein).
2.6.1.2. Pentosidine. Pentosidine is a specific marker of advanced glycation endproducts (AGEs). The compound was also assessed using the specific liquid chromatographic procedure described above (2.6.1.1. Protein carbonylation).16,17 Tissue homogenates were treated with 10% cold trichloroacetic acid (TCA) to removed proteins and ethanol–ethyl-acetate (1
![[thin space (1/6-em)]](https://www.rsc.org/images/entities/char_2009.gif) :1; v/v) to remove lipids. Purified extracts were filtered through 0.45 μm pore size hydrophilic polypropylene GH Polypro (GHP) syringe filters (Pall Corporation, Port Washington, NY, USA). HPLC analysis and conditions were described elsewhere.16 The standard of the compound was used to compare the retention times and to identify the pentosidine peak, which was manually integrated from fluoresce detector chromatograms. Pentosidine was expressed as fluorescence units.
663 μm2).
:1; v/v) to remove lipids. Purified extracts were filtered through 0.45 μm pore size hydrophilic polypropylene GH Polypro (GHP) syringe filters (Pall Corporation, Port Washington, NY, USA). HPLC analysis and conditions were described elsewhere.16 The standard of the compound was used to compare the retention times and to identify the pentosidine peak, which was manually integrated from fluoresce detector chromatograms. Pentosidine was expressed as fluorescence units.
663 μm2).
On the other hand, deparaffinized and rehydrated hepatic sections were incubated with a CD45 antibody, anti-rat REAfinity™ APC (Miltenyi Biotec) and Hoechst 33258 (Thermo Fisher Scientific), once the process to expose antigens had been carried out. The APC- and Hoechst-treated samples were excited at 405 nm and 635 nm, respectively, and the images were taken using a Fluview 1000, Olympus-Evident confocal microscope.
:methanol (1:2), according to the method described previously.18 The mixture was homogenized by hand and centrifuged twice to discard larger particles. The residue was then washed again with chloroform:methanol (1:2) and homogenized in a mixer mill using small steel balls. Subsequently, the mixture was centrifuged, and the resulting supernatant was transferred into a previously weighed glass tube. The process was repeated. For phase separation, KCl (0.1 M) was added to the accumulated supernatants, and samples were centrifuged. The organic phase (lower) was collected by passing it through anhydrous sodium sulfate and then dried using a rotary evaporator.
2.7. Statistical analyses
The statistical analysis of raw data was carried out and parametric (i.e., the ANOVA test and Tukey post hoc test) and non-parametric tests (i.e., Kruskal–Wallis's test and multiple comparisons post hoc test) were applied based on the normality and homoscedasticity of the data using the R statistical software (R 4.2.3) and SPSS version 27.0. Box plots and bar chart were generated using ggplot2.20p Values less than 0.05 were considered statistically significant. Both F- and F + P-responsive metabolites were assessed using MetaboAnalyst (https://www.metaboanalyst.ca/). Principal component analysis (PCA) as a multivariant analysis was used. Moreover, metabolite profile distinctions between the groups were evaluated using the ANOVA test as a one-factor statistical method to further analyze the impact of the treatments on the urine metabolome of Wistar rats.3. Results
3.1. Caloric intake, body weights and fat depots
Table 1 shows the energy provided by the diet to the different groups of experimental animals expressed as the median [interquartile range (IQR)] of kJ per kg body weight registered. The energy consumed by C was supplied only by the feed (96.58 kJ per kg body weight) and was statistically similar to that consumed by F and F + P through the solid feed. However, drinking fructose-rich solutions provided an extra energy supply to animals from F and F + P (41.54 and 45.47 kJ per kg body weight, respectively) as compared to animals from C, which drank only water. For this reason, there were significant differences among the total energy intakes of the experimental animals during the assay (p < 0.05), with F and F + P being the groups having the highest total energy intake (137.08 kJ per kg body weight and 129.28 kJ per body weight, respectively). The occurrence of P in fructose solution did not affect the solution intake, and hence, both groups of animals had equivalent total energy supplies during the assay. Unexpectedly, this higher energy input did not appear to significantly influence the weight of the different groups of animals during the experiment, which overall increased similarly from approximately 230 to 423 g (mean weights) (Fig. 1).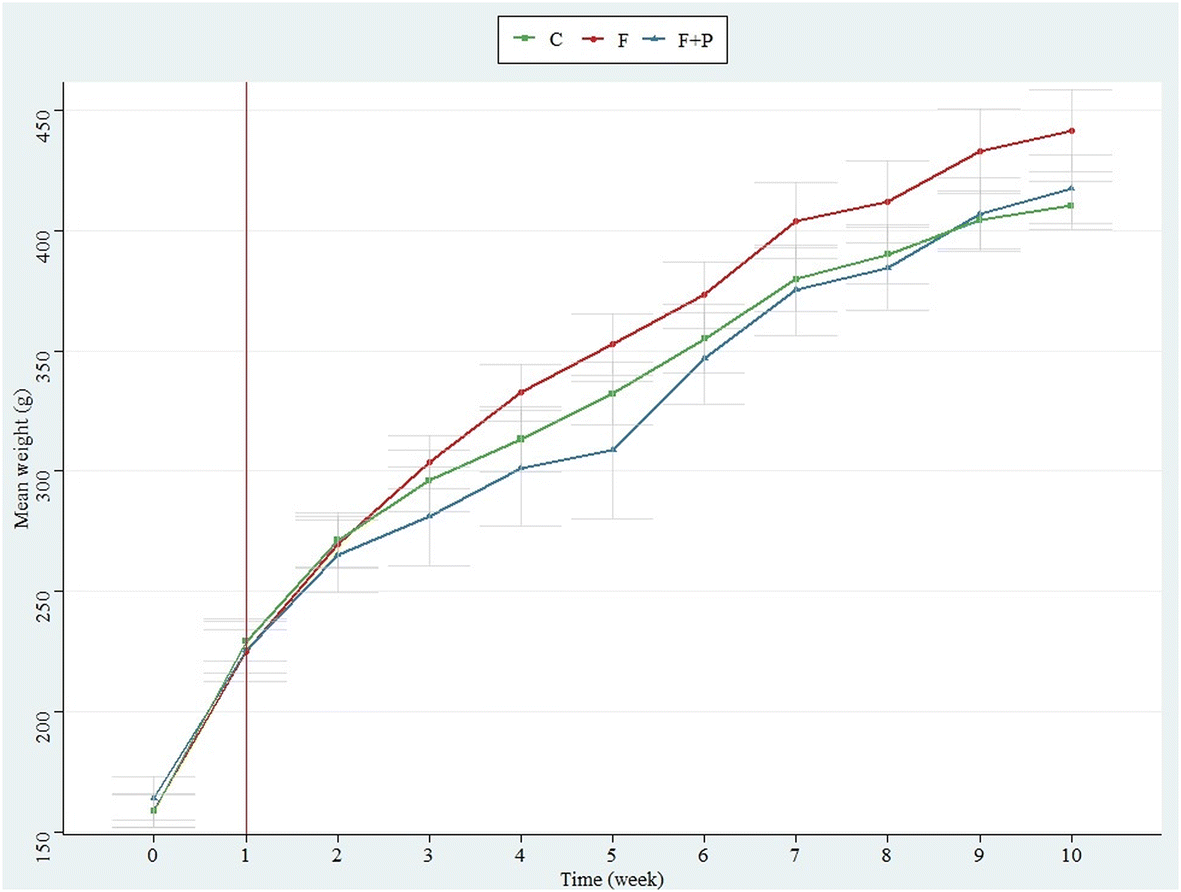 | ||
| Fig. 1 Evolution of the weight of the experimental animals fed with basal diet and either drinking water (C), 30% (w/v) fructose solution (F), or 0.2% (w/v) P in 30% (w/v) fructose solution (F + P) during the assay (10 weeks). Results are shown as means (dots) and standard deviations (error bars). No significant differences were found between groups at any of the points of assessment. | ||
| Feed energy (kJ day−1) | Fructose-solution energy (kJ day−1) | Total energy intake (kJ day−1) | |
|---|---|---|---|
| a Significance level in Kruskal–Wallis’ test with the effect of diet (C, F and F + P). *p < 0.05; **p < 0.01; ***p < 0.001. ns: not significant. Medians with different letters within the same column were significantly different in the multiple comparisons post hoc analysis with the Bonferroni correction applied (p < 0.05). | |||
| C | 96.58 [94.20] | 0.00b [0.00] | 96.58b [94.20] |
| F | 87.41 [81.63] | 41.54a [29.96] | 137.08a [88.40] |
| F + P | 78.31 [75.75] | 45.47a [31.90] | 129.28a [76.15] |
| p valuea | ns | *** | * |
On the other hand, Fig. 2 shows the weights of fat depots from experimental animals expressed as g per kg body weight. The BAT from C was equivalent to 1.81 g per kg body weight at the end of the experiment, while their WAT, expressed as the sum of both SAT and VAT, was 80.93 g per kg body weight. The consumption of fructose had a marked and significant lipogenic effect on all the fatty tissues analyzed, which were almost 2-fold significantly higher than those of their control counterparts (p < 0.001). However, this increase was more pronounced in the VAT (27.13 g per kg body weight increased; p < 0.001) than in the SAT (20.11 g per kg body weight increased; p < 0.001). Meanwhile, the fatty depots from F + P were significantly similar to those of their control counterparts. Hence, PU supplement counteracted the pro-adipose effect of fructose in Wistar rats.
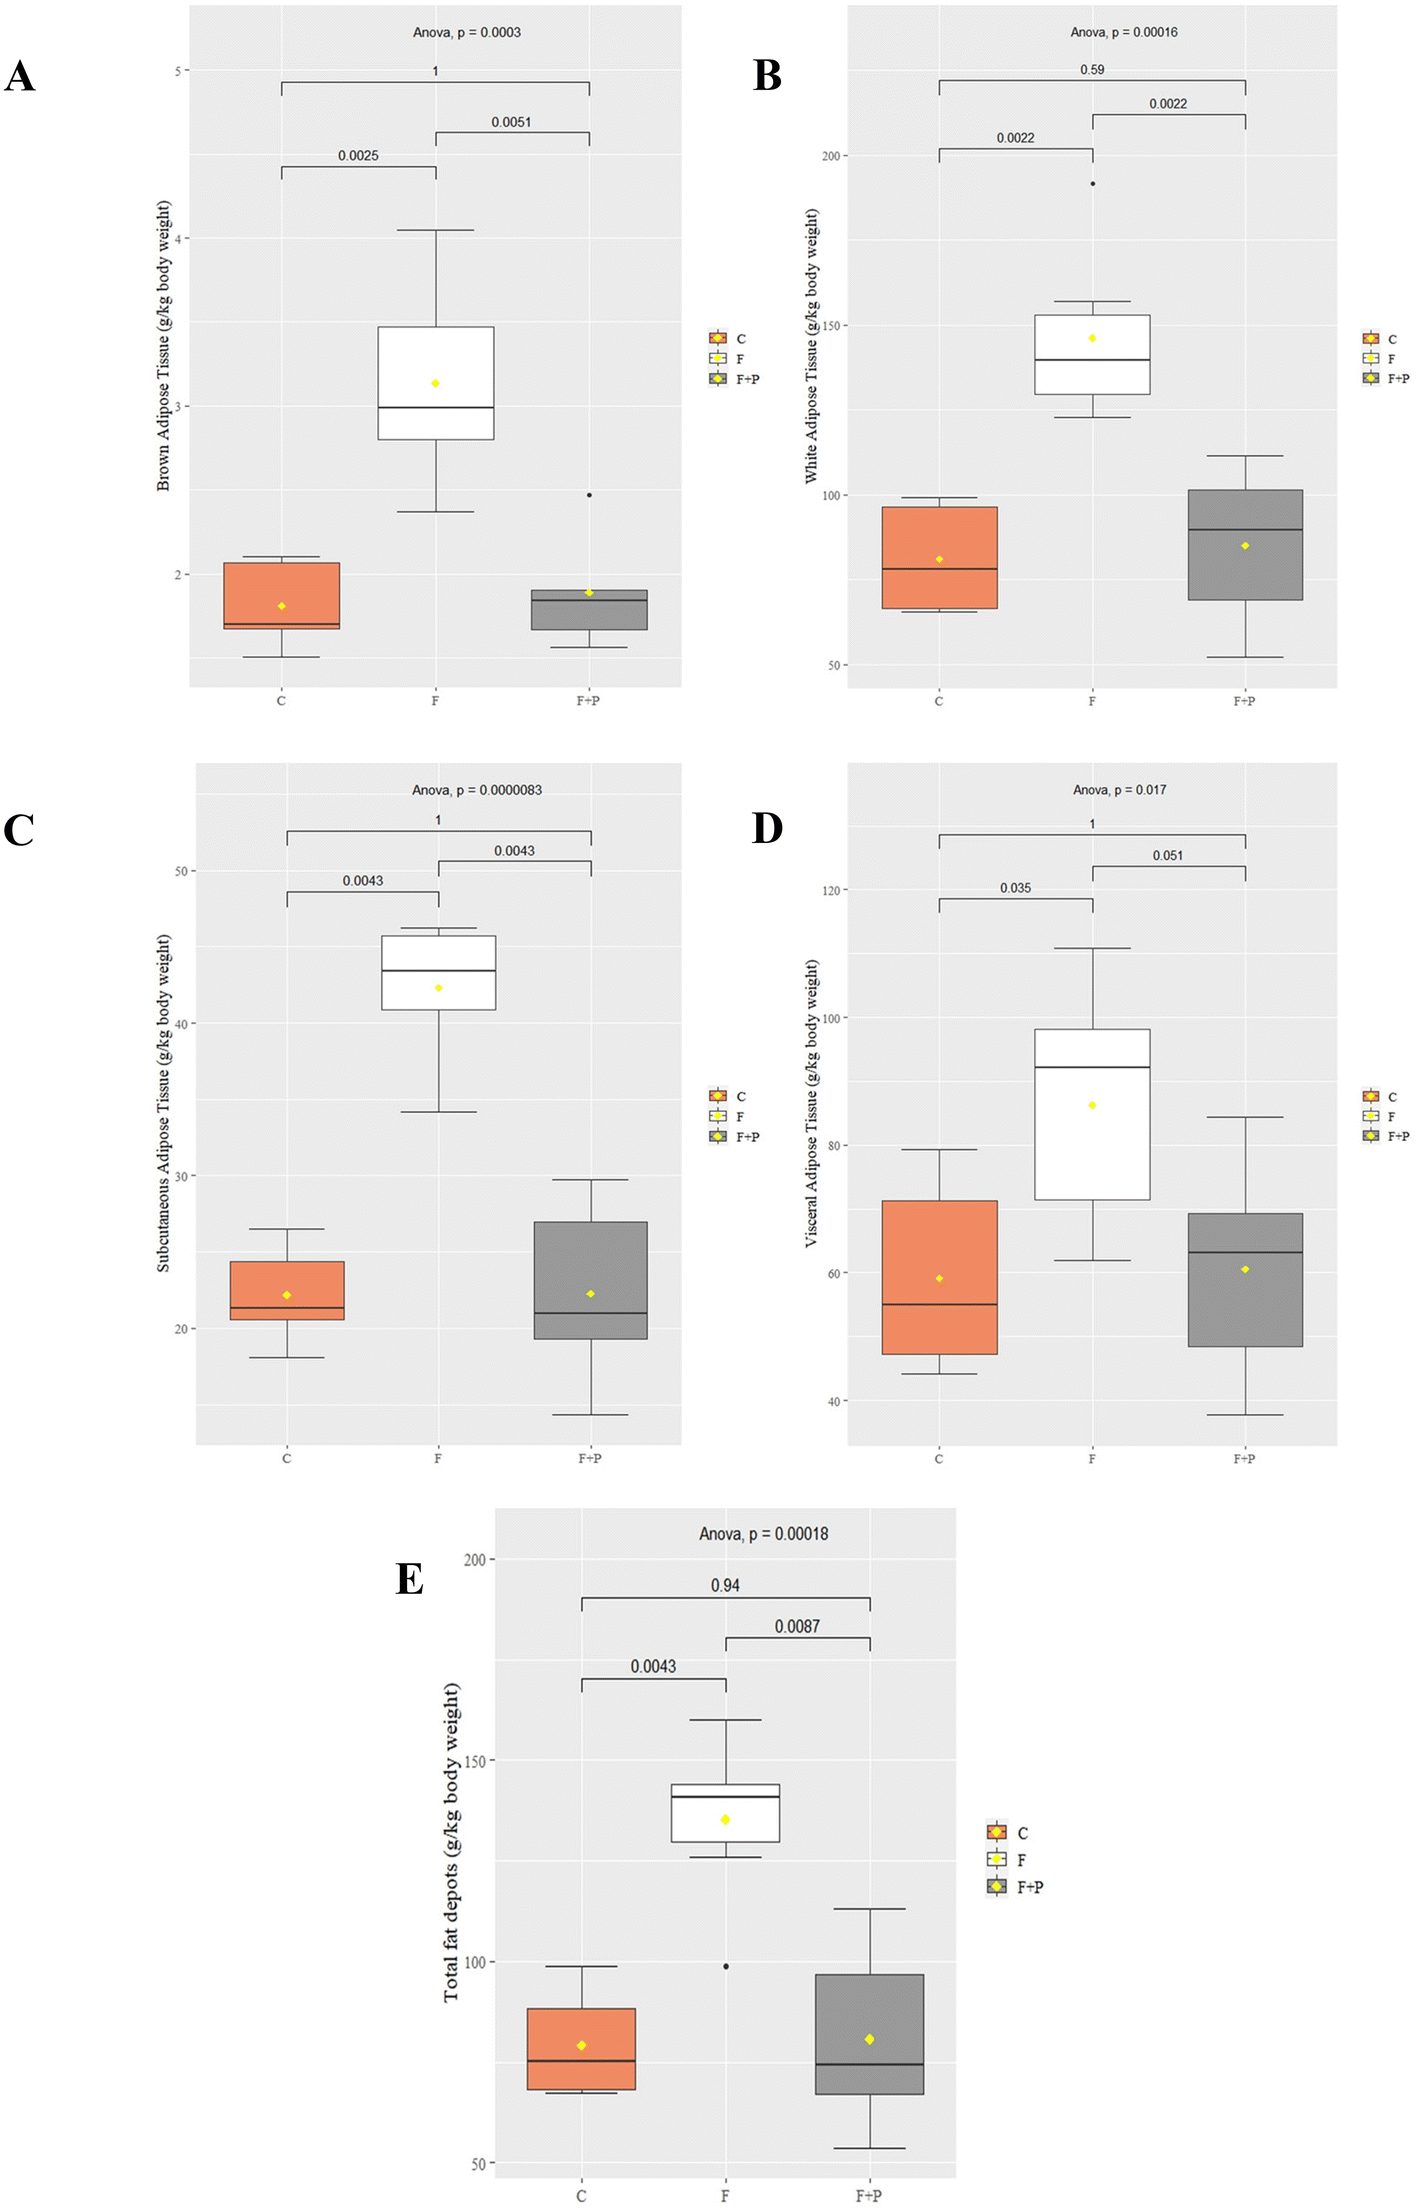 | ||
| Fig. 2 Weight of the different fat depots, namely, brown adipose tissue (A), white adipose tissue (B), subcutaneous adipose tissue (C), visceral adipose tissue (D) and total fat depots (E) collected during the necropsy of experimental animals. Wistar rats were fed with basal diet and either drinking water (C), 30% (w/v) fructose solution (F), or 0.2% (w/v) P in 30% (w/v) fructose solution (F + P). Results are shown as means (dots) and standard deviations (error bars). Significance values (p) from ANOVA and paired comparisons between dietary treatments (Tukey post hoc test) are displayed in figures. | ||
3.2. Plasma markers
Table 2 shows the results of the biochemical analyses made on the plasma from experimental rats fed with basal diet and drinking water (C), 30% fructose solution (F) or 0.2% P in a 30% fructose solution (F + P). The consumption of fructose promoted significant changes in some of the analyzed markers in contrast to C, such as increases in the concentrations of albumin (ALB) (2.59 g dL−1vs. 2.34 g dL−1 in C), phosphorus (3.80 mg dL−1vs. 3.30 mg dL−1 in C) and aspartate transaminase (AST) (48.96 U L−1vs. 25.46 U L−1 in C).| Parametera | C | F | F + P | p valueb |
|---|---|---|---|---|
| a Total protein content (TP); albumin (ALB); globulins (GLB), creatinine (CREAT), alkaline phosphatase (ALP); alanine transaminase (ALT); aspartate transaminase (GOT), triglycerides (TG). b Significance level in the ANOVA test with the effects of diet (C, F and F + P). *p < 0.05; **p < 0.01; ***p < 0.001; ns: not significant. Means with different letters within the same row were significantly different in the Tukey post hoc analysis (p < 0.05). | ||||
| TP (g dL−1) | 3.55b ± 0.40 | 3.93b ± 0.84 | 5.31a ± 1.03 | ** |
| ALB (g dL−1) | 2.34c ± 0.22 | 2.59b ± 0.44 | 3.03a ± 0.41 | * |
| GLB | 1.21b ± 0.26 | 1.34b ± 0.42 | 2.06a ± 0.28 | *** |
| CREAT | 0.43 ± 0.05 | 0.47 ± 0.10 | 0.54 ± 0.10 | ns |
| Urea (mg dL−1) | 21.78 ± 3.13 | 19.44 ± 4.02 | 22.58 ± 3.05 | ns |
| Phosphorus (mg dL−1) | 3.30b ± 0.56 | 3.80ab ± 0.88 | 4.76a ± 0.82 | ** |
| ALP (U L−1) | 3.83 ± 0.75 | 3.43 ± 1.27 | 3.29 ± 1.11 | ns |
| ALT (U L−1) | 13.67 ± 2.16 | 18.86 ± 6.79 | 16.86 ± 2.12 | ns |
| GOT (U L−1) | 25.46b ± 3.67 | 48.96a ± 11.08 | 31.00b ± 5.10 | *** |
| TG (mg dL−1) | 106.83 ± 28.34 | 143.14 ± 10.43 | 162.39 ± 62.09 | ns |
| Cholesterol (mg dL−1) | 76.00b ± 11.80 | 67.43b ± 5.35 | 90.00a ± 9.17 | *** |
| LDL (mg dL−1) | 8.33 ± 3.08 | 11.54 ± 3.17 | 8.54 ± 2.24 | ns |
| HDL (mg dL−1) | 68.90b ± 7.54 | 69.61b ± 9.88 | 84.40a ± 4.90 | ** |
| ALB/GLB ratio | 1.99b ± 0.37 | 2.03a ± 0.41 | 1.49b ± 0.22 | * |
| LDL/HDL ratio | 0.12b ± 0.04 | 0.17a ± 0.06 | 0.10c ± 0.02 | * |
| TG/HDL ratio | 1.55 ± 0.39 | 2.10 ± 0.37 | 1.91 ± 0.70 | ns |
The intake of P together with fructose also influenced the concentration of some biochemical markers. Thus, supplementation with P promoted increased amounts of total proteins (TP) (p < 0.01), ALB (p < 0.05) and globulins (GLOB) (p < 0.001), phosphorus (p < 0.01), cholesterol (p < 0.001) and HDL (p < 0.01) in the plasma of F + P rats as compared to the C and F counterparts. There was no significant difference in the concentration of GOT between F + P and C. However, the levels of the liver injury marker were significantly lower in the plasma of F + P rats than in those treated with fructose (p < 0.001).
3.3. Liver histopathology, hepatic fat content, and glycoxidative stress
Diagnosis evaluation of liver tissues is largely based on a thorough examination of sections stained with hematoxylin and eosin (H&E). Fig. 3 shows the most representative hepatic images from H&E staining. Fig. 3A and B correspond to C and F livers, respectively. As compared to the former, the latter shows multiple and larger size vesicle cells (namely cellular ballooning), while livers from F + P rats (Fig. 3C) show hepatic tissue with hardly any vesicle cells. The images also show the hepatic fat content of each group of animals, expressed as g fat per 100 g liver tissue (%). The hepatic fat content of C rats was 1.80%, while the amount of lipid depots in rats exposed to drinking fructose was increased to 4.28% (p < 0.001). On the other hand, the hepatic fat content of F + P rats was 1.61%, with these values being statistically similar to the liver fat deposit in C rats.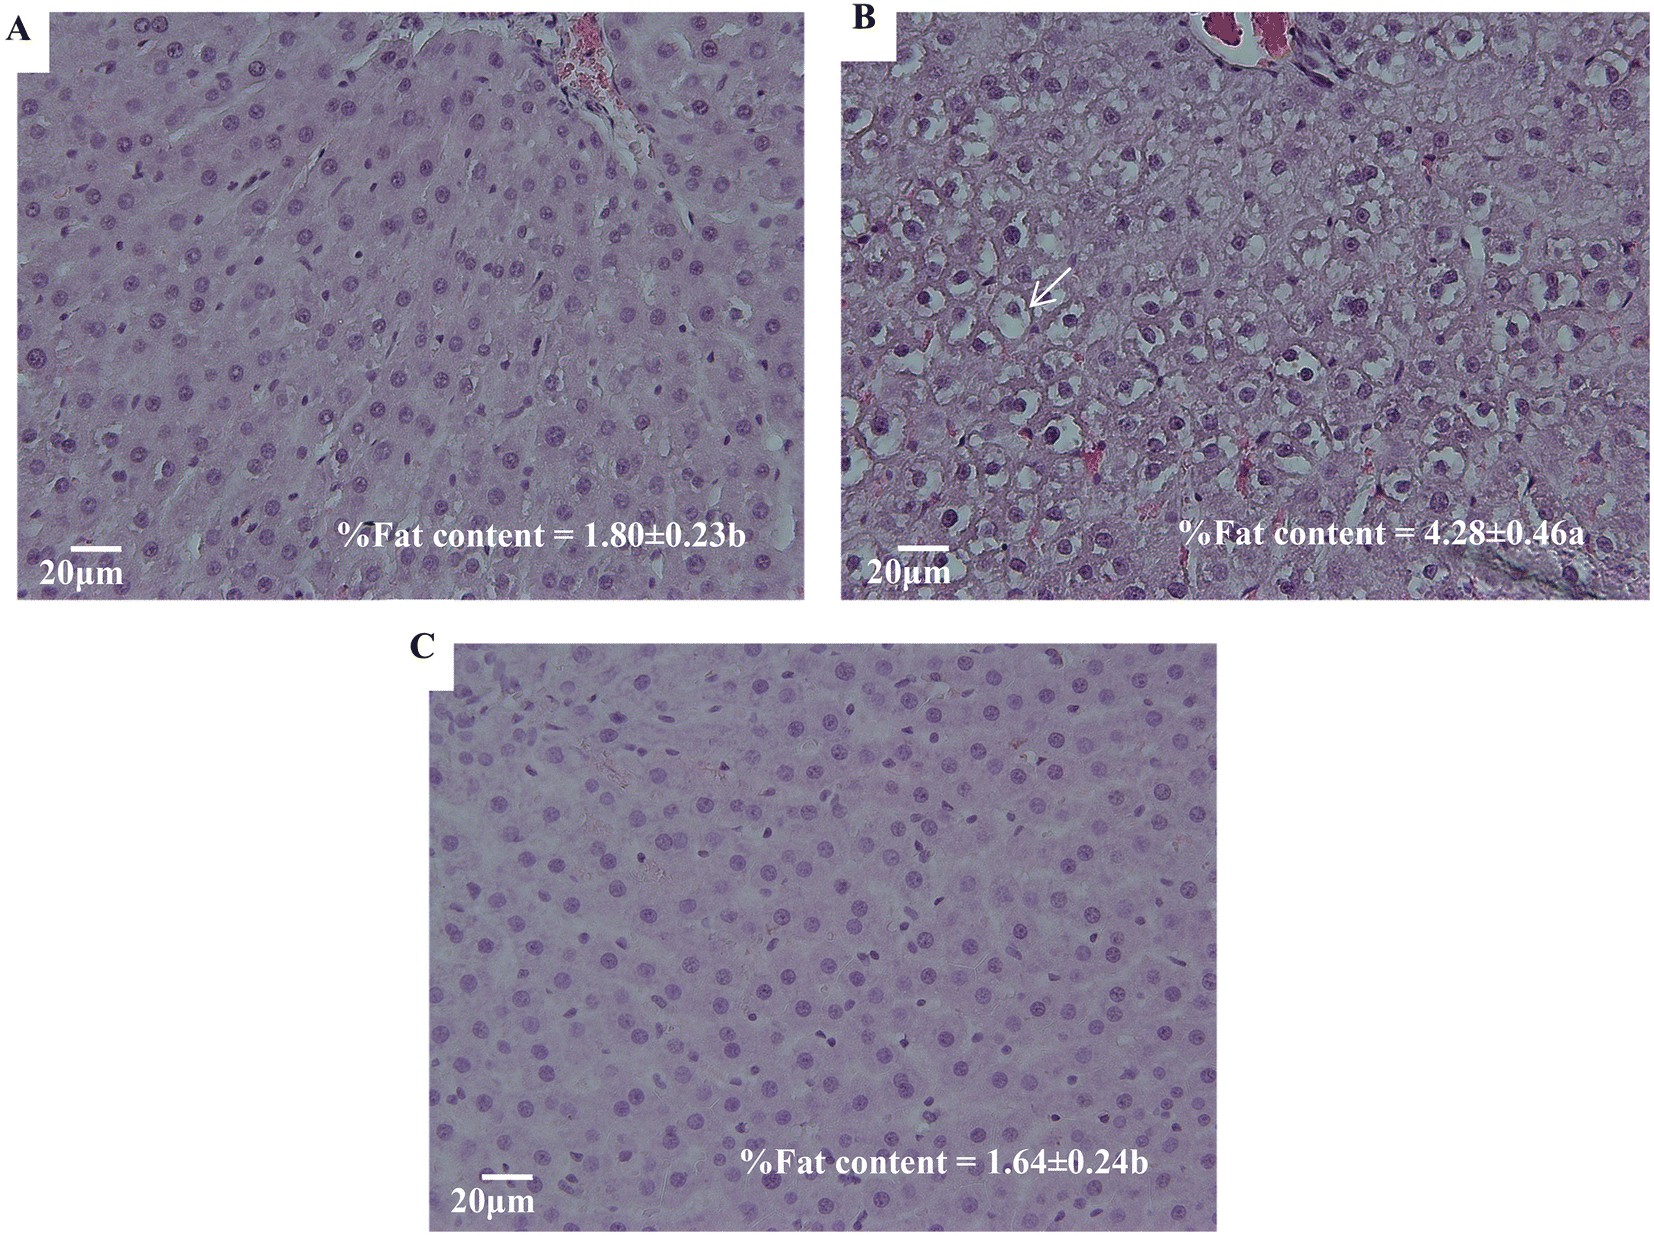 | ||
| Fig. 3 H&E-stained histological images and hepatic fat contents (means ± standard deviations) expressed as g fat per 100 g liver of livers from the experimental rats: (A) control group, (B) fructose group, and (C) fructose + P group. Figures A and C show conserved hepatic structure and nuclei-centered cells with a sharp nuclear membrane and scarce vacuolization. Figure B shows disorganized hepatic cords and severe vacuolization in cells (arrows in B). Significance level in ANOVA test with the effects of diet (C, F and F + P) on the liver's fat concentration = p < 0.001. Means with different letters were significantly different in multiple comparisons post hoc analysis (p < 0.05). | ||
In order to evaluate additional pathophysiological features in the microscopic images, they were analyzed for the occurrence of apoptosis, necrosis, intrahepatic biliary dilation, infiltration and edema. Fig. 4 shows the percentage of each event occurring in the liver cells of each group. Fructose intake significantly increased hepatic cell apoptosis, necrosis, intrahepatic biliary dilation and infiltration as compared to livers from C rats (p < 0.001). Meanwhile, in livers from F + P rats, the drinking solution significantly promoted higher hepatic cells necrosis, infiltration and edema as compared to the livers from the C counterparts (p < 0.001). However, the presence of P in the fructose drinking solution decreased hepatic cell apoptosis and dilation compared with livers from C rats. Compared to F, F + P significantly showed lower occurrences of hepatic cell apoptosis, necrosis, dilation, and infiltration, but instead the occurrence of cell edema in F + P was higher than that in F (p < 0.001).
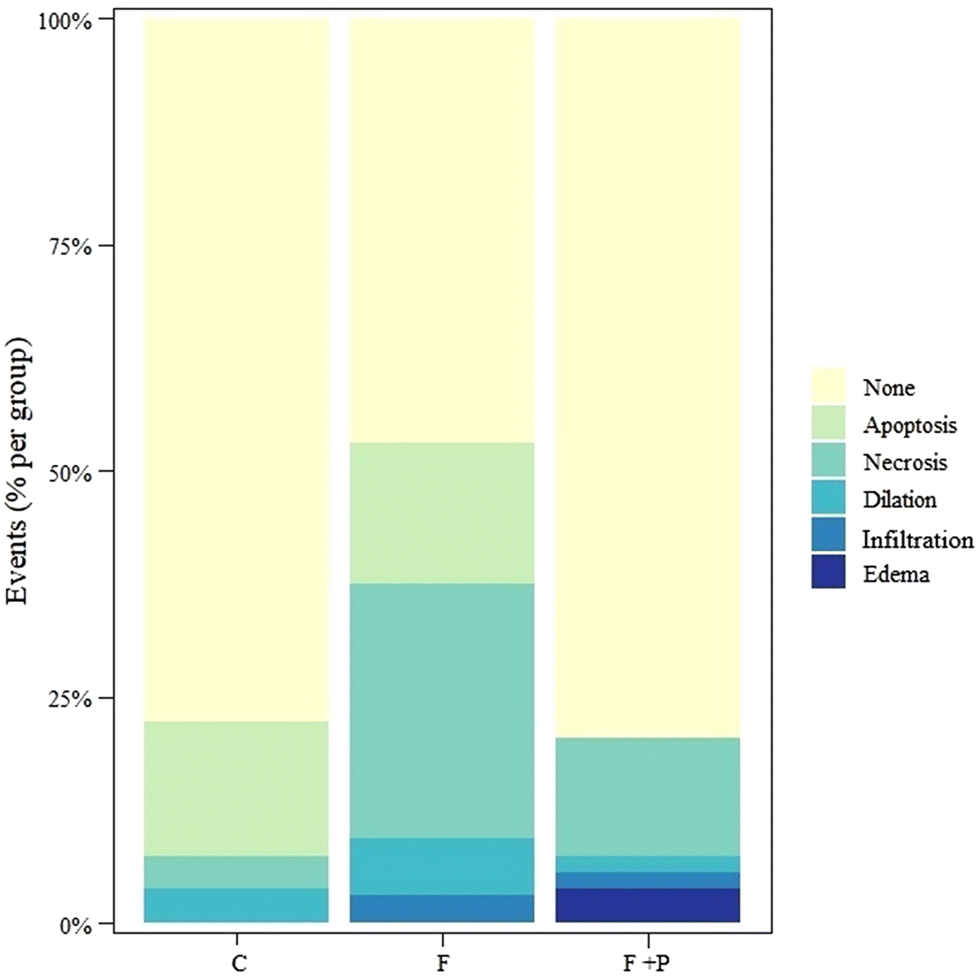 | ||
| Fig. 4 Percentage of qualitative events in the livers of rats fed with basal diet and drinking water (C), 30% (w/v) fructose solution (F), or 0.2% (w/v) P in 30% (w/v) fructose solution (F + P). aInfiltration of immune cells. | ||
Fig. 5 shows the most representative images from CD45 staining of the hepatic tissues, which promotes blue fluorescence from immunoglobulins, and red fluorescence from CD45+ cells. Fig. 5A shows a hepatic region from C rats, while Fig. 5B and C correspond to a hepatic section from F and F + P rats, respectively. The images also show the immunological cell count results from each group of animals (i.e., CD45 cells, lymphocytes and macrophages counts), and show that the intake of fructose significantly increased the amounts of inflammatory and immunological cells (Fig. 5B) compared to C and F + P.
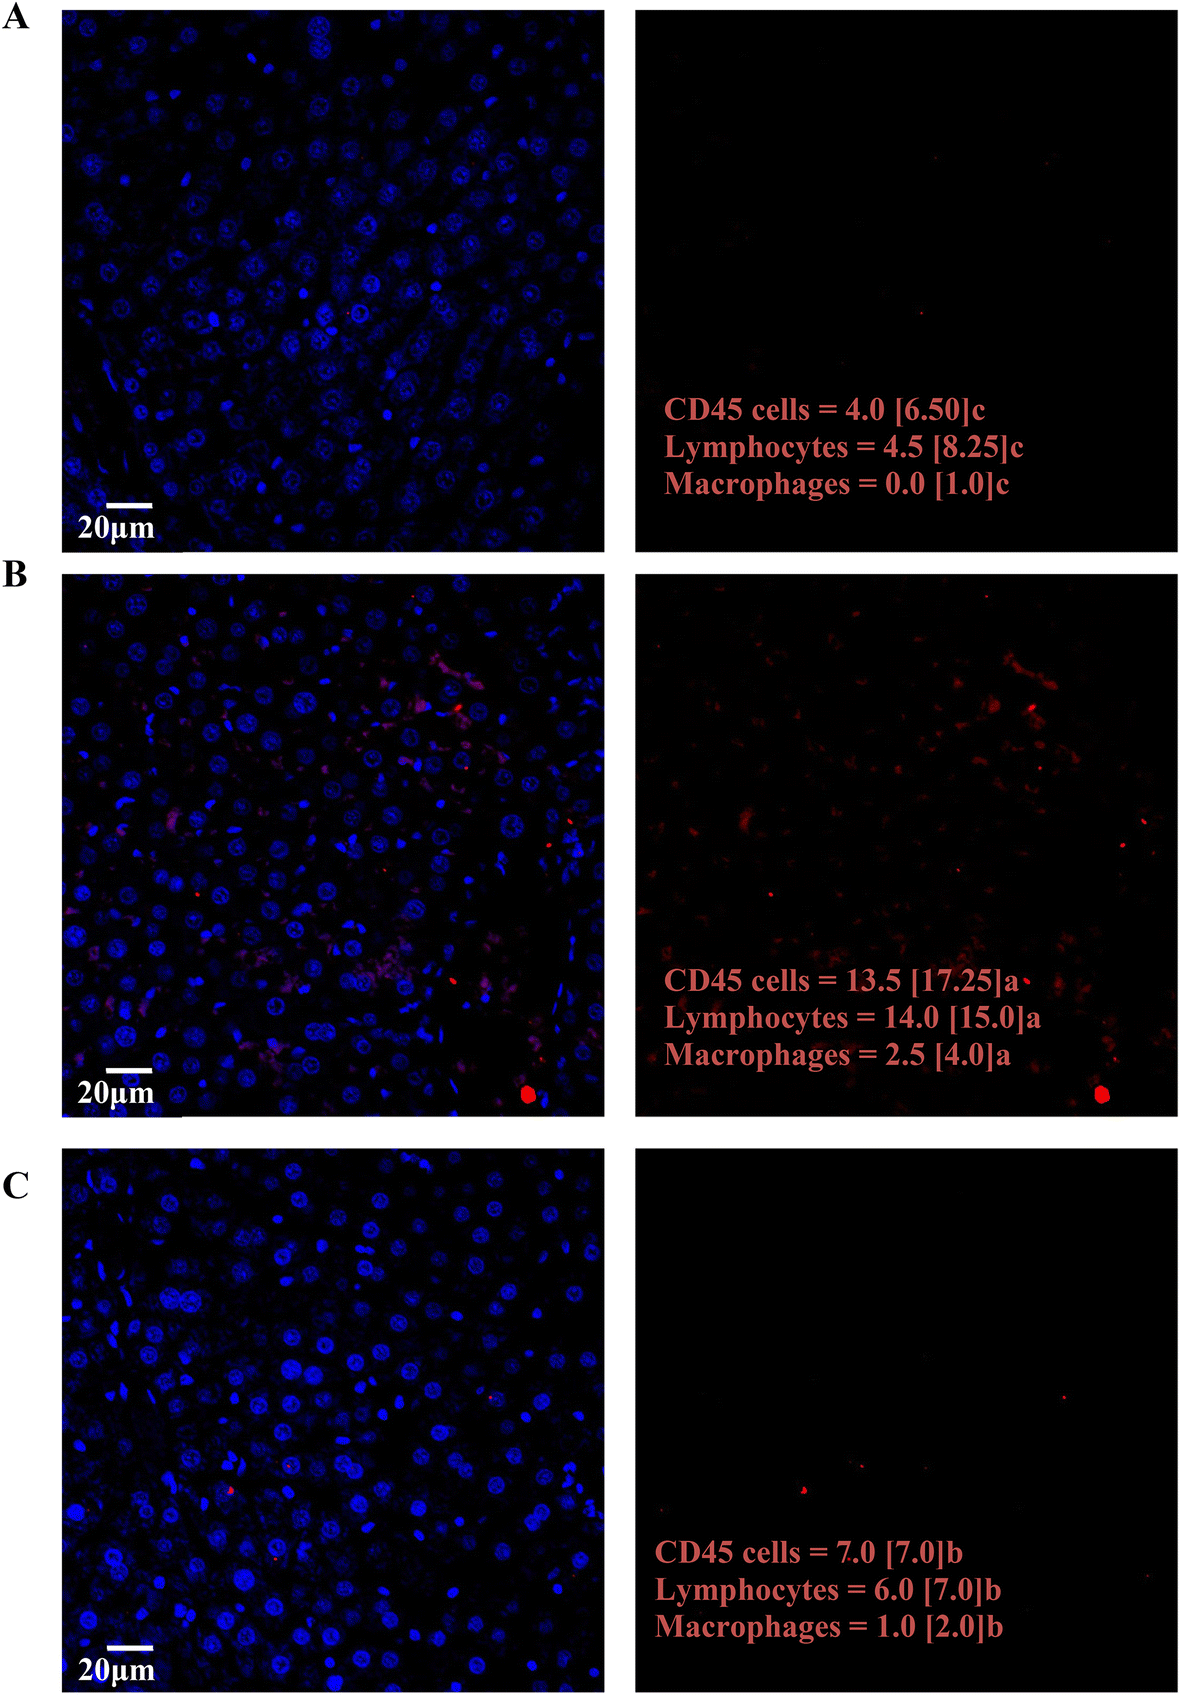 | ||
| Fig. 5 CD45-stained histological images and cell counts (CD45 cells, lymphocytes, and macrophages) in the livers from the experimental rats: (A) control group, (B) fructose group, and (C) fructose + P group. Significance level in the Kruskal–Wallis test with the effects of diet (C, F and F + P) on the liver's immunological cells counts = p < 0.01. Medians with different letters were significantly different in multiple comparisons’ post hoc analysis (p < 0.05). | ||
In addition to the histological assessment, the pathophysiological damage to the livers of Wistar rats caused by drinking fructose was also evaluated by the detection and quantification of markers of glycoxidative stress. Table 3 shows the concentrations of α-AS and γ-GS as total primary protein carbonyls (PPC) and pentosidine in the livers of the experimental rats. The hepatic level of α-AS of C was 0.63 nmol carbonyl per mg protein. The intake of fructose and fructose with P promoted significant lower levels of α-AS in the livers of the rats compared with their control counterparts (p < 0.01). The hepatic concentration of γ-GS was 0.08 nmol carbonyl per mg protein in C. When fructose solution was ingested, the amounts of the carbonyl were higher than those found in the livers from C rats (p < 0.001). However, supplementation with P in rats drinking fructose promoted a significantly lower production of the semialdehyde in the livers of F + P rats than in those from C and F rats (p < 0.01). Considering the PPC as an expression of the sum of both semialdehydes, the results showed that when the rats consumed the fructose solution, there was no significant change in the concentration of PPC between the livers, irrespective of the dietary treatment. However, P promoted a significant decrease in the amounts of PPC in the livers from F + P rats as compared to those from both C and F rats (p < 0.001).
| α-ASa (nmol carbonyl per mg protein) | γ-GSb (nmol carbonyl per mg protein) | PPCc (nmol carbonyl per mg protein) | Pentosidine (fluorescence units) | |
|---|---|---|---|---|
| a α-Amino adipic semialdehyde. b γ-Glutamic semialdehyde. c Total primary protein carbonyls. d Significance level in one-way ANOVA test with the effects of diet (C, F and F + P). *p < 0.05; **p < 0.01; ***p < 0.001; ns: not significant. Means with different letters within the same column were significantly different in the Tukey post hoc analysis (p < 0.05). | ||||
| C | 0.63a ± 0.12 | 0.08b ± 0.01 | 0.71a ± 0.13 | 0.61c ± 0.11 |
| F | 0.48b ± 0.07 | 0.10a ± 0.02 | 0.58a ± 0.07 | 2.57a ± 0.40 |
| F + P | 0.37b ± 0.14 | 0.04c ± 0.02 | 0.42b ± 0.15 | 1.30b ± 0.40 |
| p valued | ** | *** | *** | *** |
Pentosidine is a marker of advanced protein glycation processes. Table 3 reveals that in the livers from C, the levels of pentosidine reached 0.61 fluorescent units. Fructose treatment significantly promoted the highest hepatic formation of pentosidine (2.57 fluorescent units) (p < 0.001). In the livers from F + P rats, the concentration of pentosidine also suffered a significant increase compared to C, but the levels of pentosidine in F + P livers were lower than those from their F counterparts.
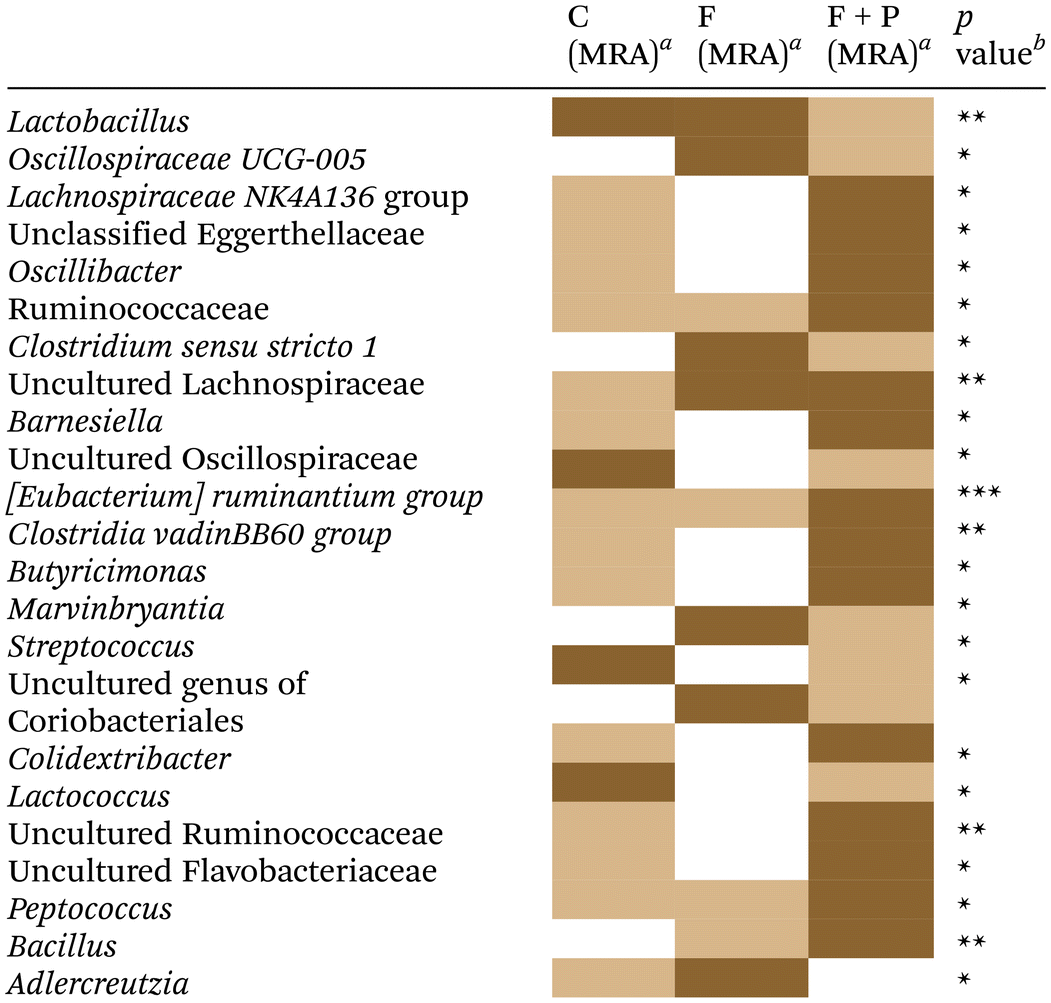
3.4. Fecal microbiota
The fecal microbiome from experimental rats was analyzed to assess the extent to which PU supplementation could revert (or worsen) the already known impact of dietary fructose on the microbiota of Wistar rats.5Table 4 shows the significant changes in the relative abundances of some microorganisms that were detected at the genus level among the different groups of rats. Compared to C, the microbiome of F was characterized by a significant increase in uncultured Lachnospiraceae species and Adlercreutzia spp. Instead, the intake of P significantly modified the microbiome of F + P more than the consumption of the fructose solution alone (F), with respect to their control counterparts. Thus, the microbiome of F + P (vs. C) was characterized by increases in Lachnospiraceae NK4A136 group spp. (p < 0.05), unclassified Eggerthellaceae spp. (p < 0.05), Oscillibacter spp. (p < 0.05), Ruminococcaceae spp. (p < 0.05), uncultured Lachnospiraceae (p < 0.05), Barnesiella spp. (p < 0.05), [Eubacterium] ruminantium group species from Lachnospiraceae family (p < 0.001), Clostridia vadin BB60 group spp. (p < 0.01), Butyricimonas spp. (p < 0.05), Colidextribacter spp. (p < 0.05), uncultured Ruminococcaceae (p < 0.01), uncultured Flavobacteriaceae (p < 0.05) and Peptococcus spp. (p < 0.01). Likewise, P in F-treated rats significantly promoted decreases in some microorganisms that occurred in C, such as Lactobacillus spp. (p < 0.01), uncultured Oscillospiraceae spp. (p < 0.05), Streptococcus spp. (p < 0.05) and Lactococcus spp. (p < 0.05).| a Median relative abundance (MRA) (data not shown) with different intensities of brown colour within the same row were significantly different in the multiple comparison post hoc analysis (p < 0.05): saturated brown: highest MRA; degraded brown: lower MRA; white: no significant group in pair-comparisons. b Significance level in Kruskal–Wallis’ test with the effects of water supplement in almost two of the groups: C, F and F + P. *p < 0.05; **p < 0.01; ***p < 0.001; ns: not significant. |
|---|
|
Finally, species from the family Ruminococcaceae (p < 0.01), [Eubacterium] ruminantium group species from Lachnospiraceae family (p < 0.001), Peptococcus spp. (p < 0.05) and Bacillus spp. (p < 0.01) showed a significant increase in their relative abundance in the microbiome of F + P as compared to F. Other species such as Oscillospiraceae UCG-005 group spp., Clostridium sensu stricto 1 spp., Marvinbryantia spp. and uncultured genus of Coriobacteriales species showed a significant decrease in the microbiota of F + P rats compared with the F counterparts (p < 0.05, respectively).
3.5. Non-targeted metabolomics of urine
The Compound Discoverer software paired compound names and/or formulas with the calculated weights of the detected molecules using different databases (i.e., AKos, BioCyc, Chemspace, FooDB, Human Metabolome Database, KEGG, LipidMAPS, Mcule, Nature Chemical Biology, Nature Chemistry, NPAtlas, Toxin, Toxin-Target Database and Urine Metabolome Database). According to the rutinary calibration and optimization of the equipment, as well as our metabolite extraction method, the identification and characterization (Table S2 of the ESI†) of the metabolites belong to level 2 of the identification levels proposed by the published metabolomics literature.21In order to analyze the results, the peak intensities of the hepatic metabolites were compared using Metaboanalyst software (https://www.metaboanalyst.ca/). More than two thousand (2052) metabolites were revealed by the untargeted metabolomic analysis of urine from C, F and F + P Wistar rats. The PCA analysis (Fig. 6A) clearly positioned the urine metabolome of F + P rats on a discriminating cluster where urine metabolomes from C and F were found to be located.
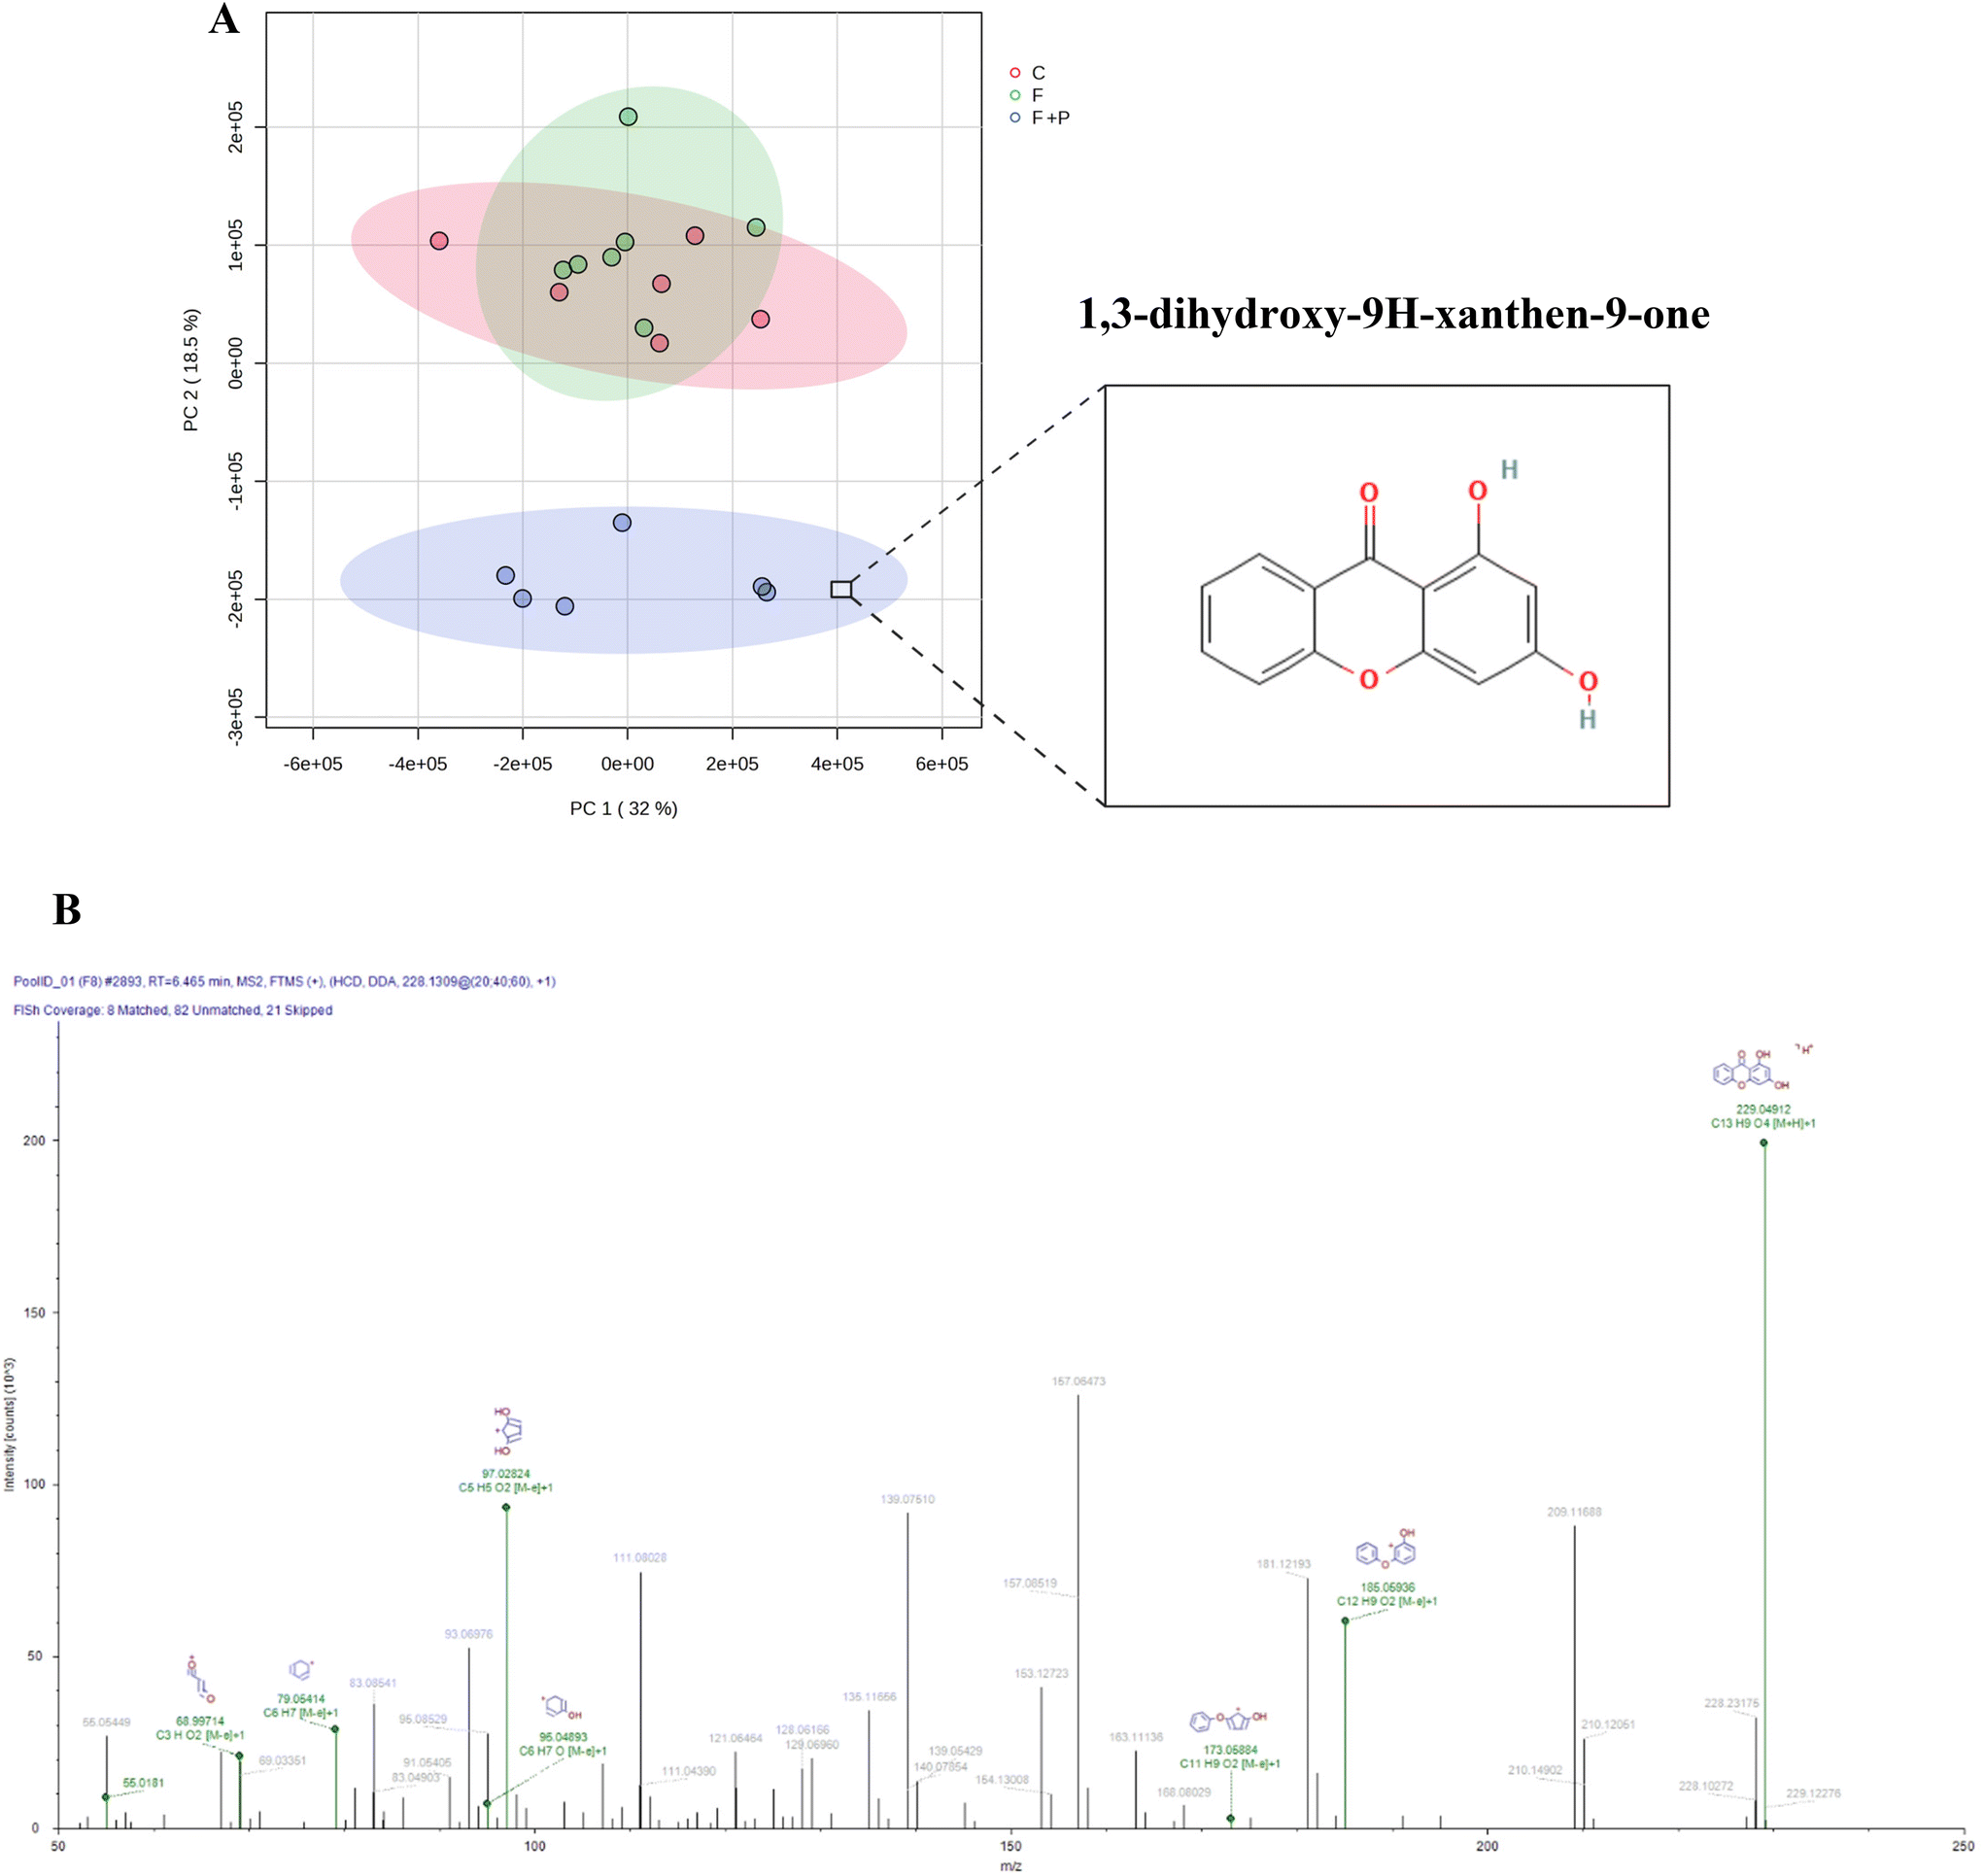 | ||
| Fig. 6 Score plot (A) from the PCA analysis of full metabolome data from urine from rats fed with a basal diet and drinking water (C), 30% (w/v) fructose solution (F), or 0.2% (w/v) P in 30% (w/v) fructose solution (F + P). The location of a punicalagin-derived metabolite responsible for the clustering is denoted in (A). The fragmentation pattern of this metabolite is shown in (B). | ||
The one-factor ANOVA statistical analysis revealed 214 metabolites affected by the different supplementations in the urine from C, F and F + P animals (ANOVA from ESI (2)†). Compared to C, the urine metabolome of F showed increased amounts of benzamide (p < 0.001), indoline (p < 0.01) and norleucine (p < 0.001), among other metabolites. Meanwhile, some metabolites from F urine, such as biotin (p < 0.001), coumarin (p < 0.001) and tryptophol (p < 0.01), were significantly decreased with respect to C.
The supplementation with P in F-treated Wistar rats promoted significantly higher amounts in urine of 1,3-dihydroxy-9H-xanthen-9-one (103-fold higher) (p < 0.001) and uric acid (p < 0.01) than in urine from C rats. On the other hand, some metabolites showed lower quantities in the urine from F + P than their control counterparts, such as biotin and coumarin (p < 0.001, respectively).
Likewise, the urine metabolome of F + P (vs. F) highlighted higher abundances of 1,3-dihydroxy-9H-xanthen-9-one (p < 0.001), dihydrouridine (p < 0.01) and tryptophol (p < 0.01), among others. Meanwhile, the presence of P in F-treated rats led to a decrease of some urine metabolites found in F, i.e., benzamide (p < 0.001), indoline (p < 0.01), norleucine (p < 0.001) and uric acid (p < 0.01).
4. Discussion
The current experiment is part of a larger investigation on the metabolic impairments caused by fructose consumption and the plausible counteracting effects of a punicalagin-rich pomegranate commercial supplement. As expected, fructose promoted an increase in fat depots, hepatic fat content and glycoxidative stress, as well as inflammatory and immunological responses in Wistar rats that consumed 30% fructose in drinking water for 10 weeks. Following the recommendation to reduce sugar intake to less than 5% of the total energy intake seems to be reasonable.1 The hypothesis formulated on the potential health benefits of the punicalagin-rich pomegranate supplement under study was proved correct as such a supplement was found to counteract lipid deposition, dyslipidemia and fatty liver in Wistar rats and could be a supportive complement to pharmacological treatments aimed to control obesity, liver steatosis and MetS.4.1. Fructose intake, dyslipidosis, obesity and liver steatosis
There is extensive literature that relates an excessive fructose consumption to the onset of several dysmetabolic features related to lipid and energy metabolism dysfunction, such as obesity, hypertension, hypertriglyceridemia, T2DM, insulin resistance, hyperuricemia, visceral adiposity and NAFLD, which are included in the spectrum of pathological conditions ascribed to the MetS.3,22,23Intestinal and hepatic fructolysis could per se promote increased triose-phosphate pools in the liver, common to both glycolytic and gluconeogenesis processes, as well as to pathways related to lipid metabolism.3 This metabolic pathway appears to be the most remarkable molecular mechanism by which fructose promotes disturbances of energetic metabolism. Moreover, the passing of fructose through the gastrointestinal tract and disturbance caused to the microbiota could also contribute to the above-mentioned pathophysiological effects, while this latter microbiome-mediated mechanism may be little understood.
The impaired lipid metabolism associated with fructose consumption could have triggered an increase of adiposity. The distribution of fat between the different locations seems to be more important than the total adipose tissues for the risk of developing obesity-associated diseases.24 The role of WAT is to store excess dietary fat in the form of triglycerides (TGs) and to release free fatty acids (FFAs) in times of starvation or energy demand. As a source of energy substrate, WAT responds to variations in the nutritional status and energy demand of the body.25 WAT is found in both SAT and VAT. While SAT is associated with improved or preserved insulin sensitivity, mitigated risk of developing type II diabetes and other metabolic derangements, VAT is associated with an increased risk of insulin resistance and dyslipidemia. It is an independent risk factor for T2DM, hypertension and all-cause mortality.15 Meanwhile, BAT, as a thermogenic adipose tissue that dissipates energy as heat, is associated with improvements in circulating triglycerides and insulin sensitivity, among other beneficial effects.26
Based on a previous review,15 we grouped the fat tissues from the experimental animals into WAT, which included SAT and VAT, and BAT, depending on their body location. Even though several assays have related fructose supplementation to increased body weight,27–29 our results suggest that the high fructose intake did not affect differently the body weight of the animals at the end of the experiment (Fig. 1), in line with other researchers.30,31 However, the results showed a significant increase of all fat depots, apparently due to the high fructose intake (Fig. 2), which also increased the total energy consumption of F (Table 1).
Similar studies concluded that fructose consumption increased different fat depots, despite the differences in the experimental designs of the supplementation (12% and 20% of fructose, respectively) and the analyzed fat tissues (BAT was not included).30,32 Knowledge about the impact of fructose intake on BAT is scarce. The increase of the BAT weight shown in our experiment could be related to beneficial outputs, but the increase of BAT did not necessarily imply an increase of its activity, which is what several researchers highlighted in their works.33,34 The authors reported that fructose intake could impair the potential of the tissue for glucose uptake and thermogenesis, which was related to fructose-induced metabolism.
Ectopic lipid accumulation is promoted by nutritional imbalances.35 Altered lipid metabolism might also imply increased amounts of infiltrated fat in the liver. Early studies in this field established the existence of a form of non-alcohol related chronic hepatitis characterized by fatty infiltration of the liver with inflammation, cellular injury evident by inflammation, cellular ballooning and fibrosis.36 Our hematoxylin and eosin (H&E)-stained histopathological images allowed us to see that, certainly, the hepatic tissues of F had more numerous and bigger vesicle cells than C, as well as higher hepatic fat contents, as markers of lipidosis (Fig. 3B). Our results are in line with what is already described in the literature.2,27,31,34,37 Some of the authors reported >5% of the hepatic fat content analyzed by H&E stain as an expression of NAFLD with high fructose consumption, due to the activation of the lipogenic pathway and the absence of a regulatory mechanism of fructose metabolism, as fructolysis is an insulin-independent process.34 Moreover, they suggested that the activation of lipogenic pathways is time and dose dependent, but other factors could explain why other researchers did not see the lipogenic effect in their experiment,38 with the lack of the expected results related to the degree of stress experienced by the animals. Thus, although the hepatic fat content of the livers from F was lower than 5%, our results suggest an increasing fat deposition in the livers of rats that were supplemented with 30% fructose in drinking water for 10 weeks. It is important to note that fatty livers, as a benign state of liver disease, are more vulnerable to injury from various causes, increasing the probability of progressing to later stages of the disease.31
Circulating TG, LDL and total cholesterol in the blood stream are increased by intestinal and hepatic fructolysis as an expression of altered lipid metabolism, which will eventually lead to insulin resistance and hyperglycemia27,39 Surprisingly, our results revealed a non-significantly increased trend of the levels of the markers in the plasma from F compared to C. However, when the concentration of HDL was considered in the LDL/HDL ratio, the marker reached the significantly highest levels in the plasma from F, in agreement with knowledge of the role of fructose on the overproduction of hepatic LDL vs. the underproduction of HDL.39
4.2. Plasma markers of fructose damage
Regarding plasma markers, the two main proteins in the blood are albumins and globulin. Albumins are the most abundant proteins in the blood plasma and transport substances such as hormones, fatty acid and drugs, being in humans the primary transport mechanism for fatty acids, bilirubin and other plasma compounds.40 Moreover, albumin plays a role in the maintenance of the redox state of blood. Meanwhile, globulin proteins are made by the immune system and indicate the state of the immune function and the severity of any inflammation. The biochemical profile of plasma from F rats showed increased amounts of albumins and non-significant changes in the concentration of GLOB, so the ALB/GLOB ratio was statistically higher in the plasma from F than that from C (Table 2). The increase in the plasma protein levels could be related to its role in fatty acid transport, as the other results of the experiment highlighted an impaired hepatic lipid metabolism in F rats. Likewise, high albumin levels could be caused by a physiological response related to antioxidant defense. Moreover, these results are in line with those of other authors who analyzed several serum markers of Wistar albino rats after two different supplementations of fructose in drinking water, and concluded that the intake of fructose promoted increased amounts of albumin in the animals’ serum.41 The plasma ALB/GLOB ratio is used to clinically diagnose impairments of liver and kidney functions, and decreased amounts of ALB are associated with inflammation and advanced states of liver injury.42 So, we would conclude that despite the changes in the marker's concentration, it was not indicative of a consolidated induced severe liver damage but might be indicative of impaired lipid metabolism, increased glycoxidative stress and an early stage of lipid steatosis. In fact, the liver damage caused by fructose consumption was clearly noted. The most remarkable change in the plasma of F rats was the increase of the concentration of GOT (also known as AST), which is used in combination with other enzymes like ALT to monitor the course of liver disorders. The increased levels of GOT in the plasma of F rats in the biochemical analysis distinctively illustrates liver damage, which is manifested as the release of liver enzymes (Table 2).434.3. Immunological response to fructose consumption
Fructose has been profusely studied in relation to the mechanisms involved in glycoxidative stress for its ability to generate both reactive oxygen species (ROS) and reactive carbonyl species (RCS) during metabolism. In vivo experiments of high fructose consumption have reported AGE accumulation in different tissues in association with peripheral insulin resistance and lipid metabolism alterations.44In a previous work, our group revealed for the first time an increased accumulation of advanced protein oxidation products (APOPs) on gastrointestinal tissues after fructose digestion for a plausible previous in situ glycation process of proteins in the lumen.5 In the current one, we found that the consumption of high amounts of fructose also increased the accretion of pentosidine on hepatic tissue (Table 3), in line with other assays that revealed a hepatic increase of AGEs as expression of a rise in glycoxidative stress in this organ.39,45 The role of PPC as precursors of AGEs could explain the lack of significant changes in the concentration of these markers in the livers from F rats compared to the C counterparts. The clearance of fructose in the liver would promote glycoxidative stress, which may contribute to intracellular damage to DNA and pro-inflammatory responses. The formation of AGEs can trigger inflammatory pathways through the activation of some signaling pathways independently of caloric intake and weight gain.46
It has been demonstrated that fructose-induced metabolic impairments are closely related to inflammation, characterized by increased inflammation signaling activation in organs such as the liver.47 The development of NAFLD in mice chronically fed a fructose diet was associated with increased endotoxin levels in portal blood for a decrease in tight junction proteins in the upper part of the small intestine, which would have activated inflammatory responses.31,48 In line with this, the microscopic observation of the liver from experimental animals showed significantly higher infiltration of immunological cells (CD45+, macrophages, and lymphocytes) in F animals. Consistently, additional pathological microscopic signs of liver damage such as apoptosis, necrosis, edema, microtubule distension, etc. were found more often in livers from F rats than in those from C rats (Fig. 4), illustrating the connection between fructose intake, glycoxidative stress, AGE accumulation, liver damage and inflammation.
4.4. Positive outputs from punicalagin-rich commercial pomegranate-extract consumption
To our knowledge, the present study highlights for the first time the potential beneficial effects of supplementation with a pomegranate commercial extract on the pathophysiological impairments associated with high fructose consumption. Considered as a functional food, pomegranate (Punica granatum) is one of the oldest fruits involved in a growing number of studies that analyze the bioactive properties of pomegranate polyphenols, such as punicalagin (PU) and ellagic acid (EA), which have been extensively studied in the last years for their functional activities.8–10,49Moreover, pomegranate has been used in the prevention and treatment of MetS in recent decades, and the effect of pomegranate on lipid metabolism related to atherosclerosis, T2DM and NAFLD, as well as on oxidative status, was described in detail in an interesting review.50 This paper draws attention to PU and EA as the main actors involved in the bioactivities displayed by this fruit.
Thus, the consumption of P in a fructose solution appears to decrease the adipogenic effect of high fructose intake, significantly diminishing the mean weight of adipose tissues from F + P compared to those from F, i.e., BAT, WAT, SAT, VAT and total fat depots (Fig. 2). Moreover, the H&E images showed an improvement in F + P hepatic tissues (Fig. 3C), which in fact contained a lower content of fat than their F counterparts. Moreover, the biochemical markers ALB/GLOB, LDL/HDL, or GOT were also stabilized close to the control values in the plasma from F + P.
Some studies have shown that pomegranate extract contains large amounts of bioactive compounds that exhibit strong antioxidant and anti-inflammatory properties.50,51 In fact, the hepatic markers of glycoxidative stress showed decreased amounts of both PPC and pentosidine after supplementation with fructose solution with P (Table 3). Moreover, the diminished counts displayed by hepatic immunological CD45+ cells, as well as macrophages and lymphocytes, apparently from P consumption (Fig. 5B), appear to support the beneficial effect of PU on the glycoxidative stress and immunological response described. These results are in line with those from other authors that showed an antioxidant effect and diminished amounts of human serum cytokines after the consumption of ellagic acid-rich pomegranate fruit extract tablets.9
The present results suggest that PU contained in P exerted a hepatoprotective effect. Based on the literature that related other antioxidant compounds with impaired function of both GLUT5 and GLUT2,2,13,27 we believe that the PU-rich extract used in the experiment might interfere with the intestinal clearance and uptake and consequently hepatic fructose clearance of fructose, diminishing the negative effects attributed to its intestinal and hepatic metabolism.
However, this would mean that a greater abundance of fructose could reach the colon. In fact, when we analyzed the microbiota of F + P compared to C and F, the results suggested an increase of the abundance of microorganisms related to the negative effects of high fructose consumption, such as Ruminococcaceae spp., uncultured Lachnospiraceae spp. or Clostridium senso stricto 1 spp., as well as diminished amounts of some beneficial bacteria such as Lactobacillus spp., Lactococcus spp. and Streptococcus spp.5,52,53 Nevertheless, the beneficial effects of the main polyphenols of pomegranate, i.e., PU and EA, are attributed precisely to their interaction with the microbiota, involving species of microorganisms from the genus Gordonibacter and the family Eggerthellaceae, as responsible for conversion of ellagitannins into urolithins.11,54 The occurrence of increased amounts of unclassified Eggerthellaceae spp. displayed by the microbiome of F + P rats suggested that in addition to the plausible hepatoprotective effect of PU by its interaction with GLUTs, its interaction with the microbiota might be behind the improvement of the impaired metabolic markers promoted by fructose consumption. Urolithins could have a huge positive impact on health as an antioxidant and as a gut barrier function enhancer,12,55 which effectively could be improving in our study, highlighted by the decrease of glycoxidative stress markers in the liver and the diminished inflammatory and immunological responses (Table 3 and Fig. 6B, respectively).
In addition, the urine metabolome of F + P showed some changes in the abundance of several metabolites that could be indicators of both the presence and effect of urolithins. It is well known that upon urolithin production, they accumulate in plasma and urine as glucuronide conjugates.19
With the purpose of identifying any potential pomegranate/PU-derived metabolites in the biological samples of P-treated animals, we identified 1,3-dihydroxy-9H-xanthen-9-one as one highly discriminating candidate between urine metabolomics from F + P, F and C. In the urine of the former group of animals, this metabolite was found in 103-fold higher abundance than in the urine metabolome of F and C. This metabolite has a urolithin-compatible chemical structure and a plausible similar bioactivity based on the present results. This xanthone is, to our knowledge, identified for the first time in the urine of a mammal provided with pomegranate.
With growing interest in this metabolite, which shares a formula and molecular weight with urolithin A, we reported the full characterization of the compound driven by the Compound Discoverer software (Table S2 of the ESI†). The ion fragmentation pattern is shown in Fig. 6B. Moreover, based on the UV spectrum generated in a HPLC-DAD assay, we found close similarities between an urolithin-compatible compound and positively identified urolithin-A (URO-A) in urine from F + P rats, even though the ion fragmentation pattern displayed by the metabolomic assay was not identical to that reported for URO-A.19 Significant differences were found when compared with the 3 experimental groups of animals since the urolithin candidate was not even present in the urine from the C and F groups (Fig. S3 of the ESI†).
Moreover, the metabolomic analysis revealed a lower abundance of uric acid in the urine from F + P compared to F. Fructose promoted uric acid overproduction,23 but these impairments might be alleviated in the present study by the antihyperuricemic properties attributed to urolithins.56 On the other hand, fructose, which is implicated in the glycoxidation of proteins that could reach the colon, was found to be responsible of the formation of undesirable microbial metabolites in the colonic environment.5 One of the most concerning issues is related to the altered metabolism of tryptophan, which was shown in higher abundance in the colonic metabolome of fructose-consuming rats compared to a control group.5 Tryptophan microbial metabolism results in different noxious indolic metabolites.57 The urine metabolome of F rats showed higher amounts of indoline than their F + P counterparts, which exhibited the lowest amounts of the compound. Instead, this last group exhibited higher amounts of tryptophol than F, with this tryptophan-related metabolite being regarded as a compound with antioxidant properties and not present in the urine metabolome of F.58
In conclusion, the pomegranate supplement under study has been shown to have a hepatoprotective effect on Wistar rats challenged with fructose. Several of the physiological mechanisms may involve interaction with the intestinal transport of fructose and modification of the microbiota that may result in the formation of bioactive compounds such as urolithin-A and other urolithin-type compounds that require further attention, as their formation and bioactivities are unknown.
Author contributions
M. E.: funding acquisition, project administration, conceptualization, investigation, methodology, supervision, data analysis, validation and writing – review and editing. G. S.-T.: investigation, methodology, data analysis, validation and writing – original draft. R. M.: investigation, methodology, supervision, data analysis, validation and writing – review and editing. D. M.: supervision, data analysis, validation and writing – review and editing. V. C.: investigation, methodology, data analysis, validation and writing – review and editing. All authors made critical revisions to the manuscript for key intellectual content and read and approved the final manuscript.Conflicts of interest
The authors declare no conflict of interest.Acknowledgements
The study was funded by “Junta de Extremadura” (IB20103), Ministry of Science, Innovation and Universities (grant: MCIN/AEI/10.13039/501100011033; project: PID2021-126193OB-I00: Guadalupe Sánchez grant: FPU18/01077) and the University of Extremadura (UNEX-AE-3394). Remigio Martínez was supported by a postdoctoral contract (POSTDOC_21_00041) at the University of Córdoba (ROR code 05yc77b46) from the Consejería de Transformación Económica, Industria, Conocimiento y Universidades of the Junta de Andalucía (ROR code 01jem9c82) Regional Government (Andalucía, Spain).References
- Guideline: Sugars Intake for Adults and Children, World Health Organization, Geneva, 2015 Search PubMed.
- B. Merino, C. M. Fernández-Díaz, I. Cózar-Castellano and G. Perdomo, Intestinal fructose and glucose metabolism in health and disease, Nutrients, 2020, 12(1), 1–35 Search PubMed.
- M. A. Herman and M. J. Birnbaum, Molecular aspects of fructose metabolism and metabolic disease, Cell Metab., 2021, 33(12), 2329–2354 CrossRef CAS PubMed.
- C. Jang, S. Hui, W. Lu, A. J. Cowan, R. J. Morscher and G. Lee, et al., The small intestine converts dietary fructose into glucose and organic acids, Cell Metab., 2018, 27(2), 351–361 CrossRef CAS PubMed.
- G. Sánchez-Terrón, R. Martínez, J. Ruiz, C. Luna and M. Estévez, Impact of sustained fructose consumption on gastrointestinal function and health in Wistar rats: Glycoxidative stress, impaired protein digestion and shifted faecal microbiota, J. Agric. Food Chem., 2023, 397, 133805, DOI:10.1016/j.foodchem.2022.133805.
- S. Iametti, F. Bonomi and M. Di Nunzio, Dietary polyphenols and in vitro intestinal fructose uptake and transport: A systematic literature review, Int. J. Mol. Sci., 2022, 23(22), 14355 CrossRef CAS PubMed.
- S. A. Hannou, D. E. Haslam, N. M. McKeown and M. A. Herman, Fructose metabolism and metabolic disease, J. Clin. Invest., 2018, 128(2), 545–555 CrossRef PubMed.
- M. Noori, B. Jafari and A. Hekmatdoost, Pomegranate juice prevents development of non-alcoholic fatty liver disease in rats by attenuating oxidative stress and inflammation, J. Sci. Food Agric., 2017, 97(8), 2327–2332 CrossRef CAS PubMed.
- S. Jafarirad, R. Goodarzi, N. Mohammadtaghvaei, M. Dastoorpoor and P. Alavinejad, Effectiveness of the pomegranate extract in improving hepatokines and serum biomarkers of non-alcoholic fatty liver disease: A randomized double blind clinical trial, Diabetes Metab. Syndr., 2023, 17(1), 102693 CrossRef CAS PubMed.
- V. Caballero, M. Estévez, F. A. Tomás-Barberán, D. Morcuende, I. Martín and J. Delgado, Biodegradation of punicalagin into ellagic acid by selected probiotic bacteria: A study of the underlying mechanisms by MS-based proteomics, J. Agric. Food Chem., 2022, 70(51), 16273–16285 CrossRef CAS PubMed.
- Y. Yin, R. Martínez, W. Zang and M. Estévez, Crosstalk between dietary pomegranate and gut microbiota: Evidence of health benefits, Compr. Rev. Food Sci. Food Saf., 2023, 2023, 1–27 Search PubMed.
- F. A. Tomás-Barberán, A. González-Sarrías, R. García-Villalba, M. A. Núñez-Sánchez, M. V. Selma and M. T. García-Conesa, et al., Urolithins, the rescue of “old” metabolites to understand a “new” concept: Metabotypes as a nexus among phenolic metabolism, microbiota dysbiosis, and host health status, Mol. Nutr. Food Res., 2017, 61(1), 1500901 CrossRef PubMed.
- C. Olvera-Sandoval, H. E. Fabela-Illescas, E. Fernández-Martínez, M. A. Ortiz-Rodríguez, R. Cariño-Cortés and J. A. Ariza-Ortega, et al., Potential mechanisms of the improvement of glucose homeostasis in type 2 diabetes by pomegranate juice, Antioxidants, 2022, 11(3), 1–13 CrossRef PubMed.
- B. P. Marriott, N. Cole and E. Lee, National estimates of dietary fructose intake increased from 1977 to 2004 in the United States, J. Nutr., 2009, 139(6), 1228S–1235S, DOI:10.3945/jn.108.098277.
- D. E. Chusyd, D. Wang, D. M. Huffman and T. R. Nagy, Relationships between rodent white adipose fat pads and human white adipose fat depots, Front. Nutr., 2016, 3, 10, DOI:10.3389/fnut.2016.00010.
- M. Utrera, D. Morcuende, J. G. Rodríguez-Carpena and M. Estévez, Fluorescent HPLC for the detection of specific protein oxidation carbonyls - α-aminoadipic and γ-glutamic semialdehydes – in meat systems, Meat Sci., 2011, 89(4), 500–506 CrossRef CAS PubMed.
- M. J. Sánchez-Quintero, J. Delgado, D. Medina-Vera, V. M. Becerra-Muñoz, M. I. Queipo-Ortuño and M. Estévez, et al., Beneficial effects of essential oils from the Mediterranean diet on gut microbiota and their metabolites in ischemic heart disease and type-2 diabetes mellitus, Nutrients, 2022, 14(21), 4650 CrossRef PubMed.
- E. G. Bligh and W. J. Dyer, A rapid method of total lipid extraction and purification, Can. J. Biochem. Physiol., 1959, 37(8), 911–917 CrossRef CAS PubMed.
- R. García-Villalba, J. C. Espín and F. A. Tomás-Barberán, Chromatographic and spectroscopic characterization of urolithins for their determination in biological samples after the intake of foods containing ellagitannins and ellagic acid, J. Chromatogr. A, 2016, 1428, 162–175 CrossRef PubMed.
- H. Wickham, Elegant Graphics for Data Analysis: ggplot2, in Applied Spatial Data Analysis with R, 2008, pp. 21–54 Search PubMed.
- L. W. Sumner, A. Amberg, D. Barrett, M. H. Beale, R. Beger and C. A. Daykin, et al., Proposed minimum reporting standards for chemical analysis: Chemical Analysis Working Group (CAWG) Metabolomics Standards Initiative (MSI), Metabolomics, 2007, 3(3), 211–221 CrossRef CAS PubMed.
- S. Softic, K. L. Stanhope, J. Boucher, S. Divanovic, M. A. Lanaspa and R. J. Johnson, et al., Fructose and hepatic insulin resistance, Crit. Rev. Clin. Lab. Sci., 2020, 57(5), 308–322 CrossRef PubMed.
- A. Miller and K. Adeli, Dietary fructose and the metabolic syndrome, Curr. Opin. Gastroenterol., 2008, 24, 204–209 CrossRef CAS PubMed.
- B. Bjørndal, L. Burri, V. Staalesen, J. Skorve and R. K. Berge, Different adipose depots: Their role in the development of metabolic syndrome and mitochondrial response to hypolipidemic agents, J. Obes., 2011, 2011, 1–15 CrossRef PubMed.
- A. Wronska and Z. Kmiec, Structural and biochemical characteristics of various white adipose tissue depots, Acta Physiol., 2012, 205(2), 194–208 CrossRef CAS PubMed.
- T. Becher, S. Palanisamy, D. J. Kramer, M. Eljalby, S. J. Marx and A. G. Wibmer, et al., Brown adipose tissue is associated with cardiometabolic health, Nat. Med., 2021, 27(1), 58–65 CrossRef CAS PubMed.
- S. Mary Varghese and J. Thomas, The effect of M. latifolia leaf extract on high-fructose corn syrup (HFCS)-induced non-alcoholic fatty liver disease in rat models, in Nonalcoholic Fat Liver Disease – An Update, 2019. DOI:10.5772/intechopen.82200.
- M. E. Bocarsly, E. S. Powell, N. M. Avena and B. G. Hoebel, High-fructose corn syrup causes characteristics of obesity in rats: Increased body weight, body fat and triglyceride levels, Pharmacol., Biochem. Behav., 2010, 97(1), 101–106 CrossRef CAS PubMed.
- G. A. Bray, Soft drink consumption and obesity: It is all about fructose, Curr. Opin. Lipidol., 2010, 21(1), 51–57 CrossRef CAS PubMed.
- H. Jürgens, W. Haass, T. R. Castañeda, A. Schürmann, C. Koebnick and F. Dombrowski, et al., Consuming fructose-sweetened beverages increases body adiposity in mice, Obes. Res., 2005, 13(7), 1145–1156 Search PubMed.
- C. Sellmann, J. Priebs, M. Landmann, C. Degen, A. J. Engstler and C. J. Jin, et al., Diets rich in fructose, fat or fructose and fat alter intestinal barrier function and lead to the development of nonalcoholic fatty liver disease over time, J. Nutr. Biochem., 2015, 26(11), 1183–1192 CrossRef CAS PubMed.
- R. V. Sandeva, S. M. Mihaylova, G. N. Sandeva, K. Y. Trifonova and R. D. Popova-Katsarova, Effect of high-fructose solution on body weight, body fat, blood glucose and triglyceride levels in rats, J. Biomed. Clin. Res., 2015, 8(1), 5–8 CrossRef.
- G. Richard, D. P. Blondin, S. A. Syed, L. Rossi, M. E. Fontes and M. Fortin, et al., High-fructose feeding suppresses cold-stimulated brown adipose tissue glucose uptake independently of changes in thermogenesis and the gut microbiome, Cell Rep. Med., 2022, 3(9), 100742 CrossRef CAS PubMed.
- M. J. Meneses, I. Sousa-Lima, I. Jarak, J. F. Raposo, M. G. Alves and M. P. Macedo, Distinct impacts of fat and fructose on the liver, muscle, and adipose tissue metabolome: An integrated view, Front. Endocrinol., 2022, 13, 1–16 Search PubMed.
- A. Bosy-Westphal, W. Braun, V. Albrecht and M. J. Müller, Determinants of ectopic liver fat in metabolic disease, Eur. J. Clin. Nutr., 2019, 73(2), 209–214 CrossRef CAS PubMed.
- J. Ludwig, T. R. Viggiano, D. B. McGill and B. J. Oh, Nonalcoholic steatohepatitis: Mayo Clinic experiences with a hitherto unnamed disease, Mayo Clin. Proc., 1980, 55(7), 434–438 CAS.
- S. Zhao, C. Jang, J. Liu, K. Uehara, M. Gilbert and L. Izzo, et al., Dietary fructose feeds hepatic lipogenesis via microbiota-derived acetate, Nature, 2020, 579(7800), 586–591 CrossRef CAS PubMed.
- M. Janevski, S. Ratnayake, S. Siljanovski, M. A. McGlynn, D. Cameron-Smith and P. Lewandowski, Fructose containing sugars modulate mRNA of lipogenic genes ACC and FAS and protein levels of transcription factors ChREBP and SREBP1c with no effect on body weight or liver fat, Food Funct., 2012, 3(2), 141–149 RSC.
- C. C. Hsieh, C. C. Liao, Y. C. Liao, L. S. Hwang, L. Y. Wu and S. C. Hsieh, Proteomic changes associated with metabolic syndrome in a fructose-fed rat model, J. Food Drug Anal., 2016, 24(4), 754–761 CrossRef CAS PubMed.
- M. Paar, V. H. Fengler, D. J. Rosenberg, A. Krebs, R. E. Stauber and K. Oettl, et al., Albumin in patients with liver disease shows an altered conformation, Commun. Biol., 2021, 4(1), 1–9 CrossRef PubMed.
- R. Rajesh and V. Sreekala, High fructose diet-induced metabolic syndrome and the functional abnormalities in the liver and kidney of Wistar albino rats, Natl. J. Physiol., Pharm. Pharmacol., 2020, 11(0), 1 Search PubMed.
- J. A. Thompson, K. Krajnak, R. A. Johnston, M. L. Kashon, W. McKinney and J. S. Fedan, High-fat Western diet-consumption alters crystalline silica-induced serum adipokines, inflammatory cytokines and arterial blood flow in the F344 rat, Toxicol. Rep., 2022, 9, 12–21 CrossRef CAS PubMed.
- E. G. Giannini, R. Testa and V. Savarino, Liver enzyme alteration: A guide for clinicians, Can. Med. Assoc. J., 2005, 172(3), 367–379 CrossRef PubMed.
- M. Aragno and R. Mastrocola, Dietary sugars and endogenous formation of advanced glycation endproducts: Emerging mechanisms of disease, Nutrients, 2017, 9(4), 1–16 CrossRef PubMed.
- R. Mastrocola, D. Nigro, F. Chiazza, C. Medana, F. Dal Bello and G. Boccuzzi, et al., Fructose-derived advanced glycation end-products drive lipogenesis and skeletal muscle reprogramming via SREBP-1c dysregulation in mice, Free Radicals Biol. Med., 2016, 91, 224–235 CrossRef CAS PubMed.
- P. Muriel, P. López-Sánchez and E. Ramos-Tovar, Fructose and the liver, Int. J. Mol. Sci., 2021, 22(13), 6969 CrossRef CAS PubMed.
- D. M. Zhang, R. Q. Jiao and L. D. Kong, High dietary fructose: Direct or indirect dangerous factors disturbing tissue and organ functions, Nutrients, 2017, 9, 335 CrossRef PubMed.
- G. Kanuri, R. Ladurner, J. Skibovskaya, A. Spruss, A. Königsrainer and S. C. Bischoff, et al., Expression of toll-like receptors 1–5 but not TLR 6–10 is elevated in livers of patients with non-alcoholic fatty liver disease, Liver Int., 2015, 35(2), 562–568 CrossRef CAS PubMed.
- E. Yanpar, M. Yildirim, M. Akkapulu, U. Değirmenci, S. Könen Adigüzel and S. Yalin, et al., Possible protective role of punicalagin on oxidative stress, inflammation and genotoxicity in ethanol-induced liver toxicity, J. Res. Pharm., 2021, 25(5), 600–608 CAS.
- C. Hou, W. Zhang, J. Li, L. Du, O. Lv and S. Zhao, et al., Beneficial effects of pomegranate on lipid metabolism in metabolic disorders, Mol. Nutr. Food Res., 2019, 63(16), 1–12 Search PubMed.
- A. Mandal, D. Bhatia and A. Bishayee, Anti-inflammatory mechanism involved in pomegranate-mediated prevention of breast cancer: The role of NF-κB and Nrf2 signaling pathways, Nutrients, 2017, 9(5), 1–13 CrossRef PubMed.
- J. Lambertz, S. Weiskirchen, S. Landert and R. Weiskirchen, Fructose: A dietary sugar in crosstalk with microbiota contributing to the development and progression of non-alcoholic liver disease, Front. Immunol., 2017, 8, 1159, DOI:10.3389/fimmu.2017.01159.
- Y. E. Cho, D. K. Kim, W. Seo, B. Gao, S. H. Yoo and B. J. Song, Fructose promotes leaky gut, endotoxemia, and liver fibrosis through ethanol-inducible Cytochrome P450-2E1-mediated oxidative and nitrative stress, Hepatology, 2021, 73(6), 2180–2195 CrossRef CAS PubMed.
- M. W. Zhang, S. M. Cui, B. Y. Mao, Q. X. Zhang, J. X. Zhao and H. Zhang, et al., Ellagic acid and intestinal microflora metabolite urolithin A: A review on its sources, metabolic distribution, health benefits, and biotransformation, Crit. Rev. Food Sci. Nutr., 2023, 63(24), 6900–6922 CrossRef CAS PubMed.
- R. Singh, S. Chandrashekharappa, S. R. Bodduluri, B. V. Baby, B. Hegde and N. G. Kotla, et al., Enhancement of the gut barrier integrity by a microbial metabolite through the Nrf2 pathway, Nat. Commun., 2019, 10(1), 89 CrossRef PubMed.
- S. I. Adachi, K. Sasaki, S. Kondo, W. Komatsu, F. Yoshizawa and H. Isoda, et al., Antihyperuricemic effect of urolithin a in cultured hepatocytes and model mice, Molecules, 2020, 25(21), 1–15 CrossRef PubMed.
- J. d. J. Rodríguez-Romero, A. C. Durán-Castañeda, A. P. Cárdenas-Castro, J. A. Sánchez-Burgos, V. M. Zamora-Gasga and G. S. Sáyago-Ayerdi, What we know about protein gut metabolites: Implications and insights for human health and diseases, Food Chem.: X, 2022, 13, 100195 Search PubMed.
- M. Schirmer, S. P. Smeekens, H. Vlamakis, M. Jaeger, M. Oosting and E. A. Franzosa, et al., Linking the human gut microbiome to inflammatory cytokine production capacity, Cell, 2016, 167(4), 1125–1136 CrossRef CAS PubMed.
Footnote |
| † Electronic supplementary information (ESI) available. See DOI: https://doi.org/10.1039/d4fo00688g |
| This journal is © The Royal Society of Chemistry 2024 |