 Open Access Article
Creative Commons Attribution 3.0 Unported Licence
Pea protein extraction method impacts the protein (micro)structural organisation and in vitro digestion kinetics
Sarah H. E.
Verkempinck
 *a,
Dorine
Duijsens
 a,
Ankita
Mukherjee
b and
Peter J.
Wilde
c
aLaboratory of Food Technology, Department of Microbial and Molecular Systems (M2S), Leuven Food Science and Nutrition Research Centre (LFoRCe), KU Leuven, Kasteelpark Arenberg, 22, PB 2457, 3001 Leuven, Belgium. E-mail: sarah.verkempinck@kuleuven.be; sarah.verkempinck@kuleuven.be; dorine.duijsens@kuleuven.be
bMeat Technology & Science of Protein-Rich Foods, Department of Microbial and Molecular Systems, Leuven Food Science and Nutrition Research Centre (LFoRCe), KU Leuven Technology Campus Ghent, Gebroeders Desmetstraat 1, 9000 Ghent, Belgium. E-mail: ankita.mukherjee@kuleuven.be
cFood Innovation and Health Programme, Quadram Institute Bioscience, Norwich Research Park, Norwich, NR4 7UA, UK. E-mail: pete.wilde@quadram.ac.uk
First published on 4th January 2024
Abstract
There is increasing interest in including pulse proteins into food products due to their nutrient-rich and sustainable character. However, little is known regarding the consequences of different extraction approaches on the pulse protein structure and the subsequent protein (micro)structural organization and protein digestion kinetics. Therefore, three green pea protein extracts were created: (i) cooking followed by cotyledon cell isolation, (ii) alkaline extraction followed by isoelectric precipitation, or (iii) salt extraction, and compared to the original pea flour as well as to sodium caseinate. The results showed that encapsulated, denatured protein inside pea cotyledon cells presented the (s)lowest digestion, while accessible and more native protein (e.g., pea flour, pea protein salt extract) presented much faster and higher digestion. Moreover, the alkali extracted pea protein was denatured to some extent, significantly lowering in vitro digestion kinetics. In the second part, three different in vitro approaches were applied to digest the salt extracted pea protein. Semi-dynamic gastric digestion approaches simulate in vivo conditions more closely which especially impacted the rate of digestion.
1 Introduction
Pulse seeds are sustainable crops rich in nutrients such as protein. Given the topical protein transition, pulse seeds can be seen as valuable sources of alternative protein.1 Additionally, the increasing demand for innovative and functional food products resulted in the exploration of plant-based protein as food ingredients (e.g., flours, concentrates and isolates).2Industrially, proteins are majorly extracted under alkaline conditions followed by isoelectric precipitation and spray drying to obtain a protein-rich powder. Both the alkaline conditions and spray drying process can enhance hydrophobic interactions between proteins which in turn can negatively affect functional properties such as protein solubility.5 Therefore, research has been focusing on other extraction techniques and how they impact techno-functional properties. In that context, several studies showed that the protein extraction method used, affects the protein types and/or structures present in the extract which in turn has consequences for the techno-functional properties such as foaming, gelling, or emulsifying potential.3,5–10
Next to the optimization of techno-functional aspects of protein extracts, the nutritional functionality should not be forgotten. In this context, our research group recently showed that a beverage containing a commercial pea protein isolate was only in vitro digested to a limited extent. However, when increasing protein dispersibility by high pressure homogenisation, in vitro protein digestion kinetics were improved.11 Until now, only a limited number of studies focused on the in vitro evaluation of proteolysis rate and extent of non-commercial protein extracts. These nutritional consequences are of utmost importance to investigate and to understand so the industry can further optimize its production processes to generate pulse protein ingredients with desired techno-functional as well as nutritional properties.
Various methods have been employed to assess in vitro digestion.12 The most commonly used in this context are static in vitro models based on the human gastrointestinal physiology. These models are simpler, more economical, and offer higher throughput compared to in vivo models.12,13 Their main limitation is the absence of any time dependency of the digestion processes within a compartment.13 Important physiological factors that directly affect digestion kinetics include the dynamic nature of secretions (e.g. digestive enzymes, pH) and gastric emptying. These factors also alter, e.g. nutrient structural organization, enzymatic activity, and substrate-enzyme contact time. In response to this, semi-dynamic in vitro models were developed to study digestion phenomena under more realistic conditions. In 2020, a consensus semi-dynamic in vitro gastric digestion model was published by the INFOGEST consortium.14 This method gives specific attention to mimicking the transient nature of gastric secretions and emptying by use of a single reactor.14 Furthermore, a semi-dynamic method to introduce dynamic secretions of digestive fluids and enzymes both during the gastric and small intestinal phase was implemented by our research group.15 However, based on these existing models, strategic selections on which relevant dynamic factors to include into a digestion simulation cannot be made. Currently, limited knowledge exists on how these different semi-dynamic approaches impact in vitro nutrient digestion kinetics.
Peas are considered interesting plant-based protein alternatives due to their limited number of allergens compared to other protein alternatives such as soy.3 Besides, peas contain a relatively high amount of protein (20–25% on dry a basis), but are also rich in starch, micronutrients, and bioactives such as phenolic acids.4 The main pea proteins are the salt-soluble globulins (55–80%) and water-soluble albumins (18–25%).3 Therefore, the aim of this study was twofold. Firstly, we aimed to investigate the impact of different protein extraction techniques on the extract composition, protein structure, protein solubility and in vitro proteolysis kinetics of green peas. To reach this goal, three extraction techniques were compared: (i) hydrothermal treatment combined with mechanical disintegration and wet sieving to recover an extract containing intact cotyledon cells encapsulating protein, (ii) alkaline extraction in combination with isoelectric precipitation to generate an industrial-like protein-rich extract yet freeze dried and not heat treated, and (iii) salt extraction to generate a protein-rich extract in which the native protein structure was retained as much as possible. The original non-cooked pea (flour) sample was used as a reference sample as well as an animal-based protein extract, sodium caseinate. Secondly, three in vitro digestion approaches were compared for one specific protein extract (i.e., pea protein salt extract) to gain more detailed insight into how the in vitro digestion approach can impact digestion kinetics.
2 Materials and methods
2.1 Materials
Mature dry green peas (Pisum sativum) were kindly donated by Casibeans (Melsele, Belgium), sorted, cleaned from foreign material, and stored at −40 °C. Sodium caseinate (CAS) from bovine milk was acquired from Sigma Aldrich (Diegem, Belgium). Porcine pepsin (2681 U mg−1), trypsin (247.8 U mg−1), and chymotrypsin (55.8 U mg−1) were purchased from Sigma Aldrich (Diegem, Belgium). All chemicals and reagents used in this work were of HPLC or analytical grade.2.2 Preparation of samples
Green pea flour (section 2.2.1) was dispersed in Milli-Q water (1![[thin space (1/6-em)]](https://www.rsc.org/images/entities/char_2009.gif) :
:![[thin space (1/6-em)]](https://www.rsc.org/images/entities/char_2009.gif) 10 w/v) for 1 h at room temperature. Hereafter, the pH of the mixture was adjusted to 11 using 1 M NaOH. The mixture was stirred for 2 h at room temperature and centrifuged at 8000g for 15 min at 4 °C (Avanti JXN-26, Beckman Coulter Inc., Indianapolis, IN, USA). The supernatant was filtered and adjusted to a pH of 4.5 using 1 M HCl to precipitate protein. After centrifugation with the same parameters as described above, the pellet was collected, resuspended in Milli-Q water, and neutralized (pH 7) using 1 M NaOH. The protein fraction obtained was dialyzed for 48 h against demineralized water (Spectra/Por®, Molecular weight cut-off = 6–8 kDa), lyophilized (Alpha 2–4 LSC plus, Christ, Osterode, Germany), and stored in a desiccator at room temperature. The pea protein fraction obtained after alkali extraction will be referred to as PPAE.
10 w/v) for 1 h at room temperature. Hereafter, the pH of the mixture was adjusted to 11 using 1 M NaOH. The mixture was stirred for 2 h at room temperature and centrifuged at 8000g for 15 min at 4 °C (Avanti JXN-26, Beckman Coulter Inc., Indianapolis, IN, USA). The supernatant was filtered and adjusted to a pH of 4.5 using 1 M HCl to precipitate protein. After centrifugation with the same parameters as described above, the pellet was collected, resuspended in Milli-Q water, and neutralized (pH 7) using 1 M NaOH. The protein fraction obtained was dialyzed for 48 h against demineralized water (Spectra/Por®, Molecular weight cut-off = 6–8 kDa), lyophilized (Alpha 2–4 LSC plus, Christ, Osterode, Germany), and stored in a desiccator at room temperature. The pea protein fraction obtained after alkali extraction will be referred to as PPAE.
Green pea flour (section 2.2.1) was dispersed in a 0.1 M phosphate buffer containing 0.3 M NaCl (1![[thin space (1/6-em)]](https://www.rsc.org/images/entities/char_2009.gif) :
:![[thin space (1/6-em)]](https://www.rsc.org/images/entities/char_2009.gif) 5 w/v) for 2 h at room temperature. Hereafter, the mixture was centrifuged at 4260g for 15 min at 4 °C (Avanti JXN-26, Beckman Coulter Inc., Indianapolis, IN, USA). The supernatant was filtered, dialyzed for 48 h against demineralized water (Spectra/Por®, Molecular weight cut-off = 6–8 kDa), lyophilized (Alpha 2–4 LSC plus, Christ, Osterode, Germany), and stored in a desiccator at room temperature. The pea protein fraction obtained after salt extraction will be referred to as PPSE.
5 w/v) for 2 h at room temperature. Hereafter, the mixture was centrifuged at 4260g for 15 min at 4 °C (Avanti JXN-26, Beckman Coulter Inc., Indianapolis, IN, USA). The supernatant was filtered, dialyzed for 48 h against demineralized water (Spectra/Por®, Molecular weight cut-off = 6–8 kDa), lyophilized (Alpha 2–4 LSC plus, Christ, Osterode, Germany), and stored in a desiccator at room temperature. The pea protein fraction obtained after salt extraction will be referred to as PPSE.
2.3 Sample characterisation
To determine the composition of all samples (PF, PC, PPAE, PPSE, CAS), the powdered samples were first ball milled (Ball mill MM400, Retsch GmbH, Haan, Germany) to disrupt any physical barriers. All analysis were performed at least in duplicate.Starch content of all samples was determined using a Total Starch Assay Kit K-TSTA (AA/AMG, Megazyme Inc., Bray, Ireland). An automated Dumas analyser (CHNS-O Elemental Analyzer, CE instrument, Thermo Fischer Scientific, Waltham, MA, USA) was used to evaluate the nitrogen content of all samples. For all pea-derived samples, a conversion factor of 5.4 was applied to determine the protein content,21 while for CAS a conversion factor of 6.38 was used.22 The total lipid content was determined gravimetrically, according to the procedure of Janssen et al.23 The ash content of all samples was determined as the mass difference upon complete incineration at 550 °C in a muffle furnace (Controller P330, Nabertherm, Lilienthal, Germany). The moisture content of all samples was determined as the mass difference upon vacuum oven drying at 70 °C (UniEquip 1445-2, Planegg, Germany).
A Q2000 heat flux differential scanning calorimeter with Advanced Tzero™ technology (TA Instruments, New Castle, DE, USA) was used to determine enthalpy changes which can be related to protein denaturation according to the procedure described by Chigwedere et al.24 Lastly, sodium dodecyl sulfate polyacrylamide gel electrophoresis (SDS-PAGE) under reducing conditions was used to study the protein profile of the different samples under investigation.25
2.4 Preparation of protein dispersions
For the suspensions made from PF or PC, a 5% protein concentration (dry basis) was considered due to the relatively low protein, yet high dry matter content in those samples. For the suspensions made from the protein extracts, PPAE, PPSE, and CAS, a 10% protein concentration (dry basis) was considered.Briefly, 5% (PF, PC) or 10% (PPAE, PPSE, CAS) protein (w/v) was weighed from the respective dry powder, suspended in 0.1 M sodium phosphate buffer (pH 7), and stirred overnight at room temperature.
2.5 Protein solubility
To determine protein solubility, protein dispersions (section 2.4) as well as diluted dispersions according to the simulation conditions of the static gastric phase without enzyme addition (section 2.7.1) were considered. All samples were centrifuged at 20![[thin space (1/6-em)]](https://www.rsc.org/images/entities/char_2009.gif) 000g for 30 min at 20 °C (Optima XPN-80 Ultracentrifuge, Beckman Coulter Inc., Indianapolis, IN, USA). The supernatants were collected with a pipette and lyophilized (Alpha 2–4 LSC plus, Christ, Osterode, Germany). An aliquot of the non-centrifuged samples was lyophilized as well to determine the exact amount of nitrogen in the original dispersion. The protein content of all samples was quantified using an automated Dumas analyser and applying a correction factor as described in section 2.3. Lastly, protein solubility was calculated according to eqn (1). The analysis was performed in duplicate per sample type.
000g for 30 min at 20 °C (Optima XPN-80 Ultracentrifuge, Beckman Coulter Inc., Indianapolis, IN, USA). The supernatants were collected with a pipette and lyophilized (Alpha 2–4 LSC plus, Christ, Osterode, Germany). An aliquot of the non-centrifuged samples was lyophilized as well to determine the exact amount of nitrogen in the original dispersion. The protein content of all samples was quantified using an automated Dumas analyser and applying a correction factor as described in section 2.3. Lastly, protein solubility was calculated according to eqn (1). The analysis was performed in duplicate per sample type. | (1) |
2.6 Protein secondary structure
To gain some insight in the protein secondary structure of PPAE and PPSE, Fourier transform infrared spectroscopy was used. Transmission of each sample was measured from 4000 cm−1 to 400 cm−1 at a resolution of 4 cm−1. A total of 100 scans were taken per sample and peaks were deconvoluted before spectra were analysed.26 Existing literature was used to identify the Gaussian peaks obtained. In this sense, peaks around 1638 cm−1 were related with β-sheet structures, 1654 cm−1 with α-helices, 1663 cm−1 with β-turns, and 1680 cm−1 with antiparallel β-sheets.27 Additionally, peaks between 1625 and 1610 cm−1 were related with intermolecular β-sheets,28 and peaks between 1695 and 1690 cm−1 to amino acid side chains.29 To calculate the contribution of each protein secondary structure, its corresponding peak area was divided over the total peak area.2.7 In vitro digestion simulation
Three different in vitro digestion approaches were applied in this study. Firstly, all samples were digested using the commonly used static in vitro digestion procedure of INFOGEST.30 Secondly, one selected sample, PPSE, was also digested using more advanced semi-dynamic in vitro digestion conditions: (i) an approach without gastric emptying (MuReDi approach15) and (ii) an approach with gastric emptying (INFOGEST approach14).![[thin space (1/6-em)]](https://www.rsc.org/images/entities/char_2009.gif) :
:![[thin space (1/6-em)]](https://www.rsc.org/images/entities/char_2009.gif) 1 dilution of the dry matter content of the food to the salivary fluids (including simulated salivary fluid, 0.3 M CaCl2, and Milli-Q water) was applied. Hereafter, simulated gastric fluid, 0.3 M CaCl2, pepsin (2000 U mL−1 chyme), 2 M HCl (to reach pH 3), and Milli-Q water were added according to the ratios described by Brodkorb et al.30 To simulate the small intestinal phase, simulated intestinal fluid, 0.3 M CaCl2, trypsin (100 U mL−1 digest), chymotrypsin (25 U mL−1 digest), 1 M NaOH (to reach pH 7), and Milli-Q water were added as described by Brodkorb et al.30 Digestion was simulated in glass tubes which rotated head-over-heels (40 rpm) in an incubator set at 37 °C. Sixteen individual tubes were used to simulate the gastric and small intestinal phase. The enzymatic activity in each tube was thermally stopped (5 min, 95 °C) at different pre-determined moments (after 5; 10; 20; 30; 45; 60; 90; 120; 125; 130; 140; 150; 165; 180; 210; and 240 min) to be able to study the time dependent digestive behaviour (i.e., rate and extent) of all samples.31
1 dilution of the dry matter content of the food to the salivary fluids (including simulated salivary fluid, 0.3 M CaCl2, and Milli-Q water) was applied. Hereafter, simulated gastric fluid, 0.3 M CaCl2, pepsin (2000 U mL−1 chyme), 2 M HCl (to reach pH 3), and Milli-Q water were added according to the ratios described by Brodkorb et al.30 To simulate the small intestinal phase, simulated intestinal fluid, 0.3 M CaCl2, trypsin (100 U mL−1 digest), chymotrypsin (25 U mL−1 digest), 1 M NaOH (to reach pH 7), and Milli-Q water were added as described by Brodkorb et al.30 Digestion was simulated in glass tubes which rotated head-over-heels (40 rpm) in an incubator set at 37 °C. Sixteen individual tubes were used to simulate the gastric and small intestinal phase. The enzymatic activity in each tube was thermally stopped (5 min, 95 °C) at different pre-determined moments (after 5; 10; 20; 30; 45; 60; 90; 120; 125; 130; 140; 150; 165; 180; 210; and 240 min) to be able to study the time dependent digestive behaviour (i.e., rate and extent) of all samples.31
The oral phase was mimicked as described in section 2.7.1. The gastric phase was mimicked semi-dynamically exactly as described before.15 Briefly, 90% of the gastric fluid master mix (pH = 0.45) and 90% of the pepsin solution were added gradually as a function of gastric digestion time to reach a final pH of 2 and an enzyme activity of 2000 U mL−1 chyme. The subsequent small intestinal phase was mimicked statically. In that way, the effect of the semi-dynamic gastric phase on the digestion kinetics could be studied.
Digestion was simulated in glass reactor vessels, each having individual pH, temperature, and stirring control. Every vessel was connected with 4 individual feeding lines which are used to pump the appropriate digestive solutions at a set speed in each vessel. For more details regarding the BioXplorer 100 equipment and the MuReDi approach, we kindly refer to our previous publication.15 The enzymatic activity in each vessel was thermally stopped (5 min, 95 °C) at different pre-determined moments (after 5; 10; 20; 30; 45; 60; 90; 120; 125; 130; 140; 150; 165; 180; 210; and 240) to be able to study the time dependent digestive behaviour.
The gastric phase with gastric emptying was executed exactly as described by Mulet-Cabero et al.14 A sample volume of 30 mL was started from, and eight emptying moments were considered, meaning that each 6.63 min an aliquot was emptied from the vessel taking into account a gastric emptying rate of 2 kcal per min. The total gastric phase lasted 53 min. The vessel with a thermostat jacket (Metrohm) was shaken using an orbital shaker (Stuart mini gyro-rocker, SSM3). The gastric fluid master mix (pH = 0.45) and pepsin solution (2000 U mL−1 chyme) were added gradually as a function of simulated gastric digestion time using the pumps of a BioXplorer 100 equipment (H.E.L Group, London, U.K.) and winISO software. The pH was monitored by the BioXplorer 100 and the corresponding winISO software.
To analyse the samples taken during the gastric phase, enzymatic activity of each emptied aliquot was stopped by thermal inactivation (5 min, 95 °C).
To perform a static in vitro small intestinal phase after gastric emptying, all emptied aliquots were combined in a vessel containing simulated intestinal fluid and bile salts. This vessel was connected to the BioXplorer 100 equipment, which allowed to bring and keep the pH around 7 in a controlled manner, inactivating pepsin. Thermal inactivation was not considered since it could alter protein structure before small intestinal digestion. At the end of the gastric phase, the remaining amount of Milli-Q water was added to reach the same dilution as described in the static INFOGEST protocol. Aliquots of this mixture (8.75 mL) were brought into test tubes to which 1.25 mL of enzyme mixture was added, containing trypsin (100 U mL−1 digest) and chymotrypsin (25 U mL−1 digest). Hereafter, all test tubes were incubated at 37 °C and rotated head-over-heels (40 rpm). Again, the enzymatic activity was stopped (5 min, 95 °C) at different pre-determined moments (after 5; 10; 20; 30; 45; 60; 90; and 120 min of enzyme addition in the small intestinal phase) to study the time dependent digestive behaviour. The simulation of semi-dynamic in vitro digestion with gastric emptying was performed in duplicate since sampling in the gastric phase was done from one vessel yielding dependent data.
2.8 Protein digestion quantification
The readily bioaccessible protein are described as the fraction of protein that can be absorbed as such at the brush-border of the small intestine.32 This protein fraction predominantly contains amino acids, dipeptides, and tripeptides.All digested samples were centrifuged (10 min, 2000g, 4 °C, Sigma 4–16 KS, Sigma, Osterode am Harz, Germany) to harvest the soluble protein fraction under these centrifugation conditions. Next, 5% trichloroacetic acid (TCA) was added to each sample to precipitate larger peptides.32 Lastly, the o-phthaldialdehyde spectrophotometric assay was used to quantify the readily bioaccessible fraction (NH2(TCA)) in each sample.32–34 The amount of readily bioaccessible protein is expressed according to eqn (2). The analysis was performed in duplicate per sample point.
 | (2) |
2.9 Particle size analysis
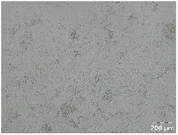
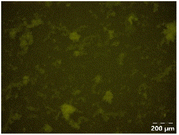
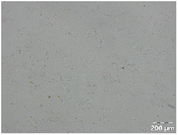
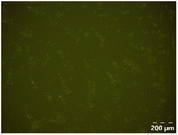
The mean particle size and particle size distributions were assessed in duplicate for all initial samples as well as during digestion using a laser diffraction equipment (Beckman Coulter Inc., LS 13 320, FL, USA). Additionally, the microstructure was visualized by means of an optical microscope (Olympus BX-51, Olympus, Optical Co. Ltd, Tokyo, Japan) equipped with an Olympus XC-50 digital camera and an image-analysis software (cellSens, Olympus, Tokyo, Japan). Fluorescent microscopy (X-Cite Fluorescence Illumination, Series 120Q EXFO Europe, Hants, United Kingdom) was used to visualize protein (micro)structures in the dispersions based on the intrinsic protein fluorescence.2.10 Data analysis
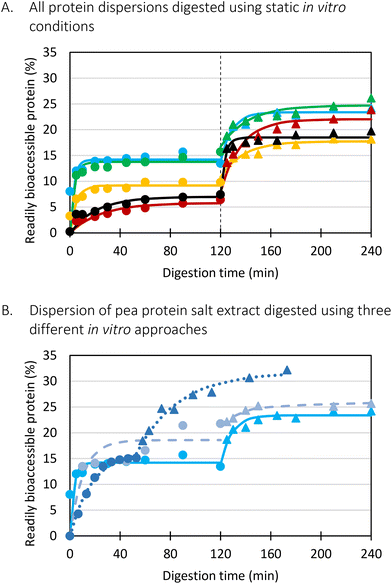
Significant differences among samples were determined by one way ANOVA and a Tukey's Studentised Range Post-hoc test with a 95% level of significance (P < 0.05).The protein digestion kinetics of each sample were determined using eight individual recipients in each digestive phase. Consequently, each recipient can be considered to be an independent, consecutive evaluation of the same digestion curve. The experimental data obtained were therefore integrated using nonlinear regression (JMP Pro16, SAS Institute Inc., Cary, NC, USA). For this, an empirical, first order fractional conversion model was applied as shown in eqn (3). In eqn (3), C (%) represents the predicted readily bioaccessible protein at time t (min), Ci (%) represents the initial amount of readily bioaccessible protein, Cf (%) represents the final, plateau value reached under the given conditions, k (min−1) represents the reaction rate constant, and t (min) represents the time in the simulated gastric or small intestinal phase.31,35 Confidence intervals (95%) were used to determine significant differences among parameter estimates.
| C = Cf + (Ci − Cf) × e−kt | (3) |
3 Results and discussion
3.1 Characterization of all protein samples
The composition of all samples was determined and displayed in Table 1. The original PF contained around 45% starch, 18% protein, and 4.5% lipids. These values are in line with results previously reported.4 The macronutrient composition of PC (yield of 44.7 ± 1.2%) is the most similar to the one of the original PF. The starch and protein content slightly increased which can be explained by seed coat removal, compound leaching, and/or concentration of the cells during soaking, cooking, and wet sieving to isolate cells that predominantly contained starch and protein.36 Oppositely, the protein extracts PPAE (yield of 12.2 ± 0.5%) and PPSE (yield of 9.5 ± 1.2%), only contained very small amounts of starch (around 1.5%), and were rich in protein (74–77%). The lipid content of these protein extracts was around 7.5 to 8.2% which can be explained by not defatting the PF before protein extraction.6 CAS was very rich in protein (around 88%) and contained only minor amounts of other nutrients such as starch and lipids (Table 1).| Starch (%) | Protein (%) | Lipids (%) | Ash (%) | Moisture (%) | |
|---|---|---|---|---|---|
| Pea flour | 45.37 ± 1.36 b | 18.00 ± 0.37 d | 4.49 ± 0.01 b | 1.61 ± 0.17 cd | 7.73 ± 0.09 a |
| Pea cells | 57.69 ± 1.39 a | 18.92 ± 0.11 d | 1.28 ± 0.08 c | 0.81 ± 0.13 d | 7.88 ± 0.02 a |
| Pea protein alkali extract | 1.50 ± 0.13 c | 77.03 ± 0.03 b | 8.23 ± 0.01 a | 4.34 ± 0.16 a | 3.97 ± 0.13 d |
| Pea protein salt extract | 1.48 ± 0.23 c | 74.63 ± 0.96 c | 7.54 ± 0.38 a | 1.98 ± 0.44 bc | 5.95 ± 0.04 b |
| Casein | 0.23 ± 0.08 c | 87.79 ± 0.62 a | 0.92 ± 0.06 c | 2.85 ± 0.17 b | 5.07 ± 0.05 c |
In addition to the nutrient composition, all samples were also analysed using a differential scanning calorimeter to detect potential enthalpy changes which could be related to protein denaturation (Table 2). Only for PF, PPAE, and PPSE a peak could be detected around 89 °C. When comparing the energy input needed for protein denaturation between PPAE and PPSE, PPSE needed significantly more energy to denature protein. This most probably means that the protein of PPSE is more native or underwent less denaturation than in PPAE as a result of the different extraction conditions. It was shown before that extracting protein under alkaline conditions could cause (partial) protein denaturation.9 For PC, the cooking process most probably caused complete denaturation of the protein present.16
| Enthalpy (J kg−1) | |
|---|---|
| Pea flour | 0.96 ± 0.01 b |
| Pea cells | n.d. |
| Pea protein alkali extract | 0.79 ± 0.01 b |
| pea protein salt extract | 1.84 ± 0.10 a |
| Casein | n.d. |
3.2 Evaluation of protein profile and secondary structure
SDS-PAGE analysis was performed (Fig. 1) to study the polypeptide mass profile of the different protein samples. Generally, the pea protein samples presented several bands between 10 and 100 kDa. The main ones were located at a molecular weight of around 75–80 kDa, 70 Da, 40 kDa, 35–37 kDa, 20–22 kDa, 18 kDa and 10 kDa. This profile is in line with previous SDS-PAGE analysis under reducing conditions of green pea protein.20,37 Bands around 70–80 kDa are associated with convicilin, while bands around 18, 35, and 50 kDa are related with dissociated vicilin trimers.20 The bands at 20 and 40 kDa are linked to β-legumin and α-legumin, respectively.6,37 These two subunits are normally connected with disulphide bonds which were broken due to the reducing conditions used. In all pea protein samples, bands related to albumins could also be observed (<15 kDa).20 However due to the dialysis step (molecular weight cut-off of 6–8 kDa), some smaller albumins could have been lost. Overall, little differences were observed in terms of the protein profile among the pea protein samples since in all samples globular protein were the main protein structures present.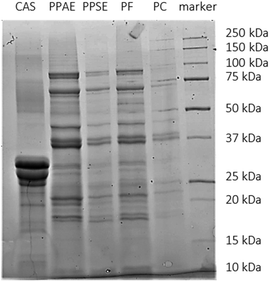 | ||
| Fig. 1 SDS-PAGE profile of the different protein extracts (CAS: sodium caseinate, PPAE: pea protein alkali extract, PPSE: pea protein salt extract, PF: pea flour, PC: pea cells). | ||
Since some structural differences were expected among the two pea protein rich extracts due to the distinct extraction conditions applied, the secondary structure was studied as well (Table 3). For both samples, (intermolecular) β-sheets were the major structures present. Additionally, substantial amounts of α-helices and β-turns were detected while anti-parallel β-sheets and amino acid side chains were present in minor amounts. Significant differences among PPAE and PPSE were detected in terms of the relative amount of β-sheets and α-helices. This profile was in line with previous research on the structural and functional properties of the different storage protein in pulses.6 Our results indicated that PPAE had slightly, but significantly more β-sheets while PPSE presented significantly more α-helices. A negative relation between the β-sheet content and protein digestibility was shown before for legumes like chickpea, lentil, and soybean. This was explained by the hydrophobic character of these β-sheet structures which can also negatively affect protein solubility.38
| Pea protein alkali extract | Pea protein salt extract | |
|---|---|---|
| Intermolecular β-Sheets (%) | 30.8 ± 1.3 | 30.3 ± 2.3 |
| β-Sheets (%) | 37.8 ± 1.9 | 34.8 ± 1.0* |
| α-Helix (%) | 8.7 ± 1.0 | 11.9 ± 2.0* |
| β-Turn (%) | 14.1 ± 0.5 | 14.4 ± 0.6 |
| Anti-parallel β-sheets (%) | 5.3 ± 0.3 | 5.4 ± 0.4 |
| Amino acid side chains (%) | 3.3 ± 0.5 | 3.3 ± 0.3 |
3.3 Protein solubility of the initial protein dispersions and under simulated gastric conditions
Protein solubility was evaluated for all samples (Table 4), except PC. It can be assumed for PC, that the protein solubility will be very low since all protein are incapsulated within the cell structures. The original PF had a native protein solubility of 66% in the 0.1 M sodium phosphate buffer (pH 7) used for sample preparation. The two protein-rich extracts, PPAE and PPSE, presented a completely different behaviour. PPAE presented a very low solubility (around 27%) in the phosphate buffer, while 77% of the PPSE protein was considered soluble. This observation is most probably related to differences in protein structures (Tables 2 and 3) present in the extract due to the different extraction conditions used. Previous research on pea protein already showed that using salt extraction led to a higher protein solubility in water while protein solubility in water was lower when using alkaline conditions.20 It is hypothesized that PPSE possesses more native protein in comparison to PPAE, solubilizing more easily due to its less hydrophobic character. The lab-scale produced PPAE had a higher solubility than determined by other researchers for commercial pea protein isolates which also underwent spray drying, leading to higher protein denaturation than freeze drying.3 Protein solubility for the pea protein rich extracts PPSE and PPAE, could have been improved by defatting the flour before protein extraction, reducing hydrophobic protein–lipid interactions.3 Also, co-extracted phytic acids have shown to negatively affect protein solubility of soybean.39 Additionally, protein solubility of pulse protein dispersion can be improved by processing, such as high pressure homogenisation.11,40 The milk protein, sodium caseinate, presented a relatively high protein solubility of around 88%.| Protein solubility (%) | ||
|---|---|---|
| Original sample | Gastric phase conditions | |
| Pea flour | 66.08 ± 3.83 c | 43.68 ± 2.30 c* |
| Pea protein alkali extract | 27.13 ± 0.03 d | 35.90 ± 1.98 d* |
| Pea protein salt extract | 76.91 ± 0.82 b | 76.87 ± 0.78 a |
| Casein | 87.59 ± 2.98 a | 49.10 ± 0.80 b* |
To gain more insight in the phenomena occurring during the simulated gastric phase, protein solubility was also evaluated under these increased salt and acidic conditions, yet without enzyme addition. Generally, some changes were observed in comparison to the original samples. For example, a significant decrease from 66% to 44% of protein solubility for PF was noticed. Protein solubility is highly depending on pH and salt conditions.6,20 The pH of the (static) gastric phase, pH 3, is rather close to the pI of protein very often reducing protein solubility in comparison to neutral pH conditions.6 However, for PPAE, protein solubility significantly increased from 27% to 36%. Nonetheless, protein solubility was still considered low for PPAE under gastric phase conditions. Protein solubility of PPSE remained the same as in the phosphate buffer (77%). Lastly, solubility of sodium caseinate significantly decreased from 88% to 49% under the gastric phase conditions. This milk protein is known for its low solubility at pH conditions between 3 and 5, especially at room temperature.41
3.4 Microstructural evaluation of all initial protein dispersions and during in vitro digestion
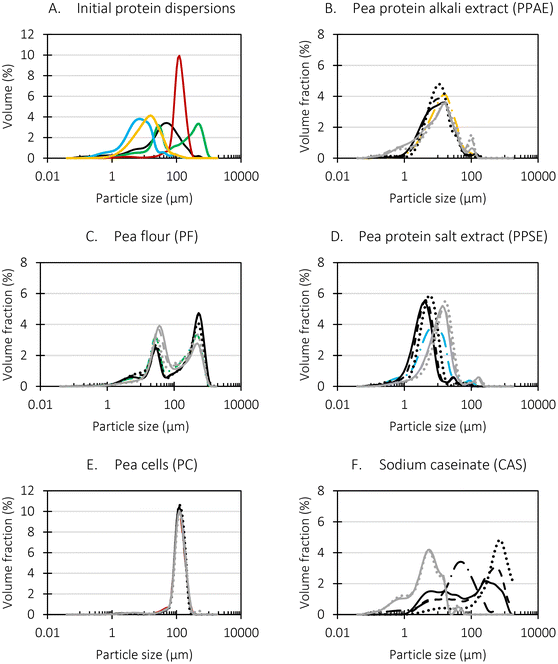
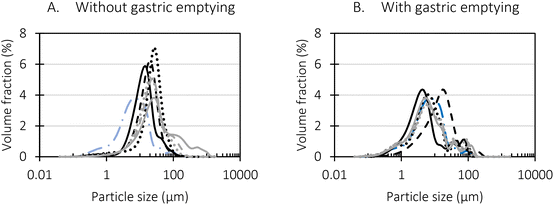
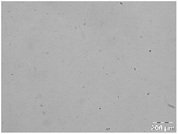
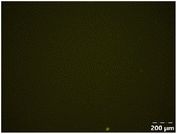
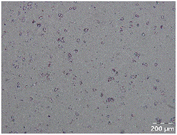
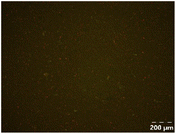
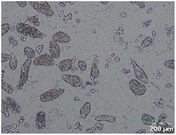
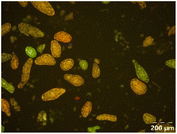
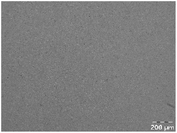
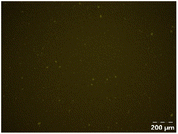
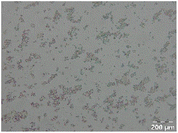
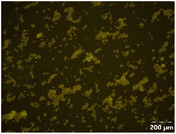
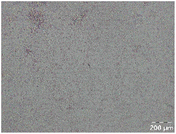
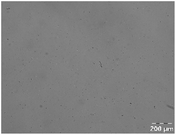
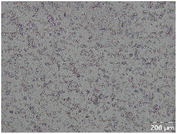
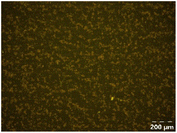
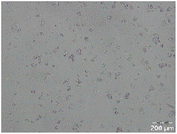
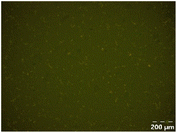
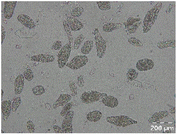
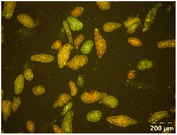
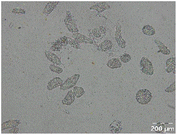
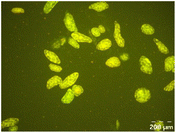
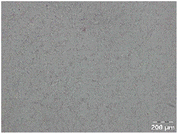
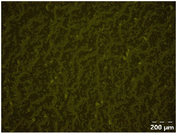
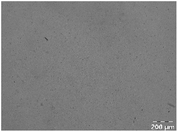
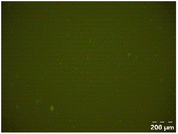
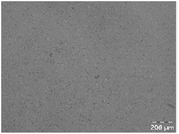
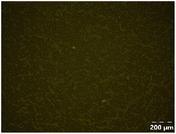
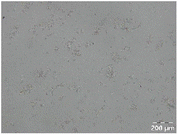
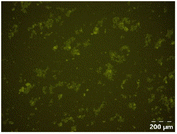
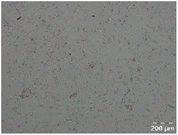
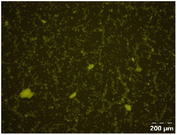
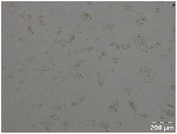
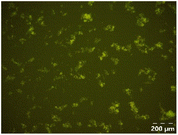
Particle size (distributions) of all initial, undigested samples as well as during in vitro digestion were evaluated to gain insight in potential changes which could affect proteolysis kinetics (Table 5 and Fig. 2, 3). Additionally, the observations of the particle size analysis were complemented with micrographs to visually display the microstructure (Tables 6 and 7).| Undigested | GP 20 min | GP 60 min | GP 120 min | |
|---|---|---|---|---|
| Casein | 62.92 ± 4.70 | 647.92 ± 16.29 | 345.30 ± 17.41 | 221.03 ± 2.52 |
| Pea flour | 233.89 ± 13.01 | 268.76 ± 20.13 | 302.22 ± 59.54 | 309.24 ± 43.36 |
| Pea cells | 132.27 ± 1.38 | 133.34 ± 0.32 | 134.71 ± 0.09 | 134.88 ± 0.22 |
| Pea protein alkali extract | 19.13 ± 0.22 | 15.70 ± 1.22 | 15.78 ± 0.03 | 15.97 ± 0.33 |
| Pea protein salt extract static | 12.27 ± 4.05 | 6.65 ± 0.44 | 7.23 ± 0.06 | 6.08 ± 1.51 |
| Pea protein salt extract without gastric emptying | 29.38 ± 0.46 | 21.57 ± 0.43 | 18.69 ± 0.30 | |
| GE 1 | GE 2 | GE 3 | ||
| Pea protein salt extract with gastric emptying | 13.56 ± 0.76 | 23.04 ± 0.67 | 11.93 ± 1.46 |
| Undigested | SIP 20 min | SIP 60 min | SIP 120 min | |
|---|---|---|---|---|
| Casein | 62.92 ± 4.70 | 6.86 ± 1.77 | 6.44 ± 0.76 | 7.08 ± 0.63 |
| Pea flour | 233.89 ± 13.01 | 231.59 ± 40.44 | 202.42 ± 45.85 | 201.33 ± 38.63 |
| Pea cells | 132.27 ± 1.38 | 140.45 ± 0.32 | 134.90 ± 0.45 | 134.42 ± 0.07 |
| Pea protein alkali extract | 19.13 ± 0.22 | 21.66 ± 2.31 | 20.41 ± 0.74 | 17.11 ± 1.04 |
| Pea protein salt extract static | 20.85 ± 1.19 | 18.77 ± 1.69 | 19.00 ± 0.60 | |
| Pea protein salt extract without gastric emptying | 12.27 ± 4.05 | 28.90 ± 0.37 | 35.55 ± 2.22 | 91.34 ± 11.24 |
| Pea protein salt extract with gastric emptying | 14.55 ± 0.55 | 15.25 ± 0.96 | 15.04 ± 2.81 |
Different particle size distributions were observed for the initial protein extracts. PF presented the highest average particle size, and a very heterogenous particle size distribution. The different peaks observed can be related to different microstructures present within the sample. In this sense, the region between 10 and 50 μm was linked to individual starch granules, protein bodies, and cell wall fragments released during cell breakage. The broad region between 50 and 1000 μm was related to seed coat fragments and other large tissues.36 The presence of this mix of microstructures is also visually observed in the micrograph (Table 6). The PC sample presented a uniform peak around 100–110 μm. This corresponds with the size of individual cotyledon cells which were extracted after wet sieving of cooked peas as reported before.16 Also, the micrograph mainly displayed individual cotyledon cells, next to some individual starch granules (Table 6). Previous research on individual cotyledon cells of lentils showed that the presence of the cell structure retards proteolysis in comparison to freely accessible protein.36 This more complex structural organisation of pea protein might eventually impact the in vitro proteolysis kinetics. Despite the high protein solubility presented in the original dispersion (section 3.3), CAS presented a relatively large average particle size. However, the micrograph presented a nicely dispersed microstructure for CAS. The two other protein-rich extracts, PPAE and PPSE, presented an average particle size around 19 and 12 μm, respectively. This is much smaller than the sizes detected for the other samples. However, this difference in particle size between PPAE and PPSE could still impact the digestion kinetics. The (fluorescent) micrographs do not completely align with the observations made during particle size analysis. PPSE presents some (weak) aggregation which might have broken up during particle size analysis, while PPAE presents a mix of densely packed protein (brighter green oval shapes) and dissolved protein (darker green background) (Table 7).
Particle size and microstructure were analysed at three different moments during the simulated gastric or small intestinal phase. For all pea protein-based samples, little differences were observed during the simulated static gastric phase in comparison to their respective initial sample (Table 5). For CAS, a drastic increase was observed when the sample was brought under the digestive conditions of the gastric phase. Previous studies already showed that milk protein mainly composed of casein, is pH sensitive and coagulates at pH values close to its pI.42 The aggregates formed decreased significantly in size as a function of gastric digestion time, yet the gastric samples presented much larger sizes than the original CAS dispersion. Overall, it can be stated that all pea protein-related samples showed much smaller particle sizes than CAS in the low pH environment of the gastric phase which might offer possibilities for usage in acidic food products. When the gastric phase was simulated in a semi-dynamic way, slightly larger particles were observed during the gastric phase which tended to decrease again in size towards the end of the simulated gastric digestion. For most samples, the particle sizes remained in the same order of magnitude during the simulated static small intestinal phase (Table 5). One exception was CAS, which presented a drastic decrease in particle size when shifting from the low pH conditions of the gastric phase towards neutral pH conditions in the small intestinal phase, related to a change in protein solubility.41
3.5 In vitro protein digestion
| Gastric phase | Small intestinal phase | ||||||
|---|---|---|---|---|---|---|---|
| C f | k | R 2 | C 0 | C f | k | R 2 | |
| Sodium caseinate | 7.00 ± 0.35 c | 0.047 ± 0.008 c | 0.96 | 7.52 ± 0.95 d | 18.49 ± 0.39 d | 0.279 ± 0.071 a | 0.95 |
| Pea flour | 13.75 ± 0.44 a | 0.289 ± 0.068 a | 0.95 | 16.70 ± 0.93 a | 24.71 ± 0.78 a | 0.046 ± 0.016 c | 0.90 |
| Pea cells | 5.79 ± 0.50 d | 0.041 ± 0.010 c | 0.92 | 7.90 ± 1.30 d | 22.03 ± 0.86 c | 0.062 ± 0.016 c | 0.94 |
| Pea protein alkali extract | 9.18 ± 0.30 b | 0.198 ± 0.037 b | 0.95 | 10.82 ± 0.79 c | 17.75 ± 0.57 e | 0.055 ± 0.018 c | 0.91 |
| Pea protein salt extract static | 14.21 ± 0.35 a/C | 0.329 ± 0.066 a/A | 0.97 | 13.85 ± 0.84 b/C | 23.39 ± 0.41 b/C | 0.111 ± 0.025 b/A | 0.95 |
| PPSE without gastric emptying | 18.59 ± 1.54 A | 0.096 ± 0.038 B | 0.86 | 21.50 ± 0.32 A | 25.83 ± 0.27 B | 0.047 ± 0.011 B | 0.96 |
| PPSE with gastric emptying | 16.48 ± 0.57 B | 0.056 ± 0.005 C | 0.99 | 15.98 ± 0.82 B | 31.76 ± 1.08 A | 0.030 ± 0.006 C | 0.97 |
Firstly, when looking at the experimental data of the simulated gastric phase, the semi-dynamic approaches presented the highest final extent of bioaccessible protein. Oppositely, the static approach presented a significantly lower amount of bioaccessible protein at the end of the gastric phase. Additionally, differences were observed related to the reaction rate constant (k). It could be clearly observed that the static approach reached the plateau the fastest, followed by the semi-dynamic approaches. The semi-dynamic approach without gastric emptying did not reach the plateau within the time frame of the simulated gastric phase. This can be related to the combined effect of gradual enzyme addition and acidification of the chyme15 which allows a gradual increase of pepsin activity. In contrast, in the case of static in vitro digestion, all enzymes are added from the start of the simulated phase.
Besides, the pH is set at 3 from the start of the gastric phase which is not optimal but allows pepsin activity from the onset of the gastric phase. It can thus be concluded that the in vitro digestion approach used will impact the digestion kinetics obtained, especially the path followed to the end of (gastric) digestion. Similar conclusions were made in our previous research on lentils, yet more similar final digestions extents were observed.15
Slightly different observations were made in the simulated small intestinal phase. The digestion behaviour of the static and MuReDi approach were very similar, reaching similar extents despite to the differences at the end of the simulated gastric phase which seemed to be compensated by the action of trypsin and chymotrypsin. The static small intestinal simulation followed after gastric emptying, went much slower, reaching a final amount of bioaccessible protein slightly higher than the other approaches. The much slower reaction rate constant in the former case might be explained by the mix of digested aliquots present at the start of the small intestinal phase. In more detail, to simulate the static small intestinal phase after gastric emptying, all emptied samples were pooled and pepsin activity was stopped by increasing pH to around 7. This means that each emptied sample had a different extent of proteolysis. In other words, some pea protein were only hydrolysed to a very low extent (e.g., first emptied sample) while the samples emptied towards the end of the gastric phase were most likely hydrolysed to a much higher extent which might impact enzyme action in the subsequent small intestinal phase. In particular, it is possible that trypsin and chymotrypsin potentially prefer to hydrolyse larger protein structures first, slowing down the overall release of bioaccessible protein.
4 Conclusions
In this work, different extraction methods were used to create pea protein extracts with distinct structural properties, impacting their structural organization in dispersion. More specifically, individual pea cells were isolated from cooked peas using wet sieving, leading to denatured, encapsulated protein with a high level of structural organization. Besides, two extraction conditions were used, alkaline conditions followed by isoelectric precipitation (PPAE) versus salt extraction (PPSE), to create pea protein rich extracts with distinct structural properties. The pea protein profile between those two extracts was highly similar, yet some significant differences were observed in the secondary structure. In this context, more protein–protein hydrophobic interactions were detected for PPAE than for PPSE. Additionally, enthalpy changes related to protein denaturation were higher for PPSE than PPAE, meaning than the protein of PPSE were more native than the ones of PPAE. Lastly, protein solubility in a phosphate buffer was much lower for PPAE (27%) than for PPSE (77%). However, limited differences were detected in particle size (distribution) among the two samples when dispersed in a phosphate buffer. In terms of in vitro protein digestibility, both the rate constant and extent of proteolysis were much lower for the pea cells and alkali extract than for the salt extract. Besides, the salt extract had a very similar digestion behaviour as the original, uncooked pea flour. This means that the differences in protein structure significantly impacted the structural organization of protein in dispersion and subsequently in vitro digestion kinetics.Lastly, also the in vitro digestion approach used significantly impacted the digestion behaviour. Static digestion approaches are the most simple approaches delivering a quick screening tool to compare different food design properties. However, when more realistic insight in the digestion behaviour, especially rate, needs to be obtained, semi-dynamic approaches seem to be more appropriate to use since these approaches significantly affect the digestion kinetics.
Overall, the insights obtained in this work should be further extended with different extraction and production conditions. Additionally, the potential of such new pulse-based ingredients should be investigated in more realistic food products with varying pH and salt concentrations since this will largely affect its application potential. Besides, in vivo consequences of incorporating protein with different (combinations) microstructures could be studied as well. In conclusion, this work displayed the need to better understand structure–function–digestion relationships of new pulse-based ingredients or foods to be able to steer the (digestive) functionality and potentially physiological responses.
Abbreviations
| CAS | Sodium caseinate |
| PC | Pea cells |
| PF | Pea flour |
| PPAE | Pea protein alkali extract |
| PPSE | Pea protein salt extract |
| TCA | Trichloroacetic acid |
Author contributions
S.H.E. Verkempinck: conceptualization; data curation; formal analysis; funding acquisition; investigation; methodology; visualization; writing – original draft. D. Duijsens: methodology; writing – review & editing. A. Mukherjee: investigation; methodology. P.J. Wilde: supervision; writing – review & editing.Conflicts of interest
There are no conflicts to declare.Acknowledgements
The authors want to acknowledge the financial support of the Internal Funds KU Leuven. D. Duijsens is a Doctoral Researcher funded by the Research Foundation Flanders (FWO – Grant No. 1S23321N). A. Mukherjee is a Doctoral Researcher funded by Flanders Innovation & Entrepreneurship (VLAIO) in the context of the ProFuNu project (HBC.2021.0546). We also want to thank Casibeans (Melsele, Belgium) for the donation of the green peas and Alek Vernelen for his help with the practical work.References
- W. Willett, J. Rockström, B. Loken, M. Springmann, T. Lang, S. Vermeulen, T. Garnett, D. Tilman, F. DeClerck and A. Wood, et al., Food in the Anthropocene: the EAT-Lancet Commission on healthy diets from sustainable food systems, Lancet, 2019, 393, 447–492 CrossRef PubMed.
- A. Pallares Pallares, S. Gwala, K. Pälchen, D. Duijsens, M. Hendrickx and T. Grauwet, Pulse seeds as promising and sustainable source of ingredients with naturally bioencapsulated nutrients: Literature review and outlook, Compr. Rev. Food Sci. Food Saf., 2021, 20, 1524–1553 CrossRef.
- V. García Arteaga, S. Kraus, M. Schott, I. Muranyi, U. Schweiggert-Weisz and P. Eisner, Screening of Twelve Pea (Pisum sativum L.) Cultivars and Their Isolates Focusing on the Protein Characterization, Functionality, and Sensory Profiles, Foods, 2021, 10, 758 CrossRef.
- D.-T. Wu, W.-X. Li, J.-J. Wan, Y.-C. Hu, R.-Y. Gan and L. Zou, A Comprehensive Review of Pea (Pisum sativum L.): Chemical Composition, Processing, Health Benefits, and Food Applications, Foods, 2023, 12, 2527 CrossRef CAS.
- A. R. Taherian, M. Mondor, J. Labranche, H. Drolet, D. Ippersiel and F. Lamarche, Comparative study of functional properties of commercial and membrane processed yellow pea protein isolates, Food Res. Int., 2011, 44, 2505–2514 CrossRef CAS.
- L. Chang, Y. Lan, N. Bandillo, J. B. Ohm, B. Chen and J. Rao, Plant proteins from green pea and chickpea: Extraction, fractionation, structural characterization and functional properties, Food Hydrocolloids, 2022, 123, 107165 CrossRef CAS.
- C. Tanger, J. Engel and U. Kulozik, Influence of extraction conditions on the conformational alteration of pea protein extracted from pea flour, Food Hydrocolloids, 2020, 107, 105949 CrossRef CAS.
- J. Yang, S. Zamani, L. Liang and L. Chen, Extraction methods significantly impact pea protein composition, structure and gelling properties, Food Hydrocolloids, 2021, 117, 106678 CrossRef CAS.
- C. G. Miranda, P. Speranza and L. E. Kurozawa, Kawazoe Sato AC, Lentil protein: impact of different extraction methods on structural and functional properties, Heliyon, 2022, 8, e11775 CrossRef CAS PubMed.
- K. Jakobson, A. Kaleda, K. Adra, M.-L. Tammik, H. Vaikma, T. Kriščiunaite and R. Vilu, Techno-Functional and Sensory Characterization of Commercial Plant Protein Powders, Foods, 2023, 12, 2805 CrossRef CAS PubMed.
- J. M. Guevara-Zambrano, S. H. E. Verkempinck, L. Hernandez-Ruiz, M. R. Infantes-Garcia and M. E. Hendrickx, Van Loey AM, Grauwet T, Digestion kinetics of lipids and proteins in plant-based shakes: Impact of processing conditions and resulting structural properties, Food Chem., 2022, 382, 132306 CrossRef CAS PubMed.
- R. Colombo, L. Ferron, I. Frosi and A. Papetti, Advances in static in vitro digestion models after the COST action Infogest consensus protocol, Food Funct., 2021, 12, 7619–7636 RSC.
- T. Bohn, F. Carriere, L. Day, A. Deglaire, L. Egger, D. Freitas, M. Golding, S. Le Feunteun, A. Macierzanka and O. Menard, et al., Correlation between in vitro and in vivo data on food digestion. What can we predict with static in vitro digestion models?, Crit. Rev. Food Sci. Nutr., 2017, 1–23 Search PubMed.
- A.-I. Mulet-Cabero, L. Egger, R. Portmann, O. Ménard, S. Marze, M. Minekus, S. Le Feunteun, A. Sarkar, M. M.-L. Grundy and F. Carrière, et al., A standardised semi-dynamic in vitro digestion method suitable for food – an international consensus, Food Funct., 2020, 11, 1702–1720 RSC.
- S. H. E. Verkempinck, D. Duijsens, D. Michels, J. M. Guevara-Zambrano, M. R. Infantes-Garcia, K. Pälchen and T. Grauwet, Studying semi-dynamic digestion kinetics of food: Establishing a computer-controlled multireactor approach, Food Res. Int., 2022, 156, 111301 CrossRef CAS PubMed.
- J. M. Guevara-Zambrano, S. H. E. Verkempinck, B. Muriithi, D. Duijsens, M. E. Hendrickx, A. M. V. Loey and T. Grauwet, Protein accessibility level affects macronutrient digestion kinetics of plant-based shakes, Food Hydrocolloids, 2023, 137, 108428 CrossRef CAS.
- S. Gwala, A. Pallares Pallares, K. Pälchen, M. Hendrickx and T. Grauwet, In vitro starch and protein digestion kinetics of cooked Bambara groundnuts depend on processing intensity and hardness sorting, Food Res. Int., 2020, 137, 109512 CrossRef CAS PubMed.
- J. Yang, G. Liu, H. Zeng and L. Chen, Effects of high pressure homogenization on faba bean protein aggregation in relation to solubility and interfacial properties, Food Hydrocolloids, 2018, 83, 275–286 CrossRef CAS.
- X. D. Sun and S. D. Arntfield, Gelation properties of salt-extracted pea protein induced by heat treatment, Food Res. Int., 2010, 43, 509–515 CrossRef CAS.
- C. Tanger, J. Engel and U. Kulozik, Influence of extraction conditions on the conformational alteration of pea protein extracted from pea flour, Food Hydrocolloids, 2020, 107, 105949 CrossRef CAS.
- F. Mariotti, D. Tomé and P. P. Mirand, Converting Nitrogen into Protein—Beyond 6.25 and Jones’ Factors, Crit. Rev. Food Sci. Nutr., 2008, 48, 177–184 CrossRef CAS PubMed.
- J. L. Maubois and D. Lorient, Dairy proteins and soy proteins in infant foods nitrogen-to-protein conversion factors, Dairy Sci. Technol., 2016, 96, 15–25 CrossRef CAS PubMed.
- F. Janssen, A. G. B. Wouters, B. Pareyt, L. R. Gerits, J. A. Delcour, E. Waelkens and R. Derua, Wheat (Triticum aestivum L.) lipid species distribution in the different stages of straight dough bread making, Food Res. Int., 2018, 112, 299–311 CrossRef CAS PubMed.
- C. M. Chigwedere, T. F. Olaoye, C. Kyomugasho, Z. Jamsazzadeh Kermani, A. Pallares Pallares, A. M. Van Loey, T. Grauwet and M. E. Hendrickx, Mechanistic insight into softening of Canadian wonder common beans (Phaseolus vulgaris) during cooking, Food Res. Int., 2018, 106, 522–531 CrossRef CAS PubMed.
- U. K. Laemmli, Cleavage of Structural Proteins during the Assembly of the Head of Bacteriophage T4, Nature, 1970, 227, 680–685 CrossRef CAS PubMed.
- C. Kyomugasho, S. Christiaens, A. Shpigelman, A. M. Van Loey and M. E. Hendrickx, FT-IR spectroscopy, a reliable method for routine analysis of the degree of methylesterification of pectin in different fruit- and vegetable-based matrices, Food Chem., 2015, 176, 82–90 CrossRef CAS PubMed.
- J. Kong and S. Yu, Fourier Transform Infrared Spectroscopic Analysis of Protein Secondary Structures, Acta Biochim. Biophys. Sin., 2007, 39, 549–559 CrossRef CAS.
- J. L. R. Arrondo and F. M. Goñi, Structure and dynamics of membrane proteins as studied by infrared spectroscopy, Prog. Biophys. Mol. Biol., 1999, 72, 367–405 CrossRef CAS.
- A. Barth, Infrared spectroscopy of proteins, Biochim. Biophys. Acta, Bioenerg., 2007, 1767, 1073–1101 CrossRef CAS PubMed.
- A. Brodkorb, L. Egger, M. Alminger, P. Alvito, R. Assunção, S. Ballance, T. Bohn, C. Bourlieu-Lacanal, R. Boutrou and F. Carrière, et al., INFOGEST static in vitro simulation of gastrointestinal food digestion, Nat. Protoc., 2019, 14, 991–1014 CrossRef CAS PubMed.
- S. H. E. Verkempinck, L. Salvia-Trujillo, L. G. Moens, C. Carrillo, A. M. Van Loey, M. E. Hendrickx and T. Grauwet, Kinetic approach to study the relation between in vitro lipid digestion and carotenoid bioaccessibility in emulsions with different oil unsaturation degree, J. Funct. Foods, 2018, 41, 135–147 CrossRef CAS.
- K. Pälchen, D. Michels, D. Duijsens, S. T. Gwala, A. K. Pallares Pallares, M. Hendrickx, A. Van Loey and T. Grauwet, In vitro protein and starch digestion kinetics of individual chickpea cells: from static to more complex in vitro digestion approaches, Food Funct., 2021, 12, 7787–7804 RSC.
- P. M. Nielsen, Improved Method for Determining Protein Hydrolysis, J. Food Sci., 2001, 66, 642–646 CrossRef CAS.
- M. Zahir, V. Fogliano and E. Capuano, Food matrix and processing modulate: In vitro protein digestibility in soybeans, Food Funct., 2018, 9, 6326–6336 RSC.
- D. Duijsens, A. I. Alfie Castillo, S. H. E. Verkempinck, K. Pälchen, M. E. Hendrickx and T. Grauwet, In vitro macronutrient digestibility and mineral bioaccessibility of lentil-based pasta: The influence of cellular intactness, Food Chem., 2023, 423, 136303 CrossRef CAS PubMed.
- D. Duijsens, K. Palchen, A. De Coster, S. H. E. Verkempinck, M. E. Hendrickx and T. Grauwet, Effect of manufacturing conditions on in vitro starch and protein digestibility of (cellular) lentil-based ingredients, Food Res. Int., 2022, 158, 111546 CrossRef CAS PubMed.
- P. J. Shand, H. Ya and Z. Pietrasik, Wanasundara PKJPD: Physicochemical and textural properties of heat-induced pea protein isolate gels, Food Chem., 2007, 102, 1119–1130 CrossRef CAS.
- M. Carbonaro, P. Maselli and A. Nucara, Relationship between digestibility and secondary structure of raw and thermally treated legume proteins: a Fourier transform infrared (FT-IR) spectroscopic study, Amino Acids, 2012, 43, 911–921 CrossRef CAS PubMed.
- F. Ali, D. Ippersiel, F. Lamarche and M. Mondor, Characterization of low-phytate soy protein isolates produced by membrane technologies, Innovative Food Sci. Emerging Technol., 2010, 11, 162–168 CrossRef CAS.
- E. Keuleyan, P. Gélébart, V. Beaumal, A. Kermarrec, L. Ribourg-Birault, S. Le Gall, A. Meynier, A. Riaublanc and C. Berton-Carabin, Pea and lupin protein ingredients: New insights into endogenous lipids and the key effect of high-pressure homogenization on their aqueous suspensions, Food Hydrocolloids, 2023, 141, 108671 CrossRef CAS.
- A. E. Post, B. Arnold, J. Weiss and J. Hinrichs, Effect of temperature and pH on the solubility of caseins: Environmental influences on the dissociation of αS- and β-casein, J. Dairy Sci., 2012, 95, 1603–1616 CrossRef CAS PubMed.
- A. I. Mulet-Cabero, A. R. Mackie, P. J. Wilde, M. A. Fenelon and A. Brodkorb, Structural mechanism and kinetics of in vitro gastric digestion are affected by process-induced changes in bovine milk, Food Hydrocolloids, 2019, 86, 172–183 CrossRef CAS.
- A. Rivera del Rio, A. C. Möller, R. M. Boom and A. E. M. Janssen, In vitro gastro-small intestinal digestion of conventional and mildly processed pea protein ingredients, Food Chem., 2022, 387, 132894 CrossRef CAS PubMed.
- N. Perez-Moral, S. Saha, A. M. Pinto, B. H. Bajka and C. H. Edwards, In vitro protein bioaccessibility and human serum amino acid responses to white bread enriched with intact plant cells, Food Chem., 2023, 404, 134538 CrossRef CAS.
- K. Pälchen, W. L. P. Bredie, D. Duijsens, A. I. Alfie Castillo, M. Hendrickx, A. Van Loey, A. Raben and T. Grauwet, Effect of processing and microstructural properties of chickpea-flours on in vitro digestion and appetite sensations, Food Res. Int., 2022, 157, 111245 CrossRef.
| This journal is © The Royal Society of Chemistry 2024 |

