
 Open Access Article
 This Open Access Article is licensed under a
 Creative Commons Attribution 3.0 Unported Licence
Reduction of neutral lipid reservoirs, bioconversion and untargeted metabolomics reveal distinct roles for vitamin K isoforms on lipid metabolism†
Natália Gonçalves
Silva
 ab,
Marco
Preto
a,
Vitor
Vasconcelos
ab and
Ralph
Urbatzka
*a
ab,
Marco
Preto
a,
Vitor
Vasconcelos
ab and
Ralph
Urbatzka
*a
aInterdisciplinary Centre of Marine and Environmental Research (CIIMAR/CIMAR), University of Porto, Avenida General Norton de Matos, s/n, 4450-208 Matosinhos, Portugal. E-mail: rurbatzka@ciimar.up.pt; Tel: +351-223-401-818
bFCUP, Faculty of Science, Department of Biology, University of Porto, Rua do Campo Alegre, 4169-007 Porto, Portugal
First published on 30th January 2024
Abstract
Vitamin K isoforms are known as co-factors for the synthesis of blood-clotting proteins, but several other bioactivities were reported. In this work, we isolated a vitamin K1-analogue (OH-PhQ) from the cyanobacterium Tychonema sp. LEGE 07196 with lipid reducing activity. OH-PhQ reduced neutral lipid reservoirs with an EC50 value of 31 μM after 48 h exposure in zebrafish larvae, while other vitamin K isoforms had EC50 values of 21.1 μM (K2) and 1.2 μM (K3). No lipid reducing activity was observed for K1 up to 50 μM. The presence of vitamin K isoforms was studied in zebrafish after exposure (OH-PhQ, K1, K2 and K3), and a clear preference for bioconversion was observed to retain K1 and OH-PhQ. Untargeted metabolomics revealed different biological effects for vitamin K isoforms on the subclass and metabolite level, but similarities were present on the compound class level, particularly on the regulation of glycerophospholipids. Our data showed for the first time a lipid reducing activity of OH-PhQ and performed a comparative analysis of vitamin K isoforms, which could be important for the development of future nutraceuticals or food supplements.
Introduction
The prevalence of obesity is continuously increasing over the years, and transversally to all age groups. Obesity represents a serious health risk, leading to the emergence of chronic diseases, such as the metabolic syndrome, diabetes and cardiovascular diseases, amongst others.1 Recent reports showed that non-communicable diseases are responsible for as much as 71% of all deaths globally.2 Obesity and its related metabolic dysfunctions are largely contributing to these numbers, and focusing on the prevention may be effective to overcome this epidemic.Vitamins are fundamental micronutrients for organisms and are mainly obtained through the diet. The vitamin K family was first discovered in 1935.3 These compounds have a common polar naphthoquinone ring, named menadione, and a variable aliphatic side-chain. Vitamin K1 (phylloquinone) and K2 (menaquinone) are the two naturally occurring compounds. Vitamin K1 is mainly produced by plants, algae and a few species of cyanobacteria, and primarily found in human diet in green leafy vegetables, vegetables oils and some fruits. Vitamin K2 is produced by anaerobic bacteria and found in animal-based and fermented foods.4 In mammals, vitamin K2 (MK-4) is mostly obtained from the systemic conversion of K1 in gut microbiota and in certain tissues by the UbiA prenyltransferase domain-containing protein 1 (UBIAD1) enzyme.5,6 Although often named as vitamin K3, menadione is not a naturally produced compound, but a product of K1 catabolism and a circulating precursor of K2, and as such, is more adequately classified as a pro-vitamin.7 The vitamin K family is mostly known for its key role in coagulation disorders by serving as a co-factor for the synthesis of blood-clotting proteins, however, recent reports have linked this vitamin family to new beneficial biological activities, including bone metabolism, prevention of cardiovascular diseases, neuronal, antioxidant, and anti-inflammatory activities.8
Zebrafish is increasingly used as a relevant model in biomedicine, and its larvae are suitable for drug discovery, fitting into microwell plates and allowing medium-throughput bioactivity screening. The zebrafish larvae Nile red fat metabolism assay was successfully applied in our laboratory to discover lipid-reducing compounds from chemically modified plant polyphenols9 and different organisms, such as fungus,10 sponges,11 or cyanobacteria.12 Zebrafish is a complex in vivo model with physiological relevance and homology of lipid metabolism with mammals.13 In the present study, we aimed to identify novel cyanobacterial secondary metabolites with lipid reducing activity. Herein, we report the isolation of a vitamin K1-analogue from the cyanobacterium Tychonema sp. LEGE 07196, and for the first time its bioactivity on reducing neutral lipid reservoirs in zebrafish larvae. The lipid reducing activity was compared to other vitamin K isoforms (K1, K2, and K3), which revealed an interesting structure–activity relationship of the vitamin K backbone. Additionally, the bioconversion of the vitamin K isoforms was analysed by whole larvae metabolite extraction and LC-MS/MS analysis. The biological effects of vitamin k isoforms were studied by evaluating the alterations of the zebrafish metabolome. The presented data demonstrate significant differences between the members of the vitamin K family, which could be important for the future development of nutraceuticals.
Materials and methods
Chemicals and reagents
HPLC or MS grade chemicals were purchased from VWR Chemicals (part of Avantor, Radnor, PA, USA), Fisher Scientific Chemicals (division from Thermo Fisher Scientific, Hampton, NH, USA), Honeywell (Charlotte, NC, USA) or PanReac AppliChem ITW Reagents (Barcelona, Spain). Vitamin K1, K2 (MK-4) and K3 analytical standards were purchased from Sigma-Aldrich (St Louis, MO, USA). Deuterated dimethyl sulfoxide (DMSO-d6, (CD3)2SO; 99.96%, NMR analytical grade) was obtained from Eurisotop (subsidiary of Cambridge Isotope Laboratories, Inc. (CIL), Tewksbury, MA, USA). Piperazine-1,4-bis(2-ethanesulfonic acid) (PIPES) and N-(9-fluorenylmethoxycarbonyl)-L-proline (Fmoc-Pro-OH) were supplied by Sigma-Aldrich (St Louis, MO, USA).OH-phylloquinone isolation and structure elucidation
The vitamin isoform was extracted and isolated from freeze-dried biomass of the cyanobacteria strain Tychonema sp. LEGE 07196, following first a bioassay-guided and later a MS-guided fractionation. Briefly, 70 g of biomass was extracted by MeOH to yield 11 g of crude extract. After 5 rounds of chromatographic separation (VLC, flash chromatography, SPE, HPLC) the compound 51′-OH-phylloquinone was isolated, yielding 6.48 mg of pure compound. One- and two-dimensional (1D and 2D) NMR analysis, together with LC-HR-ESI-MS and MS/MS analysis, was performed to confirm the identification. More details can be found in Appendix B (App. B) of the ESI.†Zebrafish Nile red fat metabolism assay
The lipid reducing activity of compounds was analysed using the zebrafish Nile red assay as previously described.9 An approval by an ethics committee was not necessary for the presented work, since chosen procedures are not considered animal experimentation according to the EC Directive 86/609/EEC for animal experiments. In brief, zebrafish larvae were exposed from 3–5 days post-fertilization (DPF) to cyanobacterial fractions at a final concentration of 10 μg mL−1 in a 48-well plate with a density of 6–8 larvae per well (n = 6–8). Neutral lipids were stained with Nile red overnight at the final concentration of 10 ng mL−1. For imaging, the larvae were anesthetized with tricaine (MS-222, 0.03%) for 5 min and fluorescence analysed with a fluorescence microscope (Leica Microsystems, DM6000B Motorized Microscope, Wetzlar, Germany). In further assays, the half maximal effective concentration (EC50) values of the purified compound OH-PhQ and of commercial vitamins K1, K2 and K3 analytical standards were determined by dose–response curves using a dilution series from 0.7 μM to 50 μM in seven dilution steps for K1, OH-PhQ and K2, and from 0.05 μM to 3.13 μM for K3.Sample preparation and metabolite extraction
Obtained EC50 values from lipid reduction assays were used for the following experiments. Zebrafish were exposed to 50 μM K1, 31.3 μM K1-analogue, 21.1 μM K2 and 1.2 μM K3. The exposure of zebrafish larvae was done for 48 h (3–5 DPF) and two solvent controls 0.1% DMSO and 1![[thin space (1/6-em)]](https://www.rsc.org/images/entities/char_2009.gif) :1 n-hexane/EtOH (n-Hex/ethanol) were included. Zebrafish larvae were anesthetized, and 50 larvae were pooled for each replicate. Pools were washed with assay medium prior to collection, and the medium completely removed before freezing. A total of three biological replicates were prepared for each treatment group. The samples were stored at −80 °C for the following metabolomics analyses.
:1 n-hexane/EtOH (n-Hex/ethanol) were included. Zebrafish larvae were anesthetized, and 50 larvae were pooled for each replicate. Pools were washed with assay medium prior to collection, and the medium completely removed before freezing. A total of three biological replicates were prepared for each treatment group. The samples were stored at −80 °C for the following metabolomics analyses.
The metabolite extraction was performed using two distinct protocols. The general extraction was adapted from Lin et al.,14 as followed: 500 μL of Ripa buffer was added, together with 125 μL of Fmoc-Pro-OH as IS1 (internal standard 1). The samples were homogenized for 2 min (Precellys, Bertin Precellys®24, Montigny-le-Bretonneux, France). 250 μL of ACN was added, the samples were placed on ice for 10 min, centrifuged at 15000g for 10 min at 4 °C, and the supernatant collected. Next, samples were evaporated to dryness and reconstituted with 100 μL of 1:1 v/v ACN/H2O containing 5 μL of PIPES as IS2. The samples were filtered through 0.2 μm filters (Sartorius Minisart®, Göttingen, Germany), and stored at −20 °C until the LC-ESI-HRMS analysis. The targeted extraction was adapted from Hirota et al.,15 as followed: 1 mL of 1:9 v/v EtOH/acetone was added. The samples were homogenized for 2 min (Precellys). The lysates were vortexed for 3 min and allowed to stand for 5 min on ice. This procedure was repeated three times. The resulting mixture was centrifuged at 3000 rpm for 5 min at 4 °C, and the supernatant evaporated to dryness. The residue was dissolved in 800 μL of 1:3 v/v H2O/n-Hex, thoroughly mixed for 10 s, and centrifuged at 3000 rpm for 5 min at 4 °C to collect the supernatant. Next, the samples were evaporated to dryness, reconstituted with 100 μL of MeOH containing 5 μL of Fmoc-Pro-OH (IS1), filtered through 0.2 μm filters, and stored at −20 °C. An aliquot of each treatment of each extraction procedure was subjected to LC-ESI-HRMS analyses as described in App. A, ESI.†
Statistics
The Gaussian distribution of data was tested by a Kolmogorov–Smirnov normality test (p < 0.05), and homogeneity of variance was determined by Bartlett's test. Depending on the outcome, one-way ANOVA was used followed by Dunnett's post hoc test (parametric distribution) or Kruskal–Wallis followed by Dunn's post hoc test (non-parametric distribution). Statistically significant differences were considered with p < 0.05. The data from dose–response curves were used to determine EC50 values for lipid reducing bioactivity. A non-linear regression was applied with a variable slope and least squares fitting to calculate the EC50 values from the dose–response curves.Results
Isolation of 51′-OH-phylloquinone
The biomass of the cyanobacterium Tychonema sp. LEGE 07196 was extracted by methanol followed by several rounds of chromatographic fractionations. The bioactivity/MS-guided isolation yielded a yellow-greenish oil compound, shown in Fig. 1. The molecular formula C31H46O3 was established based on LC-HR-ESI-MS data, m/z 467.3531 [M + H]+ (calculated C31H47O3, Δ1.6 ppm), demanding five degrees of unsaturation. The monoisotopic value and the molecular formula were consistent with the previously known 51′-OH-phylloquinone isolated from a cyanobacteria (OH-PhQ).19 1D and 2D NMR experiments (including 1H and 13C spectra, App. B, Table S1, Fig. S2–S6†) and LC-HR-ESI-MS/MS analysis also corroborated this assignment, revealing the typical resonances and correlations of this vitamin K1-analogue.20,21 This included the presence of the additional hydroxy moiety, comparing the LC-HR-ESI-MS/MS data: the difference between the monoisotopic m/z 467.3531 [M + H]+ value and the fragment at m/z 449.3387 [M − H2O]+. The reported m/z value for K1 is 451.4 [M + H]+.22 | ||
| Fig. 1 Planar chemical structures of the isolated 51′-OH-phylloquinone and other vitamin K isoforms. | ||
The relative and absolute stereochemistry of OH-PhQ was analyzed by ROESY and ECD experiments (App. B, Fig. S7, ESI†) and compared to literature data. The comparison indicates that the protons of the hydroxy group have alpha (α) orientation. Additionally, the isolated compound showed a −23.98° OR (optical rotation), however the obtained spectrum of ECD did not show clear results. Consequently, the 5′S stereochemistry configuration was assigned through comparison of ROESY and literature data. More detailed information is available in App. B, ESI.†
Lipid reducing activity of OH-PhQ and other vitamin K isoforms in zebrafish larvae
The zebrafish larvae, which were exposed to OH-PhQ at 10 μg mL−1 from 3 to 5 DPF, displayed a significant reduction of neutral lipids in the yolk sac/intestine region compared to the solvent control 0.1% DMSO (Fig. 2A). Dose–response curves indicated an EC50 value of 31.3 μM (Fig. 2B and C). | ||
| Fig. 2 Zebrafish Nile red fat metabolism assay. (A) Representative images of the assay (overlay of bright field and red fluorescence channel). (B) Box-whisker plots of lipid reducing activity in the zebrafish larvae after 48 h exposure. Solvent control was 0.1% dimethyl sulfoxide (DMSO) and positive control 50 μM resveratrol (REV). Values are expressed as percentage of mean fluorescence intensity (MFI) relative to the DMSO group and are derived from six to eight individual larvae per treatment group (n = 6–8). Asterisks highlight significant altered fluorescence intensities vs. the solvent control that indicate changes of neutral lipid level (**** p < 0.0001; *** p < 0.001). (C) EC50 values of vitamin K isoforms, derived from two independent assays and shown in μM ± standard deviation (SD). | ||
Additionally, other vitamin K isoforms were tested for the same bioactivity. Due to the lipophilicity of vitamin K1, a mixture of 1:1 v/v n-Hex/EtOH was used as solvent control at 0.1%. In accordance to results of the DMSO solvent control, this mixture neither caused any observable toxicity nor malformations of the zebrafish larvae. K1 did not reduce the neutral lipids in any of the tested concentrations (up to 50 μM), in contrast to K2 and K3 that had EC50 values of 21.1 and 1.2 μM, respectively, as shown in Fig. 2C and App. C, S11, ESI.† However, zebrafish larvae exposed to K3 at concentrations higher than 7.6 μM showed clear signs of toxicity with mortality at 24 h of exposure (data not shown).
The supplementation with vitamin K isoforms clearly showed different effectivity on lipid reduction in vivo, which highlights the importance of the distinctive chemical structures. The naphthoquinone ring, even if toxic at higher concentrations without the presence of the side-chain, as well as the impact of the saturation and polarity of the aliphatic side-chain were important for the observed structure–activity relationship.
Bioconversion of the vitamin K family in zebrafish larvae
The vitamin K isoforms were quantified in the corresponding zebrafish exposure groups by LC-MS/MS, and the bioconversion patterns into the other isoforms were studied (Fig. 3). The presented quantification values correspond to the mean of the three biological replicates (50 pooled larvae per replica) from each treatment group. The mean concentration quantified for vitamins K1, OH-PhQ, K2 and K3 in the corresponding zebrafish exposure groups were 5.52 μM, 2.14 μM, 0.14 μM and 0.01 μM, respectively. In the K1 and K2 exposure groups, 0.2% of OH-PhQ was detected, while in the K2 supplementation group a higher molarity of K1 was present than K2. In contrast, K2 was not detected in the K1 exposure group. OH-PhQ exposure led to the detection of low amounts of K1 and K2 metabolites, 4.6% and 0.02%, respectively. The K3 isoform was only detected when the larvae were supplemented with K3, with retention of only 4.2%, and bioconversion into K1 (93.5%), K2 (1.4%) and OH-PhQ (0.8%) isoforms (Fig. 3C). Moreover, the K2 and OH-PhQ supplementation generated the same isoforms, even though detected at different percentages. No vitamin K isoforms were detected in either of the two control samples (DMSO and n-Hex/EtOH).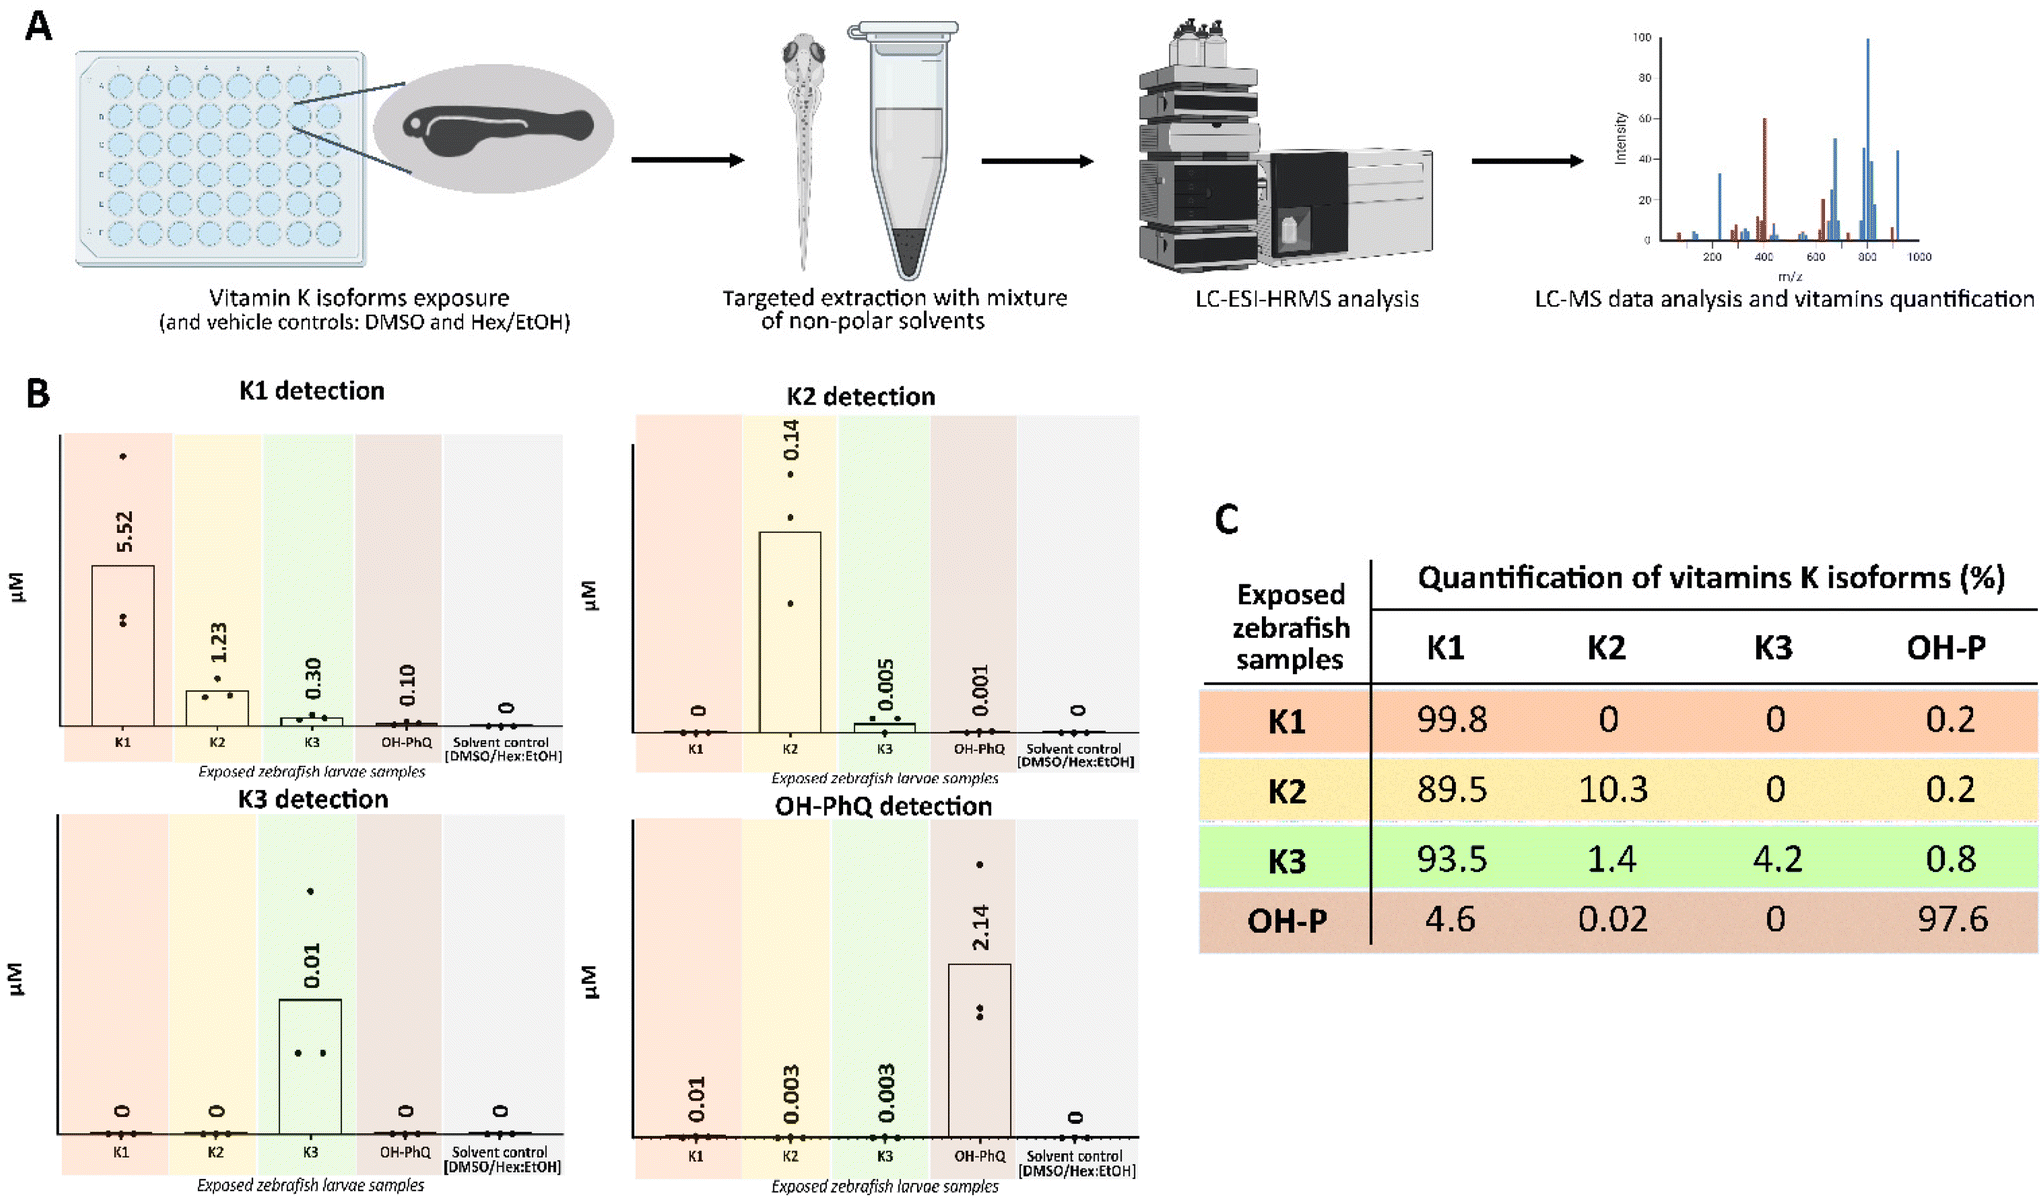 | ||
| Fig. 3 Quantification of vitamin K isoforms in exposed zebrafish larvae. (A) Representation of the experimental design starting with exposure of zebrafish larvae to vitamin K isoforms for 48 h (50 pooled larvae per replicate, 3 biological replicates per treatment), followed by targeted extraction of metabolites and metabolomics analyses. (B) Detection of vitamins K isoforms from the exposed zebrafish larvae and quantification in each treatment group (each dot represents the quantification in μM per replica, 50 pooled larvae). (C) Table of putative bioconversion of the 4 isoforms based on the detection in molarity. Data is expressed as percentage value relative to the supplementation of the corresponding vitamin K isoform. | ||
Untargeted metabolomic analysis
After exposure to different vitamin K isoforms, metabolites were extracted from zebrafish larvae using both targeted and general extraction procedures and were forwarded to LC-HRMS analyses. Here, metabolomics data from the general extraction are shown, while data from the targeted extraction can be found in ESI (App. C, Fig. S12 and S14 and Tables S8–S11†). Data were processed by MZmine, and a total of 2498 metabolites for each vitamin group and extraction procedure were considered for further analyses (App. C, Table S2, ESI†). Partial Least Square-Discriminant Analysis (PLS-DA) (Fig. 4A) demonstrated that the metabolome could be clearly distinguished between each vitamin K exposure group. Volcano plots for vitamin K exposure groups versus control (App. C, Fig. S14, ESI†) demonstrated 57, 54, 57 and 63 increased metabolites, while 7, 56, 24 and 19 decreased after OH-PhQ, K1, K2 and K3 exposure, respectively. Venn's diagrams of these data showed that few metabolites are shared between the exposure groups (Fig. 4A). Overall, supplementation with each vitamin K isoform altered a different set of metabolites. | ||
| Fig. 4 Untargeted metabolomics from zebrafish larvae exposed to vitamin K isoforms for 48 h (50 pooled larvae per replicate, 3 biological replicas per treatment, n = 3). (A) Data is presented as Partial Least Squares-Discriminant Analysis (PLS-DA) plot comparing the 4 treatment groups to control samples (DMSO and n-Hex/EtOH) and Venn's diagram with a statistical significance of 0.05 (ANOVA – T-test using Tukey's/Fisher's post hoc test). (B) Radar chart representation of the chemical taxonomy (class and subclass) of the top 20 metabolites (p-value ≤0.05 and >4-fold difference). Values are expressed as percentage value of the identified metabolites classes/subclasses in the 4 treatment groups. Labeled classes: glycerolipids (GL), glycerophospholipids (GP), sphingolipids (SG), steroids and derivatives (ST), carboxylic acids and derivatives (CA), dinucleotides (DN), fatty acyls (FA), prenol lipids (PL), organooxygen compounds (OC); labeled subclasses: monoacylglycerols (MG), diacylglycerols (DG), CDP-diacylglycerols (CDP-DG), triacylglycerol (TG), glycerophosphoglycerols (GPG), glycerophosphoinositols (GPI), glycerophosphoinositol phosphates (GPIP), glycerophosphoserines (GPS), glycerophosphoethanolamines (GPE), glycerophosphocholines (GPC), glycosphingolipids (GS), glycerophosphate (GP), lysoglycerophosphate (LGP), phosphosphingolipids (PS), phosphoglycerophosphate (PG), phosphatidylglycerol (PTG), fatty acids and conjugates (FA), fatty acid esters (FAE), fatty alcohol esters (FAAE), bile acids, alcohols and derivatives (BI), stigmastanes and derivatives (ST), oligopeptide (OP), peptide (P), dinucleotides (DN), vitamin D and derivatives (VD), monoterpenoids (MT), carbonyl compounds (CP), N-acylamides (NA). | ||
The top 20 metabolites for each vitamin K isoform (10 most increased and 10 most decreased with lowest p-value and greatest log2 fold change from volcano plots) were selected for manual dereplication, using several online databases resources (App. C, Tables S4–S11, ESI†). The major classes of identified compounds were glycerophospholipids, glycerolipids, sphingolipids, and steroids and derivatives (Fig. 4B). Supplementation with OH-PhQ, K1, K2 and K3 mainly altered the same class of compounds – glycerophospholipids. Sphingolipids were increased in the supplementation with OH-PhQ and K1, and additionally, fatty acyls compounds were increased with supplementation of the more bioactive vitamins (K2 and K3) (Fig. 4B). However, the identified metabolites of such classes were not the same between the treatment groups. This difference is already noticeable at the subclasses level. A prominent alteration of diacylglycerols was observed in OH-PhQ (increased), of sphingolipids in K1 (decreased), phosphoethanolamines, phosphoinositols and phosphoserines in K2 (decreased), and glycerophosphates in K3 (decreased). Only one shared subclass of compounds was observed between all supplementation groups, namely triacylglycerol's, being reduced in the vitamins K1, K2 and K3 groups. Additionally, shared subclasses were observed between vitamins with lipid reducing activities, in particular between K2 and K3 supplementation. Cytidine diphosphate diacylglycerol (CDP-DG) and the vitamin D derivative/carbonyl compound were increased, while phosphoglycerophosphates, glycerophosphate and glycerophosphocholines were reduced (Fig. 4B). Overall, on the level of metabolites, only two monoisotopic values are shared between supplementation groups in the top 20 list: 1208.7729 m/z in OH-PhQ and K3 treatments identified as cardiolipin, and 327.2681 m/z in K2 and K3 treatments identified as becocalcidiol or 1-phenyl-1,3-heptadecanedione (App. C, Tables S4, S6 and S7, ESI†).
Alterations of such metabolites could indicate the involvement of different metabolic pathways, leading to the observed lipid reducing activities. Consequently, a functional enrichment analysis was performed in the MetaboAnalyst platform (App. C, Fig. S15, ESI†). Both K1 and K3 supplementation triggered arachidonic acid metabolism and galactose metabolism. K1 and K2 triggered ubiquinone and other terpenoid-quinone biosynthesis. In contrast, the OH-PhQ supplementation shared no enriched pathways with any of the other vitamins K groups (App. C, Fig. S15, ESI†). Overall, these data confirm the previous results in the activation of different metabolic pathways networks in response to vitamin K family exposure. However, understanding the network interaction in detail will require further investigations in the future.
Discussion
To date, three types of vitamin K isoforms have been found in nature, identified in different photosynthetic organisms. OH-PhQ contains a hydrophilic phytyl side-chain, with the hydroxyl group at position C-5′, thus being a polar analogue of K1. In fact, this analogue was firstly isolated in 1965 from the cyanobacterium Synechococcus elongatus or Synechococcus sp. PCC 7942,19 but only recently efforts have been made to better understand its function and bioactivity.To the best of our knowledge, this is the first report of isolation of hydroxy-phylloquinone, specifically 5-hydroxy-phylloquinone, from the cyanobacterium Tychonema sp. LEGE 07196. The confirmation of this molecule assignment was done through spectroscopy (1D and 2D experiments) and spectrometry (fragmentation pattern) techniques and compared to literature data (App. B, Fig. S1 to S10, ESI†). The absolute conformation of the aliphatic side-chain was achieved and confirmed as 2′-3′-trans-(7′R,11′R),19 and studies in rats revealed the trans double bond configuration of vitamin K1 as key to display the required biological function.23 Based on the similarities, the 2′-3′-trans configuration of the herein isolated OH-PhQ can be assumed. Only more recently, the stereochemistry of this unique analogue was performed. Stereoisomeric mixtures and asymmetric synthesis were used to aid the stereochemical assignment of the hydroxy group at C-51′ position.24 The elucidation of the 5′S-OH conformation was successful, however the stereochemistry of the groups at positions C-7′ and C-11′ was assumed to be the same as from the natural K1 vitamin, meaning that the hydroxy group protons have an α orientation and the carbons R conformation. The ROESY correlations allowed the confirmation of the 5′S-OH designation, which revealed that the hydroxy group was on the same side of the molecule plane as the carbons at C-1′ and C-2′ positions and on the opposite position of C-71′ (App. B, Fig. S7, ESI†). However, the biochemical synthesis pathway in vivo in photosynthetic organisms is still not completely clear.24
In this work, the tested vitamin K isoforms displayed different potency on the reduction of the neutral lipid reservoirs in the zebrafish model, and this lipid reducing activity of the vitamin K1-analogue was reported for the first time. To the best of our knowledge, this is the first report assessing the potential of OH-PhQ on any bioactivity not related to photosynthetic functions. Among the naturally occurring vitamin K's, K2 showed the stronger activity with an EC50 value of 21.1 μM. In agreement to our data, the supplementation of 600 mg kg−1 of vitamin K1 and MK-4 (K2) in rats significantly reduced the total fat mass, by ca. 30% and 15%, respectively, and serum triglyceride levels by ca. 40% and 60%, respectively.25 In the Caenorhabditis elegans model, the vitamin K2 regulated fat metabolism genes; K2 enhanced fat degradation and digestion, and in particular fatty acid β-oxidation (fatty acid CoA synthetase family – acs-18, acyl-coenzyme A oxidase – acox-1.2, Δ9-fatty acid desaturase – fat-5, fatty acid elongase – elo-2, 3-hydroxyacyl–CoA dehydratase 1 – hacd-1, acyl CoA dehydrogenase – acdh-8).26 In concordance, data confirmed a lipid reducing activity of vitamin K2 across various organisms with huge evolutionary distance on the phylogenetic tree (C. elegans, D. rerio, R. norvegicus), pointing to a similar interspecies response to the exposure of this vitamin.
Vitamin K1 in this study did not show significant lipid reducing activity on zebrafish larvae, in contrast to Sogabe et al. in which a correlation existed in rats between a high dose of K1 supplementation and obesity markers.25 A further study on fattened male mice showed that a supplementation of 5 μg per kg−1 BW of K1 significantly reduced the gain in body weight, circulating lipid levels (triglyceride and cholesterol) and the accumulation of fat droplets in the liver.27 However, in several studies on humans with mean intakes ranging from 109 to 330 μg day−1, no correlation was found between K1 intake and lipid profiles.28,29 Observed disparities regarding K1 supplementation require further investigation to fully answer the eventual beneficial role of vitamin K1 in metabolic dysfunctions; interestingly the zebrafish model and human studies consistently did not demonstrate a lipid lowering effect.
Few studies did a comparative analysis of various vitamin K isoforms and hence, their differences on bioactivities are not well known. Bernardini et al. demonstrated the different effects of these vitamins on the energy metabolism of the porcine intestinal cells (IPEC-J2).30 Vitamin K3 inhibited the oxidative phosphorylation and glycolysis, while K1 increased ATP production via glycolysis, and K2 increased ATP production via oxidative phosphorylation. In accordance, our data demonstrated significant differences for all studied vitamin K isoforms on lipid lowering effects, while toxicity was detected for K3 at concentrations higher than 7.6 μM. Strong toxicity (hemolytic anemia) was reported for vitamin K3 in humans, which led to a ban for the usage as food supplement by the FDA in the USA.31 Recently, exposure to 15 μM of vitamin K3 in 3T3-L1 cells showed significant inhibition of adipocyte differentiation with lower intracellular lipid accumulation.32 Contrary to our observed toxicity in zebrafish larvae, vitamin K3 did not display cytotoxicity up to 25 μM in non-cancerous cells.33 The isolated K1-analogue, OH-PhQ, showed an improved activity (EC50 31.3 μM) comparing to its most structurally related compound, vitamin K1 (which was inactive up to 50 μM), but no further reports on its lipid lowering activity were found. The different bioactivity of vitamin K isoforms on lipid reduction revealed an important link to the structure–activity relationship (Fig. 2C): both the increased desaturation and the lack of side-chain demonstrated to be relevant for the observed bioactivity. For many years the intertwined metabolism has been known between quinones, such as vitamin K3 and glutathione. A biphasic response in total glutathione is described after quinone exposure: an initial drop related to the mediated conjugation with quinones as major elimination route, followed by an increase.34 A previous study with male rats reported that glutathione deficiency influenced lipogenesis and reduced hepatic triacylglycerols (TG).35 Glutathione also served as co-factor for glutathione peroxidase 1 (GPX1) with reported dual roles in glucose and lipid metabolism.36 Glutathione levels shift and related functions may explain the high potency here reported for vitamin K3. The reported differences between vitamin K isoforms may be important for medicinal chemistry in order to synthesize novel vitamin K analogues with increased efficiency and safety.
The bioavailability of natural vitamins K1 and K2 from food is influenced by the length and degree of saturation of the isoprene units of the side-chain, with longer-chain K2 being almost completely absorbed. Both follow a similar intestinal absorption pathway, where vitamin K1 is quickly removed from circulation and preferentially accumulated in the liver, in contrast to K2, which is delivered to extra-hepatic tissues. Only after the discovery of UBIAD1 enzyme function, the mechanisms of vitamin K recycling and K2 (MK-4) biosynthesis in the organism were clear.5 By oral route, K1 is converted to K2 (MK-4) via integral side-chain removal by the UBIAD1 enzyme as follows: K3 precedes K2 in the intestine follow by prenylation in the target tissues.20 Later studies confirmed K2 (MK-4) accumulation on tissues, however, suggested that K1 was absorbed and entered the blood circulation in its original form, and only small traces of K1 are converted to K3 and K2 in the intestine.15 Our study in zebrafish larvae demonstrated that K1 was not transformed into K2, while K2 supplementation led to a strong conversion to K1. Additionally, our study indicated that K3 has a high conversion rate and was majorly converted into K1 (Fig. 3B and C). In contrast, no vitamin K isoforms were detected in zebrafish larvae at 5 DPF from the solvent control group (larvae exposed to vehicle DMSO or n-Hex/EtOH). A previous study reported a natural abundance of 3.64 μM K1 and 3.37 μM K2 in pools of zebrafish embryos at 72 hours post-fertilization (HPF).37 However, 72 HPF zebrafish embryos still retain the yolk sac that contains many nutrients to support the growth and development of the embryo, while the yolk sac of 5 DPF larvae is almost completely depleted, which may explain the observed differences. An early report stated that UBIAD1/ubiad1 mutations in zebrafish caused cardiac oedema and cranial hemorrhages.38 UBIAD1 deficient mice died during embryonic development, but the embryonic lifespan could be partially extended with vitamin K2 (MK-4) administration to the pregnant mice.39 Thus, it could be speculated that different level of vitamin K isoforms are due to the different phylogenetic models (mice and zebrafish), and phases of development (72 HPF and 5 DPF) used in the studies.
The mechanisms of action of vitamin K isoforms for glucose and fat metabolism are under research, but it is hypothesized that they are modulated by an intricate network starting with the activation of osteocalcin, lectin and adiponectin (reviewed in ref. 40). Our metabolomics analyses demonstrated that exposure to each vitamin K isoform significantly altered different sets of metabolites. A survey of human studies identified metabolomic signatures related to obesity phenotypes, including the metabolomic signatures of weight loss.41 Overall, comparing obese to lean subjects revealed that the main altered metabolites belonged to steroids, amino acids (AA) and proteins, acylcarnitine (AC), lipids (long-chain PUFA, MUFA, phospholipids, sphingolipids), carbohydrates, nucleosides and bile acids classes. Comparing to our results, the metabolomic signatures from zebrafish larvae are quite resembling, with major alterations of complex lipids as glycerophospholipids, sphingolipids, glycerolipids, and other modified FA, and steroids and derivatives. High-fat diet mice had decreased levels of serum non-esterified fatty acids after K2 exposure,42 in parallel with a reduction of TG serum levels, while in vitro studies determined an increase of TG and a marked elevation in diacylglycerol 20:4.43 In agreement, the TG levels of zebrafish in this work were altered, demonstrating an increase in the bioactive K3 group, a reduction in the non-active K1 group, and both an increase and reduction for different TG species in the bioactive K2 group. A correlation between plasma levels of more complex lipids, as lysophosphatidylcholine, sphingomyelins and phosphatidylcholines was suggested with obesity, although the pathways are not yet completely understood.44 Sphingolipids are essential lipids for cellular dynamics and signaling, and plenty evidence exist of the highly connected metabolism with glycerophospholipids.45 In fact, sphingolipids are described to regulate lipid homeostasis, including GP biosynthesis, via SREBP1 activation (involved in hepatic and adipocyte lipid synthesis regulation). In accordance, a marked alteration of GP was observed in our study after vitamin K2 and K3 supplementation (with lipid reducing activities). Some health benefits were reported for marine food enriched with GP, since these complex lipids suppressed plasma and hepatic triacylglycerol and cholesterol levels mediated by SREBP1/PPARα action.46 The effect of an extract of gut microbiota on reducing obesity in high-fat-diet mice was related to the alterations in GP metabolism, with a marked reduction in GPC.47 Significant alterations in several GP species, such as reduction of lyso-GPC, lyso-GPE and GPS and increased GPC, lyso-GPE and GP were also found. To be noted that K2 supplementation led to an evident GPC reduction in this work, along with other GP species. Alterations of these complex lipids may suggest different functions for the regulation of the lipid metabolism, which need to be further studied in the future.
Conclusions
In our study, the different vitamin K isoforms were compared for the first time in vivo, assessing the effects on neutral lipid level and the metabolome, as well as on the possible bioconversion of these vitamins. Striking differences were observed for their lipid lowering properties, their bioconversion pattern and alterations on metabolite profiles, in particular on the subclass or individual levels. However, further research is necessary to fully elucidate the differences of vitamin K isoforms on their biological effects. Asserting this final piece of the puzzle would lay the ground to develop a future nutraceutical or food supplement with lipid reduction activity.Author contributions
N. G. S., Data curation, formal analysis, investigation, visualization, writing – original draft. M. P.: Investigation, validation, writing – review & editing. V. V., Funding acquisition, resources, writing – review & editing. R. U., Conceptualization, funding acquisition, methodology, project administration, validation, resources, supervision, writing – review & editing.Conflicts of interest
There are no conflicts to declare.Acknowledgements
We acknowledge national funding from FCT (Foundation for Science and Technology, Portugal) (Portugal, ERA-MBT/0001/2015) within the framework of the European ERA-NET Marine Biotechnology project “CYANOBESITY - Cyanobacteria as a source of bioactive compounds with effects on obesity and obesity-related co-morbidities”. The research was additionally supported by the FCT strategic fund UIDB/04423/2020 and UIDP/04423/2020, and by the project ATLANTIDA (ref. NORTE-01-0145-FEDER-000040), supported by the Norte Portugal Regional Operational Program (NORTE 2020), under the PORTUGAL 2020 Partnership Agreement and through the European Regional Development Fund (ERDF). Natália Silva was additionally supported by FCT PhD grant 2020.08437.BD. We also thank Antonio Vicente and Rui Rodrigues (University of Minho) for the help with acquisition of the ECD spectrum.References
- M. Castro, M. Preto, V. Vasconcelos and R. Urbatzka, Obesity: The metabolic disease, advances on drug discovery and natural product research, Curr. Top. Med. Chem., 2016, 16, 2577–2604 CrossRef CAS PubMed.
- W. H. Organization, NonCommunicable Diseases, https://www.who.int/news-room/fact-sheets/detail/noncommunicable-diseases, (accessed September, 2022).
- H. Dam and F. Schønheyder, The occurrence and chemical nature of vitamin K, Biochem. J., 1936, 30, 897 CrossRef CAS PubMed.
- A. Melse-Boonstra, Bioavailability of micronutrients from nutrient-dense whole foods: zooming in on dairy, vegetables, and fruits, Front. Nutr., 2020, 7, 101 CrossRef PubMed.
- K. Nakagawa, Y. Hirota, N. Sawada, N. Yuge, M. Watanabe, Y. Uchino, N. Okuda, Y. Shimomura, Y. Suhara and T. Okano, Identification of UBIAD1 as a novel human menaquinone-4 biosynthetic enzyme, Nature, 2010, 468, 117–121 CrossRef CAS PubMed.
- J. L. Ellis, X. Fu, J. P. Karl, C. J. Hernandez, J. B. Mason, R. A. DeBose-Boyd and S. L. Booth, Multiple dietary vitamin K forms are converted to tissue menaquinone-4 in mice, J. Nutr., 2022, 152, 981–993 CrossRef PubMed.
- M. J. Shearer and P. Newman, Recent trends in the metabolism and cell biology of vitamin K with special reference to vitamin K cycling and MK-4 biosynthesis, J. Lipid Res., 2014, 55, 345–362 CrossRef CAS PubMed.
- K. Bus and A. Szterk, Relationship between structure and biological activity of various vitamin K forms, Foods, 2021, 10, 3136 CrossRef CAS PubMed.
- R. Urbatzka, S. Freitas, A. Palmeira, T. Almeida, J. Moreira, C. Azevedo, C. Afonso, M. Correia-da-Silva, E. Sousa and M. Pinto, Lipid reducing activity and toxicity profiles of a library of polyphenol derivatives, Eur. J. Med. Chem., 2018, 151, 272–284 CrossRef CAS PubMed.
- J. Noinart, S. Buttachon, T. Dethoup, L. Gales, J. A. Pereira, R. Urbatzka, S. Freitas, M. Lee, A. M. Silva and M. M. Pinto, A new ergosterol analog, a new bis-anthraquinone and anti-obesity activity of anthraquinones from the marine sponge-associated fungus Talaromyces stipitatus KUFA 0207, Mar. Drugs, 2017, 15, 139 CrossRef PubMed.
- M. Costa, L. Coello, R. Urbatzka, M. Pérez and M. Thorsteinsdottir, New aromatic bisabolane derivatives with lipid-reducing activity from the marine sponge Myrmekioderma sp, Mar. Drugs, 2019, 17, 375 CrossRef CAS PubMed.
- S. Freitas, N. G. Silva, M. L. Sousa, T. Ribeiro, F. Rosa, P. N. Leão, V. Vasconcelos, M. A. Reis and R. Urbatzka, Chlorophyll derivatives from marine cyanobacteria with lipid-reducing activities, Mar. Drugs, 2019, 17, 229 CrossRef CAS PubMed.
- K. S. Jones, A. P. Alimov, H. L. Rilo, R. J. Jandacek, L. A. Woollett and W. T. Penberthy, A high throughput live transparent animal bioassay to identify non-toxic small molecules or genes that regulate vertebrate fat metabolism for obesity drug development, Nutr. Metab., 2008, 5, 1–11 CrossRef PubMed.
- Y.-C. Lin, C. Huang, H.-C. Huang, M.-T. Liao and Y.-H. Lai, Metabolomics profiling of haloperidol and validation of thromboxane-related signaling in the early development of zebrafish, Biochem. Biophys. Res. Commun., 2019, 513, 608–615 CrossRef CAS PubMed.
- Y. Hirota, N. Tsugawa, K. Nakagawa, Y. Suhara, K. Tanaka, Y. Uchino, A. Takeuchi, N. Sawada, M. Kamao and A. Wada, Menadione (vitamin K3) is a catabolic product of oral phylloquinone (vitamin K1) in the intestine and a circulating precursor of tissue menaquinone-4 (vitamin K2) in rats, J. Biol. Chem., 2013, 288, 33071–33080 CrossRef CAS PubMed.
- A. T. Aron, E. C. Gentry, K. L. McPhail, L.-F. Nothias, M. Nothias-Esposito, A. Bouslimani, D. Petras, J. M. Gauglitz, N. Sikora and F. Vargas, Reproducible molecular networking of untargeted mass spectrometry data using GNPS, Nat. Protoc., 2020, 15, 1954–1991 CrossRef CAS PubMed.
- D. S. Wishart, A. Guo, E. Oler, F. Wang, A. Anjum, H. Peters, R. Dizon, Z. Sayeeda, S. Tian and B. L. Lee, HMDB 5.0: the human metabolome database for 2022, Nucleic Acids Res., 2022, 50, D622–D631 CrossRef CAS PubMed.
- K. Dührkop, M. Fleischauer, M. Ludwig, A. A. Aksenov, A. V. Melnik, M. Meusel, P. C. Dorrestein, J. Rousu and S. Böcker, SIRIUS 4: a rapid tool for turning tandem mass spectra into metabolite structure information, Nat. Methods, 2019, 16, 299–302 CrossRef PubMed.
- L. Jackman, R. Rüegg, G. Ryser, C. von Planta, U. Gloor, H. Mayer, P. Schudel, M. Kofler and O. Isler, On the chemistry of vitamin K. 2. Total synthesis and stereochemistry of trans-and cis-(7′R, 11′R)-phylloquinone and related compounds, Helv. Chim. Acta, 1965, 48, 1332–1349 CrossRef CAS PubMed.
- T. Okano, Y. Shimomura, M. Yamane, Y. Suhara, M. Kamao, M. Sugiura and K. Nakagawa, Conversion of phylloquinone (Vitamin K1) into menaquinone-4 (Vitamin K2) in mice: two possible routes for menaquinone-4 accumulation in cerebra of mice, J. Biol. Chem., 2008, 283, 11270–11279 CrossRef CAS PubMed.
- M. Vecchi, M. Schmid, W. Walther and F. Gerber, Determination of the diastereomers of Vitamin K1, J. High Resolut. Chromatogr., 1981, 4, 257–259 CrossRef CAS.
- R. E. Kopec, R. M. Schweiggert, K. M. Riedl, R. Carle and S. J. Schwartz, Comparison of high–performance liquid chromatography/tandem mass spectrometry and high–performance liquid chromatography/photo–diode array detection for the quantitation of carotenoids, retinyl esters, α–tocopherol and phylloquinone in chylomicron–rich fractions of human plasma, Rapid Commun. Mass Spectrom., 2013, 27, 1393–1402 CrossRef CAS PubMed.
- T. E. Knauer, C. Siegfried, A. K. Willingham and J. T. Matschiner, Metabolism and biological activity of cis-and trans-phylloquinone in the rat, J. Nutr., 1975, 105, 1519–1524 CrossRef CAS PubMed.
- M. Kosugi, C. Lee, T. Misaki, Y. Kashino, M. Fujita and T. Sugimura, Stereochemical assignment of the unique electron acceptor 5′-hydroxyphylloquinone, a polar analog of vitamin K1 in photosystem I, Biosci., Biotechnol., Biochem., 2017, 81, 2244–2252 CrossRef CAS PubMed.
- N. Sogabe, R. Maruyama, O. Baba, T. Hosoi and M. Goseki-Sone, Effects of long-term vitamin K1 (phylloquinone) or vitamin K2 (menaquinone-4) supplementation on body composition and serum parameters in rats, Bone, 2011, 48, 1036–1042 CrossRef CAS PubMed.
- Z. Qu, L. Zhang, W. Huang and S. Zheng, Vitamin K2 Enhances Fat Degradation to Improve the Survival of C. elegans, Front. Nutr., 2022, 9, 858481 CrossRef PubMed.
- J. Bordoloi, D. Ozah, T. Bora, J. Kalita and P. Manna, Gamma-glutamyl carboxylated Gas6 mediates the beneficial effect of vitamin K on lowering hyperlipidemia via regulating the AMPK/SREBP1/PPARα signaling cascade of lipid metabolism, J. Nutr. Biochem., 2019, 70, 174–184 CrossRef CAS PubMed.
- V. Dam, G. W. Dalmeijer, C. Vermeer, N. E. Drummen, M. H. Knapen, Y. T. Van Der Schouw and J. W. Beulens, Association between vitamin K and the metabolic syndrome: a 10-year follow-up study in adults, J. Clin. Endocrinol. Metab., 2015, 100, 2472–2479 CrossRef CAS PubMed.
- E. A. D. Santos, K. V. Giudici, N. A. de França, B. S. E. Peters, R. M. Fisberg and L. A. Martini, Correlations among vitamin K intake, body fat, lipid profile and glucose homeostasis in adults and the elderly, Arch. Endocrinol. Metab., 2020, 64, 436–444 Search PubMed.
- C. Bernardini, C. Algieri, D. La Mantia, F. Trombetti, A. Pagliarani, M. Forni and S. Nesci, Vitamin K vitamers differently affect energy metabolism in IPEC-J2 Cells, Front. Mol. Biosci., 2021, 8, 682191 CrossRef CAS PubMed.
- M. Vetrella and W. Barthelmai, Studies on drug-induced hemolysis: effects of menadione and its water soluble preparations on the glutathione peroxidase of human erythrocytes, Klin. Wochenschr., 1972, 50, 234–238 CrossRef CAS PubMed.
- M. I. Funk, M. A. Conde, G. Piwien-Pilipuk and R. M. Uranga, Novel antiadipogenic effect of menadione in 3T3-L1 cells, Chem.-Biol. Interact., 2021, 343, 109491 CrossRef CAS PubMed.
- C. Kishore, S. Sundaram and D. Karunagaran, Vitamin K3 (menadione) suppresses epithelial-mesenchymal-transition and Wnt signaling pathway in human colorectal cancer cells, Chem.-Biol. Interact., 2019, 309, 108725 CrossRef CAS PubMed.
- N. Watanabe, D. A. Dickinson, R.-M. Liu and H. J. Forman, Quinones and glutathione metabolism, Methods Enzymol., 2004, 378, 319–340 CAS.
- C. Brandsch, T. Schmidt, D. Behn, K. Weiße, A. S. Mueller and G. I. Stangl, Glutathione deficiency down-regulates hepatic lipogenesis in rats, Lipids Health Dis., 2010, 9, 1–8 CrossRef PubMed.
- J.-Q. Huang, J.-C. Zhou, Y.-Y. Wu, F.-Z. Ren and X. G. Lei, Role of glutathione peroxidase 1 in glucose and lipid metabolism-related diseases, Free Radicals Biol. Med., 2018, 127, 108–115 CrossRef CAS PubMed.
- C. Martano, V. Mugoni, F. Dal Bello, M. M. Santoro and C. Medana, Rapid high performance liquid chromatography–high resolution mass spectrometry methodology for multiple prenol lipids analysis in zebrafish embryos, J. Chromatogr., A, 2015, 1412, 59–66 CrossRef CAS PubMed.
- J. M. Hegarty, H. Yang and N. C. Chi, UBIAD1-mediated vitamin K2 synthesis is required for vascular endothelial cell survival and development, Development, 2013, 140, 1713–1719 CrossRef CAS PubMed.
- K. Nakagawa, N. Sawada, Y. Hirota, Y. Uchino, Y. Suhara, T. Hasegawa, N. Amizuka, T. Okamoto, N. Tsugawa and M. Kamao, Vitamin K2 biosynthetic enzyme, UBIAD1 is essential for embryonic development of mice, PLoS One, 2014, 9, e104078 CrossRef PubMed.
- Y. Li, J. Peng Chen, L. Duan and S. Li, Effect of vitamin K2 on type 2 diabetes mellitus: A review, Diabetes Res. Clin. Pract., 2018, 136, 39–51 CrossRef CAS PubMed.
- O. D. Rangel-Huerta, B. Pastor-Villaescusa and A. Gil, Are we close to defining a metabolomic signature of human obesity? A systematic review of metabolomics studies, Metabolomics, 2019, 15, 1–31 CrossRef PubMed.
- X. Su, J. Zhou, W. Wang, C. Yin and F. Wang, VK2 regulates slow-twitch muscle fibers expression and mitochondrial function via SIRT1/SIRT3 signaling, Nutrition, 2022, 93, 111412 CrossRef CAS PubMed.
- A. Kołakowski, P. F. Kurzyna, W. Bzdęga, H. Żywno, E. Harasim-Symbor, A. Chabowski and K. Konstantynowicz-Nowicka, Influence of vitamin K2 on lipid precursors of inflammation and fatty acids pathway activities in HepG2 cells, Eur. J. Cell Biol., 2021, 100, 151188 CrossRef.
- S. Rauschert, O. Uhl, B. Koletzko, F. Kirchberg, T. A. Mori, R.-C. Huang, L. J. Beilin, C. Hellmuth and W. H. Oddy, Lipidomics reveals associations of phospholipids with obesity and insulin resistance in young adults, J. Clin. Endocrinol. Metab., 2016, 101, 871–879 CrossRef CAS PubMed.
- S. Rodriguez-Cuenca, V. Pellegrinelli, M. Campbell, M. Oresic and A. Vidal-Puig, Sphingolipids and glycerophospholipids–the “ying and yang” of lipotoxicity in metabolic diseases, Prog. Lipid Res., 2017, 66, 14–29 CrossRef CAS PubMed.
- X. Liu, Y. Xue, C. Liu, Q. Lou, J. Wang, T. Yanagita, C. Xue and Y. Wang, Eicosapentaenoic acid-enriched phospholipid ameliorates insulin resistance and lipid metabolism in diet-induced-obese mice, Lipids Health Dis., 2013, 12, 1–10 CrossRef PubMed.
- H. Cai, D. Li, L. Song, X. Xu, Y. Han, K. Meng, Z. Wen and P. Yang, Metabolomic Characteristics of Liver and Cecum Contents in High-Fat-Diet-Induced Obese Mice Intervened with Lactobacillus plantarum FRT10, Foods, 2022, 11, 2491 CrossRef CAS PubMed.
Footnote |
| † Electronic supplementary information (ESI) available. See DOI: https://doi.org/10.1039/d3fo02915h |
| This journal is © The Royal Society of Chemistry 2024 |