 Open Access Article
 This Open Access Article is licensed under a
 Creative Commons Attribution 3.0 Unported Licence
Evaluation of performance metrics for high energy density rechargeable lithium–oxygen batteries†
Shoichi
Matsuda
 *ab,
Eiki
Yasukawa
ab,
Shin
Kimura
ab,
Shoji
Yamaguchi
ab and
Kohei
Uosaki
ab
*ab,
Eiki
Yasukawa
ab,
Shin
Kimura
ab,
Shoji
Yamaguchi
ab and
Kohei
Uosaki
ab
aCenter for Green Research on Energy and Environmental Materials, National Institute for Material Science, 1-1 Namiki, Tsukuba, Ibaraki 305-0044, Japan. E-mail: matsuda.shoichi@nims.go.jp
bNIMS-SoftBank Advanced Technologies Development Center, National Institute for Materials Science, 1-1 Namiki, Tsukuba, Ibaraki 305-0044, Japan
First published on 14th August 2023
Abstract
The demand for practical implementation of rechargeable lithium–oxygen batteries (LOBs) has grown owing to their extremely high theoretical energy density. However, the factors determining the performance of cell-level high energy density LOBs remain unclear. In this study, LOBs with a stacked-cell configuration were fabricated and their performance evaluated under different experimental conditions to clarify the unique degradation phenomenon under lean-electrolyte and high areal capacity conditions. First, the effect of the electrolyte amount against areal capacity ratio (E/C) on the battery performance was evaluated, revealing a complicated voltage profile for an LOB cell operated under high areal capacity conditions. Second, the impact of different kinds of gas-diffusion layer materials on the “sudden death” phenomenon during the charging process was investigated. The results obtained in the present study reveal the importance of these factors when evaluating the performance metrics of LOBs, including cycle life, and round-trip energy efficiency. We believe that adopting a suitable experimental setup with appropriate technological parameters is crucial for accurately interpreting the complicated phenomenon in LOBs with cell-level high energy density.
Introduction
Lithium–oxygen batteries (LOBs) are potential candidates for the next-generation of rechargeable batteries because of their extremely high theoretical energy density.1,2 In LOBs, the oxygen reduction reaction proceeds at the positive oxygen electrode during the discharge process, thereby resulting in the formation of Li2O2, which accumulates in the pores of the carbon electrode. During charging, the electrochemical decomposition of Li2O2 proceeds and generates oxygen. On the negative electrode side, the reversible lithium dissolution/deposition process should proceed in association with the progress of the discharge/charge process. Thus, the electrochemical reaction characterising LOBs can be written as follows:| O2 + 2Li+ + 2e− = Li2O2 (positive electrode) |
| Li = Li+ + e− (negative electrode) |
Based on the weight of active materials (oxygen and lithium), a theoretical LOB energy density is over 3500 W h kg−1. However, in practice, the weights of additional components, such as carbon electrodes, electrolytes, gas-diffusion layers, and current collectors, should be considered for the calculation of the energy density of LOB cells.
Recent studies on the design of practical LOB cells revealed the importance of the ratio of electrolyte amount against areal capacity (E/C, g A−1 h−1) for determining the performance of LOBs.3–5 The E/C value has been used as an empirical parameter representing the electrolyte amount when studying lithium-ion battery (LIB) compounds. However, a recent study on lithium-metal-based rechargeable batteries demonstrated that E/C is a crucial parameter for performance evaluation in practical cell design conditions (i.e., lean electrolyte conditions).6,7 Additionally, the importance of E/C has also been reported in the field of LOBs.3–5 Notably, it was reported that E/C is a parameter that can be used as an indicator of energy density for practical LOB cell design.3 In particular, to obtain LOBs with an energy density above 300 W h kg−1, the value of E/C should be maintained below 10 g A−1 h−1. Although the relationship between E/C and LOB energy density has been investigated, the effects of E/C values on other battery performance indicators, such as cycle life, round-trip energy efficiency, etc., are unknown.
In addition to the E/C-based cell design strategy, understanding the effects of cell configurations on the performance of LOBs is also crucial for practical implementation of cell-level high energy density LOBs. In particular, an appropriate cell configuration should be adopted that ensures an effective oxygen flow across the entire porous carbon-based positive electrode through the gas-diffusion layer. For example, in coin and Swagelok cells, oxygen is transported from the entire gas-diffusion layer in the vertical direction to the porous carbon-based positive electrode. In contrast, in practical stacked cells, oxygen can only be transported through the gas-diffusion layer in the horizontal direction. In addition, according to cell-level energy density calculations, the gas-diffusion layer accounts for more than 10% of the total weight of an LOB cell,8 which corresponds to the weight of the porous carbon electrode. Thus, the reduction of the weight of gas-diffusion layer materials without sacrificing the oxygen transport property is required. Actually, a recent study demonstrated the use of a gas-diffusible current collector that combines the functions of oxygen mass transport and electron transfer.9 The application of such a novel concept for the practical design of LOBs may benefit from a detailed analysis of the cell performance at low E/C values.
Based on these research backgrounds, in the present study, the relationship between E/C and LOB cell performance was experimentally investigated. For this purpose, a series of identical LOB cells were fabricated, and their performances were evaluated under different conditions (i.e., different limiting capacities and different thickness of the carbon electrode). The obtained results were compared and the effects of E/C on the cycle performance of LOBs were discussed. Subsequently, the performance of an LOB cell equipped with different kinds of gas-diffusion layer materials was evaluated at low E/C values (E/C < 5 g A−1 h−1). As a result, we observed a unique “sudden-death” phenomenon during the charging process and its mechanism was discussed.
Experimental
Preparation of a carbon-powder-based self-standing carbon membrane
A slurry mixture was prepared using 65 wt% of Ketjenblack (KB) (Lion Specialty Chemicals, EC600J), 12 wt% of carbon fiber (average fiber diameter of 6 μm and average length of 3 mm), 23 wt% PAN, and NMP as a solvent for uniform dispersion. The slurry mixture was formed into a sheet by moulding to a uniform thickness by a wet film-forming method using a doctor blade. After moulding, the sample was immersed in methanol and converted to a porous film by a non-solvent-induced phase separation method. Furthermore, the volatile solvent was removed by drying the sample at 80 °C for 10 h; subsequently, heat treatment was performed at 230 °C for 3 h in air using a box-type furnace (Denken High Dental).Battery assembly and testing
A tetraethylene glycol dimethyl ether (TEGDME) solution containing 0.5 M lithium bis(trifluoromethanesulfonyl)imide (LiTFSI; Kishida Chemical, purity >99.9%), 0.5 M LiNO3 (Sigma-Aldrich, purity >99.9%), and 0.2 M LiBr (Sigma-Aldrich, purity >99.9%) was used as the electrolyte. LiNO3 and LiBr were dried at 120 °C under vacuum before use. A self-standing KB-based carbon membrane was used as the positive electrode. The carbon electrode was dried at 100 °C under vacuum for 12 h. A carbon fiber membrane (200 μm thickness, TGP-H060, Toray) or a polytetrafluoroethylene (PTFE) fiber membrane (100 μm thickness, POREFLON™ PTFE membrane, WP-500-100) were utilized as the gas diffusion layer. Ni-coated polyethylene terephthalate (PET) fiber mesh (SEIREN) or SUS fiber mesh were utilized as the gas-diffusible current collector and SUS fiber mesh as the current collector. LOB cells were assembled in a dry room (<10 ppm water) by sequential stacking of a Li foil (20 mm square, 100 μm thickness, Honjo Metal), polyolefin-based separator (22 mm square, 20 μm thickness), porous carbon electrode (20 mm square), gas-diffusion layer, and current collector. For electrolyte injection into the porous carbon electrode, the stamping method was adopted using a PTFE membrane (Advantec Toyo Co., Ltd, diameter = 90 mm, diameter = 1 μm) as the hydrophilic filter. The porous carbon electrode was sandwiched between two hydrophilic filters impregnated with a suitable electrolyte amount (via drop-casting), and the electrode was kept under vacuum for more than 3 min. For the fabrication of an LOB cell with protection of the lithium metal electrode, a ceramic-based, solid-state separator (90 μm thickness, LICGC, Ohara) was used. The ceramic-based solid-state separator was sandwiched between polyolefin layers, and the same electrolyte was used on the positive and negative sides of the cell. A pressure of 100 kPa was applied to the cell by a spring coil. Electrochemical experiments were conducted with TOSCAT (Toyo Systems) battery-test equipment.Results & discussion
Evaluation of the effects of E/C on the performance of LOBs
We investigate the effect of E/C on the performance of LOBs by following two types of experiments: (i) changing the capacity limiting condition using an LOB cell with a fixed amount of electrolyte, or (ii) changing the amount of electrolyte in the LOB cell by controlling the thickness of the carbon electrode and evaluating the fixed capacity limiting condition. In our experiments herein, stacked-type LOB cells were utilized.10 A KB-based self-standing membrane4 with a mass loading of 5.4 mg and a 100 μm-thick lithium foil were adopted as the positive and negative electrodes, respectively. A solution of 0.5 M LiTFSI, 0.5 M LiNO3, and 0.2 M LiBr dissolved in TEGDME was the electrolyte.11,12 The details of the components and cell configuration are presented in Table S1 and Fig. S1.† The amount of electrolyte in the electrode was controlled at 22 mg cm−2 using the stamping method.10Fig. 1a shows the voltage profile of the LOB cell at a current density and areal capacity of 0.05 mA cm−2 and 0.5 mA h cm−2, respectively. During the discharge process, the cell exhibited stable voltage plateaux at 2.75 V. During charging, the cell initially exhibited a voltage of 3.5 V. The voltage gradually increased with charging progress and finally reached 3.8 V. As the cycle progressed, a gradual increase in the overpotential during both discharge and charge was observed. Even at the 100th cycle, the cell exhibited a stable voltage profile (red curve in Fig. 1a). The purple curve in Fig. 1a shows the voltage profile at the 180th cycle, revealing a large voltage hysteresis above 1.5 V. At the 189th cycle, the discharge voltage reached the cut-off value (pink curve in Fig. 1a).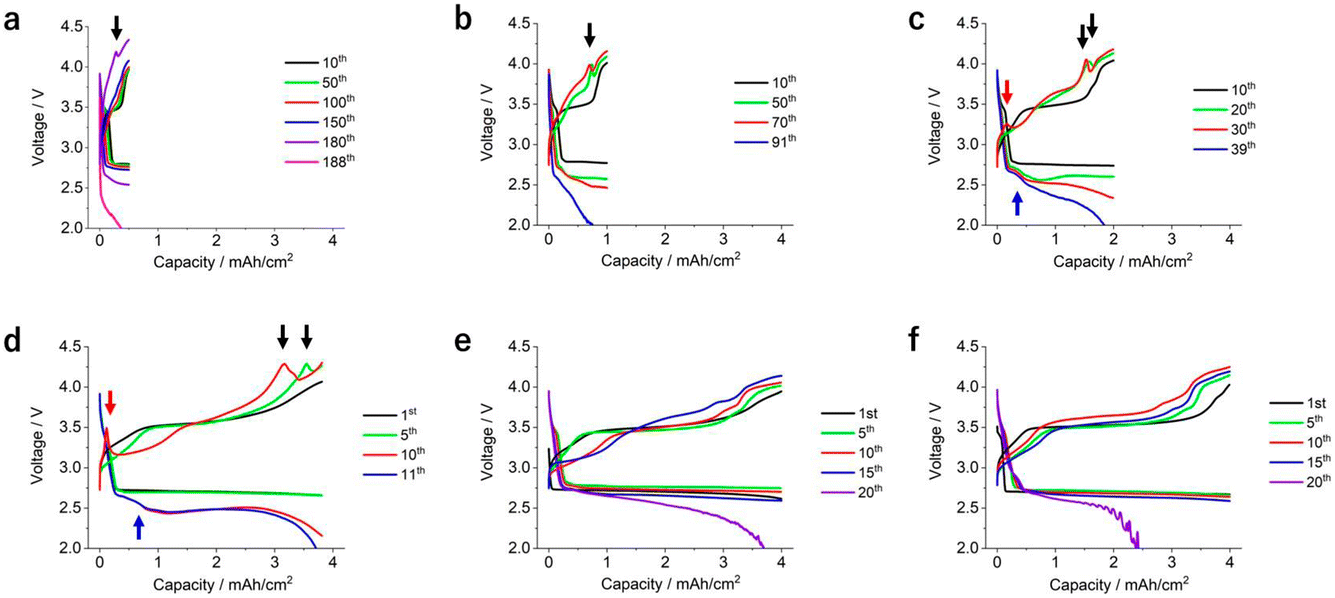 | ||
| Fig. 1 Discharge/charge profile of LOB cells with different capacity limitation and current density conditions. (a) 0.05 mA cm−2, 0.5 mA h cm−2, (b) 0.1 mA cm−2, 1 mA h cm−2, (c) 0.2 mA cm−2, 2 mA h cm−2, (d and f) 0.4 mA h cm−2, 4 mA h cm−2 and (e) 0.1 mA cm−2, 4 mA h cm−2. (f) 0.4 mA h cm−2, 4 mA h cm−2 and a ceramic-based solid-state separator sandwiched between two pieces of a PO-based separator were adopted as the protective layer for the lithium metal electrode. | ||
Similar discharge/charge cycle tests on the LOB cells were performed by varying the current density and areal capacity conditions while the C-rate was fixed at 0.1 C (i.e., the duration of the discharge and charge processes was 10 h each). The resulting discharge/charge profiles at current density values of 0.1, 0.2, and 0.4 mA cm−2 and areal capacities of 1, 2, and 4 mA h cm−2 are shown in Fig. 1b–d. The LOB cell operated at an areal capacity of 1 mA h cm−2 exhibited a discharge voltage of 2.75 V at the 10th cycle (black curve in Fig. 1b). As the number of cycles increased, the discharge voltage decreased. At the 70th discharge process, the voltage reached 2.48 V (red curve in Fig. 1b). During the charging process, an increase of overpotential with increasing number of cycles can be seen. Even in the cell operated at an areal capacity of 1 mA h cm−2, a similar degradation phenomenon was observed (Fig. 1c). At the 39th cycle, the discharge voltage reached a cut-off condition (blue curve in Fig. 1c). In contrast, in the case of the cell operated at 4 mA h cm−2, the overpotential quickly increased in both the discharge and charge processes (Fig. 1d). As a result, the cell stopped at only the 11th cycle (blue curve in Fig. 1d).
In Fig. 2a, the values of the round-trip energy efficiency of the LOB cells operating under different conditions were plotted. In the case of the cell operated at 0.5 mA h cm−2, the round-trip energy efficiency was over 85% (black data points in Fig. 2a) at the 10th cycle. As the number of cycles increased, the round-trip energy efficiency gradually decreased and showed a sharp drop at around the 170th cycle, falling below 70%. By increasing the current density and areal capacity, the round-trip energy efficiency largely decreased (Fig. 2a), revealing that E/C significantly affects the performance of LOBs, not only for cycle life, but also round-trip energy efficiency. In Fig. 2b and c, the value of the average voltage during the discharge/charge process was plotted against cycle life. As the profile of the average discharge voltage resembles the profile of the round-trip energy efficiency, the discharge reaction is considered as the main factor in determining the round-trip energy efficiency. Notably, in Fig. 2b, it can be seen that the LOB cell operated at 0.5 mA h cm−2 exhibited an average discharge voltage that was higher than the theoretical reaction voltage of LOBs, 2.96 V, at the beginning of the cycle.
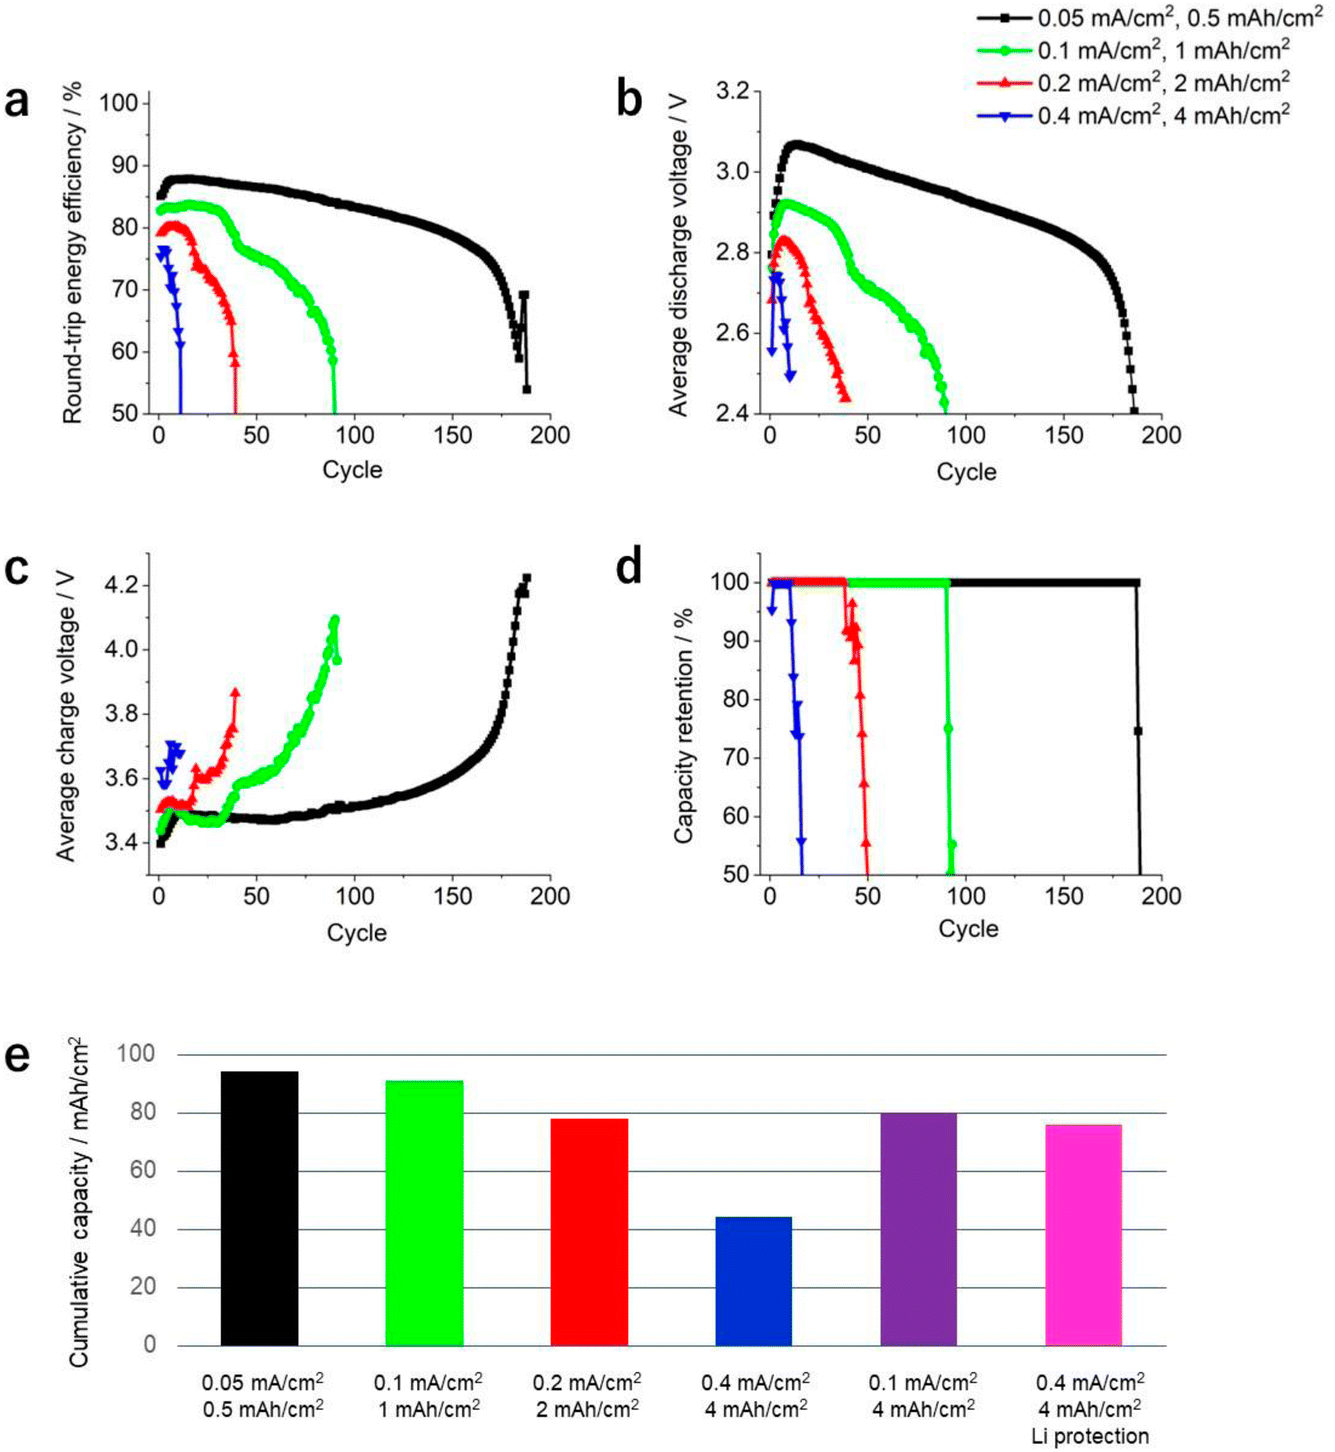 | ||
| Fig. 2 (a) Round-trip energy efficiency, (b and c) average discharge/charge voltage, and (d) capacity retention of LOB cells with different capacity limitation and current density conditions were plotted against cycle number. Black data points: 0.05 mA cm−2, 0.5 mA h cm−2. Green data points: 0.1 mA cm−2, 1 mA h cm−2. Red data points: 0.2 mA cm−2, 2 mA h cm−2. Blue data points: 0.4 mA cm−2, 4 mA h cm−2. (e) Cumulative capacity of LOB cells under different capacity limitation and current density conditions. | ||
The magnified voltage profile of the LOB cell operated at 0.5 mA h cm−2 is shown in Fig. S2a.† It can be seen that there is a high-voltage region of around 3.7–3.0 V at the beginning of the discharge process. It is considered that the oxidized form of the redox meditator generated during the charge process remains without reacting during the decomposition reaction of Li2O2 and is reduced during the discharging process, resulting in a high-potential discharge phenomenon. It should be noted that such an abnormal discharge process at potentials >2.96 V was also reported for the LOBs containing RM (redox mediator).11,13–17 The capacity during this high-potential discharge process can be assigned to re-reduction of the oxidized form of RM. At the 10th cycle, the capacity during this high-potential discharge process is approximately 0.2 mA h cm−2, which corresponds with 40% of the limited capacity of 0.5 mA h cm−2. In this sense, it can be said that 40% of the current in this LOB cell is operated by the redox reaction of 3Br−/Br3− and/or NO2−/NO2−. With an increasing number of cycles, a gradual decrease of this capacity was observed and it reached 0.1 mA h cm−2 at the 150th cycle (blue curve in Fig. S2a†). We considered that the decomposition of RM during cycling results in a decreased amount of RM in the electrolyte,12 inducing the decrease of capacity during the high-potential discharge process. The magnified voltage profile of the LOB cells operated at 1 or 2 mA h cm−2 are also shown in Fig. S2b and c.† In both cases, the capacity during the high-potential discharge process is 0.2 mA h cm−2 and gradually decreases with increasing cycle number.
In Fig. 2d, the capacity retention of each LOB cell is plotted against the cycle number. Evidently, the number of cycles decreased significantly as current density and capacity increased. The cell operated at a current density and areal capacity of 0.05 mA cm−2 and 0.5 mA h cm−2, respectively, achieved stable discharge/charge reactions for more than 180 cycles. However, the cycle number of the cell operating at a current density and areal capacity of 0.4 mA cm−2 and 4 mA h cm−2, respectively, reached only 11 cycles.
We also summarize the obtained series of results from the viewpoint of cumulative capacity (Fig. 2e). In the cells operated at current densities of 0.05 and 0.1 mA cm−2, and areal capacities of 0.5 and 1 mA h cm−2, the cumulative capacities were 94 and 90 mA cm−2, respectively. By increasing the current density and areal capacity, the cumulative capacity significantly decreased. The cell operated at a current density of 0.4 mA cm−2 and areal capacity of 4 mA h cm−2 exhibited an extremely low cumulative capacity of 44 mA h cm−2. This low value originated either from the high current density and/or from the high areal capacity.
To distinguish the effects of these two factors on the cumulative capacity, the performance of an LOB cell operated at a current density and areal capacity of 0.1 mA cm−2 and 4 mA h cm−2, respectively, was evaluated. In this case, the cumulative capacity increased up to 80 mA h cm−2, thus confirming that the contribution of the current density to the cumulative capacity is the most relevant. Fig. 1e showed the voltage profile of the cell operated at a current density and areal capacity of 0.1 mA cm−2 and 4 mA h cm−2, respectively. By comparison with Fig. 1e, the following three points were confirmed in Fig. 1d: (i) The voltage decreased during the initial stage of the discharge process (blue arrow), (ii) a peak was present during the initial stage of the charging process (red arrow), and (iii) a peak was present during the final stage of the charging process (black arrows). Recently, our study using a three-electrode experimental setup revealed that these features originate from the change of reaction profile of the negative lithium electrode, not from the positive oxygen electrode.5 In addition, it was also demonstrated that chemical crossover from the positive to negative electrode results in such a complicated reaction profile at the negative lithium electrode.5 Actually, such a unique feature in the voltage profile of the discharge/charge cycle was also observed in the LOB cell operated at 2 mA h cm−2 (blue, red and black arrows in Fig. 1c). In addition, the peak present during the final stage of the charging process was also detected in the LOB cell operated at 2 mA cm−2 during the latter part of the cycle life (black arrows in Fig. 1a and b). These results suggest that the deterioration of the negative lithium electrode is the main factor for determining the cycle life of the LOB investigated in the present study.
To further investigate the effects of the chemical crossover between the electrodes on battery performance, an LOB cell with a protected lithium metal electrode was fabricated. The protective layer was a ceramic-based solid-state separator sandwiched between two pieces of a PO-based separator. Fig. 1f shows the discharge/charge profile of the LOB cell with the protected lithium metal electrode, revealing a stable discharge/charge process up to the 10th cycle without visible cell degradation. During the 19th cycle, the discharge voltage suddenly decreased, reaching the cut-off voltage. The cumulative capacity significantly improved, reaching 76 mA h cm−2 (Fig. 2e), thus confirming the beneficial effect of lithium electrode protection on the performance of LOB cells. Notably, three unique features originating from chemical crossover are not observed in the voltage profile of the LOB cell with a protected lithium metal electrode (Fig. 1f). By introducing a protective layer for the lithium metal electrode and suppressing chemical crossover, the LOB cell operated at a current density and areal capacity of 0.4 mA cm−2 and 4 mA h cm−2, respectively, exhibited a performance equivalent to the cell operated at 0.1 mA cm−2 and 4 mA h cm−2.
In the LOB cells used in the above experiments, the amount of electrolyte was controlled at 22 mg cm−2. Thus, in the case of the LOB cell operated at 4.0 mA h cm−2, the value of E/C = 5.5 g A−1 h−1. Under such low E/C conditions, the LOB can be expected to have a cell-level energy density of over 300 W h kg−1.3 Under such conditions, the degradation of the negative lithium metal electrode has a large impact on the voltage profile and cycle life. The result of the present study reveals that lowering the current density or introducing a protective layer for the lithium metal electrodes are effective at improving the performance of LOBs.
Next, we turn our attention to the investigation of a second type of experiment: (ii) changing the amount of electrolyte in the LOB cell by controlling the thickness of the carbon electrode and evaluating the fixed capacity limiting condition. For this experiment, four types of KB-based self-standing membranes with the same porosity but with different thicknesses (450 μm, 380 μm, 280 μm, and 220 μm) were utilized as positive electrodes. Here, the electrolyte injection ratio into the carbon electrodes was adjusted to be approximately 80% for all the LOB cells by using the stamping method.10 As a result, the amounts of electrolyte used in the LOB cells were 32 mg cm−2, 27 mg cm−2, 20 mg cm−2, and 17 mg cm−2.
Fig. 3a–d show the voltage profile of the LOB cells with different electrolyte amounts. For all cells, the ceramic-based solid-state separator sandwiched by two pieces of a PO-based separator were introduced in order to minimize the degradation of the lithium metal electrodes. In this experiment, the current density during the discharge and charge processes was set to be 0.4 and 0.2 mA cm−2, respectively, and the areal capacity was set to be 4 mA h cm−2. It should be noted that increasing the thickness of the positive electrode under the same capacity limiting condition corresponds with decreasing the depth of discharge. Here, the values of E/C for the LOB cells were 8.0 A h g−1, 6.75 A h g−1, 5.0 A h g−1, and 4.25 A h g−1. With increasing number of cycles, a gradual increase of overpotential in both the discharge and charge processes can be seen. After a certain number of cycles, the discharge voltage reached the cut-off condition and the cells stopped. In Fig. 3e, the number of cycles is plotted against the electrolyte amount in the LOB cells, revealing the clear correlation between the two factors. These results clearly indicate that E/C has a large impact on cycle life. Also, the relationship between the cycle number of each LOB cell and the mass loading of the positive electrodes are summarized in Fig. 3f, revealing the high correlation between these two factors. This is a reasonable result because there is a linear correlation between the mass loading of the positive electrode, the thickness of positive electrode, and the electrolyte amount (Fig. S3†). Notably, the linear correlation between cycle life and thickness of the positive electrode suggests that all parts of the positive electrode are fully utilized for the discharge/charge reaction.
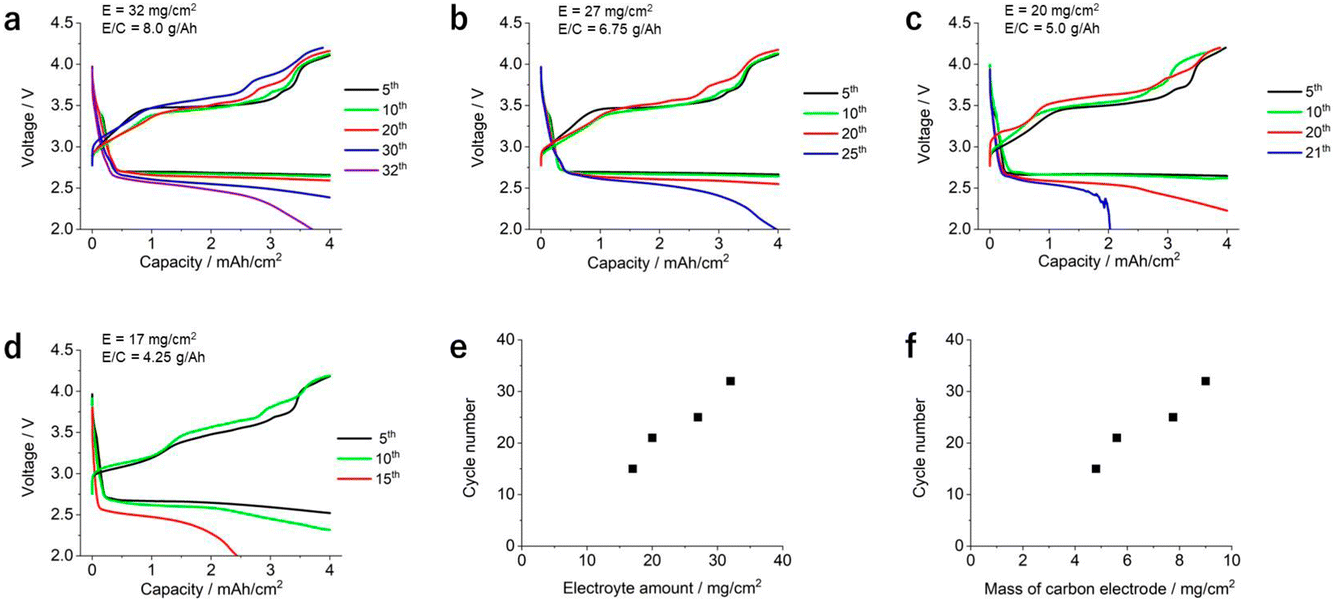 | ||
| Fig. 3 Discharge/charge profile of LOB cells with different electrolyte amounts using the carbon electrodes with different thicknesses. (a) Electrolyte amount of 32 mg cm−2, carbon electrode thickness of 450 μm, (b) electrolyte amount of 27 mg cm−2, carbon electrode thickness of 380 μm, (c) electrolyte amount of 20 mg cm−2, carbon electrode thickness of 280 μm, and (d) electrolyte amount of 17 mg cm−2, carbon electrode thickness of 220 μm. (e) Relationship between the electrolyte amount and cycle number of the LOB cells. (f) Relationship between the mass of the carbon electrode and cycle number of the LOB cells. | ||
So, what are the physicochemical factors that determine the cycle life of LOB cells? In this experimental system, it is confirmed that the stable cycle of the lithium metal symmetric cell progresses for more than 40 cycles. Therefore, it is considered that the main factor of cell deterioration caused by overvoltage rise is the positive electrode reaction, not the negative electrode reaction. The following factors are considered as possible origins of cell failure: electrolyte depletion, clogging of pores due to the accumulation of solid by-products on the carbon electrode, and deterioration of the carbon electrode itself.18–28
Evaluation of the effects of different gas-diffusion layers on the performance of LOBs
Next, we focused our attention on the investigation of the effects of different gas-diffusion layers on the performance of LOB cells under low E/C conditions. For this, three types of LOB cell were fabricated: cell A presented a carbon fiber membrane as the gas-diffusion layer and SUS-fiber mesh as the current collector; cell B was built using an Ni-coated polyethylene terephthalate (PET) fiber mesh as a gas-diffusible current collector; and cell C had the same gas-diffusible current collector as that of cell B and a polytetrafluoroethylene (PTFE) membrane as the gas-diffusion layer. The physical properties of the above cell components are listed in Table S2.† It should be noted that oxygen transport through the gas-diffusion layer was only allowed in the horizontal direction, not the vertical direction, in the stacked-cell configuration. In these experiments, a KB-based self-standing membrane with a mass loading of 3.2 mg cm−2 was utilized as the positive electrode. The amount of electrolyte in the electrode was controlled at 14 mg cm−2 (electrolyte injection ratio of 70%) using the stamping method.10 By operating these cells at an areal capacity of 4 mA h cm−2, the E/C value of the LOB cells was 3.5 g A−1 h−1. For suppressing the undesired chemical crossover reaction, a ceramic-based solid-state separator sandwiched by two pieces of a PO-based separator was adopted as the protective layer for the lithium metal electrode.Fig. 4a shows the discharge/charge profile of cell A, which presents the typical voltage profile of an LOB cell with a stable voltage plateau at 2.6 V during the discharge process. During the charging process, the cell voltage gradually increased from 3.2 to 4.2 V. As the cycle progressed, the overpotential gradually increased during both the discharge and charge processes. At the 12th cycle, the charging voltage sharply increased, reaching the cut-off voltage of 4.5 V. A similar phenomenon was reported in previous studies on LOB cells at low E/C values.10 As shown by the discharge/charge profile in Fig. 4b, the voltage profile of cell B is similar to that of cell A up to the 10th cycle. After the 12th cycle, cell B still exhibits a stable discharge/charge profile, in contrast to that of cell A, although a gradual increase in the voltage was observed at the beginning of the charging process during the 13th and 14th cycles. During the 15th cycle, the charging voltage increased sharply, reaching the cut-off voltage.
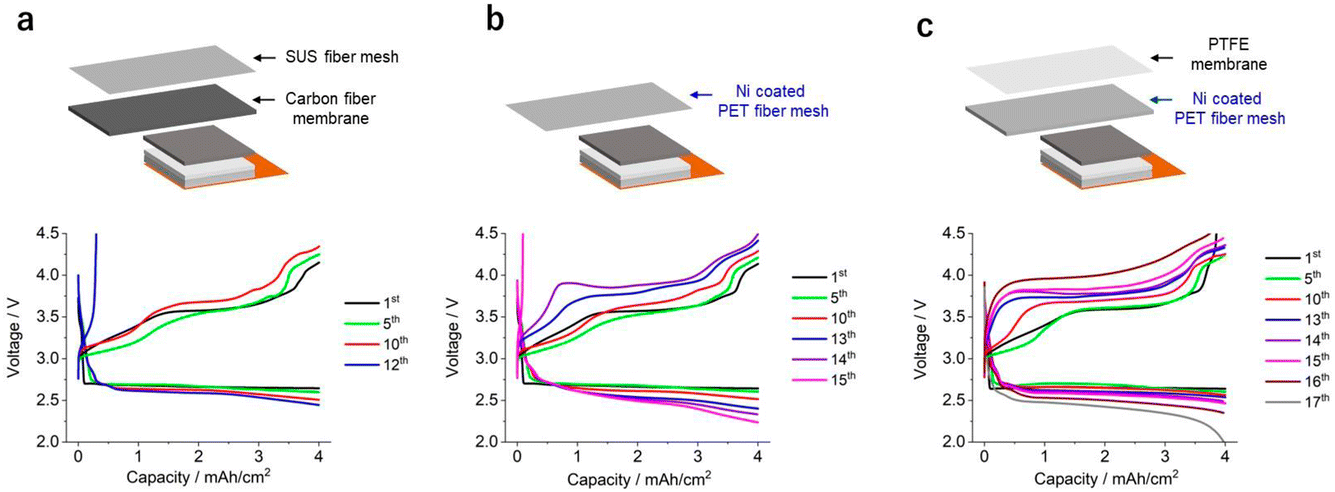 | ||
| Fig. 4 Schematic illustration and discharge/charge profile of the LOB cells. (a) LOB cell equipped with a carbon fiber membrane as the gas-diffusion layer and an SUS fiber mesh as the current collector. (b) LOB cell equipped with a Ni-coated PET fiber mesh as the gas-diffusible current collector. (c) LOB cell equipped with a Ni-coated PET fiber mesh as the gas-diffusible current collector and a PTFE fiber membrane as the gas-diffusion layer. | ||
One possible explanation for the physicochemical origin of this sharp increase in charging voltage is the electrolyte shortage mechanism.10 In Fig. 5, the quantitative information relating to the electrolyte movement phenomenon is summarized. As for the carbon fiber membrane-based gas-diffusion layer, its thickness and porosity are 190 μm and 90%, respectively. Thus, its pore volume is 15.6 μL cm−2 (Fig. 5a). When the LOB cell is fabricated with an electrolyte injection ratio of 100%, the part of the electrolyte in the carbon electrode can move to the carbon fiber membrane-based gas-diffusion layer due to the hydrophilic nature of the carbon fiber membrane (Fig. 6a). In addition, during the discharge process, the electrolyte in the carbon electrode is pushed out owing to the formation and accumulation of Li2O2. When the pushed-out electrolyte is absorbed in the gas-diffusion layer, it does not return to the carbon electrode; thus, the amount of electrolyte in the carbon electrode decreases (Fig. 5b). In the case of an areal capacity of 4 mA h cm−2, 1.5 μL cm−2 of the electrolyte, which corresponds to the volume of the generated Li2O2, is pushed out from the carbon electrode. In addition to the electrolyte-absorbing property of the gas-diffusion layer itself, the electrolyte that is gradually pushed out from the carbon electrode moves toward the gas-diffusion layer due to the driving force caused by Li2O2 formation. In principle, the movement of the electrolyte continues until there is an equal amount of electrolyte in the void spaces of the carbon electrode and the gas-diffusion layer. As the cycling progresses, the amount of electrolyte in the carbon electrode gradually drops until it is insufficient to ensure the transport of Li ions, which supports the electrochemical decomposition reaction of Li2O2. At this point, the overpotential increases sharply.
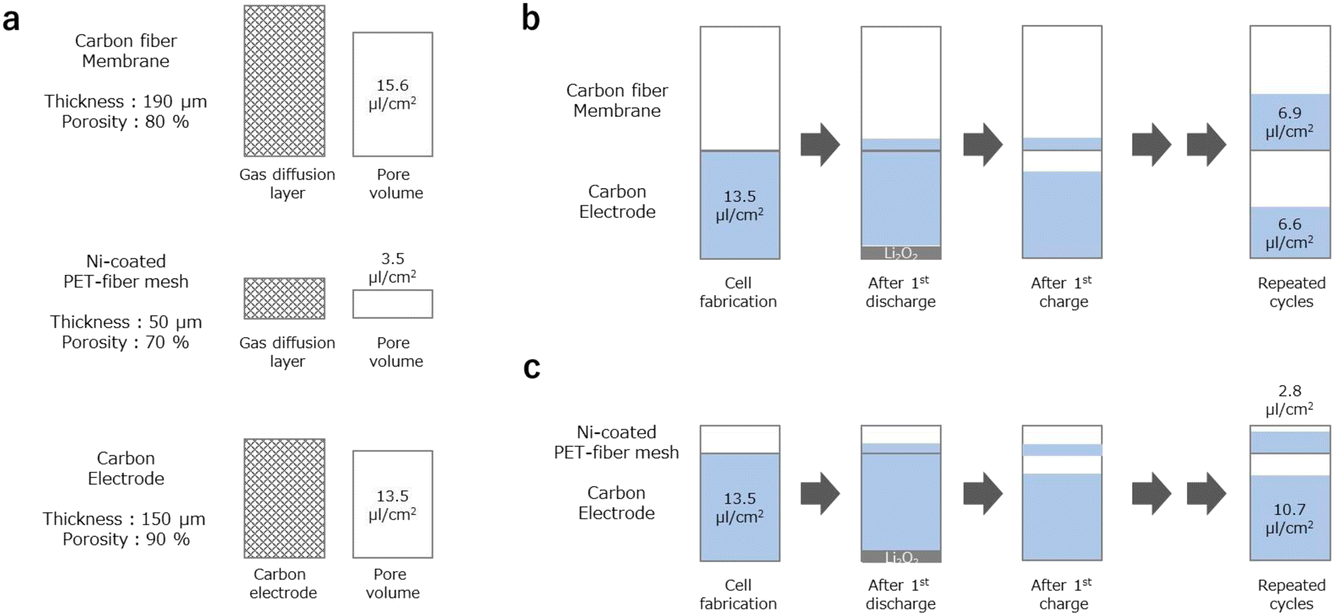 | ||
| Fig. 5 Schematic illustration for quantitative information related to the electrolyte movement phenomenon. (a) Pore volume of the carbon electrode and gas-diffusion layer materials. (b) Estimation of electrolyte amount in cell A. (c) Estimation of electrolyte amount in cell B. | ||
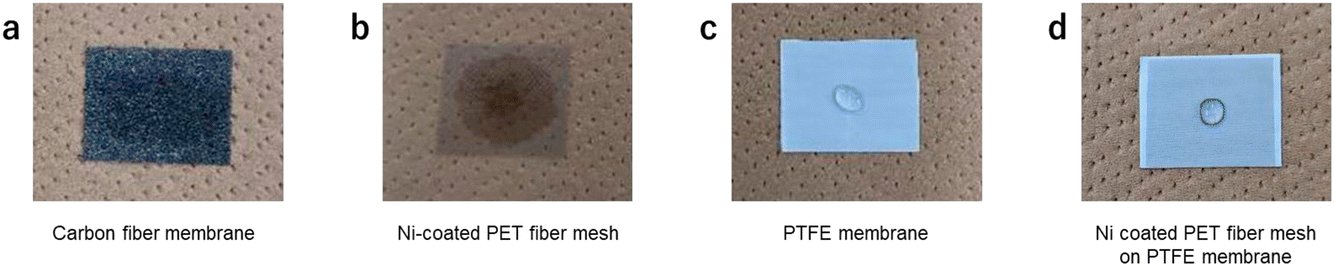 | ||
| Fig. 6 Photographic images of the electrolyte droplets on a series of gas-diffusion layers. (a) Carbon fiber membrane, (b) Ni-coated PET fiber mesh, (c) PTFE membrane and (d) Ni-coated PET fiber mesh placed on a PTFE membrane. | ||
Based on these considerations, we experimentally investigated the electrolyte movement phenomenon. By disassembling the LOB cell at the selected condition, the amount of electrolyte in the gas-diffusion layer was evaluated by simply measuring its weight change. For this experiment, the electrolyte injection ratio was set as 100%. In the case of the LOB just after cell assembly, the weight of the gas-diffusion layer did not largely change, suggesting that most of the electrolyte remains in the carbon electrode. In sharp contrast, an increase of 0.43 mg cm−2 for the gas-diffusion layer after the 1st discharge process can be seen (Fig. S4†). The result suggests that part of the electrolyte was moved to the gas-diffusion layer from the carbon electrode. After the 1st charging process, the weight of the gas-diffusion layer decreased to the initial level, suggesting that the electrolyte in the gas-diffusion layer moved back to the carbon electrode. We also tried to perform similar experiments for cycled LOB cells. However, for the cell after repeated discharge/charge cycling, the gas-diffusion layer became strongly attached to the carbon electrode, making it difficult to separate them. Thus, further details of the electrolyte movement phenomenon should be investigated by use of operando techniques.29
In our experiment, the carbon fiber-based gas-diffusion layer used in cell A contained a larger amount of void space compared with that in the Ni-coated PET fiber mesh-based gas-diffusible current collector used in cell B, mainly because of the difference in the thickness of these two layers. As for the Ni-coated PET fiber mesh-based gas-diffusible current collector, its thickness and porosity are 50 μm and 70%, respectively. Thus, its pore volume is 3.5 μL cm−2. In this case, even for the condition where equal amounts of electrolyte exist in the void spaces of the carbon electrode and the gas-diffusion layer, most of the electrolyte remains in the carbon electrode (Fig. 5c).
To further test the validity of the idea that the increase of voltage during the initial charging process originates from the electrolyte movement phenomenon, a PTFE membrane, which is hydrophobic against the electrolyte, was added to an LOB cell and its effects on the cell performance were evaluated. In Fig. 6, photographic images of electrolyte droplets on a series of gas-diffusion layers are shown. Here we added 20 μL of electrolyte to each 2 cm2-sized gas-diffusion layer. In the case of the carbon fiber membrane and the Ni-coated PET fiber mesh, the electrolyte quickly spread across the whole of the membrane. In sharp contrast, in the case of the PTFE membrane and the Ni-coated PET fiber mesh placed on PTFE membrane, the electrolyte remained as a droplet in the center of the membrane. These results clearly revealed the repelling effect of the PTFE membrane against the TEGDME-based electrolyte. Fig. 4c shows the voltage profiles of the discharge/charge cycles of cell C, which is characterised by a Ni-coated PET fiber mesh-based gas-diffusible current collector and a PTFE membrane. Up to the 10th cycle, the cell exhibited essentially the same voltage profile as that of cell B, which contained only the Ni-coated PET fiber mesh-based gas-diffusible current collector. Between the 12th and 14th cycles, the charging voltage increased; however, the increase was not as sharp as that in the voltage profile of cell B. Cell C exhibited a stable discharge/charge process until the 16th cycle, although the overpotential continued to increase. During the 17th cycle, the discharge voltage gradually decreased, reaching the cut-off condition. These results clearly confirm that the introduction of the PTFE membrane suppressed the sudden increase in the charging voltage, which was observed in cells A and B. This supports the proposed hypothesis that the voltage increase is caused by the electrolyte depletion phenomenon. The obtained series of results in the present study suggest the importance of considering the hydrophobic properties of the gas-diffusion layer materials against the electrolyte as an essential factor for realizing LOBs with a high energy density and long cycle life.
Conclusions
In summary, in the present study, we investigated the following issues by fabricating stacked configurations of LOB cells. First, we investigated the effect of E/C on the performance of the LOBs by (i) changing the capacity limiting condition using an LOB cell with a fixed amount of electrolyte or (ii) changing the amount of electrolyte in the LOB cell by controlling the thickness of the carbon electrode and evaluating the fixed capacity limiting condition. As a result, we revealed the large impact of E/C on the performance of LOBs, including cycle life and round-trip energy efficiency. We also extended our research interest to the effect of cell configuration on the performance of the LOBs. In particular, the impact of a gas-diffusion layer on the “sudden death” phenomenon during the charging process was experimentally demonstrated. The results obtained in the present study revealed that LOB studies should be performed under appropriate technological parameters to accurately interpret the complicated phenomena in LOBs with cell-level high energy density. We believe the knowledge obtained in the present study contributes toward accelerating materials development for realizing cell-level high energy density LOBs with long cycle life.Conflicts of interest
There are no conflicts to declare.Author contributions
S. M. and K. U. conceived the project. S. M., E. Y., S. K. and S. Y. designed the experiments. E. Y. and S. K. performed the experiments. S. M., E. Y., S. K. and S. Y. analysed the results. S. M. wrote the paper with the help of all the authors. S. M. produced all the figures.Acknowledgements
This work was supported by SoftBank Corp. This work also received support from the National Institute for Materials Science (NIMS) Battery Research Platform.References
- W.-J. Kwak, Rosy, D. Sharon, C. Xia, H. Kim, L. R. Johnson, P. G. Bruce, L. F. Nazar, Y.-K. Sun, A. A. Frimer, M. Noked, S. A. Freunberger and D. Aurbach, Chem. Rev., 2020, 120, 6626–6683 CrossRef CAS.
- T. Liu, J. P. Vivek, E. W. Zhao, J. Lei, N. Garcia-Araez and C. P. Grey, Chem. Rev., 2020, 120, 6558–6625 CrossRef CAS.
- S. Matsuda, A. M. Ono, S. Yamaguchi ab and K. Uosaki ab, Mater. Horiz., 2022, 9, 856 RSC.
- S. Matsuda, E. Yasukawa, T. Kameda, S. Kimura, S. Yamaguchi, Y. Kubo and K. Uosaki, Cell Rep. Phys. Sci., 2021, 2, 100506 CrossRef CAS.
- S. Matsuda, M. Ono, H. Asahina, S. Kimura, E. Mizuki, E. Yasukawa, S. Yamaguchi, Y. Kubo and K. Uosaki, Adv. Energy Mater., 2023, 13, 2203062 CrossRef CAS.
- J. Liu, Z. Bao, Y. Cui, E. J. Dufek, J. B. Goodenough, P. Khalifah, Q. Li, B. Y. Liaw, P. Liu, A. Manthiram, Y. S. Meng, V. R. Subramanian, M. F. Toney, V. V Viswanathan, M. S. Whittingham, J. Xiao, W. Xu, J. Yang, X.-Q. Yang and J.-G. Zhang, Nat. Energy, 2019, 4, 180–186 CrossRef CAS.
- X. Ren, L. Zou, X. Cao, M. H. Engelhard, W. Liu, S. D. Burton, H. Lee, C. Niu, B. E. Matthews, Z. Zhu, C. Wang, B. W. Arey, J. Xiao, J. Liu, J.-G. Zhang and W. Xu, Joule, 2019, 3, 1662–1676 CrossRef CAS.
- M. Ue, K. Sakaushi and K. Uosaki, Mater. Horiz., 2020, 7, 1937–1954 RSC.
- S. Miyakawa, M. Goto, M. Ono, T. Saito, S. Yamaguchi and S. Matsuda, ACS Appl. Energy Mater., 2023, 6, 1906–1912 CrossRef CAS.
- S. Matsuda, S. Yamaguchi, E. Yasukawa, H. Asahina, H. Kakuta, H. Otani, S. Kimura, T. Kameda, Y. Takayanagi, A. Tajika, Y. Kubo and K. Uosaki, ACS Appl. Energy Mater., 2021, 4(3), 2563–2569 CrossRef CAS.
- X. Xin, K. Ito and Y. Kubo, ACS Appl. Mater. Interfaces, 2017, 9, 25976–25984 CrossRef CAS.
- M. Ono and S. Matsuda, J. Phys. Chem. C, 2023, 127(13), 6117–6124 CrossRef CAS.
- S. Wu, Y. Qiao, H. Deng, Y. He and H. Zhou, J. Phys. Chem. Lett., 2018, 9, 6761–6766 CrossRef CAS.
- X. Gao, Y. Chen, L. R. Johnson, Z. P. Jovanov and P. G. Bruce, Nat. Energy, 2017, 2, 17118 CrossRef CAS.
- B. J. Bergner, M. R. Busche, R. Pinedo, B. B. Berkes, D. Schröder and J. Janek, ACS Appl. Mater. Interfaces, 2016, 8, 7756–7765 CrossRef CAS PubMed.
- S. H. Lee, J.-B. Park, H.-S. Lim and Y.-K. Sun, Adv. Energy Mater., 2017, 7, 1602417 CrossRef.
- W.-J. Kwak, D. Hirshberg, D. Sharon, M. Afri, A. A. Frimer, H.-G. Jung, D. Aurbach and Y.-K. Sun, Energy Environ. Sci., 2016, 9, 2334–2345 RSC.
- J. W. Jung, S. H. Cho, J. S. Nam and I. D. Kim, Energy Storage Mater., 2020, 24, 512–528 CrossRef.
- H. Kim, H. G. Jung, D. Aurbach and Y. K. Sun, J. Electrochem. Soc., 2018, 165, A2274–A2293 CrossRef.
- J. B. Park, S. H. Lee, H. G. Jung, D. Aurbach and Y. K. Sun, Adv. Mater., 2018, 30, 1704162 CrossRef.
- S. Yang, P. He and H. Zhou, Energy Environ. Sci., 2016, 9, 1650–1654 RSC.
- B. D. McCloskey, A. Speidel, R. Scheffler, D. C. Miller, V. Viswanathan, J. S. Hummelshøj, J. K. Nørskov and A. C. Luntz, J. Phys. Chem. Lett., 2012, 3, 997–1001 CrossRef CAS PubMed.
- Z. Zhao, J. Huang and Z. Peng, Angew. Chem., Int. Ed., 2018, 57, 3874–3886 CrossRef CAS.
- S. Zhang, M. J. Nava, G. K. Chow, N. Lopez, G. Wu, D. R. Britt, D. G. Nocera and C. C. Cummins, Chem. Sci., 2017, 8, 6117–6122 RSC.
- B. M. Gallant, R. R. Mitchell, D. G. Kwabi, J. Zhou, L. Zuin, C. V. Thompson and Y. Shao-Horn, J. Phys. Chem. C, 2012, 116, 20800–20805 CrossRef CAS.
- M. M. Ottakam Thotiyl, S. A. Freunberger, Z. Peng and P. G. Bruce, J. Am. Chem. Soc., 2013, 135, 494–500 CrossRef CAS.
- N. B. Aetukuri, B. D. McCloskey, J. M. García, L. E. Krupp, V. Viswanathan and A. C. Luntz, Nat. Chem., 2015, 7, 50–56 CrossRef CAS.
- M. Ono, J. Saengkaew and S. Matsuda, Adv. Sci., 2023, 10, 2300896 CrossRef CAS PubMed.
- S. Matsuda, S. Kimura and K. Uosaki, J. Phys. Chem. C, 2023, 127, 11822–11828 CrossRef CAS.
Footnote |
| † Electronic supplementary information (ESI) available. See DOI: https://doi.org/10.1039/d3fd00082f |
| This journal is © The Royal Society of Chemistry 2024 |