
 Open Access Article
 This Open Access Article is licensed under a
 Creative Commons Attribution 3.0 Unported Licence
Tunable product selectivity on demand: a mechanism-guided Lewis acid co-catalyst for CO2 electroreduction to ethylene glycol†
Yifei
Li
 a,
Karin U. D.
Calvinho
ab,
Mahak
Dhiman
a,
Anders B.
Laursen
ab,
Hengfei
Gu
a,
Dominick
Santorelli
a,
Zachary
Clifford
a and
G. Charles
Dismukes
*ac
a,
Karin U. D.
Calvinho
ab,
Mahak
Dhiman
a,
Anders B.
Laursen
ab,
Hengfei
Gu
a,
Dominick
Santorelli
a,
Zachary
Clifford
a and
G. Charles
Dismukes
*ac
aDepartment of Chemistry and Chemical Biology, 123 Bevier Rd, Piscataway, NJ 08854, USA. E-mail: dismukes@chem.rutgers.edu
bRenewCO2 Inc., 418 Orchard Street, Cranford, NJ 07016-1745, USA
cWaksman Institute of Technology, 190 Frelinghuysen Rd, Piscataway, NJ, USA
First published on 26th January 2024
Abstract
Bioinspired nickel phosphide electrocatalysts can produce more complex multi-carbon products than natural photosynthetic enzymes but controlling C-product selectivity and suppressing H2 evolution remain open challenges. Here, we report a significant shift in the CO2RR product distribution on Ni2P in the presence of boric acid/borate, a soluble Lewis acid/base co-catalyst. Using Ni2P without a co-catalyst, CO2 reduction produces a mixture of methyl glyoxal (C3) > 2,3-furnadiol (C4) and formic acid (C1) with 100% Faradaic efficiency for carbon products. Addition of boric acid/borate shifts product selectivity to ethylene glycol (EG) with an 85% CO2-Faradaic efficiency (at 10 mM, 0 V vs. RHE), with the balance being the aforementioned C1, C3 and C4 products. The mechanism of EG formation is proposed to occur by the co-catalyst activating a reaction between surface *hydride and *glycolaldehyde on Ni2P, while suppressing the aldol C–C coupling reaction that forms the C3 and C4 products. The formation of an intermediate borate-EG-diester, [(OCH2CHO)2B]−, is detected by 11B-NMR, which hydrolyzes to release the EG product. Extended electrolysis of boric acid modifies the surface of Ni2P by forming *BO3–Ni2P, as shown by XPS. CO2 electro-reduction on *BO3–Ni2P in the absence of free boric acid produces exclusively ethylene oxide (EO), which slowly hydrolyzes to EG in the bicarbonate electrolyte. The combined Faradaic efficiencies for CO2RR products EO + EG with free boric acid as the co-catalyst and *BO3–Ni2P as the cathode reaches 88% (at 0 V vs. RHE), a record carbon selectivity. This work illustrates the feasibility of using Lewis acid/base co-catalysts to change the established chemical reaction mechanism of an electrocatalyst to form a new, chemically predictable, more valuable product in high yield.
Broader contextEnergy efficient conversion of carbon dioxide into useful chemicals and fuels is the major barrier to reversing the unsustainable emission of CO2 and mitigating climate-driven ecosystem disruption. To become carbon negative and sustainable, the process must also extract hydrogen atoms from a renewable resource, e.g., water, and utilize renewable electricity as an energy source. To be useful, targeted products must be made selectively, ideally by design. These requirements are not currently met at scale by any process, natural or man-made. Here we demonstrate that the selective conversion of water and CO2 to ethylene glycol can be realized at the lab scale by redesigning an electrocatalyst that efficiently forms multiple carbon products using only electricity as a source of power. This approach relies upon understanding of the fundamental chemical mechanism of electrocatalysis and is generalizable to the targeted formation of other multi-carbon products. |
1. Introduction
The CO2 electroreduction reaction (CO2RR) makes chemicals, fuels and polymer precursors from carbon dioxide and water by electrolysis. This process, aptly named artificial photosynthesis (AP), has the capability to replace petrochemicals and biomass feedstocks, both of which are net carbon-emitting and major contributors to global warming. AP processes can operate at milder conditions (T, P) than thermochemical processes, thereby achieving greater system energy efficiencies.2 These advantages offer the adopting industries the prospect of significant economic development, while improving the global availability of limited resources and stabilizing climate change.Fundamental advances in electrocatalysts,3 electrolytes4 and electrochemical cell designs,5 have propelled AP technologies to a point where scale-up of electrolysis is beginning to occur for generating simple C1 products such as carbon monoxide,6,7 syngas,8,9 and formate/formic acid10–15 with relatively high selectivity and reaction rates. Distinct classes of CO2RR electrocatalysts have been found that discriminate between the formate and carbon monoxide pathways,1,16,25 thereby allowing C1 product selectivity and suppressing self-poisoning by CO. But product selectivity remains a major challenge for multi-carbon products, which have much greater impact and value owing to their higher volumetric energy density and commercial value.17,18
Copper is the most studied CO2RR catalyst that generates various multi-carbon products with low selectivity and at large overpotentials. Mechanistically, copper and several simple metal catalysts perform non-selective electro-reduction reactions by electron transfer without formation of surface *hydrides as precursors. The large overpotential is attributed to the reductive adsorption of the anion radical, *[CO2]−, on the surface which protonates and captures a second electron to release a hydroxide or water molecule. This cleavage is aided by the stronger adsorption of the *CO intermediate and its further reduction to C1 and C2+ products.18 Several strategies have been proposed to regulate the reaction steps in an attempt to increase the selectivity toward multi-carbon products. Among these are metallic alloying to shift the Fermi level and create multiple binding sites, as observed for Ag/Cu catalysts that produce ethanol;19 regulating the morphology to control crystal facet exposure, such as the prism-shaped copper nanocatalysts that generate ethylene;20 using non-metallic CuS with sulfur vacancies as the catalyst to synthesize n-propanol21 and other liquid fuels.22–25
Transition metal phosphides, notably nickel phosphides,1 iron phosphides26,27 and copper phosphides,28,29 have received attention as catalysts for CO2RR due to their ability to generate a variety of carbon products from simple C1 to multi-carbon at low overpotentials close to the thermodynamic minimum. Five binary nickel phosphide compounds, NixPy, were shown to convert CO2 exclusively into three products formic acid (C1), methylglyoxal (C3), and 2,3-furandiol (C4), with total carbon yields of up to 98% at overpotentials as low as +10 mV vs. RHE.1 The CO2RR current densities for these products increases linearly with the P stoichiometry (y/x) on nickel phosphides, suggesting that surface-bound (*) phosphino-hydrides are the active sites for CO2RR.1 Although copper phosphides and iron phosphides convert CO2 into similar products, suggesting similar mechanisms via the formate pathway, their overpotentials and faradaic efficiencies are not as favorable.
Based on the computational studies of Wexler et al., the P-rich surface of nickel phosphides offers nearly optimal (thermoneutral) H adsorption. Calvinho et al.1 proposed a mechanism distinct from simple metal catalysts like copper in which the potential determining step is a two-electron process involving CO2 insertion into a surface *hydride bond to form adsorbed formate, *HCOO−. This intermediate reorients on the surface and is attacked by another *hydride to form formaldehyde H2CO*, prior to the C–C coupling steps that form the C3 and C4 products. This mechanism was validated by several experimental tests1,25 and Banerjee et al. provided evidence from DFT calculations that predicted relative energies of the adsorbed intermediates. This consensus mechanism is the starting point for the present study of how to change the product selectivity using Lewis acids/bases.
Since Hori and co-workers’ foundational work in the 1980–1990s, the electrolyte composition is known to influence the selectivity and activity for CO2RR.30 Recently, Koper et al.31 used experimental and computational methods to demonstrate that Lewis acids in the electrolyte, such as polarizable metal cations (Cs+, Ba2+, and Nd3+) coordinate to the chemisorbed anion radical *CO2− on polycrystalline gold cathodes and facilitates further reduction steps. They attributed the effect of acidic cations on CO2RR to the interplay between cation stabilization of the *CO2− intermediate, cation accumulation at the outer Helmholtz plane (OHP), and the chemical potential of the solvating water. Other works have also shown that Lewis acidic metal atoms added to the metal oxide catalysts favor CO2RR,32,33 presumably by interacting with *CO2− to aid the cleavage of the C–O bond.
Herein, we report a new co-catalytic system comprising boric acid in carbonate electrolyte acting as Lewis acid to shift the electroreduction of CO2 on Ni2P from the C1, C3 and C4 products to ethylene glycol, achieving a faradaic efficiency of 85–88% at an applied potential of 0 V vs. RHE. Further electrolysis of this electrolyte results in the covalent attachment of boron to the electrocatalyst surface, forming *B–Ni2P. Following the removal of free boric acid, the *B–Ni2P catalyst produces ethylene oxide, the anhydride form of ethylene glycol, as its sole CO2RR product. A unified mechanism of product formation on both surfaces was obtained using XPS, 11B-NMR, and 1H-NMR spectroscopy, leading to an understanding of the influence of the co-catalyst on both the *intermediates and the electrocatalyst.
2. Results and discussion
2.1. SSS-Ni2P with different concentrations of H3BO3 at 0 V vs. RHE
As a starting point we synthesized Ni2P from its elements using an established high temperature method herein denoted solid state synthesized (SSS-Ni2P).1 This method provides the most stringent control over crystal phase purity. No other NixPy phases or impurities were detected as demonstrated by X-ray diffraction (Fig. S2, ESI†), optical and SEM microscopies. This method produces micron size particles by SEM (Fig. S1, ESI†) comprised of aggregated individual crystallites ranging in size from 10 nm and larger as seen by HRTEM. The Ni2P phase purity was further identified by HRTEM imaging and fast Fourier transformation analysis from two zone axes of [111] and [11−2] as shown in Fig. S11 and S12 (ESI†).Consistent with our earlier reports, GC analysis confirmed that H2 is the only gaseous product at all applied potentials, whereas HPLC (Fig. S5, ESI†) and 1H-NMR (Fig. S4, ESI†) confirmed that there are three liquid products formed on Ni2P: formic acid (C1), methylglyoxal (C3), and 2,3-furandiol (C4).1,34Fig. 1 summarizes the HPLC data showing that with no H3BO3 (boric acid) and using the same conditions the dominant product is 2,3-furandiol at 70% faradaic efficiency, with methylglyoxal and formic acid making up the balance (zero H2 production). Addition of 10 mM H3BO3 at constant pH to the catholyte shifts the product selectivity predominantly to ethylene glycol at faradaic efficiency ∼83%. H2 is the next largest product at faradaic efficiency ∼13%, followed by small amounts of methylglyoxal, formic acid and 2,3-furandiol. At higher concentrations of H3BO3 and constant pH (25 mM H3BO3 and 50 mM are shown in Fig. 1) the H2 FE increases relative to the CO2RR products that contribute to the FE ∼45% and ∼30%, respectively. Note that ethylene glycol remains the dominant CO2RR product at all tested concentrations of boric acid, while the HER is progressively favored as the concentration of boric acid in solution increases. The pH of the electrolyte remains unchanged (7.5 ± 0.05) upon the addition of boric acid from 10 to 50 mM, indicating that pH is not responsible for changing the CO2RR selectivity. Note that boric acid is both a Brønsted acid (eqn (1a)) and a Lewis acid (eqn (1b)):
| HA ↔ H+ + A− | (1a) |
| HA + :B ↔ (B − A)− + H+ | (1b) |
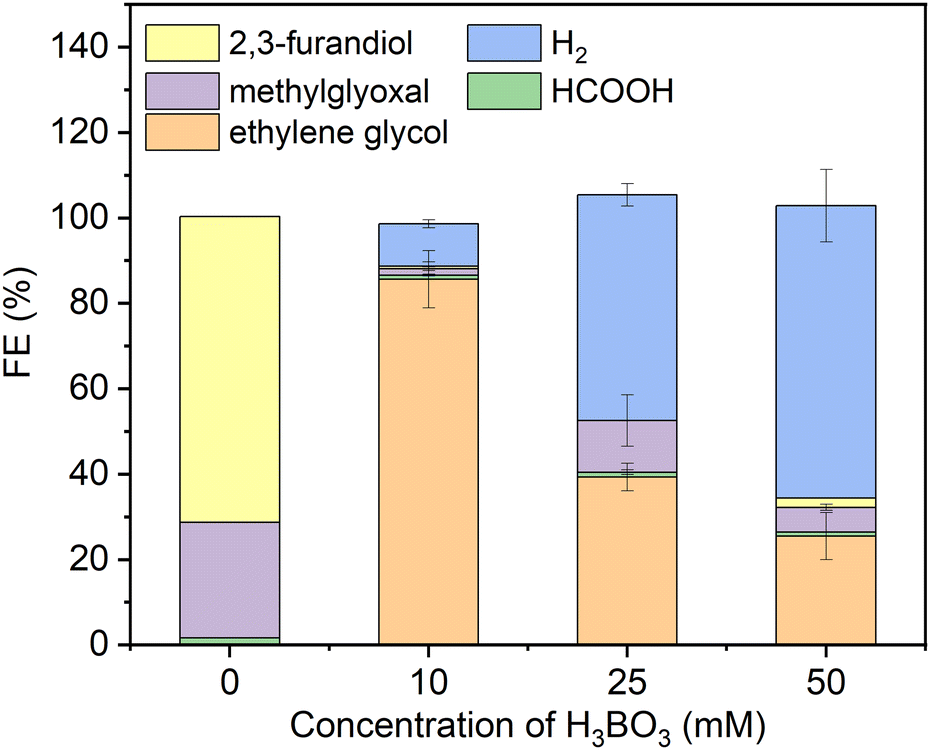 | ||
| Fig. 1 Faradaic efficiencies of all products (including H2) using the SSS-Ni2P catalyst supported on the cathode and measured at 0 V. Three concentrations of H3BO3 were dissolved in the electrolyte (0.5 M KHCO3) an adjusted to pH of 7.5. The catholyte was purged with gaseous CO2 at 5 mL min−1. The integration time to accumulate these products was fixed at 6 h. The current density for each experiment ranged from 0.05 to 0.12 mA cm−2. Standard errors are shown for 3 replicates. Concentrations were determined by integration of HPLC peaks and compared to the respective standards (Fig. S5, ESI†). | ||
Hence, it is expected that the HER current should increase with excess free boric acid based on the standard model for general acids.
2.2. Electrical potential dependence with 10 mM dissolved H3BO3
In Fig. 2a we investigated the dependence of product yields on the applied potential using linear sweep voltammetry (LSV). The two curves were acquired in either CO2-saturated 0.5 M KHCO3 solution with 10 mM H3BO3, or without CO2 in Argon-purged 0.25 M pyrophosphate solution with 10 mM H3BO3, representing the CO2RR + HER and HER, respectively. There is a shoulder in the CO2RR current between −0.1 and −0.3 V vs. RHE that is analogous to Fe2P. It may reflect a higher affinity for formic acid and formaldehyde intermediates predicted by DFT.26,27 At potentials more positive than −0.26 V vs. RHE, CO2 activates a higher total current density relative to the Argon-saturated (CO2-free) conditions, indicating that the higher intrinsic activity of Ni2P with H3BO3 originates from CO2 electroreduction. At applied potentials from −0.26 V to −0.8 V, the current densities in argon-purged conditions are higher compared to CO2-purged conditions. This is consistent with the fact that at increasing negative potentials more surface hydrides (*H) form that bind more weakly and result in greater HER activity relative to the slower multi-step CO2RR reactions.35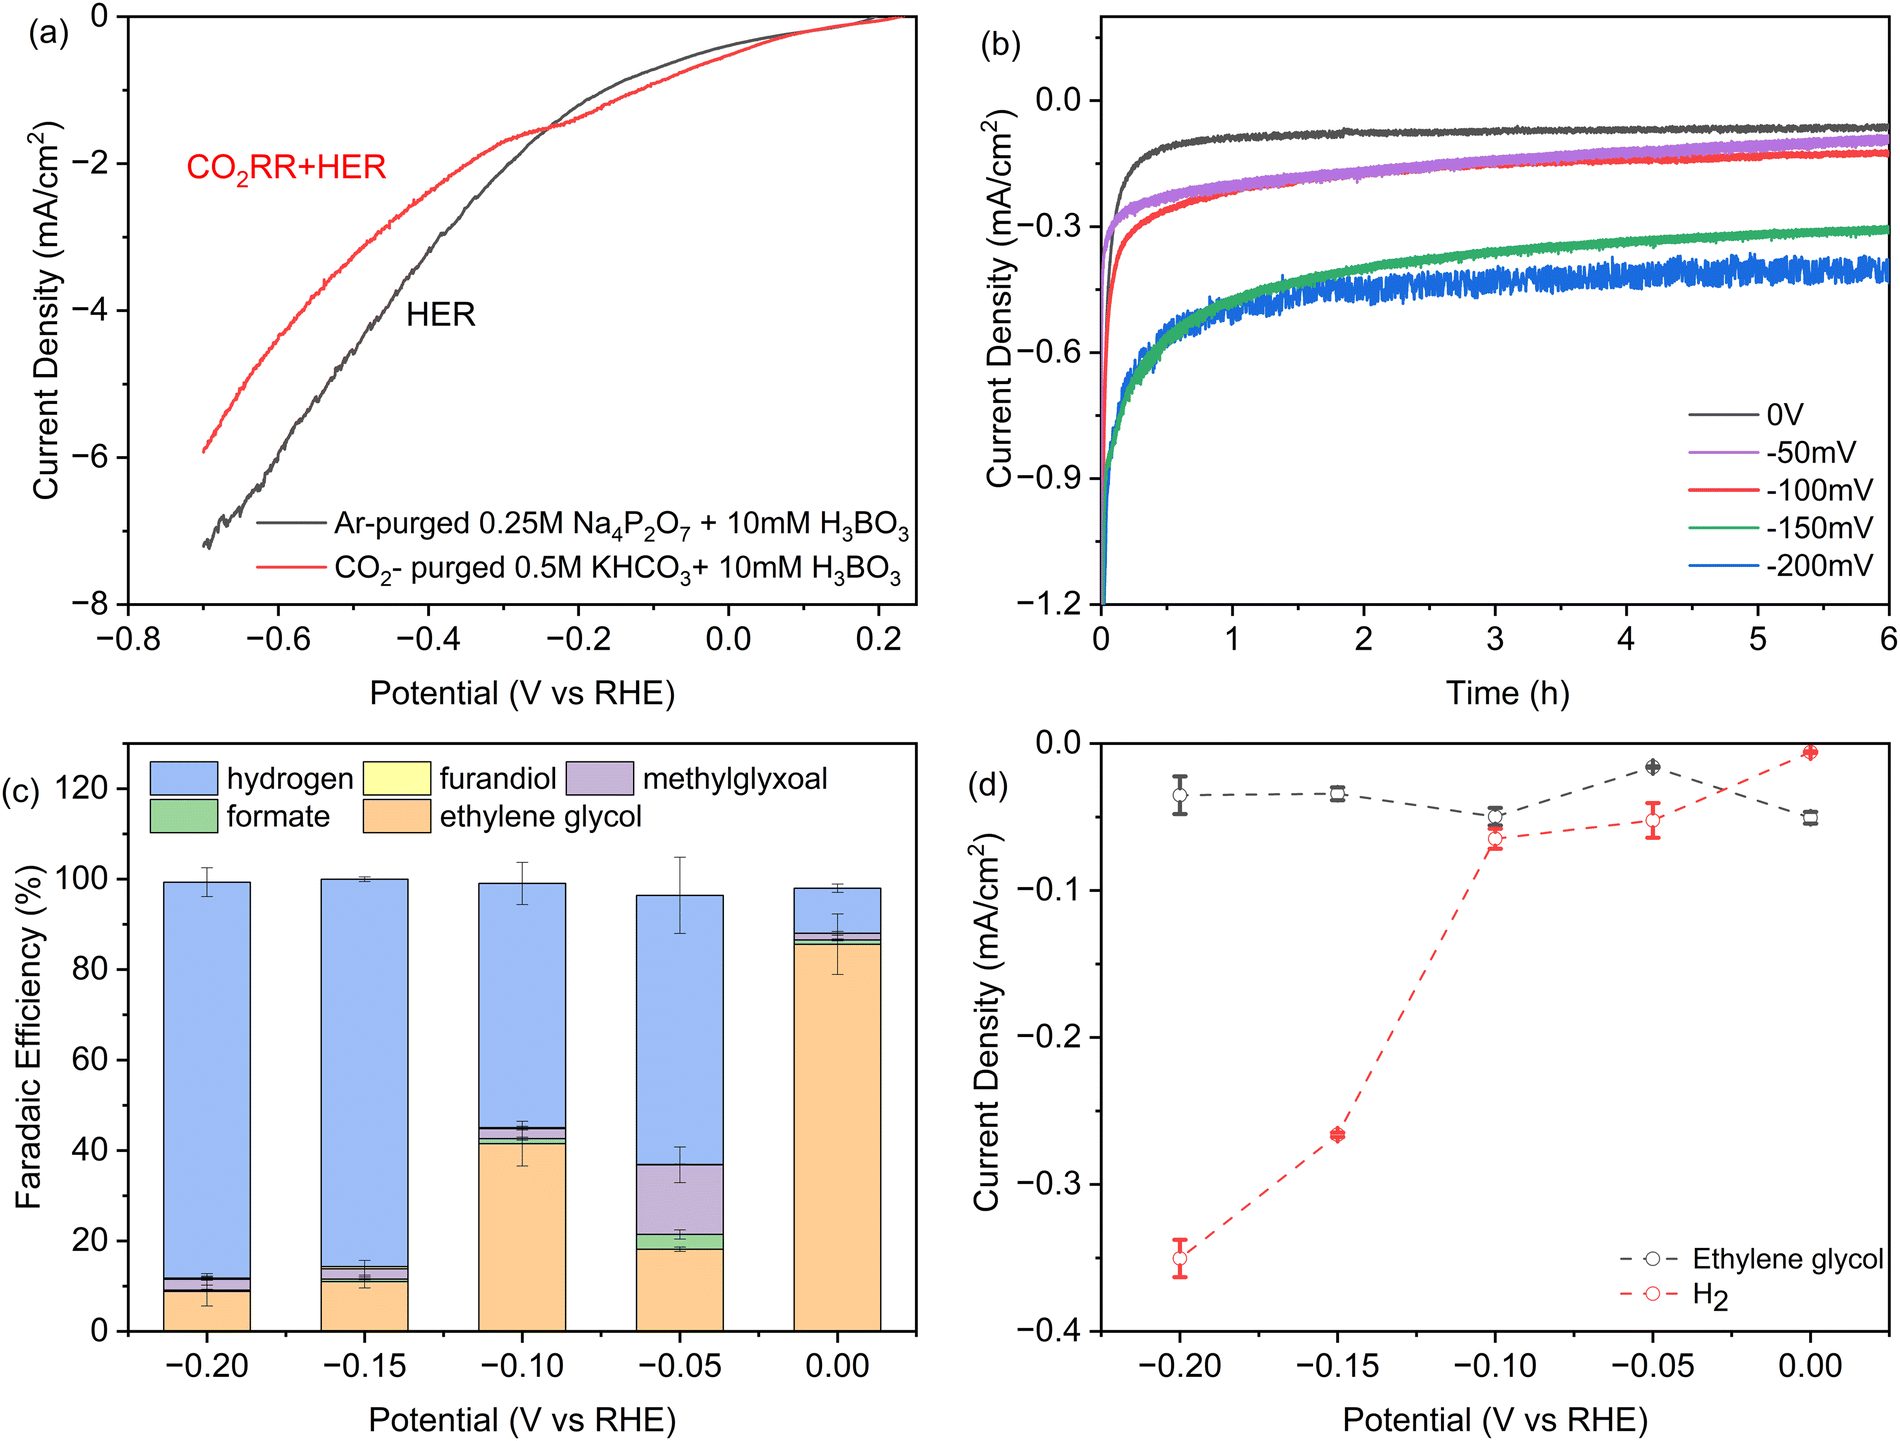 | ||
| Fig. 2 (a) iR-corrected linear sweep voltammetry at 0.5 mV s−1 of SSS-Ni2P nanocrystals in 10 mM H3BO3 plus 0.5 M KHCO3: grey, argon-purged 0.25 M pyrophosphate buffer, pH 7.5. This current corresponds to H2 production, or red, CO2-saturated 0.5 M KHCO3 at pH 7.5, where the current is due to both CO2 reduction and the HER. (b) Total current densities obtained during 6 hours of chronoamperometry. (c) Faradaic efficiency determined by HPLC (ESI† Section S8) as a function of potential for each product on Ni2P with 10 mM H3BO3 and 0.5 M KHCO3. (d) Partial current densities obtained as the product of faradaic efficiency times current density at 6 hours of chronoamperometry, normalized to the geometric surface area. The cathode compartment is purged with CO2 gas at 5 sccm and the initial pH is 7.5. Data are the average of three technical replicates. Integration time for collection of products is 6 h and the current densities range from 0.06 to 0.4 mA cm−2. | ||
Chronoamperometry (CA) was employed to investigate the stability of Ni2P with the addition of boric acid in the electrolyte at the concentration that produces the largest shift to ethylene glycol. Fig. 2b presents the CA curves recorded in a CO2-saturated 0.5 M KHCO3 solution with 10 mM H3BO3 over a 6-hour span at various potentials ranging from 0 V to −0.2 V vs. RHE. During these experiments, CO2 was continuously purged into the electrolyte. As shown in Fig. 2b, after an induction period for the reduction of a surface oxide layer, almost constant current density was obtained at every applied potential, indicating the high stability of the Ni2P and boric acid catalyst combination. As expected, the cathodic current density increases with negative bias with the largest increase between −0.1 and −0.15 V. For the long-term stability of the catalysts, the overall current remains stable during a 50-hour CP experiment. Online GC showed the FE for hydrogen is maintained at ∼10% and overall faradaic efficiency for ethylene glycol is calculated to be 81%.
Fig. 2c presents the faradaic yields (FEs) of all products after 6 h electrolysis as a function of applied potential from 0 V to −0.2 V for SSS-Ni2P using 10 mM H3BO3 in the electrolyte. The FE tests were restricted between 0 V to −0.2 V vs. RHE for multiple reasons. More positive potentials were previously shown to cause the oxidation of Ni2P. In Fig. 2a, the LSV shows that the HER is more favored at potentials positive of 0 V, while the CO2RR current disappears, and FE measurements cannot be done in this range. At a potential of 0 V vs. RHE the total CO2RR FE is ∼90% with the remaining 10% H2. The FE of ethylene glycol at this potential ranged from 78–90% over three technical replicates. The application of −0.05 V, −0.1 V, −0.15 V and −0.2 V bias results in the total CO2RR FE of 37%, 45%, 14% and 12%, respectively. At all applied potentials, the boric acid supplemented electrolyte retains a high selectivity towards ethylene glycol with the balance being methylglyoxal, formic acid and 2,3-furandiol. The total CO2RR FE peak observed at −0.1 V is reproducible, as is the shift to more methylglyoxal at −0.1 V vs. RHE. This agrees with observations using Ni2P and Fe2P without boric acid,1,26,27 and was predicted by DFT to arise from an increased affinity for the C1 intermediates which favors the slower reaction to the C3 product.
Fig. 2d plots the instantaneous current density for ethylene glycol and hydrogen as a function of applied potential. At 10 mM boric acid the current density for ethylene glycol has a maximum at 0 V and a second peak at −0.1 V. These peaks also occur for the total CO2RR specific current density which is 50 μA cm−2 at 0 V and a second substantial peak (48 μA cm−2) at −0.1 V. This shows that peaks occur at these applied potentials in both the instantaneous currents and the integrated currents. The HER current density increases discontinuously at potentials more negative than −0.1 V, as noted above. This suggests the formation of a lower affinity surface hydride that react preferentially in HER vs. CO2RR, in agreement with earlier observations.1,26,27
2.3. Surface changes following catalysis
To overcome the HER and understand the mechanism, we investigated removing boric acid from the electrolyte by electrodepositing it on the surface of Ni2P under CO2RR conditions. To do this systematically, we examined the surface of the Ni2P catalyst by X-ray photoelectron spectroscopy (XPS) following electrolysis in boric acid as a function of concentration and time.The elemental composition of Ni2P electrodes was evaluated by X-ray photoelectron spectroscopy (XPS) before and after 18-h CO2RR at 0 V vs. RHE on Ni2P with 10 mM H3BO3 as shown in Fig. 3. The XPS spectra were acquired for the pristine Ni2P cathode before electrolysis (a), the cathode after electrolysis in 0.5 M KHCO3 and 10 mM H3BO3 at 0 V vs. RHE (b), and the cathode after electrolysis in 0.5 M KHCO3 and 50 mM H3BO3 at 0 V vs. RHE (c). All electrodes were rinsed 3 times in DI water.
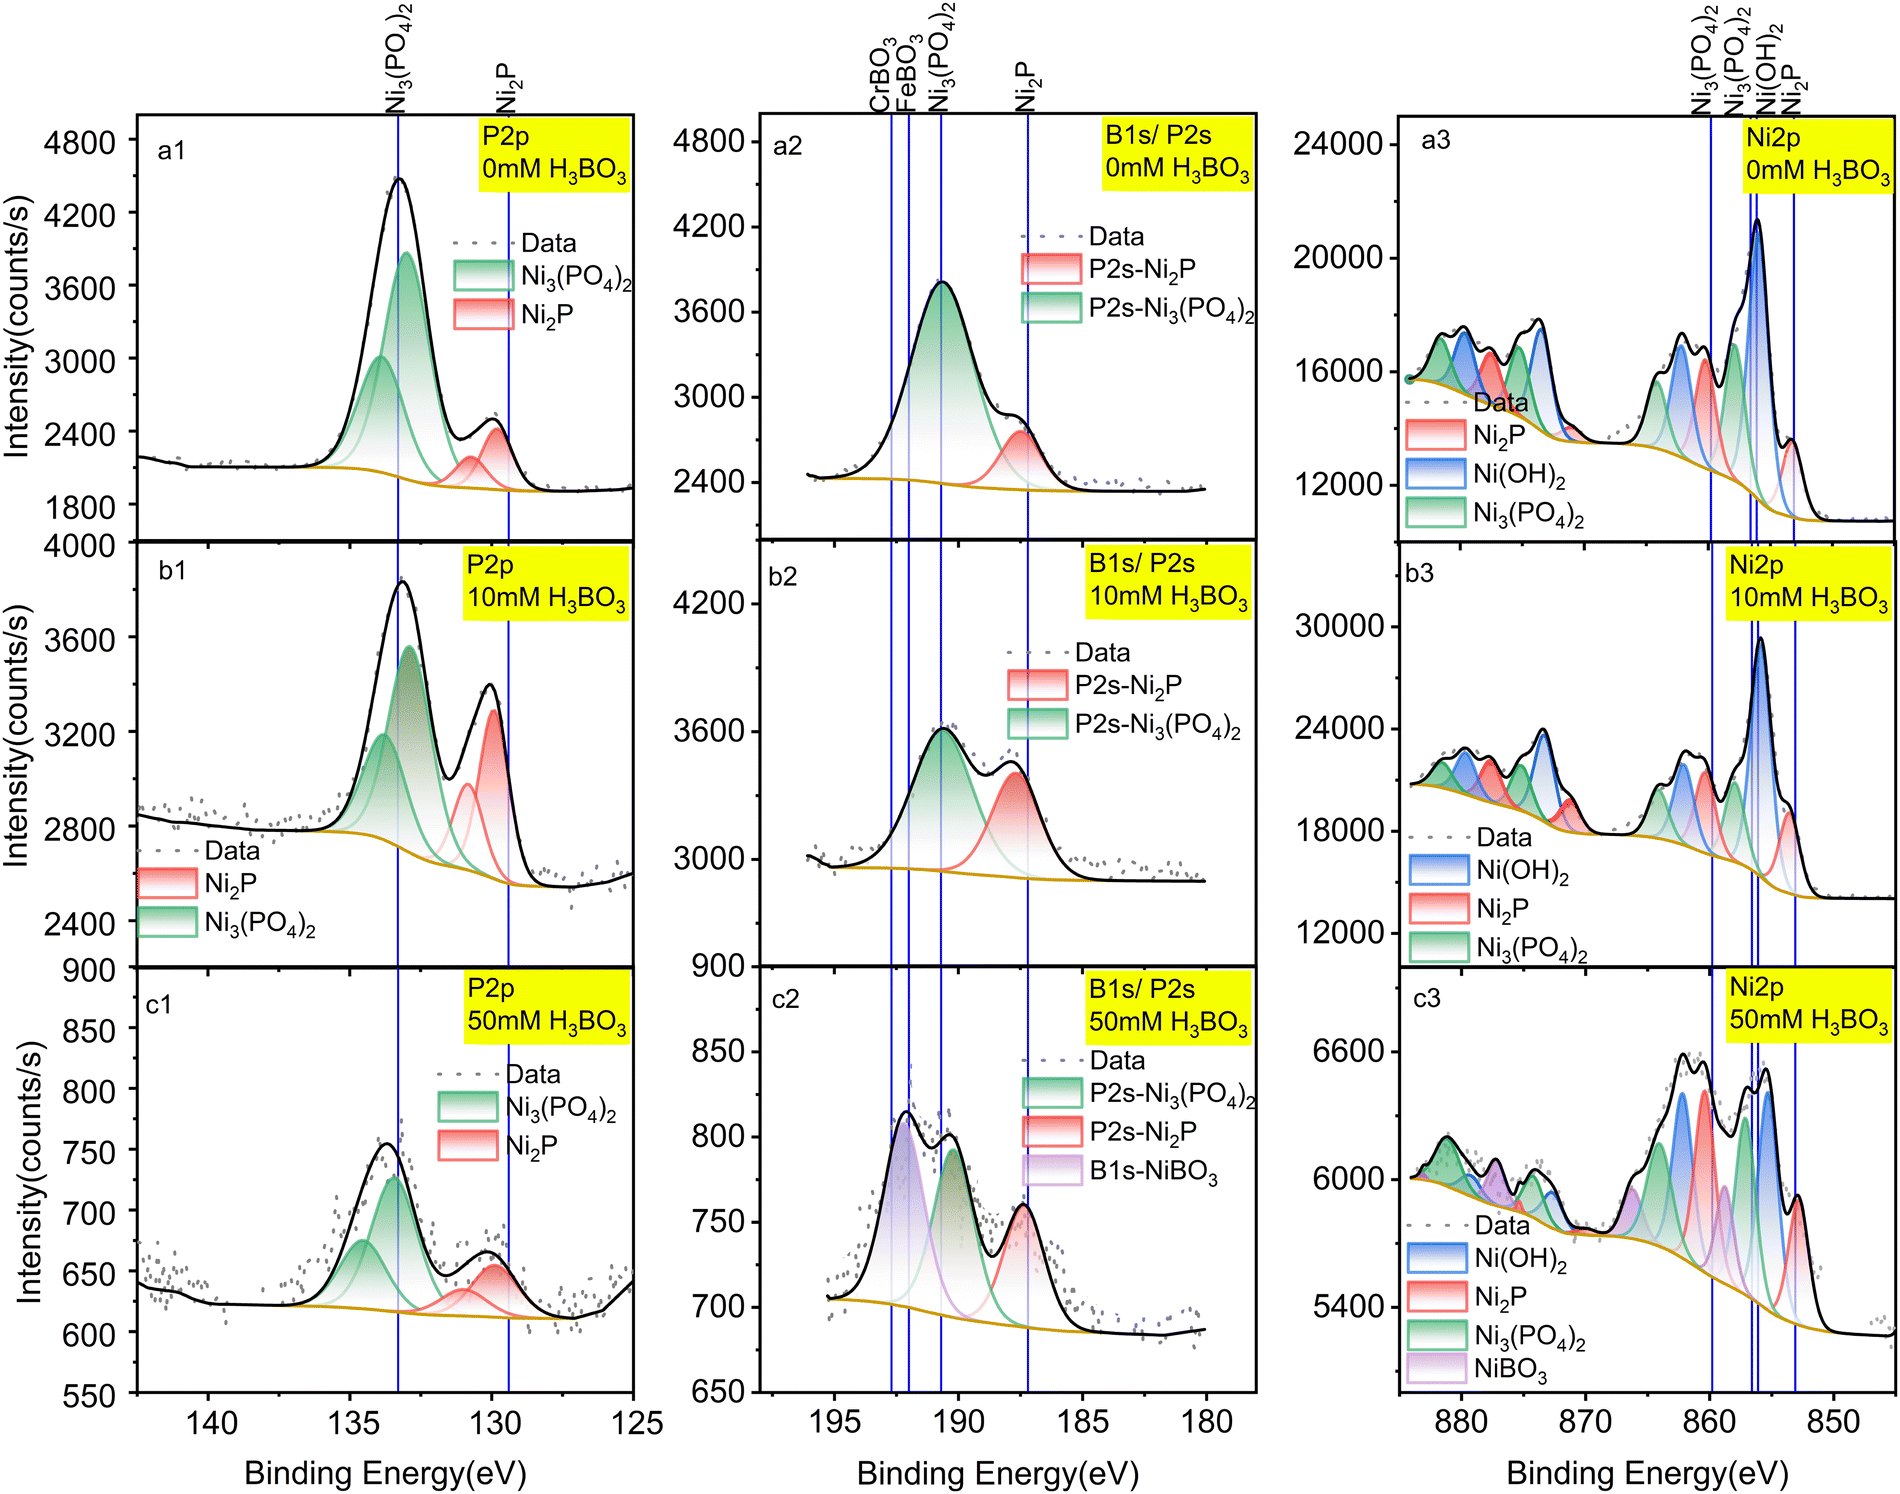 | ||
| Fig. 3 XPS spectra of a pristine Ni2P cathode before electrolysis (a); Ni2P cathode after 18 hours of electrolysis in 10 mM H3BO3 electrolyte (b); Ni2P cathode after 18 hours of electrolysis in 50 mM H3BO3 electrolyte (c). Electrolysis was done at 0 V vs. RHE. All samples were washed prior to XPS in deionized water and dried for 72 hours at 60 °C. Left column is P 2p spectra; middle column is B 1s spectra overlapped with P 2s region; right column is Ni 2p spectra. Solid lines show the standard spectra taken from the NIST XPS database (ESI† Section S3). | ||
Fig. 3a1 shows that the pristine Ni2P electrode before electrolysis exhibits two sets of doublets for the 2p3/2 and 2p1/2 transitions in the P 2p XPS region, corresponding to *phosphide Pδ− and *phosphate/phosphite. Fig. 3a3 gives the Ni 2p XPS spectrum of pristine Ni2P showing the larger 2p3/2 and 2p1/2 spin–orbit splitting, and with each region exhibiting six satellite peaks arising from chemical speciation. The species are assigned to Niδ+ from Ni2P, Ni2+ from nickel hydroxide and/or oxide mixture (Ni(OH)2/NiO) and Ni2+ from Ni3(PO4)2. These assignments agree with previous studies showing that nickel phosphides undergo surface oxidation to form a partially oxidized surface phosphate/phosphite on top of the pristine nickel phosphide.1,36 Table S1 (ESI†) lists all the experimental peaks and all the assigned peaks from the literature.
Fig. 3a2, b2 and c2 shows peaks in the region for P2s and B1s which overlap. Fig. 3a2 has no boron present, so we assign these peaks to the P2s transition from Ni2P and Ni3(PO4)2. The peak at 190.6 eV is assigned to Ni3(PO4)2 based on the reference binding energy of P2s (190.7 eV) from Ni3(PO4)2.36 The peak positioned at 187.5 eV is assigned to Pδ− from Ni2P, which lies between the Pδ− (P2s peak) from Ni3P (187.2 eV)37 and the P2s peak from pure P (188 eV),36 consistent with the oxidation state of Ni2P. The assignments of these two peaks are further confirmed by the atomic percentage obtained from the integrated peaks using the Thermo-Avantage software. The atomic percentage calculated from the P2s region (Fig. 3a) for Ni2P and Ni3(PO4)2 are 7.83% and 1.46%, which agrees with the atomic percentages calculated from the P 2p region (Fig. 3b): 7.89% and 1.41%, respectively. Table S2 (ESI†) lists all the peaks detected and the corresponding atomic percentages.
By comparing the pristine electrode (Fig. 3a) to the electrodes after electrolysis at 0 V vs. RHE (Fig. 3b), the ratio of Pδ−/PO43− is seen to increase, in agreement with the Ni 2p spectra. By comparing the speciation before and after electrolysis, the relative content (estimated by peak height) of Niδ+ relative to Ni2+ from the combined Ni(OH)2/NiO and Ni3(PO4)2 decreases after catalytic turnover, indicating that the oxidized surface layer decreases under negative bias.
As shown in Fig. 3b, after cycling at 0 V vs. RHE with 10 mM boric acid in the electrolyte, no other new peaks appear. However, with 50 mM H3BO3 in the electrolyte (Fig. 3c2) the highest energy peak splits into two peaks after electrolysis. The higher energy peak at 192.3 eV is assigned to nickel borate (NiBO3) based on the NIST X-ray photoelectron spectroscopy database, which rules out the possibility of NiB (188.9 eV), Ni2B (189.9 eV), Ni3B (187.4 eV), and BPO4 (193.5 eV). Although there is no existing reference for NiBO3, we deduce that the new peak is assigned to nickel borate considering the binding energy is intermediate between FeBO3 (192 eV) and CrBO3 (192.7 eV). This assignment is further corroborated by the new peak that appears in the Ni 2p spectra, which has a binding energy of 858.9 eV (Fig. 3c3). The higher binding energy of this Ni 2p peak suggests deshielding of the core electrons commensurate with a higher formal oxidation state compared to Ni2+ in Ni3(PO4)2 and Ni(OH)2, which is consistent with the expected Ni3+ formal oxidation state of NiBO3. Therefore, we conclude that the electro-synthesized BO3*–Ni2P species incorporates boron into the Ni2P electrode to form NiBO3 under electrolysis at both 10 mM and 50 mM H3BO3, though it is only detected by XPS at the higher concentration due to the limit of sensitivity. We designate this species BO3*–Ni2P and the reactions that it catalyzes are described below. In conclusion, XPS indicates that electrolysis in boric acid stabilizes formation of a surface Ni3+ adduct with borate B(OH)4−.
2.4. Reaction mechanism of CO2RR on BO3*–Ni2P
Other tests were conducted to understand the influence of boric acid. Eliminating all sources of CO2 by replacing the carbonate electrolyte with 0.25 M sodium pyrophosphate and 10 mM boric acid, without the feeding of CO2 gas, yields no CO2RR products on nickel phosphide. This confirms that all the products are from CO2 and that boric acid in the electrolyte acts as a catalyst to shift the CO2RR product distribution on Ni2P to ethylene glycol.Next, we used 11B-NMR to investigate which soluble species are present in the catholyte solution. As shown in Fig. 4a, no change in the 11B chemical shift occurs for the spectra before (a1) and after (a2) electrolysis on Ni2P at 0 V vs. RHE in 10 mM boric acid when using 0.25 M sodium pyrophosphate electrolyte (all CO2 is absent using argon purging). The observed chemical shift of 19.3 ppm is from free boric acid which is not affected by the negative potential or the hydrogen evolution reaction that occurred during electrolysis.38,39Fig. 4a3 and a4 show the analogous experiments conducted in 10 mM boric acid dissolved in 0.5KHCO3. In the carbonate buffer at this pH boric acid exists as the triborate form, [B3O3(OH)4]−, which has a chemical shift of 16 ppm before electrolysis (a3), in agreement with the literature.38 After electrolysis (a4) at 0 V vs. RHE in CO2 saturated 10 mM boric acid plus 0.5 M KHCO3, the chemical shift moves to 9.7 ppm, which indicates formation of a new borate complex for the diester of ethylene glycol, [B(OCH2CH2O)2]−, based on the assigned spectra of borate diesters with 1,2-diols.39 We believe that rapid equilibration between free boric acid and the diester is catalyzed by the carbonate buffer and is responsible for the presence of only a single chemical shift for the two forms. This observation agrees with the foregoing HPLC and 1H-NMR evidence showing that ethylene glycol is the main reaction product of CO2RR in boric acid on Ni2P in carbonate buffer. Table S4 (ESI†) lists all the 11B-NMR peaks and the standards used for assignment.
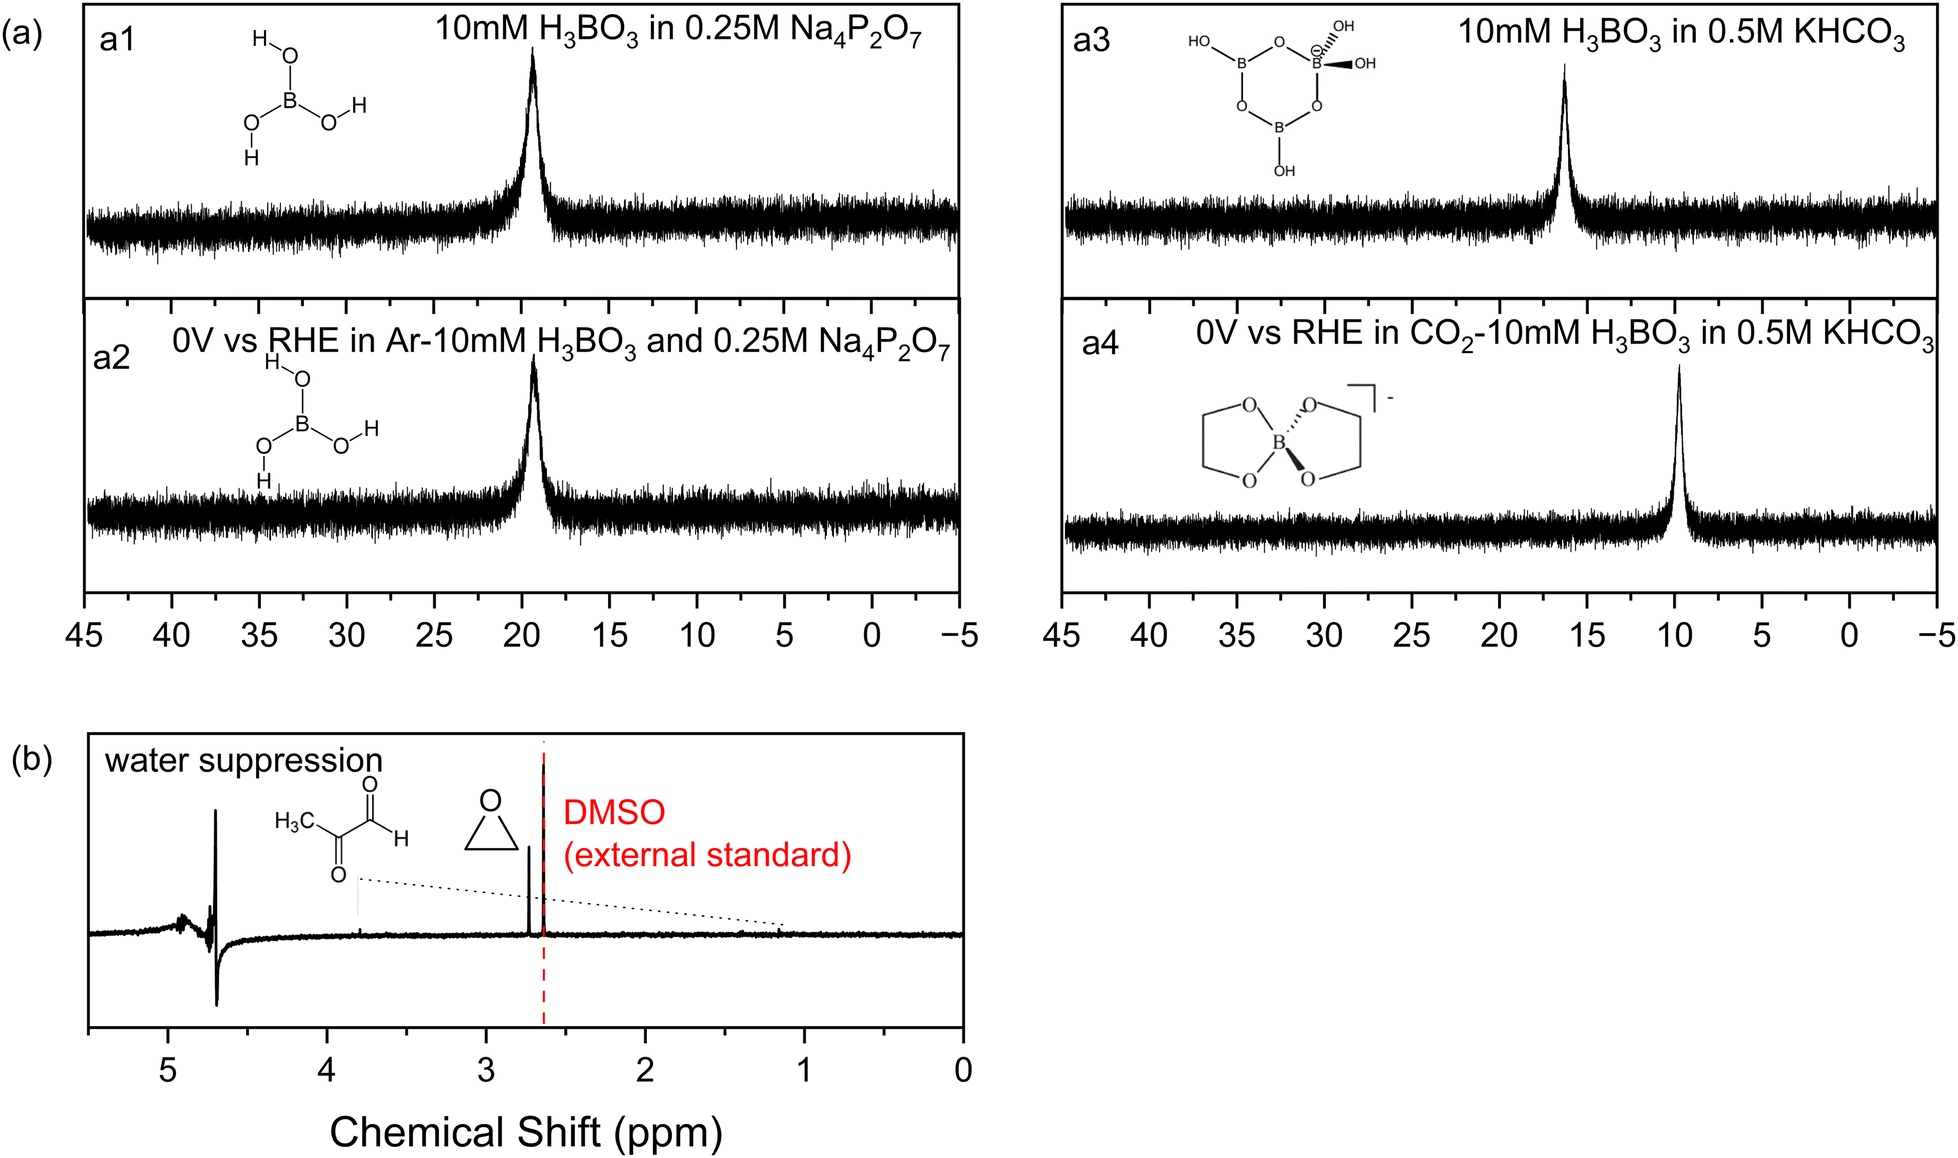 | ||
| Fig. 4 11B-NMR spectra of electrolyte before electrolysis with 10 mM boric acid dissolved in 0.25 M Na4P2O7 (a1) or 0.5 M KHCO3 (a3); and after electrolysis at 0 V vs. RHE in argon saturated 10 mM boric acid plus 0.25 M Na4P2O7 (a2), or after electrolysis in CO2 saturated 10 mM boric acid plus 0.5 M KHCO3 (a4). (b) The 1H NMR spectrum of the electrolyte after electrolysis at 0 V vs. RHE under CO2RR condition starting with the BO3*–Ni2P cathode and no free boric acid. | ||
Additional experiments were designed to identify the CO2RR products produced by the BO3*–Ni2P catalyst, in the absence of free boric acid in carbonate electrolyte. To do this, we rinsed away the free boric acid from an electrode previously electrolyzed for 6 h at 0 V vs. RHE in 50 mM H3BO3 and 0.5 M KHCO3, then conducted CO2RR at 0 V vs. RHE in 0.5 M KHCO3 without adding any boric acid in the electrolyte. The 1H-NMR spectrum of the electrolyte is shown in Fig. 4b, while the HPLC trace is given in Fig. S7 (ESI†). Both show the formation of a single new C2 product identified as ethylene oxide based on the chemical shift and the retention time of the authentic standard compound, respectively. The faradaic efficiency of EO is measured to be 13% for the BO3*–Ni2P catalyst formed in 50 mM boric acid. Other minor NMR products of methylglyoxal below 2% in total peak height were detected as singlet peaks at 3.7 and 1.2 ppm, with the balance as hydrogen production. As shown in Fig. S14 (ESI†), the current stability test for BO3*–Ni2P (produced by the above method starting with 50 mM boric acid) showed that the mean FE for CO2RR over 50 h is 14%. The overall current decrease slightly during this period, indicating the high concentration treatment of boric acid might reduce the performance of CO2RR. In order to further investigate the relationship between the coverage of BO3* and EO/EG production, we used the same method to generate BO3*–Ni2P with 100 mM H3BO3 and 200 mM H3BO3. The surface boron content was evaluated by XPS as shown in Fig. S10 (ESI†). The atomic percentage of boron was measured to be 2.0 ± 0.4; 2.3 ± 0.2 (N = 2), respectively, similar to the result when 50 mM boric acid was used to electrolyze Ni2P: 2.22 ± 0.24 (N = 2). These experiments show that a fixed stoichiometric level of boron (2.2 at%) is incorporated in the surface regardless of the amount of boric acid in the electrolyte or the period of electrolysis with this current method.
2.5. Proposed mechanism
The high faradaic efficiency for formation of ethylene glycol on the Ni2P electrode using boric acid in the electrolyte, as well as the formation of ethylene oxide on the BO3*–Ni2P electrode without free boric acid both occur with high selectivity (over 80%) and directly compete with the formation of the other three products that form on Ni2P alone (C1, C3 and C4). This result clearly indicates that both EG and EO originate from the same common C2 intermediate. We illustrate the proposed mechanism in Fig. 5a, which is based on the extensively tested mechanism for the formation of formic acid, methylglyoxal and 2,3-furandiol taken from Calvinho et al.1 An abbreviated version of the latter mechanism is shown in the black box: CO2 inserts into a surface *hydride bond to form formate, *HCOO−, which is followed by protonation and release of the formic acid product; *formate is reduced by another *hydride to form formaldehyde H2CO*. This undergoes rapid C–C dimerization with the active diol form *H2C(OH)2 which is the dominant form present in 0.5 M KHCO3 buffer. This exothermic dimerization reaction forms the *glycolaldehyde intermediate *HOCH2C(H)O. The energetics of these steps is based on the experimental free energies of the free intermediates in solution.1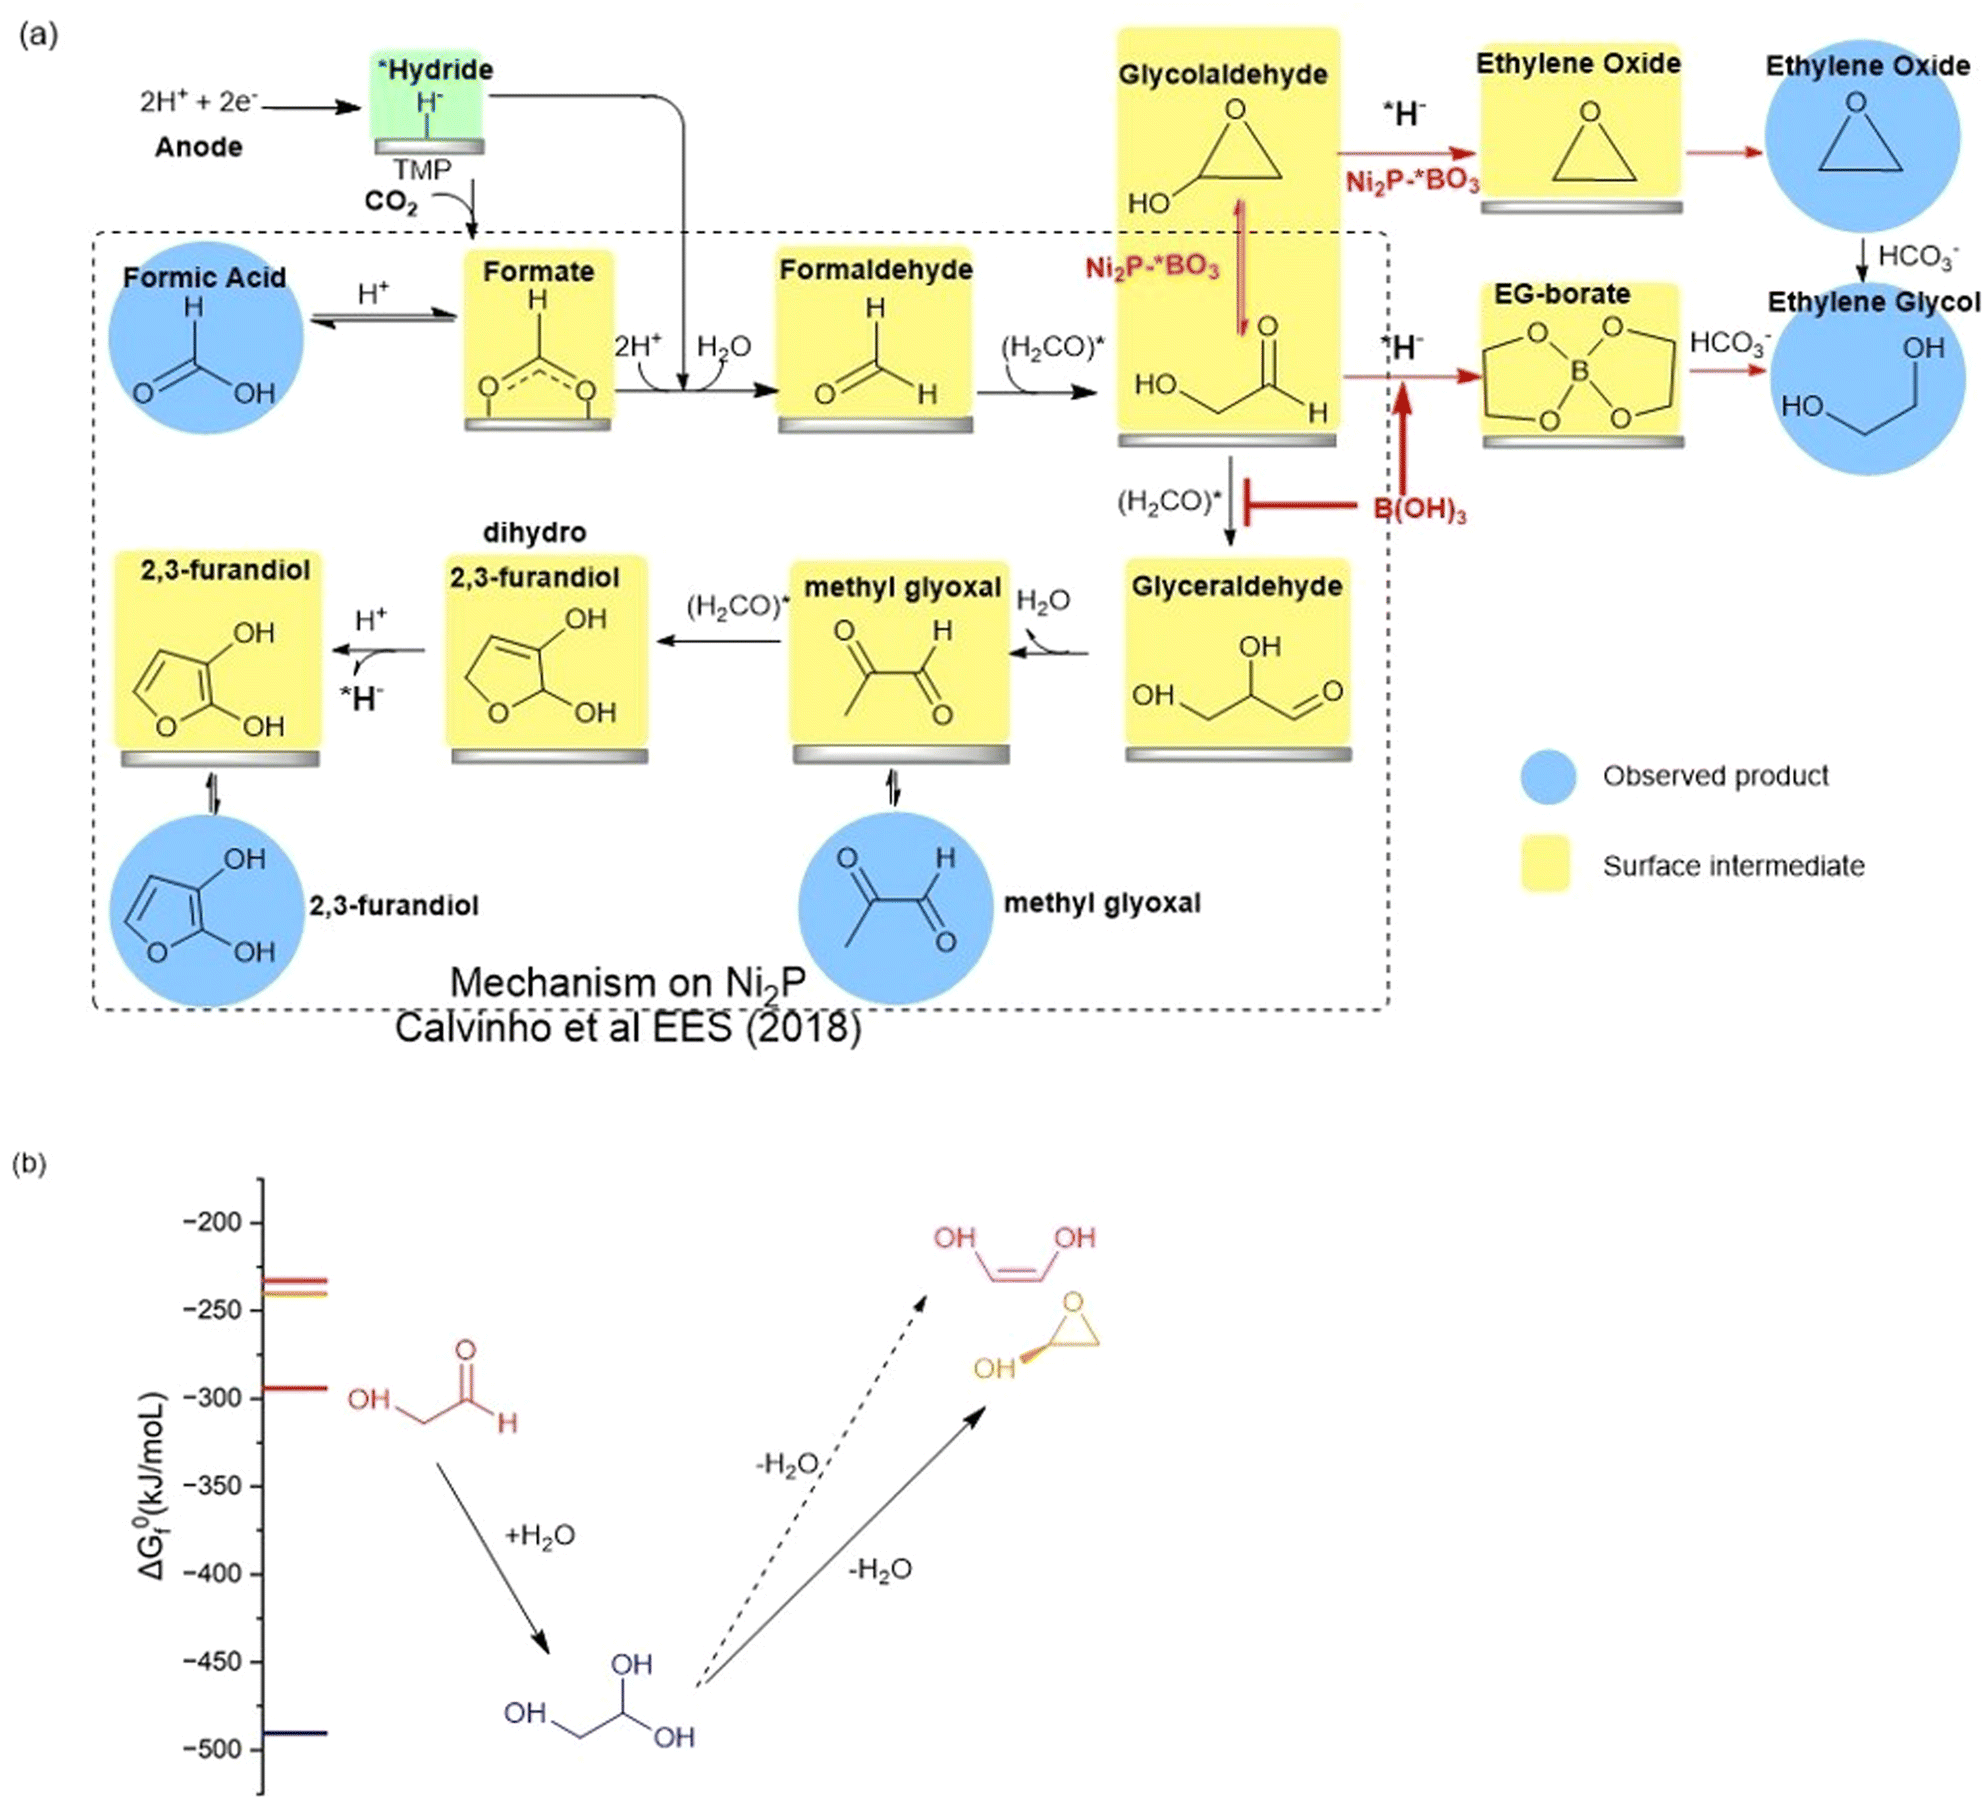 | ||
| Fig. 5 (a) BLACK box: the proposed reaction mechanism for the electro catalyzed reduction of CO2 on nickel phosphides in bicarbonate buffer as taken from Calvinho et al.1 Red arrows: the mechanism upon addition of boric acid to the electrolyte or using BO3*–Ni2P. The observed products of CO2RR are highlighted with blue circles, while postulated surface intermediates are highlighted in yellow boxes. (b) The chemical equilibria of glycolaldehyde in aqueous carbonate buffer showing the energetically favorable hydration to the geminal diol and dehydration by intramolecular cyclization catalyzed by carbonate. Dehydration to form the ethenediol is not expected owing to its higher energy and the mechanism requires protonation which is not possible in carbonate buffer. | ||
The chemical equilibria of glycolaldehyde in aqueous media deserves more discussion, as summarized in Fig. 5b. The values of the standard Gibbs free energy of formation 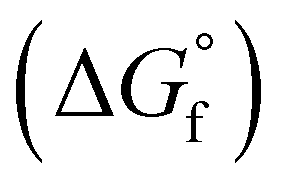 are estimated from the individual functional group contributions method from the published literature.40,41 These are plotted in Fig. 5b for four possible forms of glycolaldehyde. Experimental and computational evidence show that it spontaneously hydrolyzes to form the geminal diol in alkaline buffers where it is the dominant form present.42 The geminal diol can undergo intramolecular dehydration to form the cyclic form of glycolaldehyde, as shown. This cyclic form has been identified by mass spectrometry to be the major form present in the gas phase in equilibrium with the linear glycolaldehyde species in aqueous liquid phase.43 By contrast, dehydration to form ethenediol is not observed. It is predicted to have a slightly higher
  than the cyclic form of glycolaldehyde, as shown in Fig. 5b. Moreover, ethenediol is impossible to form mechanistically in carbonate buffer since its dehydration proceeds through protonation to form the cationic precursor.
We can now complete our proposed mechanism of formation of EG and EO, as shown by the red arrows in Fig. 5a. The key branching occurs at the glycolaldehyde intermediate, where boric acid in the electrolyte chelates the *gem-diol formed on the Ni2P surface, thus energetically favoring its reduction by surface *hydride to form the EG-borate ester and (observed) EG-borate diester. This latter step now outcompetes the aldol C–C coupling of glycolaldehyde to glyceraldehyde seen on unmodified Ni2P alone without boric acid. If instead, we start with the modified BO3*–Ni2P catalyst and remove excess boric acid from the solution, the glycolaldehyde intermediate exists as the dehydrated cyclic form, as shown. Subsequent reduction of this cyclic form to EO can readily occur by *hydride transfer from the catalyst and release of hydroxide to solution. The nascent EO product then undergoes hydrolysis catalyzed by the carbonate buffer to form EG, the final product.
3. Conclusions
In this work, we demonstrate the dominant influence of a Lewis acid to tune the product selectivity during CO2 electro-reduction on nickel phosphide in a chemically rational predictable manner. Formation of a single dominant EG product is achieved by favoring hydride reduction of the glycolaldehyde intermediate over C–C aldol coupling. This is achieved either by chelation of the linear C2 intermediate with boric acid from solution thereby favoring reduction to EG, or by hydrolysis of the EO product formed directly on the B-doped catalyst, BO3*–Ni2P. The prospect for further improving the current density to commercially viable values while retaining the high selectivity to EG is feasible considering the previous report of successful scaling of CO2RR current densities by 400-fold on Ni2P using a 270-fold higher surface area Ni2P catalyst prepared by detergent templating.34 Further improvement in selectivity by optimization of the conditions for B doping of the SSS-Ni2P catalyst was not examined herein but will be examined in the future using such high surface area catalysts. Using this general strategy, there are many other Lewis acids that could be examined to further fine tune the CO2RR products from other electrocatalysts.4. Experimental
Catalyst synthesis and phase purity
The Ni2P catalyst was prepared by solid state synthesis as described previously.1 Nickel metal powder (Sigma Aldrich, 99.99%) is heated to 300 °C in an atmosphere of 5% hydrogen balanced argon to remove the surface oxides. Then stoichiometric amounts of nickel powder (7.91 grams) and red phosphorus (2.09 grams, Alfa Aesar, 98.9%, 100 mesh) are ground together, remixed, and reground. The powder is transferred into a quartz tube then flushed with argon and evacuated to less than 100 mTorr three times before sealing the tube. The evacuated quartz tubes were then heated at a rate of 0.5 °C min−1 stepwise (350 °C, 450 °C, and 550 °C) to 700 °C, for a duration of 6 hours at each intermediate step, and 24 h at the final temperature. Removal of unreacted starting material was done by washing with 3% HCl, followed by water and ethanol wash. The as-synthesized materials were dried at 60 °C for 9 h. The phase purity of the powders was analyzed by PXRD as shown in Fig. S2 (ESI†). The nickel phosphides were characterized by SEM using a Zeiss Sigma Field Emission in-lens detector supported on conductive carbon (see the ESI,† Fig. S1). SEM images show that Ni2P comprises polycrystalline particles with diameters ranging from 5 to 50 micrometers.Cathode-catalyst fabrication
We prepared the nickel phosphide electrode from a published protocol,1 without the requirement of the addition of conductive carbon. 1 g Ni2P is fully mixed with Nafion solution (Sigma Aldrich, 5 wt% solution in lower aliphatic alcohols and water) by grinding with a mortar and pestle. The mixture was then pressed at 7 ton per cm2 in an aluminum die with a support of an aluminum mesh. The Ni2P pellet is used as the electrode in CO2RR and only the Ni2P catalyst is exposed to the electrolyte during the reaction.Electrochemistry
A custom-made, air-tight electrochemical cell is used to measure the CO2 electrochemical performance as described previously.1 The compartments for the counter and working electrodes are separated by a proton conducting membrane (Nafion 117, Fuel Cell Store). The aqueous solution of 0.5 M KHCO3 was pretreated with Chelex-100 (molecular biology grade resin) and employed as catholyte and anolyte. The choice of 0.25 M pyrophosphate as electrolyte for the HER control is described in the ESI† and Calvinho et al.1 Addition of H3BO3 (Fluka BioChemika, 99.5%) at the final concentration ranging from 10 to 50 mM. CO2 gas (Airgas, instrument grade, with a Supelco hydrocarbon trap) was bubbled into the electrolyte before electrolysis for at least 30 min and it was constantly fed into the cell during the electrolysis at rate 5 standard cubic centimeters per minute (sccm). The gas outlet of the cell connects to an online GC for the detection of gas products and is sampled every 30 minutes. A platinum foil (Alfa Aesar, 1 × 1 cm2) counter electrode and Hg/Hg2SO4 (RE-2CP, Biologics) reference electrode was utilized and calibrated daily. Electrochemical measurements including chronoamperometry and EIS were performed with a Biologics potentiostat and controlled by EC-lab software. All applied potentials were converted to the RHE by the equation: E (vs. RHE) = E (vs. SCE) + 0.2715 V + 0.0591 V × pH−iR, with iR compensation.Gas chromatography and high-performance liquid chromatography
Detection and quantification of gas products (hydrogen, carbon monoxide, carbon dioxide, methane, and ethylene) was performed by an auto-sampling online GC (SRI model 8610C) with a Aminex HPX-87HColumn. Liquid products were identified and quantified on a PerkinElmer Flexar HPLC equipped with an auto-sampler, refractive index (RID) and UV-vis detector. For separation an HPX 87H Aminex column (BioRad) was used, with injection volumes of 10 μL.Conflicts of interest
There are no conflicts to declare.Acknowledgements
This research has been funded by the DOE-SBIR program under a subcontract to RenewCO2 Inc. Contract number DE-SC0020615.Notes and references
- K. U. D. Calvinho, A. B. Laursen, K. M. K. Yap, T. A. Goetjen, S. Hwang, N. Murali, B. Mejia-Sosa, A. Lubarski, K. M. Teeluck, E. S. Hall, E. Garfunkel, M. Greenblatt and G. C. Dismukes, Selective CO2 reduction to C3 and C4 oxyhydrocarbons on nickel phosphides at overpotentials as low as 10 mV, Energy Environ. Sci., 2018, 11(9), 2550–2559 RSC.
- P. De Luna, C. Hahn, D. Higgins, S. A. Jaffer, T. F. Jaramillo and E. H. Sargent, What would it take for renewably powered electrosynthesis to displace petrochemical processes?, Science, 2019, 364(6438), eaav3506 CrossRef CAS PubMed.
- W. Choi, D. H. Won and Y. J. Hwang, Catalyst design strategies for stable electrochemical CO2 reduction reaction, J. Mater. Chem. A, 2020, 8(31), 15341–15357 RSC.
- D. Gao, R. M. Arán-Ais, H. S. Jeon and B. Roldan Cuenya, Rational catalyst and electrolyte design for CO2 electroreduction towards multicarbon products. Nature, Catalysis, 2019, 2(3), 198–210 CAS.
- D. M. Weekes, D. A. Salvatore, A. Reyes, A. Huang and C. P. Berlinguette, Electrolytic CO2 Reduction in a Flow Cell, Acc. Chem. Res., 2018, 51(4), 910–918 CrossRef CAS PubMed.
- R. I. Masel, Z. Liu, H. Yang, J. J. Kaczur, D. Carrillo, S. Ren, D. Salvatore and C. P. Berlinguette, An industrial perspective on catalysts for low-temperature CO(2) electrolysis, Nat. Nanotechnol., 2021, 16(2), 118–128 CrossRef CAS PubMed.
- X.-M. Hu, H. H. Hval, E. T. Bjerglund, K. J. Dalgaard, M. R. Madsen, M.-M. Pohl, E. Welter, P. Lamagni, K. B. Buhl, M. Bremholm, M. Beller, S. U. Pedersen, T. Skrydstrup and K. Daasbjerg, Selective CO2 Reduction to CO in Water using Earth-Abundant Metal and Nitrogen-Doped Carbon Electrocatalysts, ACS Catal., 2018, 8(7), 6255–6264 CrossRef CAS.
- S. Hernández, M. Amin Farkhondehfal, F. Sastre, M. Makkee, G. Saracco and N. Russo, Syngas production from electrochemical reduction of CO2: current status and prospective implementation, Green Chem., 2017, 19(10), 2326–2346 RSC.
- W. Sheng, S. Kattel, S. Yao, B. Yan, Z. Liang, C. J. Hawxhurst, Q. Wu and J. G. Chen, Electrochemical reduction of CO2to synthesis gas with controlled CO/H2ratios, Energy Environ. Sci., 2017, 10(5), 1180–1185 RSC.
- X. Bai, W. Chen, C. Zhao, S. Li, Y. Song, R. Ge, W. Wei and Y. Sun, Exclusive Formation of Formic Acid from CO2 Electroreduction by a Tunable Pd-Sn Alloy, Angew. Chem., Int. Ed., 2017, 56(40), 12219–12223 CrossRef CAS PubMed.
- Y. X. Duan, Y. T. Zhou, Z. Yu, D. X. Liu, Z. Wen, J. M. Yan and Q. Jiang, Boosting Production of HCOOH from CO2 Electroreduction via Bi/CeOx, Angew. Chem., Int. Ed., 2021, 60(16), 8798–8802 CrossRef CAS PubMed.
- S. Liu, X. F. Lu, J. Xiao, X. Wang and X. W. D. Lou, Bi2 O3 Nanosheets Grown on Multi-Channel Carbon Matrix to Catalyze Efficient CO2 Electroreduction to HCOOH, Angew. Chem., Int. Ed., 2019, 58(39), 13828–13833 CrossRef CAS PubMed.
- P. Lu, X. Tan, H. Zhao, Q. Xiang, K. Liu, X. Zhao, X. Yin, X. Li, X. Hai, S. Xi, A. T. S. Wee, S. J. Pennycook, X. Yu, M. Yuan, J. Wu, G. Zhang, S. C. Smith and Z. Yin, Atomically Dispersed Indium Sites for Selective CO2 Electroreduction to Formic Acid, ACS Nano, 2021, 15(3), 5671–5678 CrossRef CAS PubMed.
- Y. Xing, X. Kong, X. Guo, Y. Liu, Q. Li, Y. Zhang, Y. Sheng, X. Yang, Z. Geng and J. Zeng, Bi@Sn Core-Shell Structure with Compressive Strain Boosts the Electroreduction of CO2 into Formic Acid, Adv. Sci., 2020, 7(22), 1902989 CrossRef CAS PubMed.
- K. Fernández-Caso, G. Díaz-Sainz, M. Alvarez-Guerra and A. Irabien, Electroreduction of CO2: Advances in the Continuous Production of Formic Acid and Formate, ACS Energy Lett., 2023, 8(4), 1992–2024 CrossRef.
- J. T. Feaster, C. Shi, E. R. Cave, T. Hatsukade, D. N. Abram, K. P. Kuhl, C. Hahn, J. K. Nørskov and T. F. Jaramillo, Understanding Selectivity for the Electrochemical Reduction of Carbon Dioxide to Formic Acid and Carbon Monoxide on Metal Electrodes, ACS Catal., 2017, 7(7), 4822–4827 CrossRef CAS.
- E. Ruiz-López, J. Gandara-Loe, F. Baena-Moreno, T. R. Reina and J. A. Odriozola, Electrocatalytic CO2 conversion to C2 products: Catalysts design, market perspectives and techno-economic aspects, Renewable Sustainable Energy Rev., 2022, 161 Search PubMed.
- J. Yu, J. Wang, Y. Ma, J. Zhou, Y. Wang, P. Lu, J. Yin, R. Ye, Z. Zhu and Z. Fan, Recent Progresses in Electrochemical Carbon Dioxide Reduction on Copper-Based Catalysts toward Multicarbon Products, Adv. Funct. Mater., 2021, 31(37), 2102151 CrossRef CAS.
- Y. C. Li, Z. Wang, T. Yuan, D. H. Nam, M. Luo, J. Wicks, B. Chen, J. Li, F. Li, F. P. G. de Arquer, Y. Wang, C. T. Dinh, O. Voznyy, D. Sinton and E. H. Sargent, Binding Site Diversity Promotes CO2 Electroreduction to Ethanol, J. Am. Chem. Soc., 2019, 141(21), 8584–8591 CrossRef CAS PubMed.
- H. S. Jeon, S. Kunze, F. Scholten and B. Roldan Cuenya, Prism-Shaped Cu Nanocatalysts for Electrochemical CO2 Reduction to Ethylene, ACS Catal., 2017, 8(1), 531–535 CrossRef.
- C. Peng, G. Luo, J. Zhang, M. Chen, Z. Wang, T. K. Sham, L. Zhang, Y. Li and G. Zheng, Double sulfur vacancies by lithium tuning enhance CO2 electroreduction to n-propanol, Nat. Commun., 2021, 12(1), 1580 CrossRef CAS PubMed.
- D. Gao, I. Sinev, F. Scholten, R. M. Aran-Ais, N. J. Divins, K. Kvashnina, J. Timoshenko and B. Roldan Cuenya, Selective CO2 Electroreduction to Ethylene and Multicarbon Alcohols via Electrolyte-Driven Nanostructuring, Angew. Chem., Int. Ed., 2019, 58(47), 17047–17053 CrossRef CAS PubMed.
- P. Gao, S. Li, X. Bu, S. Dang, Z. Liu, H. Wang, L. Zhong, M. Qiu, C. Yang, J. Cai, W. Wei and Y. Sun, Direct conversion of CO2 into liquid fuels with high selectivity over a bifunctional catalyst, Nat. Chem., 2017, 9(10), 1019–1024 CrossRef CAS PubMed.
- N.-T. Suen, Z.-R. Kong, C.-S. Hsu, H.-C. Chen, C.-W. Tung, Y.-R. Lu, C.-L. Dong, C.-C. Shen, J.-C. Chung and H. M. Chen, Morphology Manipulation of Copper Nanocrystals and Product Selectivity in the Electrocatalytic Reduction of Carbon Dioxide, ACS Catal., 2019, 9(6), 5217–5222 CrossRef CAS.
- Y. Zhou, F. Che, M. Liu, C. Zou, Z. Liang, P. De Luna, H. Yuan, J. Li, Z. Wang, H. Xie, H. Li, P. Chen, E. Bladt, R. Quintero-Bermudez, T. K. Sham, S. Bals, J. Hofkens, D. Sinton, G. Chen and E. H. Sargent, Dopant-induced electron localization drives CO2 reduction to C2 hydrocarbons, Nat. Chem., 2018, 10(9), 974–980 CrossRef CAS PubMed.
- Y. Guo, Q. Wang, M. Wang, M. Shen, L. Zhang and J. Shi, FeP modified polymeric carbon nitride as a noble-metal-free photocatalyst for efficient CO2 reduction, Catal. Commun., 2021, 156 Search PubMed.
- K. U. D. Calvinho, A. W. Alherz, K. M. K. Yap, A. B. Laursen, S. Hwang, Z. J. L. Bare, Z. Clifford, C. B. Musgrave and G. C. Dismukes, Surface Hydrides on Fe2P Electrocatalyst Reduce CO2 at Low Overpotential: Steering Selectivity to Ethylene Glycol, J. Am. Chem. Soc., 2021, 143(50), 21275–21285 CrossRef CAS PubMed.
- C. A. Downes, N. J. Libretto, A. E. Harman-Ware, R. M. Happs, D. A. Ruddy, F. G. Baddour, J. R. Ferrell Iii, S. E. Habas and J. A. Schaidle, Electrocatalytic CO2 Reduction over Cu3P Nanoparticles Generated via a Molecular Precursor Route, ACS Appl. Energy Mater., 2020, 3(11), 10435–10446 CrossRef CAS.
- A. B. Laursen, K. U. D. Calvinho, T. A. Goetjen, K. M. K. Yap, S. Hwang, H. Yang, E. Garfunkel and G. C. Dismukes, CO2 electro-reduction on Cu3P: Role of Cu(I) oxidation state and surface facet structure in C1-formate production and H2 selectivity, Electrochim. Acta, 2021, 391 Search PubMed.
- Y. Hori and S. Suzuki, Electrolytic Reduction of Carbon Dioxide at Mercury Electrode in Aqueous Solution, Bull. Chem. Soc. Jpn., 1982, 55(3), 660–665 CrossRef CAS.
- M. C. O. Monteiro, F. Dattila, N. Lopez and M. T. M. Koper, The Role of Cation Acidity on the Competition between Hydrogen Evolution and CO2 Reduction on Gold Electrodes, J. Am. Chem. Soc., 2022, 144(4), 1589–1602 CrossRef CAS PubMed.
- S. Chen, B. Wang, J. Zhu, L. Wang, H. Ou, Z. Zhang, X. Liang, L. Zheng, L. Zhou, Y. Q. Su, D. Wang and Y. Li, Lewis Acid Site-Promoted Single-Atomic Cu Catalyzes Electrochemical CO2 Methanation, Nano Lett., 2021, 21(17), 7325–7331 CrossRef CAS PubMed.
- W. Guo, S. Liu, X. Tan, R. Wu, X. Yan, C. Chen, Q. Zhu, L. Zheng, J. Ma, J. Zhang, Y. Huang, X. Sun and B. Han, Highly Efficient CO2 Electroreduction to Methanol through Atomically Dispersed Sn Coupled with Defective CuO Catalysts, Angew. Chem., Int. Ed., 2021, 60(40), 21979–21987 CrossRef CAS PubMed.
- M. Dhiman, Y. Chen, Y. Li, A. B. Laursen, K. U. D. Calvinho, T. G. Deutsch and G. C. Dismukes, Enabling technologies for the continuous electrically driven conversion of CO2 and water to multi-carbon products at high current densities, J. Mater. Chem. A, 2023, 11(2), 717–725 RSC.
- R. B. Wexler, J. M. P. Martirez and A. M. Rappe, Active Role of Phosphorus in the Hydrogen Evolving Activity of Nickel Phosphide (0001) Surfaces. ACS, Catalysis, 2017, 7(11), 7718–7725 CAS.
- NIST X-ray Photoelectron Spectroscopy (XPS) Database. (accessed March 2nd).
- B. Elsener, D. Atzei, A. Krolikowski and A. Rossi, Effect of phosphorus concentration on the electronic structure of nanocrystalline electrodeposited Ni–P alloys: an XPS and XAES investigation, Surf. Interface Anal., 2008, 40(5), 919–926 CrossRef CAS.
- C. Fletcher, Y. Jiang and R. Amal, Production of formic acid from CO2 reduction by means of potassium borohydride at ambient conditions, Chem. Eng. Sci., 2015, 137, 301–307 CrossRef CAS.
- M. Bishop, N. Shahid, J. Yang and A. R. Barron, Determination of the mode and efficacy of the cross-linking of guar by borate using MAS 11B NMR of borate cross-linked guar in combination with solution 11B NMR of model systems, Dalton Trans., 2004, 2621 RSC.
- M. D. Jankowski, C. S. Henry, L. J. Broadbelt and V. Hatzimanikatis, Group contribution method for thermodynamic analysis of complex metabolic networks, Biophys. J., 2008, 95(3), 1487 CrossRef CAS PubMed.
- M. L. Mavrovouniotis, Estimation of standard Gibbs energy changes of biotransformations, J. Biol. Chem., 1991, 266(22), 14440–14445 CrossRef CAS PubMed.
- J. Kua, M. M. Galloway, K. D. Millage, J. E. Avila and D. O. De Haan, Glycolaldehyde monomer and oligomer equilibria in aqueous solution: comparing computational chemistry and NMR data, J. Phys. Chem. A, 2013, 117(14), 2997–3008 CrossRef CAS PubMed.
- P.-B. F. Bouchoux G and W. Bertrand, Structure, Thermochemistry and Reactivity of Protonated Glycolaldehyde, Eur. J. Mass Spectrom., 2001, 7(4–5), 351–357 CrossRef.
Footnote |
| † Electronic supplementary information (ESI) available. See DOI: https://doi.org/10.1039/d3ey00237c |
| This journal is © The Royal Society of Chemistry 2024 |