 Open Access Article
Creative Commons Attribution 3.0 Unported Licence
Correction: Preferred planar crystal growth and uniform solid electrolyte interfaces enabled by anion receptors for stable aqueous Zn batteries
Xinyu
Wang
ab,
Yiran
Ying
c,
Xiaomin
Li
a,
Shengmei
Chen
*d,
Guowei
Gao
a,
Haitao
Huang
*c and
Longtao
Ma
*b
aFrontiers Science Center for Flexible Electronics, Institute of Flexible Electronics, Northwestern Polytechnical University, Xi’an, 710072, P. R. China
bSchool of Materials Science and Engineering, Guangdong Provincial Key Laboratory of Advanced Energy Storage Materials, South China University of Technology, Guangzhou 510641, P. R. China. E-mail: longtaoma@scut.edu.cn
cDepartment of Applied Physics and Research Institute for Smart Energy, The Hong Kong Polytechnic University, Hung Hom, Kowloon, Hong Kong 999077, P. R. China. E-mail: aphhuang@polyu.edu.hk
dDepartment of Materials Science and Engineering, City University of Hong Kong, 83 Tat Chee Avenue, Kowloon, Hong Kong 999077, P. R. China. E-mail: shechen5-c@my.cityu.edu.hk
First published on 23rd April 2024
Abstract
Correction for ‘Preferred planar crystal growth and uniform solid electrolyte interfaces enabled by anion receptors for stable aqueous Zn batteries’ by Xinyu Wang et al., Energy Environ. Sci., 2023, 16, 4572–4583, https://doi.org/10.1039/D3EE01580G.
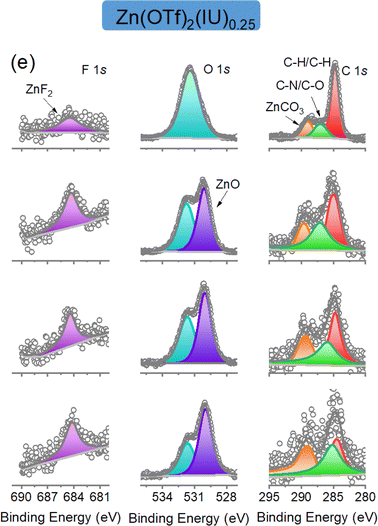
The authors regret that the F1s spectra of Fig. 4e in the original manuscript should be revised. They mistakenly used an incorrect XPS diagram in Fig. 4e regarding the etching of F 1s 2 min, 4 min, 8 min in the original manuscript. The “F 1s 2 min, 4 min, 8 min of Zn(BF4)2(IU)0.25 samples” (Fig. 4f) was mistakenly repeated for the “F 1s 2 min, 4 min, 8 min of Zn(OTf)2(IU)0.25 data” (Fig. 4e) when all the figures were combined into Fig. 4. To rectify this error, the authors have prepared the correct version of Fig. 4e, provided here.
The figure of F 1s in Fig. 4e is intended to demonstrate that the F 1s spectra can be deconvoluted with one peak, which is assigned to the Zn–F species (684.5 eV). Thus, the ZnF2 is selected as the representative for the inorganic component, which is the same as the previous data analysis. The authors would like to emphasize that it does not impact the overall conclusions drawn in the article.
The Royal Society of Chemistry apologises for these errors and any consequent inconvenience to authors and readers.
| This journal is © The Royal Society of Chemistry 2024 |

