
 Open Access Article
 This Open Access Article is licensed under a Creative Commons Attribution-Non Commercial 3.0 Unported Licence
Characterization of atmospheric microplastics in Hangzhou, a megacity of the Yangtze river delta, China†
Liang
Xu
ab,
Jiefeng
Li
b,
Shushen
Yang
c,
Zhenyang
Li
c,
Yan
Liu
b,
Yifan
Zhao
d,
Dantong
Liu
b,
Admir Créso
Targino
e,
Zhonghua
Zheng
 f,
Mingzhou
Yu
a,
Peng
Xu
a,
Yele
Sun
g and
Weijun
Li
*bg
f,
Mingzhou
Yu
a,
Peng
Xu
a,
Yele
Sun
g and
Weijun
Li
*bg
aCollege of Sciences, China Jiliang University, Hangzhou 310018, China
bDepartment of Atmospheric Sciences, School of Earth Sciences, Zhejiang University, Hangzhou 310027, China. E-mail: liweijun@zju.edu.cn
cSchool of Energy & Environment, Zhongyuan University of Technology, Zhengzhou 450000, China
dDepartment of Chemistry, Zhejiang University, Hangzhou 310027, China
eDepartment of Physics, Federal University of Technology, Londrina, Brazil
fDepartment of Earth and Environmental Sciences, The University of Manchester, Manchester, UK
gState Key Laboratory of Atmospheric Boundary Layer Physics and Atmospheric Chemistry, Institute of Atmospheric Physics, Chinese Academy of Sciences, Beijing 100029, China
First published on 23rd August 2024
Abstract
Microplastics (MPs) have become a key environmental issue over the last few decades. However, while previous studies have mainly focused on aquatic MP pollution, research on atmospheric MPs remains limited. To expand our knowledge of atmospheric MPs, we collected atmospheric samples using active and dry deposition techniques during one year in an urban environment in the megacity of Hangzhou, China. MPs were identified in the samples using a range of analytical and optical techniques. The concentrations of MPs on the filters collected using active sampling ranged from 0.37–8.9 particles per m3, with an annual mean of 3.2 ± 0.5 particles per m3. The dry deposition rate of atmospheric MPs ranged from 441.18–3181.8 particles per m2 per day, with an annual mean of 1387.8 ± 237.7 particles per m2 per day. Fiber MPs were the most predominant type while a few film-type MPs were identified. Raman microspectrometer analysis identified that tires (27.0% of MPs) and polyethylene terephthalate (PET, 19.7% of MPs) were the dominant MP types. Finally, we estimated that the annual dry deposition rate of MPs in the Hangzhou urban area was 16.9 ± 2.9 tons. Exploring the abundance and deposition of MPs helps to evaluate their potential threat to human health or aquatic ecology, which finally contributes to development of MP control measures.
Environmental significanceThe presence of microplastics in the atmosphere is a concerning issue as it has implications for human exposure and ecological consequences. Atmospheric microplastic samples were collected using active sampling and dry deposition techniques during one year in an urban environment of the megacity Hangzhou. Our study combines observation of suspended and deposited atmospheric microplastics to provide a comprehensive dataset and in-depth insights into microplastics in an urban atmosphere. The results will contribute to the understanding of the composition, morphology, abundance, and distribution of microplastics in urban atmospheres. |
1 Introduction
Synthetic plastic materials are widely used in our daily lives, spanning across various sectors, such as textiles, construction, agriculture, and household applications. It has been estimated that, without immediate intervention, plastic waste entering the world's aquatic ecosystems could reach 90 metric tons per year by 2030.1 Microplastics (MPs), defined as plastic fragments and fibers between 1 and 5000 μm in diameter,2,3 have received global attention since their recognition in the marine environment in 2004. Primary MPs are directly produced in millimeter size for cosmetics or as vectors for drugs, while secondary MPs are obtained from the breakdown of larger plastic debris.4MPs can pose potential risk to both human health and ecosystems due to their toxicity.5 It is reported that MP exposure via inhalation and ingestion may induce MP accumulation and further exert localized particle toxicity.6 As MPs absorb toxic substances from the environment, they can serve as vectors for the transfer of harmful substances to different species and ecosystems, amplifying the overall toxicity in the environment.4,7 Furthermore, MPs could be ingested by aquatic8,9 and terrestrial organisms,10 causing greater harm to ecosystems throughout predation in the food chain. Due to their small size and low density, MPs can be transported by wind and affect remote areas,11–13 posing threat to ecosystems.
Previous studies mostly focused on aquatic MP pollution, while the number of studies on atmospheric MPs is still limited.14–16 Dris et al.17 for the first time investigated the MPs in total atmospheric fallout (wet and dry deposition) in Paris and suggested that atmospheric fallout could be a significant source of MPs in freshwater. Since then, they conducted a series of follow-up experiments to investigate the atmospheric fallout of MPs at urban and sub-urban sites14 and fibers in indoor and outdoor air.18 MPs in atmospheric deposition were also reported around the world, including urban districts in Iran,19 metropolitan areas in Germany,20 Australia,21 Arctic snow,22 the Tibetan Plateau,23,24 the remote U.S. conservation areas,25 and the Pyrenees Mountains.26
Studies on atmospheric MPs are blooming in China since Cai et al.15 first studied the characteristic of MPs in the atmospheric fallout in Dongguan city. A systematic study on the potential sources and spatial distribution of suspended airborne MPs was conducted in Shanghai — a megacity located in the Yangtze River Delta (YRD).27 Currently, MPs have been identified and sourced in different areas in China, including densely populated urban areas,28–30 the South China Sea,31 the Tibetan Plateau,23,24 and the Badain Jaran Desert.32
However, studies combining active sampling and dry deposition to assess the abundance and impact of atmospheric MPs are still limited. In this study, a year-long in situ campaign of atmospheric MPs was carried out in Hangzhou — one of the most economically developed cities in the YRD. Our hypothesis is that the high population density in Hangzhou contributes to significant emissions of atmospheric MPs, while the well-developed river system facilitates the deposition of more atmospheric MPs into aquatic ecosystems. Therefore, Hangzhou serves as an ideal representative for studying atmospheric MPs and their deposition. Long-term atmospheric MP observation is important to explore the effects of seasonality on MP concentrations and flux. The goal of this study was to establish baseline data on MP composition, morphology, and abundance, which can be used to streamline future measures to control atmospheric MPs. The data can also be employed as input for modeling atmospheric MPs. Also, it can be used in inverse modeling for estimation of the atmospheric budget of microplastics as well as a spatial distribution of their emissions.
2 Experimental
2.1. Sampling site and sample collection
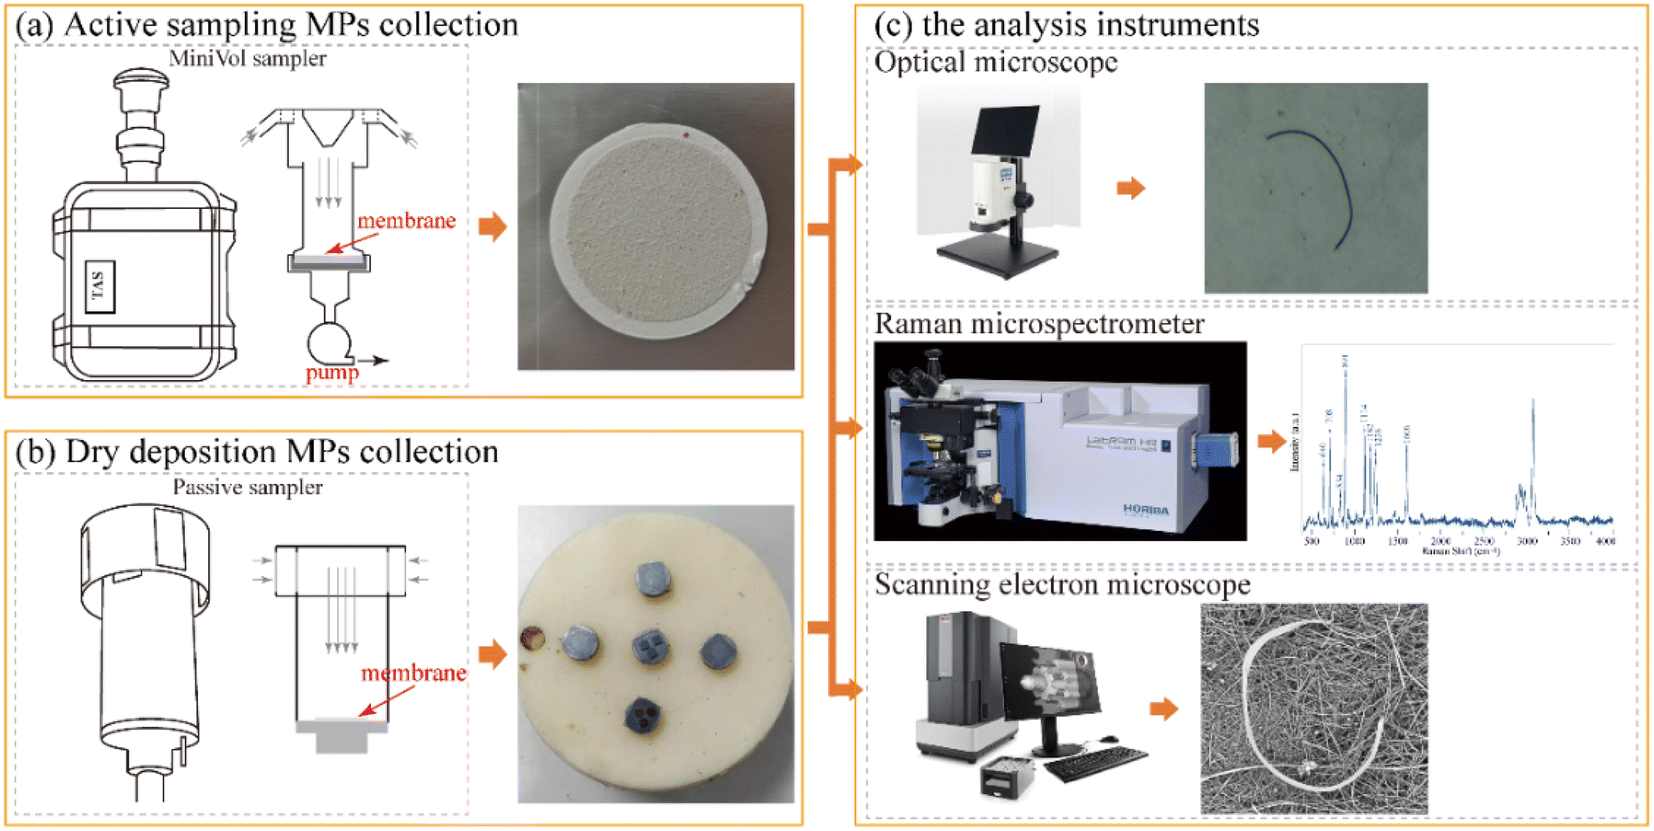
Hangzhou is the capital of Zhejiang Province and the second largest city of the YRD (10.36 million inhabitants), with an urban population density of 1034 person per km2.33 The anthropogenic activities from dense population, such as the use of synthetic textiles and personal care products and tire wear could lead to intensive production and emissions of MPs. Hangzhou belongs to subtropical monsoon climate, with hot and humid summers and cold and drier winters (with occasional snow). The mean annual air temperature is 17.8 °C, the mean relative humidity is (70.3%), and the mean annual cumulative rainfall is 1454 mm, with the largest precipitation rates in June, July and August.MP samples were collected from November 2019 to November 2020 using an active sampler (Minivol, AirMetrics, USA) and a passive sampler deployed on the roof (15 m above the ground) of a building on the Zijingang Campus of Zhejiang University, Hangzhou (30.30°N, 120.10°E, Fig. 1). The site is situated in the urban area of Hangzhou, devoid of nearby industrial and construction activities. Consequently, residential activities and traffic are presumed to be the main emission source for air pollution.
 | ||
| Fig. 1 (a) Location of Hangzhou in the Yangtze River Delta. (b) Sampling site in the Zijingang Campus of Zhejiang University. The base map was obtained from Google Earth. | ||
The Minivol operated at a flow rate of 5 L min−1 and used a quartz filter membrane with a diameter of 47 mm onto which particles were deposited. The sampling time varied from 3.6–11.7 h (Table S1†) depending on the weather conditions. In this study, a total of 24 active sampling MP samples were collected, distributed as follows: six samples in the spring (March to May), four samples in the autumn (September to November), and 14 samples in the winter (December to February). Intensified sample collection was carried out in winter due to potential high MP concentration in winter.29 Due to heavy precipitation in summer time, no active MP samples were collected in this season.
The passive sampler consists of transparent adhesive collection plates housed within a metal structure designed to maintain a wind-sheltered, low-turbulence internal environment, shielding the collected particles from direct radiation, wind, and precipitation.34,35 Samples were collected on three adhesive collection plates, each with an effective area of 1 cm2 (Fig. 2). The collection of atmospheric deposition samples requires a long time. Therefore, the collection time was around one month to ensure sufficient MP collection (Table S2†). We collected a total of 12 MP samples, distributed as follows: two samples in the spring (March to May), three samples in the summer (June to August), three samples in the autumn (September to November), and four samples in the winter (December to February).
 | ||
| Fig. 2 Diagrams illustrating the sampling apparatus for (a) active sampling and (b) passive sampling. (c) Diagrams outlining the analysis protocol utilized in this study. | ||
To avoid contamination, the MP samples were placed in clean glass cassettes immediately after each sampling period and stored in a desiccator at 25 ± 1 °C and 20 ± 3% relative humidity (RH) for further analyses.
It should be noted that following the outbreak of the COVID-19 epidemic in January 2020, the implementation of prevention and control measures significantly reduced traffic on roads and restricted human activities. These measures could potentially impact the emission of MPs.
2.2. MP analyses
The MP analyses started by direct inspection of the whole filters using a digital optical microscope (SOPTOP DMSZ7, Ningbo Sunny Instruments Co., Ltd, China) equipped with a CCD camera (Fig. 2). All the suspected MPs were identified and photographed based on the criteria by Hidalgo-Ruz et al.:36 no visible biological structures, the thickness of the fibers should be equal, and the colors should be clear and uniform. Fiber MPs are defined as having a length-to-diameter ratio greater than three.37,38 After visual inspection, all suspected MPs in each sample were included for MP counting, dimension measurement, and color identification. The chemical compositions of MPs were identified by acquiring spectra using a Raman microspectrometer (μ-Raman) (LabRAM HR Evolution, HORIBA JOBIN YVON, France), equipped with a ×50 Olympus objective (Fig. 2). μ-Raman spectra were collected in the range of 400 to 3500 cm−1 with a spectral resolution of 2 cm−1, using a laser beam of 532 nm with an estimated spot diameter of 1 μm. To prevent damage to the MPs from excessive laser intensity, the laser power was attenuated to below 50% using a set of laser intensity filters. Fluorescence interference is a common issue in using a Raman spectrometer. The confocal pinhole's diameter and the diffraction grating's groove density were adjusted to prevent fluorescence interference in Raman measurements. A single-crystal silicon wafer was used as a reference at 520.7 cm−1. The acquired spectra were compared to library spectra in order to identify the chemical composition of the MPs.A scanning electron microscope coupled with an energy-dispersive X-ray spectrometer (SEM-EDS, Phenom XL, ThermoFisher Scientific, Netherland) was applied to obtain high-resolution images of the surface characteristics of MPs and their elemental composition. The samples were coated with gold before SEM analysis. The system could identify MPs larger than 100 nm, with a magnification up to 100![[thin space (1/6-em)]](https://www.rsc.org/images/entities/char_2009.gif) 000 times (Fig. 2). The SEM observation was conducted with a secondary electron (SE) detector (acceleration voltage: 5 kV) and backscattered electron (BSE) detector (acceleration voltage: 15 kV). Each suspected MP on the three collection plates was examined using SEM-EDS, acquiring its size, surface characteristics, and elemental composition.
000 times (Fig. 2). The SEM observation was conducted with a secondary electron (SE) detector (acceleration voltage: 5 kV) and backscattered electron (BSE) detector (acceleration voltage: 15 kV). Each suspected MP on the three collection plates was examined using SEM-EDS, acquiring its size, surface characteristics, and elemental composition.
2.3. Quality assurance
Various precautions were used to minimize potential external contaminations according to ref. 27. Prior to sample collection, all quartz filters were enveloped with aluminum foil and combusted at 600 °C for 3 h in a muffle furnace. All tools and sample cassettes were washed three times using Milli-Q water (resistivity: 18.2 MΩ cm, 25 °C). During sample collection and further laboratory analyses, 100% cotton laboratory coats, face masks, and nitrile gloves were obligatory for experimenters. During visual and μ-Raman observation, the samples were covered with a home-made lid all the time to avoid fallouts in the laboratory. The operators were required to control unnecessary movement in the laboratory for minimizing MP resuspension.In addition, field blank samples were collected during filter placing and the retrieval process to examine the potential contamination. Similarly blank samples were collected during laboratory visual and μ-Raman inspection. No external MP contamination was detected in field and laboratory blanks, proving the effectiveness of our precautions to control external contamination.
2.4. Ancillary data
Monthly mean meteorological data were obtained from observations collected at the Mantou mountain reference weather station (WMO 584570, 30.23° N, 120.17° E) in Hangzhou. Historical monthly temperature, relative humidity, precipitation, wind speed, and visibility are presented in Table S3.†3 Results and discussion
3.1. Morphology, color, and size of atmospheric MPs
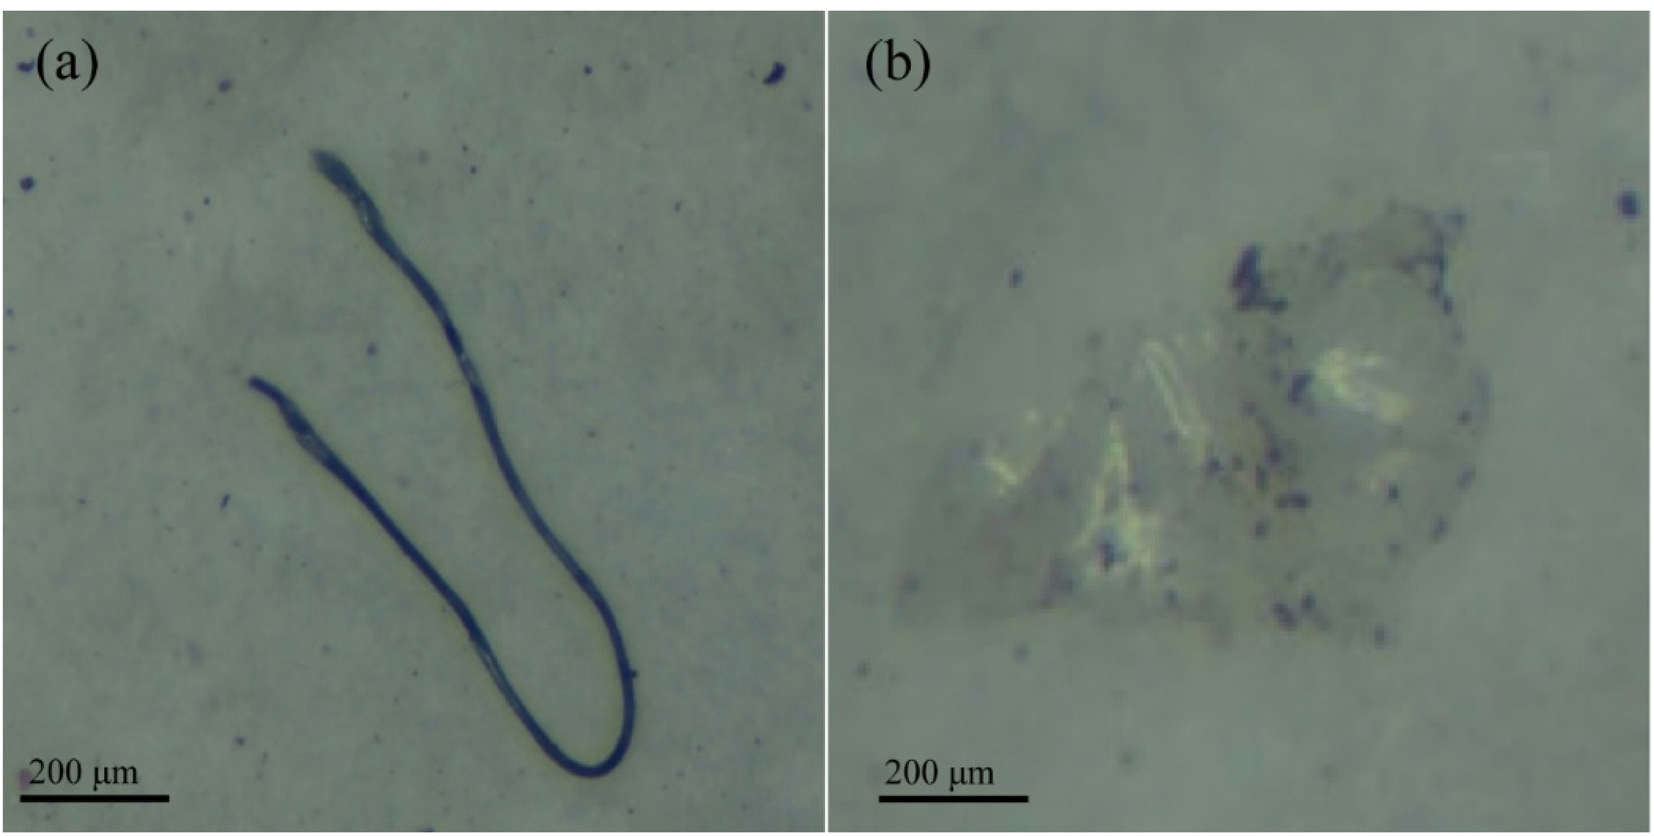 | ||
| Fig. 3 Samples of MPs in the atmosphere: (a) fibers; (b) films. | ||
SEM analyses revealed three morphologies of fibrous MPs: smooth, flattened, and twisted (Fig. S1a–c†). Morphological variations suggest that MPs undergo physical and chemical degradation in the atmosphere.16 The twisted morphology indicates the physical degradation of atmospheric MPs, possibly due to the formation of wind-erosion textures during atmospheric transport. Moreover, chemical degradation (e.g., photo, thermal, or biological degradation) during collisions, jumps, and stress corrosion could alter MP morphology.39,40 The increased specific surface areas of degraded MP particles enhance their ability to adsorb heavy metals and pollutants from the atmosphere, making them carriers of harmful substances.41,42
 | ||
| Fig. 4 Length distribution of atmospheric MPs: (a) length of MPs collected using active sampling; (b) length of MPs collected using passing sampling; (c) distribution of MPs diameter. | ||
In the dry deposition samples, the MP length ranged from 32.41 μm to 2290.14 μm, with a mean length of 447.52 ± 24.04 μm. As shown in Fig. 4b, MPs with lengths between 100–500 μm accounted for over two-thirds (68.5%) of all observed MPs, with those between 200–300 μm being the most abundant at 21.2%, followed by those with lengths of 100–200 μm at 17.4%. The trend of length variation of dry deposition MPs is consistent with that observed through active sampling, and the fraction of MPs decreased as their length increases.
In previous studies, investigations into the diameter of fibrous MPs have been limited.16,43 Our results found a slight difference in diameter between MPs collected through atmospheric deposition and those from active sampling. Therefore, the data from both sources were combined for analysis. The MP diameter ranged between 1.19 and 34.87 μm, with an overall mean diameter of 11.17 ± 0.35 μm. As shown in Fig. 4c, the majority of MPs exhibited a diameter within the range of 6–12 μm, accounting for approximately 60% of the total MPs. Among these particles, those with a diameter between 8–10 μm were found to be most prevalent (22.1%), followed by MPs with diameters ranging from 10–12 μm (21.1%). Overall, as the diameter increases, the proportion of MPs also increases until it reaches a peak at 8–10 μm. Beyond this range, the proportion decreases as the diameter continues to increase.
3.2. Polymer identification of atmospheric MPs
After comparing with the μ-Raman standard spectral library and reference literature,11,44 11 types of polymers were identified in this study (Fig. 5): polyamide (PA), polycarbonate (PC), polyethylene (PE), polyethylene oxide (PEO), polyethersulfone (PES), polyethylene terephthalate (PET), polypropylene (PP), polystyrene (PS), polyvinyl chloride (PVC), polylactic acid (PLA), and tires (Fig. S3†). Tires accounted for the highest proportion (27.0%) and were considered to originate from the wear of cars or bicycles.45,46 The second most prevalent polymer type was PET, accounting for approximately 19.7%, followed by PC at approximately 10.5%. About 6% of the samples could not be identified due to the limitation of the standard library or because their main peak had shifted too far for manual identification.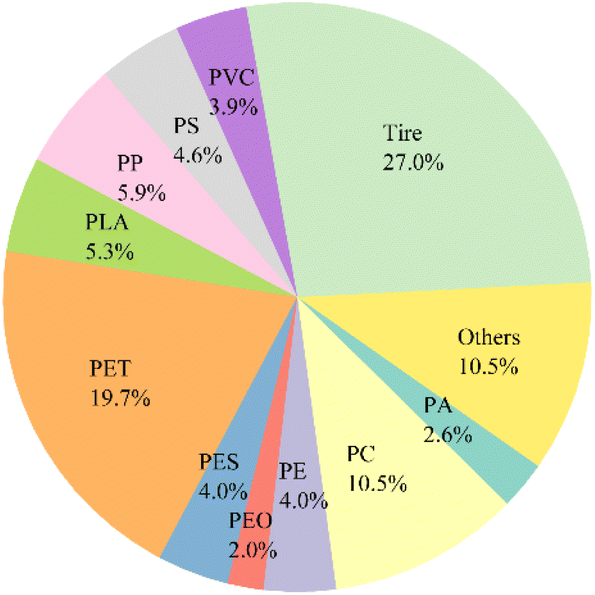 | ||
| Fig. 5 Number fraction of different polymer types of MPs. | ||
3.3. Seasonal abundance of atmospheric MPs
Fig. 6 shows the abundance of atmospheric MPs across different seasons in Hangzhou. The abundance of MPs in the active samples (Fig. 6a) ranged from 0.37–8.9 particles per m3, with an overall mean of 3.2 ± 0.5 particles per m3. The abundance of MPs in the dry deposition samples (Fig. 6b) ranged from 441.18–3181.8 particles per m2 per day, with an overall mean of 1387.8 ± 237.7 particles per m2 per day. All in all, atmospheric deposition of MPs was lower in the spring. The lowest concentration of MPs in the active samples was observed on April 15 during the spring season, which was only 0.37 particles per m3. The mean abundance in March was 2.6 ± 0.5 particles per m3, also lower than the overall mean value.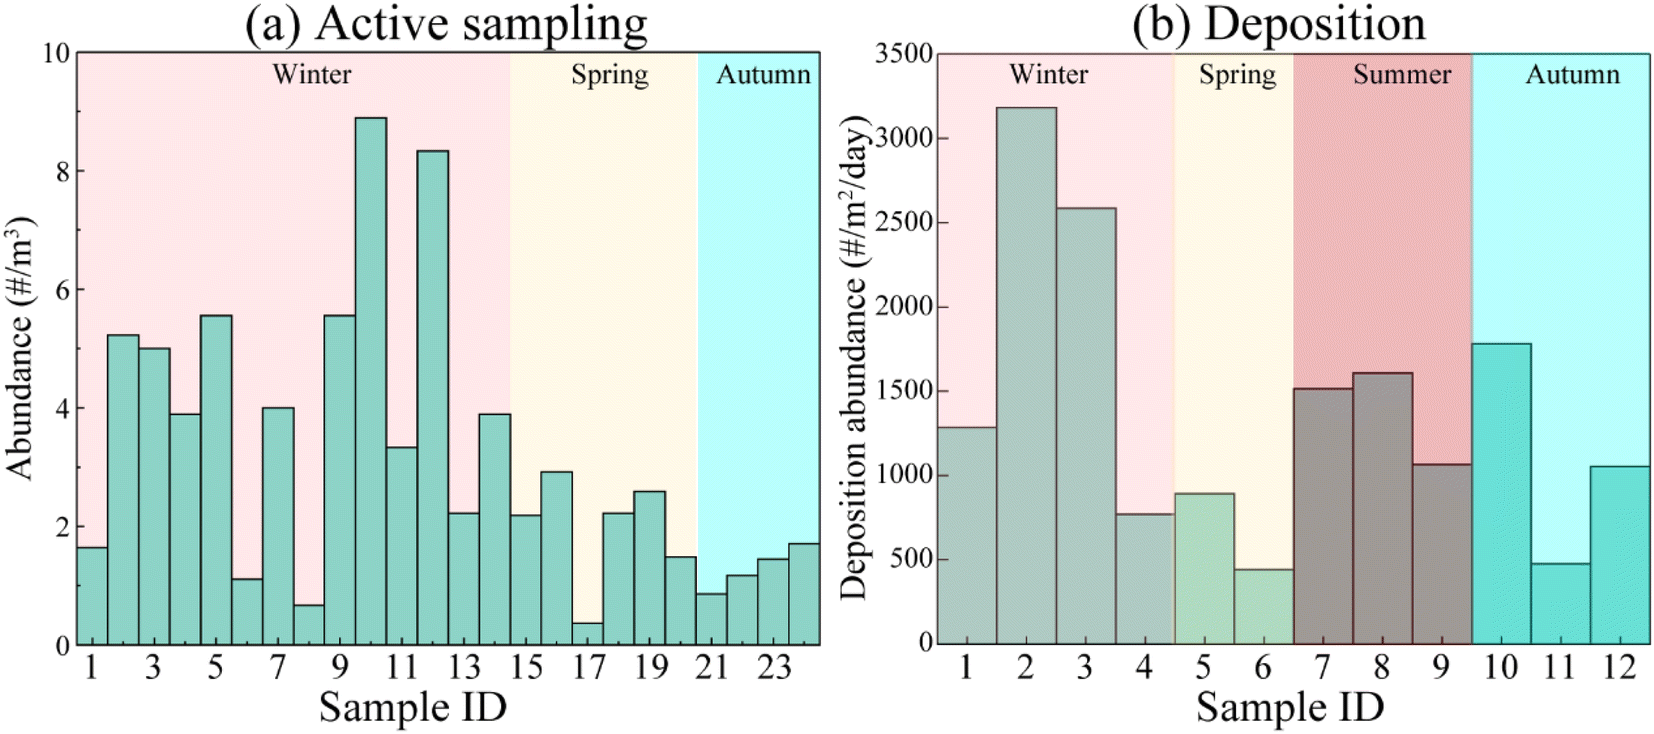 | ||
| Fig. 6 Abundance of atmospheric MPs in different seasons: (a) active sampling MPs, (b) deposition MPs. | ||
The concentrations of airborne MPs are affected not only by natural factors such as wind speed and direction, rainfall, and gravitational deposition, but also by regional population density, human activities, and degree of urbanization.47–49 April of 2020 was within the COVID-19 epidemic prevention and control period with minimal traffic flow on roads and limited human activities.50 Additionally, based on meteorological data (Table S3†), the mean wind speed in Hangzhou was 2.2 m s−1 in April. Variations in the wind direction and velocity affect the transport and dispersion of MPs in the atmosphere. Hence, these factors could explain why the MP concentration in April was the lowest of the year.
We calculated the annual deposition flux of MPs in the Hangzhou urban area based on the mean density of the main plastic polymers derived from the literature51,52 (Table S4†). Given that fibers were identified as the predominant form of MPs, a standard cylinder model was used to estimate their volume. With an urban area spanning 648 km2 (ref. 33) and a year consisting of 365 days, we estimated that approximately 16.9 ± 2.9 tons of MPs were deposited in Hangzhou annually.
Since there are limited studies documenting the annual deposition flux of MPs (as shown in Table 1), making direct comparisons with our estimated value for Hangzhou is challenging. Nevertheless, we managed to identify some relevant studies to contextualize our findings. However, we could identify some studies to put our results into perspective. The annual MP flux exceeds that observed in the Paris urban area,14 which ranged from 3–10 tons, and in the adjacent seas of Yantai,53 which ranged from 0.9–1.4 tons. The low flux in Paris and Yantai may be due to a lower contribution from primary anthropogenic sources and a greater influence from atmospheric transport. Previous studies have reported higher atmospheric deposition flux in urban areas compared to suburban areas,54 with values of 0.23 tons for Yantai, 1.0 ton for Tianjin, and 0.73 tons for Dalian. The result indicates that the level of atmospheric MP pollution in Hangzhou is elevated compared to other regions.
Exposure to MPs presents a potential threat to human health. Inhalation and ingestion are the major pathways of human exposure to MPs.55 In particular, inhalation of MPs poses health risks due to their ability to penetrate and accumulate in the lungs,56,57 where they can cause inflammation, oxidative stress, and cytotoxicity.58 In addition to the toxicity of MPs themselves, MPs can act as carriers for other toxins (e.g., Cr and Pb) and may lead to health problems beyond the digestive system.59,60 Therefore, further control measures should be considered to reduce atmospheric MP pollution in the future.
4 Conclusion
Atmospheric MP samples were collected over a one-year period in Hangzhou, the second largest city in the Yangtze River delta (YRD). A total of 24 MP samples collected using active sampling and 12 samples using dry deposition were analyzed in this study. Fibrous MPs were the predominant type, while only a few film-type MPs were observed. Atmospheric MPs were found in five colors: black, brown, red, transparent, and blue, with black as the most prevalent color (62.2%). The mean MP concentration was 3.2 ± 0.5 particles per m3 (range: 0.37–8.9 particles per m3) for the active samples, and 1387.8 ± 237.7 particles per m2 per day (441.2–3181.8 particles per m2 per day) for atmospheric deposition MPs. The active and deposition MP samples showed lower MP concentrations in the spring. Polymer analysis using a Raman microspectrometer showed that tires (27.0%) and polyethylene terephthalate (PET, 19.7%) were the dominant polymer types. The annual MP deposition flux in the Hangzhou urban area was estimated to be 16.9 ± 2.9 t. This current assessment indicates an elevated level of atmospheric MP deposition in Hangzhou compared to previous studies in other geographical locations. Given the complex behavior of atmospheric MPs and their potential risk to human health and ecological systems, more efforts should be made to evaluate and reduce atmospheric MP pollution in the future.Data availability
Data will be made available on request.Author contributions
Liang Xu: conceptualization, investigation, data curation, visualization, writing – original draft. Jiefeng Li: methodology, investigation, writing – review & editing. Shushen Yang: resources, writing – review & editing. Zhenyang Li: methodology, investigation, writing – review & editing. Yan Liu: methodology, writing – review & editing. Yifan Zhao: methodology, writing – review & editing. Dantong Liu: resources, writing – review & editing. Admir Créso Targino: resources, writing – review & editing. Zhonghua Zheng: resources, writing – review & editing. Mingzhou Yu: resources, writing – review & editing. Peng Xu: resources, writing – review & editing. Yele Sun: resources, writing – review & editing. Weijun Li: supervision, funding acquisition, resources, conceptualization, writing – review & editing.Conflicts of interest
The authors declare that they have no conflict of interest.Acknowledgements
This work was funded by the National Natural Science Foundation of China (42205095), the National Key Research and Development Program of China (2023YFC3706301), State Key Laboratory of Atmospheric Boundary Layer Physics and Atmospheric Chemistry (LAPC-KF-2023-03), and Joint Laboratory of Hangzhou Urban Meteorology (SYSYB202405).References
- S. B. Borrelle, J. Ringma, K. L. Law, C. C. Monnahan, L. Lebreton, A. McGivern, E. Murphy, J. Jambeck, G. H. Leonard, M. A. Hilleary, M. Eriksen, H. P. Possingham, H. De Frond, L. R. Gerber, B. Polidoro, A. Tahir, M. Bernard, N. Mallos, M. Barnes and C. M. Rochman, Predicted growth in plastic waste exceeds efforts to mitigate plastic pollution, Science, 2020, 369, 1515–1518 CrossRef CAS PubMed.
- R. C. Thompson, Y. Olsen, R. P. Mitchell, A. Davis, S. J. Rowland, A. W. G. John, D. McGonigle and A. E. Russell, Lost at Sea: Where Is All the Plastic?, Science, 2004, 304, 838 CrossRef CAS PubMed.
- C. Arthur, J. E. Baker and H. A. Bamford, Proceedings of the International Research Workshop on the Occurrence, Effects, and Fate of Microplastic Marine Debris, September 9-11, 2008, University of Washington Tacoma, Tacoma, WA, USA, 2009 Search PubMed.
- M. Cole, P. Lindeque, C. Halsband and T. S. Galloway, Microplastics as contaminants in the marine environment: A review, Mar. Pollut. Bull., 2011, 62, 2588–2597 CrossRef CAS PubMed.
- N. Rafa, B. Ahmed, F. Zohora, J. Bakya, S. Ahmed, S. F. Ahmed, M. Mofijur, A. A. Chowdhury and F. Almomani, Microplastics as carriers of toxic pollutants: Source, transport, and toxicological effects, Environ. Pollut., 2024, 343, 123190 CrossRef CAS PubMed.
- S. L. Wright and F. J. Kelly, Plastic and human health: A micro Issue?, Environ. Sci. Technol., 2017, 51, 6634–6647 CrossRef CAS PubMed.
- L. Zimmermann, Z. Bartosova, K. Braun, J. Oehlmann, C. Volker and M. Wagner, Plastic products leach chemicals that induce in vitro toxicity under realistic use conditions, Environ. Sci. Technol., 2021, 55, 11814–11823 CrossRef CAS PubMed.
- M. Cole, P. Lindeque, E. Fileman, C. Halsband, R. Goodhead, J. Moger and T. S. Galloway, Microplastic Ingestion by Zooplankton, Environ. Sci. Technol., 2013, 47, 6646–6655 CrossRef CAS PubMed.
- J. Li, X. Qu, L. Su, W. Zhang, D. Yang, P. Kolandhasamy, D. Li and H. Shi, Microplastics in mussels along the coastal waters of China, Environ. Pollut., 2016, 214, 177–184 CrossRef CAS PubMed.
- S. Zhao, L. Zhu and D. Li, Microscopic anthropogenic litter in terrestrial birds from Shanghai, China: Not only plastics but also natural fibers, Sci. Total Environ., 2016, 550, 1110–1115 CrossRef CAS PubMed.
- M. Trainic, J. M. Flores, I. Pinkas, M. L. Pedrotti, F. Lombard, G. Bourdin, G. Gorsky, E. Boss, Y. Rudich, A. Vardi and I. Koren, Airborne microplastic particles detected in the remote marine atmosphere, Commun. Earth Environ., 2020, 1, 64 CrossRef.
- X. Wang, C. Li, K. Liu, L. Zhu, Z. Song and D. Li, Atmospheric microplastic over the South China Sea and East Indian Ocean: abundance, distribution and source, J. Hazard. Mater., 2020, 389, 121846 CrossRef CAS PubMed.
- S. Fox, H. Stefánsson, M. Peternell, E. Zlotskiy, E. J. Ásbjörnsson, E. Sturkell, P. Wanner and M. Konrad-Schmolke, Physical characteristics of microplastic particles and potential for global atmospheric transport: A meta-analysis, Environ. Pollut., 2024, 342, 122938 CrossRef CAS PubMed.
- R. Dris, J. Gasperi, M. Saad, C. Mirande and B. Tassin, Synthetic fibers in atmospheric fallout: A source of microplastics in the environment?, Mar. Pollut. Bull., 2016, 104, 290–293 CrossRef CAS PubMed.
- L. Cai, J. Wang, J. Peng, Z. Tan, Z. Zhan, X. Tan and Q. Chen, Characteristic of microplastics in the atmospheric fallout from Dongguan city, China: preliminary research and first evidence, Environ. Sci. Pollut. Res., 2017, 24, 24928–24935 CrossRef PubMed.
- L. Shao, Y. Li, T. Jones, M. Santosh, P. Liu, M. Zhang, L. Xu, W. Li, J. Lu, C.-X. Yang, D. Zhang, X. Feng and K. BéruBé, Airborne microplastics: A review of current perspectives and environmental implications, J. Clean. Prod., 2022, 347, 131048 CrossRef CAS.
- R. Dris, J. Gasperi, V. Rocher, M. Saad, N. Renault and B. Tassin, Microplastic contamination in an urban area: a case study in Greater Paris, Environ. Chem., 2015, 12, 592–599 CrossRef CAS.
- R. Dris, J. Gasperi, C. Mirande, C. Mandin, M. Guerrouache, V. Langlois and B. Tassin, A first overview of textile fibers, including microplastics, in indoor and outdoor environments, Environ. Pollut., 2017, 221, 453–458 CrossRef CAS PubMed.
- S. Dehghani, F. Moore and R. Akhbarizadeh, Microplastic pollution in deposited urban dust, Tehran metropolis, Iran, Environ. Sci. Pollut. Res., 2017, 24, 20360–20371 CrossRef CAS PubMed.
- M. Klein and E. K. Fischer, Microplastic abundance in atmospheric deposition within the Metropolitan area of Hamburg, Germany, Sci. Total Environ., 2019, 685, 96–103 CrossRef CAS PubMed.
- K. Perera, S. Ziajahromi, S. B. Nash and F. D. L. Leusch, Microplastics in Australian indoor air: Abundance, characteristics, and implications for human exposure, Sci. Total Environ., 2023, 889, 164292 CrossRef CAS PubMed.
- M. Bergmann, S. Mützel, S. Primpke, M. B. Tekman, J. Trachsel and G. Gerdts, White and wonderful? Microplastics prevail in snow from the Alps to the Arctic, Sci. Adv., 2019, 5, eaax1157 CrossRef CAS PubMed.
- H. Dong, L. Wang, X. Wang, L. Xu, M. Chen, P. Gong and C. Wang, Microplastics in a remote lake basin of the Tibetan Plateau: Impacts of atmospheric transport and glacial melting, Environ. Sci. Technol., 2021, 55, 12951–12960 CAS.
- Y. Zhang, T. Gao, S. Kang, S. Allen, X. Luo and D. Allen, Microplastics in glaciers of the Tibetan Plateau: Evidence for the long-range transport of microplastics, Sci. Total Environ., 2021, 758, 143634 CrossRef CAS PubMed.
- J. Brahney, M. Hallerud, E. Heim, M. Hahnenberger and S. Sukumaran, Plastic rain in protected areas of the United States, Science, 2020, 368, 1257 CrossRef CAS PubMed.
- S. Allen, D. Allen, V. R. Phoenix, G. Le Roux, P. Durántez Jiménez, A. Simonneau, S. Binet and D. Galop, Atmospheric transport and deposition of microplastics in a remote mountain catchment, Nat. Geosci., 2019, 12, 339–344 CrossRef CAS.
- K. Liu, X. Wang, T. Fang, P. Xu, L. Zhu and D. Li, Source and potential risk assessment of suspended atmospheric microplastics in Shanghai, Sci. Total Environ., 2019, 675, 462–471 CrossRef CAS PubMed.
- Y. Li, L. Shao, W. Wang, M. Zhang, X. Feng, W. Li and D. Zhang, Airborne fiber particles: Types, size and concentration observed in Beijing, Sci. Total Environ., 2020, 705, 135967 CrossRef CAS PubMed.
- Y. Huang, T. He, M. Yan, L. Yang, H. Gong, W. Wang, X. Qing and J. Wang, Atmospheric transport and deposition of microplastics in a subtropical urban environment, J. Hazard. Mater., 2021, 416, 126168 CrossRef CAS PubMed.
- J. Zhu, A. Xu, M. Shi, Y. Su, W. Liu, Y. Zhang, Z. She, X. Xing and S. Qi, Atmospheric deposition is an important pathway for inputting microplastics: Insight into the spatiotemporal distribution and deposition flux in a mega city, Environ. Pollut., 2024, 341, 123012 CrossRef CAS PubMed.
- Y. Ding, X. Zou, C. Wang, Z. Feng, Y. Wang, Q. Fan and H. Chen, The abundance and characteristics of atmospheric microplastic deposition in the northwestern South China Sea in the fall, Atmos. Environ., 2021, 253, 118389 CrossRef CAS.
- F. Wang, Z. Lai, G. Peng, L. Luo, K. Liu, X. Huang, Y. Xu, Q. Shen and D. Li, Microplastic abundance and distribution in a Central Asian desert, Sci. Total Environ., 2021, 800, 149529 CrossRef CAS PubMed.
- Hangzhou Statistical Yearbook, https://tjj.hangzhou.gov.cn/art/2020/10/29/art_1229453592_3819709.html Search PubMed.
- Z. Tian, U. Kaminski, J. Sauer, C. Maschowski, P. Stille, K. Cen, R. Gieré, F. Sommer, V. Dietze and A. Baum, Coarse-particle passive-sampler measurements and single-particle analysis by transmitted light microscopy at highly frequented motorways, Aerosol Air Qual. Res., 2017, 17, 1939–1953 CrossRef CAS.
- VDI2119, Ambient Air Measurements – Sampling of Atmospheric Particles >2.5 μm on an Acceptor Surface Using the Sigma-2 Passive Sampler – Characterisation by Optical Microscopy and Calculation of Number Settling Rate and Mass Concentration, 2013, ICS: 13.040.001 Search PubMed.
- V. Hidalgo-Ruz, L. Gutow, R. C. Thompson and M. Thiel, Microplastics in the marine environment: A review of the methods used for identification and quantification, Environ. Sci. Technol., 2012, 46, 3060–3075 CrossRef CAS PubMed.
- H. Kye, J. Kim, S. Ju, J. Lee, C. Lim and Y. Yoon, Microplastics in water systems: A review of their impacts on the environment and their potential hazards, Heliyon, 2023, 9, e14359 CrossRef CAS PubMed.
- N. B. Hartmann, T. Hüffer, R. C. Thompson, M. Hassellöv, A. Verschoor, A. E. Daugaard, S. Rist, T. Karlsson, N. Brennholt, M. Cole, M. P. Herrling, M. C. Hess, N. P. Ivleva, A. L. Lusher and M. Wagner, Are We Speaking the Same Language? Recommendations for a Definition and Categorization Framework for Plastic Debris, Environ. Sci. Technol., 2019, 53, 1039–1047 CrossRef CAS PubMed.
- P. L. Corcoran, M. C. Biesinger and M. Grifi, Plastics and beaches: A degrading relationship, Mar. Pollut. Bull., 2009, 58, 80–84 CrossRef CAS PubMed.
- D. A. Cooper and P. L. Corcoran, Effects of mechanical and chemical processes on the degradation of plastic beach debris on the island of Kauai, Hawaii, Mar. Pollut. Bull., 2010, 60, 650–654 CrossRef CAS PubMed.
- L. A. Holmes, A. Turner and R. C. Thompson, Adsorption of trace metals to plastic resin pellets in the marine environment, Environ. Pollut., 2012, 160, 42–48 CrossRef CAS PubMed.
- J. C. Antunes, J. G. L. Frias, A. C. Micaelo and P. Sobral, Resin pellets from beaches of the Portuguese coast and adsorbed persistent organic pollutants, Estuar. Coast Shelf Sci., 2013, 130, 62–69 CrossRef CAS.
- Y. Zhang, S. Kang, S. Allen, D. Allen, T. Gao and M. Sillanpää, Atmospheric microplastics: A review on current status and perspectives, Earth-Sci. Rev., 2020, 203, 103118 CrossRef CAS.
- J. M. Levermore, T. E. L. Smith, F. J. Kelly and S. L. Wright, Detection of microplastics in ambient particulate matter using Raman spectral imaging and chemometric analysis, Anal. Chem., 2020, 92, 8732–8740 CrossRef CAS PubMed.
- S. O'Brien, C. Rauert, F. Ribeiro, E. D. Okoffo, S. D. Burrows, J. W. O'Brien, X. Wang, S. L. Wright and K. V. Thomas, There's something in the air: A review of sources, prevalence and behaviour of microplastics in the atmosphere, Sci. Total Environ., 2023, 874, 162193 CrossRef PubMed.
- R. Gillibert, A. Magazzù, A. Callegari, D. Bronte-Ciriza, A. Foti, M. G. Donato, O. M. Maragò, G. Volpe, M. Lamy de La Chapelle, F. Lagarde and P. G. Gucciardi, Raman tweezers for tire and road wear micro- and nanoparticles analysis, Environ. Sci.: Nano, 2022, 9, 145–161 RSC.
- X. Xiong, K. Zhang, X. Chen, H. Shi, Z. Luo and C. Wu, Sources and distribution of microplastics in China's largest inland lake - Qinghai Lake, Environ. Pollut., 2018, 235, 899–906 CrossRef CAS PubMed.
- K. Zhang, J. Su, X. Xiang, C. Wu and J. Liu, Microplastic pollution of lakeshore sediments from remote lakes in Tibet plateau, China, Environ. Pollut., 2016, 219, 450–455 CrossRef CAS PubMed.
- S. Sruthy and E. V. Ramasamy, Microplastic pollution in Vembanad Lake, Kerala, India: The first report of microplastics in lake and estuarine sediments in India, Environ. Pollut., 2017, 222, 315–322 CrossRef CAS PubMed.
- M. Beaurepaire, J. Gasperi, B. Tassin and R. Dris, COVID lockdown significantly impacted microplastic bulk atmospheric deposition rates, Environ. Pollut., 2024, 344, 123354 CrossRef CAS PubMed.
- R. U. Halden, Plastics and health risks, Annu. Rev. Public Health, 2010, 31, 179–194 CrossRef PubMed.
- W. C. Li, H. F. Tse and L. Fok, Plastic waste in the marine environment: A review of sources, occurrence and effects, Sci. Total Environ., 2016, 566–567, 333–349 CrossRef CAS PubMed.
- Q. Zhou, C. Tian and Y. Luo, Various forms and deposition fluxes of microplastics identified in the coastal urban atmosphere, Chin. Sci. Bull., 2017, 62, 3902 CrossRef.
- Y. Tian, C. Tu, Q. Zhou, C. Zhang, L. Li, C. Tian, Z. Zong and Y. Luo, The temporal and spatial distribution and surface morphology of atmospheric microplastics around the Bohai Sea, Acta Sci. Circumstantiae, 2020, 40, 1401–1409 CAS.
- A. D. Vethaak and J. Legler, Microplastics and human health, Science, 2021, 371, 672–674 CrossRef CAS PubMed.
- A. Vianello, R. L. Jensen, L. Liu and J. Vollertsen, Simulating human exposure to indoor airborne microplastics using a Breathing Thermal Manikin, Sci. Rep., 2019, 9, 8670 CrossRef PubMed.
- L. F. Amato-Lourenço, R. Carvalho-Oliveira, G. R. Júnior, L. dos Santos Galvão, R. A. Ando and T. Mauad, Presence of airborne microplastics in human lung tissue, J. Hazard. Mater., 2021, 416, 126124 CrossRef PubMed.
- D. Luo, X. Chu, Y. Wu, Z. Wang, Z. Liao, X. Ji, J. Ju, B. Yang, Z. Chen, R. Dahlgren, M. Zhang and X. Shang, Micro- and nano-plastics in the atmosphere: A review of occurrence, properties and human health risks, J. Hazard. Mater., 2024, 465, 133412 CrossRef CAS PubMed.
- V. Godoy, A. Martínez-Férez, M. Á. Martín-Lara, J. A. Vellido-Pérez, M. Calero and G. Blázquez, Microplastics as Vectors of Chromium and Lead during Dynamic Simulation of the Human Gastrointestinal Tract, Sustainability, 2020, 12, 4792 CrossRef CAS.
- Y.-l. Liao and J.-y. Yang, Microplastic serves as a potential vector for Cr in an in vitro human digestive model, Sci. Total Environ., 2020, 703, 134805 CrossRef CAS PubMed.
Footnote |
| † Electronic supplementary information (ESI) available. See DOI: https://doi.org/10.1039/d4ea00069b |
| This journal is © The Royal Society of Chemistry 2024 |