Particulate matter and nanoplastics: synergistic impact on Artemia salina
Received
23rd May 2024
, Accepted 2nd July 2024
First published on 9th July 2024
Abstract
Global air pollution presents substantial risks to both human health and the environment. Particulate Matter (PM) adversely affects ecosystems through pollution, bioaccumulation, and endangerment of aquatic organisms. These contaminants enter water systems via precipitation and industrial runoff, damaging aquatic invertebrates through physical, physiological, and molecular mechanisms, leading to developmental issues and organ toxicity. This study investigates the combined toxicological effect of environmental exposure to polystyrene (PS) nanoparticles and varying PM concentrations from indoor and outdoor dust particles on Artemia salina. Our findings reveal noteworthy elevations in reactive oxygen species (ROS) and malondialdehyde (MDA) levels in air conditioner (AC) dust and PM2.5 exposures, highlighting potential health risks associated with high particulate contamination. Conversely, superoxide dismutase (SOD) activity decreased, indicating harm to enzyme systems. In contrast, catalase activity (CAT) increased, suggesting a compensatory response to oxidative stress induced by Polystyrene (PS) and suspended particulate pollutants. These results underscore the severe oxidative stress experienced by marine zooplankton when exposed to PM2.5 combined with NPs, potentially impairing growth. Further research should explore the combined toxicological effects of PM2.5 and NPs on other marine species and investigate long-term exposure effects and bioaccumulation pathways. Understanding these dynamics is crucial for developing effective strategies to mitigate NP pollution and protect human health and aquatic ecosystems.
Environmental significance
Air particulate matter is a crucial indicator of air pollution released into the atmosphere by various human and natural activities. Numerous nanoplastics were observed in indoor and outdoor pollutants. The current work demonstrates the combined toxic effects of environmental exposure to polystyrene and air particulate pollutants in Artemia salina. It also emphasizes how exposure to NPs and particulate matter can cause oxidative stress in marine zooplankton, which may impede normal development. The intricate relationships that have been seen highlight the need for more investigation to fully comprehend the combined toxicological impacts of these contaminants on a variety of marine species. The study's findings highlight the effects of airborne particulate matter and nanoplastics on aquatic ecosystems and human health.
|
1. Introduction
Air pollution is a substantial global environmental issue that greatly contributes to global illness prevalence.1 The main air pollutants include ozone (O3), fine particulate matter (PM2.5), particulate matter (PM10), nitrogen dioxide (NO2), sulfur dioxide (SO2), and carbon monoxide (CO), categorized as “Criteria air pollutants”.2 It is commonly recognized that particulate matter (PM) is a major air pollutant that poses a serious hazard to human and environmental health. Air quality monitors typically measure particles by size fractions, with the mass collected directly proportional to the area under the distribution curve for each size range. Total suspended particles (TSPs) range in size from 0 to 100 μm, PM10 particles from 0 to 10 μm, and PM2.5 particles from 0 to 2.5 μm in aerodynamic diameter.3–5 PM comprises diverse substances, including dust, soil fragments, organic materials, pollutants, and microorganisms.6 These particles exhibit a wide range of sizes, with some being small enough to remain suspended in the air for extended periods, while others, being larger, settle more quickly. The composition of atmospheric PM can vary significantly, depending on its source.7 Natural sources contribute to the presence of various minerals and organic debris in atmospheric PM, such as pollen, emissions from volcanoes, and desert dust.8 In contrast, urban areas see significant amounts of PM from anthropogenic activities like industrial processes, vehicle emissions, and construction work. These anthropogenic PMs often include detrimental components such as heavy metals, polycyclic aromatic hydrocarbons (PAHs), and other hazardous compounds.9 Geographical location greatly influences the composition of atmospheric PM. For example, regions near deserts are likelier to experience increased mineral dust particles.10 In contrast, urban areas often have a higher PM concentration from sources like industries and traffic areas.11 Meteorological factors, including wind patterns and humidity, can also influence the movement and distribution of PM across various geographic locations. The elevated concentration of dust particles directly and dramatically affects human health, leading to poor air quality.12 According to epidemiological data, smog is associated with increased mortality, establishing a negative connection between exposure to high PM concentrations and human health.13 Over the past few decades, fine particulate matter (PM2.5) has been identified as a significant global air quality issue.14 PM2.5 poses a particular threat to health because of its capacity to permeate the blood vessel walls and retain them in human lungs.15 The rapid urbanization and substantial industrialization in cities contribute to an increased concentration of air contaminants affecting residents, leading to higher PM levels in India due to natural and anthropogenic effects.16 Natural factors are mostly related to meso and local microclimates, whereas anthropogenic factors are primarily related to releasing pollutants from fuel burning in homes, factories, power plants, and automobile engines.17
Furthermore, Microplastics (MPs) are little plastic particles, usually less than 5 mm in dimensions, that arise from the disintegration of larger plastic objects or are intentionally produced in tiny sizes for particular applications. They can be further categorized into microplastics (1 micrometer to 1 millimeter).18 Nanoplastics (NPs) are plastic particles with a size smaller than 100 nm. They are created either by the breakdown of larger plastic objects or deliberately produced at the nanoscale for different purposes.19 NPs have raised environmental and health concerns due to their potential to enter ecosystems and interact with organisms at microscopic levels. Recent studies indicate that the contamination of air MPs and NPs is a worldwide issue of great concern. The statement underscores the need to do up-to-date research on deposition rates, specifically focusing on NPs, because of their potential for long-distance transportation and larger concentrations on a global scale.20 Dris et al. conducted a study that evaluated levels of microplastic contamination in air samples collected indoors and outdoors. The study found that indoor air samples had greater levels of microplastics, with concentrations ranging from 1 to 60 fibers per cubic meter. In contrast, outdoor air samples had lower levels, ranging from 0.3 to 1.5 fibers per m3. The study revealed higher concentrations of microplastics in indoor air samples, ranging from 1 to 60 fibers per m3, compared to outdoor air samples, which ranged from 0.3 to 1.5 fibers per m3. They emphasized that indoor microplastics, particularly those derived from synthetic polymers, pose significant ingestion risks, especially for children, as they are associated with household dust particles.21 Similarly, Cai et al. detected polypropylene (PP), polystyrene (PS), and polyethylene (PE) microplastics (MPs) in atmospheric deposition in Dongguan City, China. The study examined various forms, including fragments, films, fibers, and foam, with fibers being the most prevalent type identified using scanning electron microscopy.22 They are significant components identified in urban deposited and suspended dust, gaining global attention in recent years.23 NPs are initially derived from nano-sized plastic debris, like nanobeads, the primary source, and fragments from large particles, which are the secondary source due to degrading or weathering.24 Most NPs in the atmosphere are micro and nano-sized and are difficult to view with the naked eye.25 It has been shown that NPs are pervasive in the environment and have been identified in various media, foods, and drinks over the last few decades due to their persistence, low density, reckless disposal methods, and ineffective waste management.26 In contrast to other ecosystems, individuals can consistently and directly inhale airborne NPs, raising health concerns.23 Prolonged inhalation may lead to respiratory discomfort, cytotoxic and inflammatory effects, and the development of autoimmune illnesses.27 Incorporating NPs in settleable dust, composed of bigger and heavier particles that finally settle onto the Earth's surfaces in terrestrial and aquatic ecosystems, can have various negative environmental impacts.28 Because of tiny particle size and mobility, dust, and NPs can be vehicles for spreading other environmental contaminants.29 NPs are especially efficient carriers because of their enormous surface area and capacity to absorb hydrophobic contaminants.30 When NPs are introduced into aquatic ecosystems, they may discharge their absorbed contaminants, possibly harming aquatic life. NPs can potentially be ingested by organisms, leading to their accumulation and adverse effects on crucial biological functions, including survival growth, reproduction, feeding, and immune system functionality.31 A complex web of interactions is created when particle pollution and NPs are in the environment. These interactions can transport toxins on land and aquatic animals.32 During the interaction, results due to them are essential for combating environmental contamination and preserving the health of ecosystems. It causes oxidative stress, inflammatory lesions, metabolic abnormalities, neurotoxicity, and an increased risk of developing cancer.33 To examine the toxicological impact of PM on NPs in their ecosystem, new research paths or viewpoints and the integration and critical analysis of several research units are urgently needed. Few studies have examined NPs in suspended particulate matter of PM2.5 and settleable dust particles.34 Moreover, more research is needed regarding the potential links between nano contaminants and airborne dust. As such, there is a need for increased focus on the prevalence, health implications, and potential interactions of NPs with other airborne contaminants present in atmospheric particles. The present study was designed to investigate the combined toxicity effect of polystyrene NPs with natural particulate matter by using the aquatic organism Artemia salina as a model system; this study aims to address the gap in understanding the synergistic impact of these pollutants.
2. Materials and methods
2.1. Chemicals required
The Polystyrene NPs (100 nm) were ordered from Polysciences Inc, USA. The 2′,7′-Dichlorofluorescin diacetate (DCFH-DA) and sodium carbonate (Na2CO3) were acquired from Sigma-Aldrich, USA. The hydroxylamine hydrochloride, Triton X 100, Thiobarbituric acid (TBA), and Trichloroacetic acid (TCA) were acquired from Hi-Media, an Indian supplier. The Nitro blue tetrazolium chloride (NBT) and Hydrogen peroxide solution 30% w/v (H2O2) were acquired from SDFCL, an Indian supplier. The Artemia salina cysts were acquired from Ocean Star International Inc., located in the United States.
2.2. Sample collection
Air particulate matter and indoor dust particles were collected from the fan wings of Tower fans and the AC filter of an air conditioner in the urban area in Vellore City, Tamil Nadu, India. PM2.5 particles from the outdoor environment were collected using an Envirotech Instruments PM sampler, namely the APM550 model. The sampler was placed in a High Auto Mobility region located at coordinates 12.93 N and 79.13 E in Vellore City, Tamil Nadu, India. The Envirotech APM550 PM sampler was configured with a PM2.5 particle size separator (impactor) followed by quartz filters with 2.5 mm pores. This setup allows the sampler to capture the PM2.5 fraction, consisting of particles smaller than 2.5 mm, onto the quartz filters. Quartz filters were chosen for their chemical inertness and high efficiency in capturing fine particles, ensuring accurate measurement of PM2.5 concentrations. Prior to sampling, the quartz filters underwent pretreatment at 800 °C for 200 minutes to reduce background levels of organic species. During sampling, the sampler maintained a consistent air flow rate, calibrated to extract a specified volume of air over a set duration. This method ensured the collection of a representative sample of ambient air during the defined sampling period.35 Following sampling, the collected samples were immediately transferred into pre-cleaned glass vials. No ethical approval was required from a human subject or animal welfare committee, as the study did not involve human or animal subjects. The sampling process adhered to relevant local regulations, with measures taken to minimize environmental impact.
2.3. Stock preparation and characterization of NPs
The particulate matter of PM2.5 containing pollutants on the quartz filter paper was directly agitated in falcon tubes using 25 mL of natural seawater for 5 minutes. Subsequently, it underwent ultrasonication for 30 minutes at 60 °C. Subsequently, the quartz filter paper was delicately extracted, and the resultant liquid medium was sieved using a 0.22 μm syringe filter. Similarly, the indoor dust particles were prepared in the ratio of (1![[thin space (1/6-em)]](https://www.rsc.org/images/entities/char_2009.gif) :1) 50 mg in 50 mL of natural seawater. After incorporating the substance, natural seawater is subjected to ultra-sonication for 30 min at 60 °C. Then, it is filtered through the 0.22 μm syringe filter, and both eluted liquid mediums are used for further investigation. These 1 PPM of polystyrene NPs were prepared and considered for control in this study.
:1) 50 mg in 50 mL of natural seawater. After incorporating the substance, natural seawater is subjected to ultra-sonication for 30 min at 60 °C. Then, it is filtered through the 0.22 μm syringe filter, and both eluted liquid mediums are used for further investigation. These 1 PPM of polystyrene NPs were prepared and considered for control in this study.
2.4. Fourier-transform infrared spectroscopy (FTIR)
It aids in characterizing and quantifying the presence of nanoplastics in the test sample, compared to reference standard plastics.36 The prepared indoor and outdoor samples were quantified through FTIR (IR Spriti; Shimadzu, Japan). A few droplets of test samples were placed on the holder. It records the background spectrum from the test sample and characterizes the absorbed peak of NPs in the sample. The C–H and C![[double bond, length as m-dash]](https://www.rsc.org/images/entities/char_e001.gif) O stretching vibrations may be frequent peaks associated with NPs. It compares the test sample spectra with reference spectra to identify and quantify the presence of NPs, and it quantifies this through the measurement of the peak intensity or integration of the peak area.
O stretching vibrations may be frequent peaks associated with NPs. It compares the test sample spectra with reference spectra to identify and quantify the presence of NPs, and it quantifies this through the measurement of the peak intensity or integration of the peak area.
2.5. Optical microscope
The prepared indoor and outdoor samples underwent particle examination using an optical microscope. In this process, 100 μL of samples were placed on glass slides, and the particles were counted through detailed observation under the microscope.
2.6. Field emission scanning electron microscope (FE-SEM)
The indoor and outdoor pollutants interacting with polystyrene NPs were examined for size and surface morphology using the FE-SEM, specifically the Thermo Fisher FEI Quanta 250 FEG. A sample drop was deposited on the glass slide and dried at room temperature. The glass slides were then gold sputtered and examined under FE-SEM, and the number of particles was counted using Image J plus software. Each analysis was performed in triplicates; six images were randomly picked.
2.7. Test organisms
Artemia salina is used as the test organism in this investigation. The Natural seawater (NSW) was obtained from Rameswaram. It underwent vacuum filtration using a 0.22 μm membrane and was then autoclaved for future use. In a sterilized glass beaker, 1 L of NSW and 1 g of Artemia salina eggs were added, providing constant air and light. Under these conditions, the process of hatching occurred within a single day. The just-hatched nauplii were isolated and left to mature in a fresh batch of NSW medium for 24 hours. After that, 48 hours-old nauplii were chosen for further experiments. A set of methodologies was used for all the tests.
2.8. Investigates the hatching percentage
The hatching rate of cysts was evaluated using a conventional procedure described in a previous study.37 Then, the working concentrations of indoor and outdoor pollutants were prepared in the range of 1, 5, and 10 μg mL−1. Concisely, inside every category, ten Artemia brine shrimp cysts were explored. The experiment groups are (i) only PS, (ii) only PM2.5/fan dust/AC dust, and (iii) interaction of PS with PM2.5/fan dust/AC dust, and the control group has only NSW with any pollutant, and incubate at room temperature. The experiments were conducted in triplicate. The hatching rate was evaluated after a 24 hours exposure period. The hatching percentage was determined by using the following formula:
In this context, the variable H represents the proportion of cysts that have hatched, N represents the count of freshly hatched cysts, and C represents the number of cysts that have been decapsulated.38 The experiment was conducted in triplicate. After 48 h exposure, the immobile A. salina was analyzed using a stereomicroscope to investigate the ingestion and accumulation of NPs from the pollutant.
2.9. Biochemical characterization
2.9.1. Total protein.
The Bradford test was used to determine the overall protein content.39 A standard curve was generated by plotting the concentrations of a 1 mg mL−1 BSA standard ranging from 0 to 50 g mL−1. A total of 10 mL of homogenate supernatant and 190 mL of Bradford reagents were combined. The samples were then incubated in the dark for 5 min. Subsequently, the absorbance was quantified with a Biorad xMark microplate reader. The total protein concentration was measured by using the standard graph.
2.9.2. Superoxide dismutase activity (SOD).
SOD activity was assessed using the methodology outlined in prior investigations; the absorbance at 560 nm is measured due to the inhibition of NBT degradation.40 The well plate was incubated in the dark for 2 minutes after adding 10 μL of homogenate supernatant, 130 μL of Na2CO3, 50 μL of NBT, 10 μL of 1X Triton X 100, and hydroxylamine hydrochloride. Following the incubation, 10 μL of culture supernatant was added. The reaction mixture was subjected to a Philips Fluorescent lamp emitting light at a continuous wavelength, with an intensity of 3000 lx, for 20 minutes. The absorbance of the reaction mixture was measured at a wavelength of 560 nm using the Bio-Rad xMARK microplate absorbance spectrophotometer.
2.9.3. Reactive oxygen species (ROS).
The DCFH-DA technique was utilized.41 A volume of 100 μL of homogenized supernatant was combined with 10 μL of DCFH-DA and thereafter placed in a dark environment for 30 minutes. The fluorescence intensity was measured using the JASCO-FP 8300 spectrophotometer, with excitation at 485 nm and emission at 535 nm.
2.9.4. Lipid peroxidation products (LPO).
In lipid peroxidation, the TBA-TCA technique, as described by Sunil et al. (2023),41 was employed. This procedure involves the high-temperature reaction between TBA and MDA, resulting in the formation of a complex with a pink hue. In order to carry out the process, 50 μL of homogenized supernatant was mixed with 200 μL of TBA solution produced in TCA. The resultant mixture was subjected to incubation at a temperature of 97 °C for 25 minutes, after which it was rapidly cooled on ice for 10 minutes. Subsequently, the absorbance was measured at 532 nm. The data collected from a standard graph were used to calculate and determine the concentration of MDA.
2.9.5. Catalase activity.
Catalase activity was assessed by monitoring changes in absorbance at a wavelength of 240 nm.42 This test required preparing a 30 mM H2O2 solution in 1 X PBS. Next, 200 μL of the homogenized supernatant was combined with 800 μL of a solution containing 30 mM H2O2. Subsequently, the measurement of absorbance was conducted at a wavelength of 240 nm. The measurement of catalase activity was based on the detection of changes in absorbance, which were presumably caused by the catalytic degradation of hydrogen peroxide by catalase in the sample.
2.10. Statistical analysis
For this investigation, each experiment was performed in triplicates. The data's normality was validated by doing the Shapiro–Wilk test (P > 0.05), and the homogeneity of variances was checked using Levene's test (P > 0.05). Since the assumptions of ANOVA were satisfied, no data transformations were needed. A one-way analysis of variance (ANOVA) was followed by the Bonferroni multiple comparisons test, and it was selected for its conservative control of type I error due to multiple comparisons. The threshold for statistical significance was established at a P-value of less than 0.05. All data analyses were conducted using GraphPad Prism version 5.02. The null hypothesis (H0) posits no significant difference in the impact of particulate matter and nanoplastics on Artemia salina, while the alternative hypothesis (H1) posits a significant difference.
3. Results and discussion
3.1. Characterization of NPs in particulate pollutants
3.1.1. Fourier-transform infrared spectroscopy (FTIR) analysis.
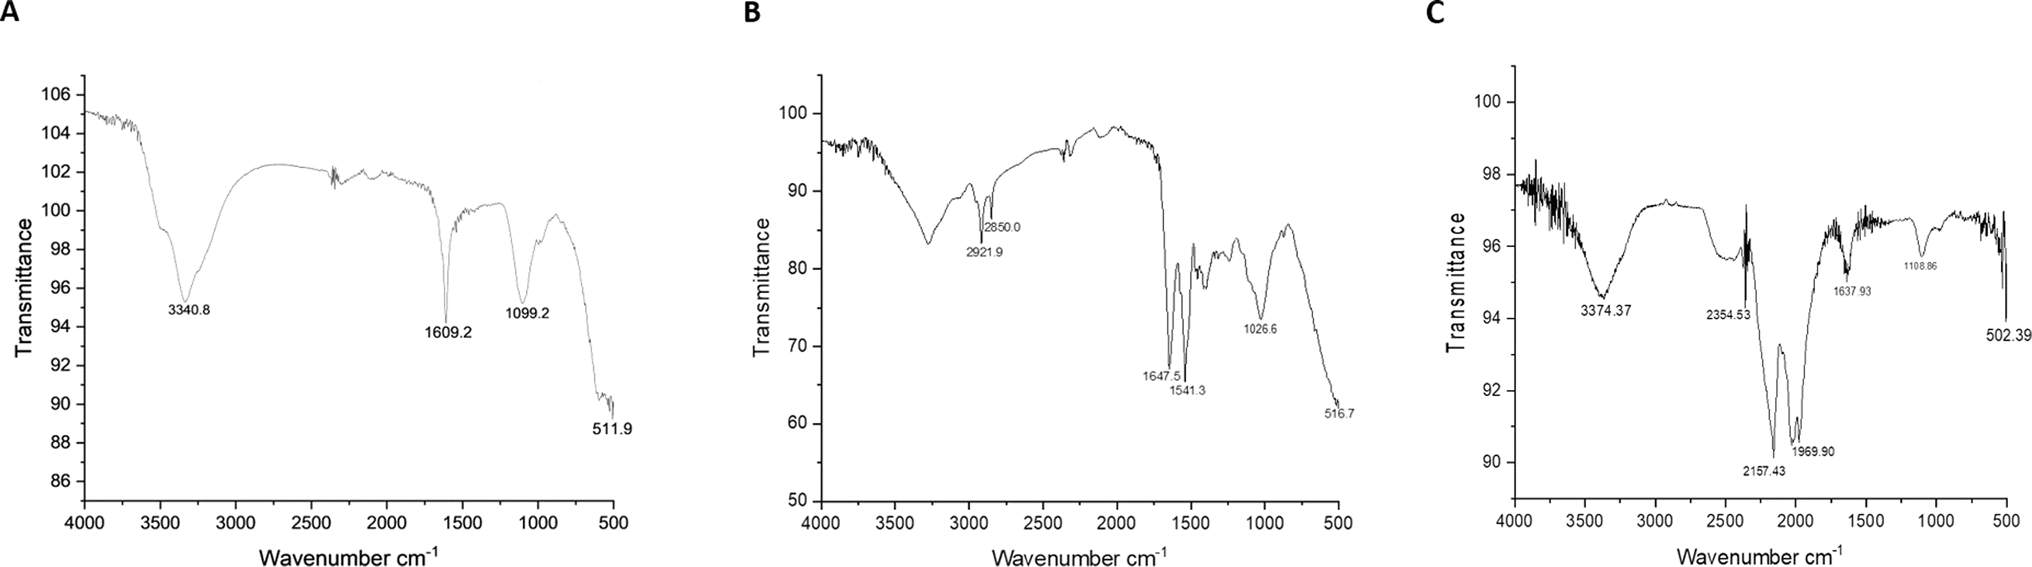
NPs are pervasive in the environment, existing as particles, fibers, or foam, with macro and nano-sized pollutants. Chemical compositions and the surface content of ingested substances influence their toxicity. Fig. 1A represents the spectrum properties of the prepared particulate samples, and the functional groups are typical of the various types of NPs. In the indoor fan, dust particles consist of peaks obtained at 1099.2 cm−1, 1609.2 cm−1, and 511.9 cm−1, and the functional groups are C–C stretch belongs to polyvinyl chloride, CC stretch belongs to nitrile, CF2 bend belongs to Polytetrafluoroethylene (PTFE), respectively. The presence of PVC and PTFE in indoor fan dust is attributed to their use in building and consumer goods. PVC, used in pipes and floors, releases particles via abrasion. During the usage of PTFE, which is often found in non-stick cookware and insulation, particles are released.43 They contribute to the presence of interior dust by dispersing in the air and then collecting on surfaces such as fan blades. Fig. 1B represents the indoor AC dust particle consisting of the peak obtained at 2921.9 cm−1 belonging to the C–H stretch. The polymers are Acrylamide butadiene styrene (ABS)/Ethylene-vinyl Acetate (EVA)/Low-density Polyethylene (LDPE), and 2850.0 cm−1 belongs to the function group of C–H stretch and the polymers are Latex/Nitrile/Ethylene Vinyl Acetate (EVA)/Polystyrene/High-density Polystyrene (HDPE), and 1541.3 cm−1 belongs to NH bend C–N stretch belongs to a polymer of nylon, and 1026.6 cm−1 belongs to aromatic CH bend, it belongs to polystyrene polymer, respectively. These polymers are essential constituents of furniture, carpets, electronics, packaging, and many home products that are often encountered inside. Over time, the deterioration of these materials might result in the emission of particles into indoor air due to mechanical abrasion, heating, and other related mechanisms. Human actions, such as cleaning and handling of items, can contribute to the dispersal of polymer particles.44 Similarly, Fig. 1C represents the particulate matter of PM2.5. The peak obtained at 502.39 cm−1 belongs to the CO stretch, and the polymer type of nylon is observed.45 Nylon fibers may be derived from several sources related to road traffic, including vehicle tires, brake linings, and synthetic garment fibers shed by pedestrians and cyclists. These materials contribute to the presence of airborne particulate matter via mechanical wear and friction processes.46,47
 |
| | Fig. 1 Represents the FTIR spectra of particulate pollutants depicting various polymers with distinct functional groups: (A) indoor fan dust, (B) indoor AC dust, and (C) outdoor PM2.5. | |
3.1.2. Optical microscope and FE-SEM analysis.
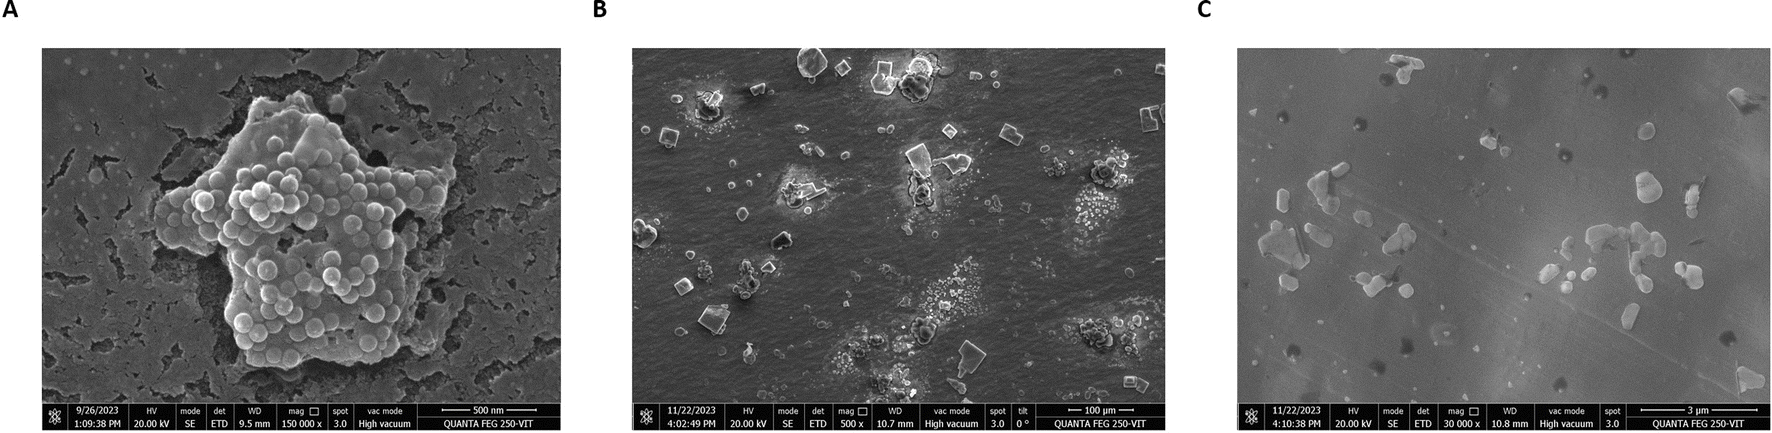
The prepared particulate pollutants of the fan, AC duct, and the PM2.5 samples were subjected to examine the particle count through the optical microscope; 1 mg mL−1 of stock samples were prepared, and 100 μL of samples were subjected to microscopic examination. The 100 μL fan dust samples consist of 202 particles, and the AC dust samples consist of 477 particles; the outdoor particulate pollutant carries the 1274 particle counts found in the prepared samples. The prepared particulate pollutant was subjected to FE-SEM analysis, as shown in Fig. 2A. It reveals that the particles present in those samples have irregular surface morphology, and the interaction of environmental pollutants with NPs is seen. Fig. 2B and C represent the spherical, film-like particles and unstructured particles seen with different sizes, resembling the surface roughness of NPs in the natural environment. To support our findings, recent studies examining street dust particles under the microscope have seen spherical and film-like particles with different-sized particles.48
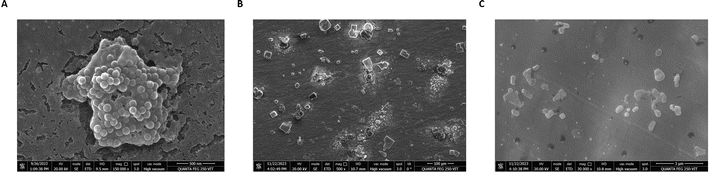 |
| | Fig. 2 Illustrates the interaction between Polystyrene (PS) and suspended particulate matter under field emission scanning electron microscopy (FE-SEM): (A) PS interaction with fan dust particle, (B) PS interaction with AC dust particle, and (C) PS interaction with PM2.5. | |
3.2. Hatchability test
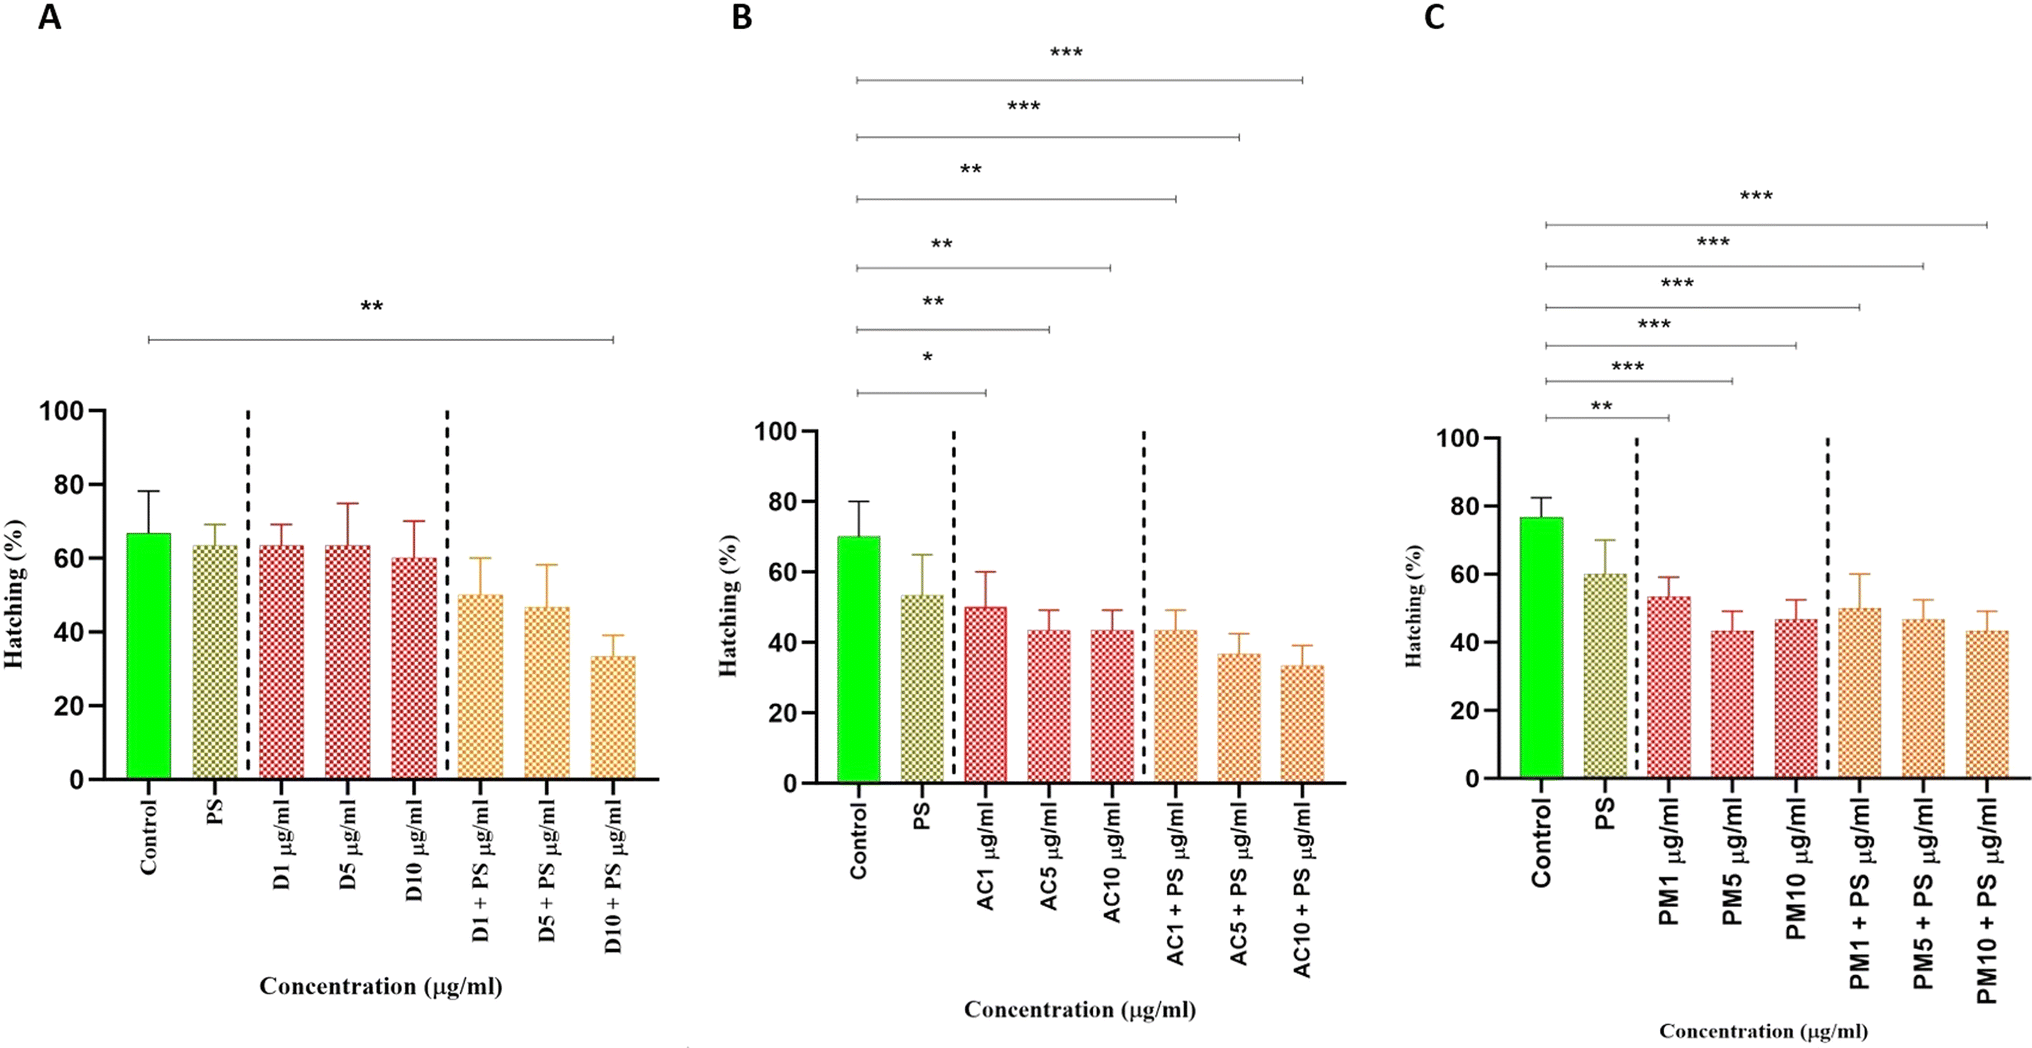
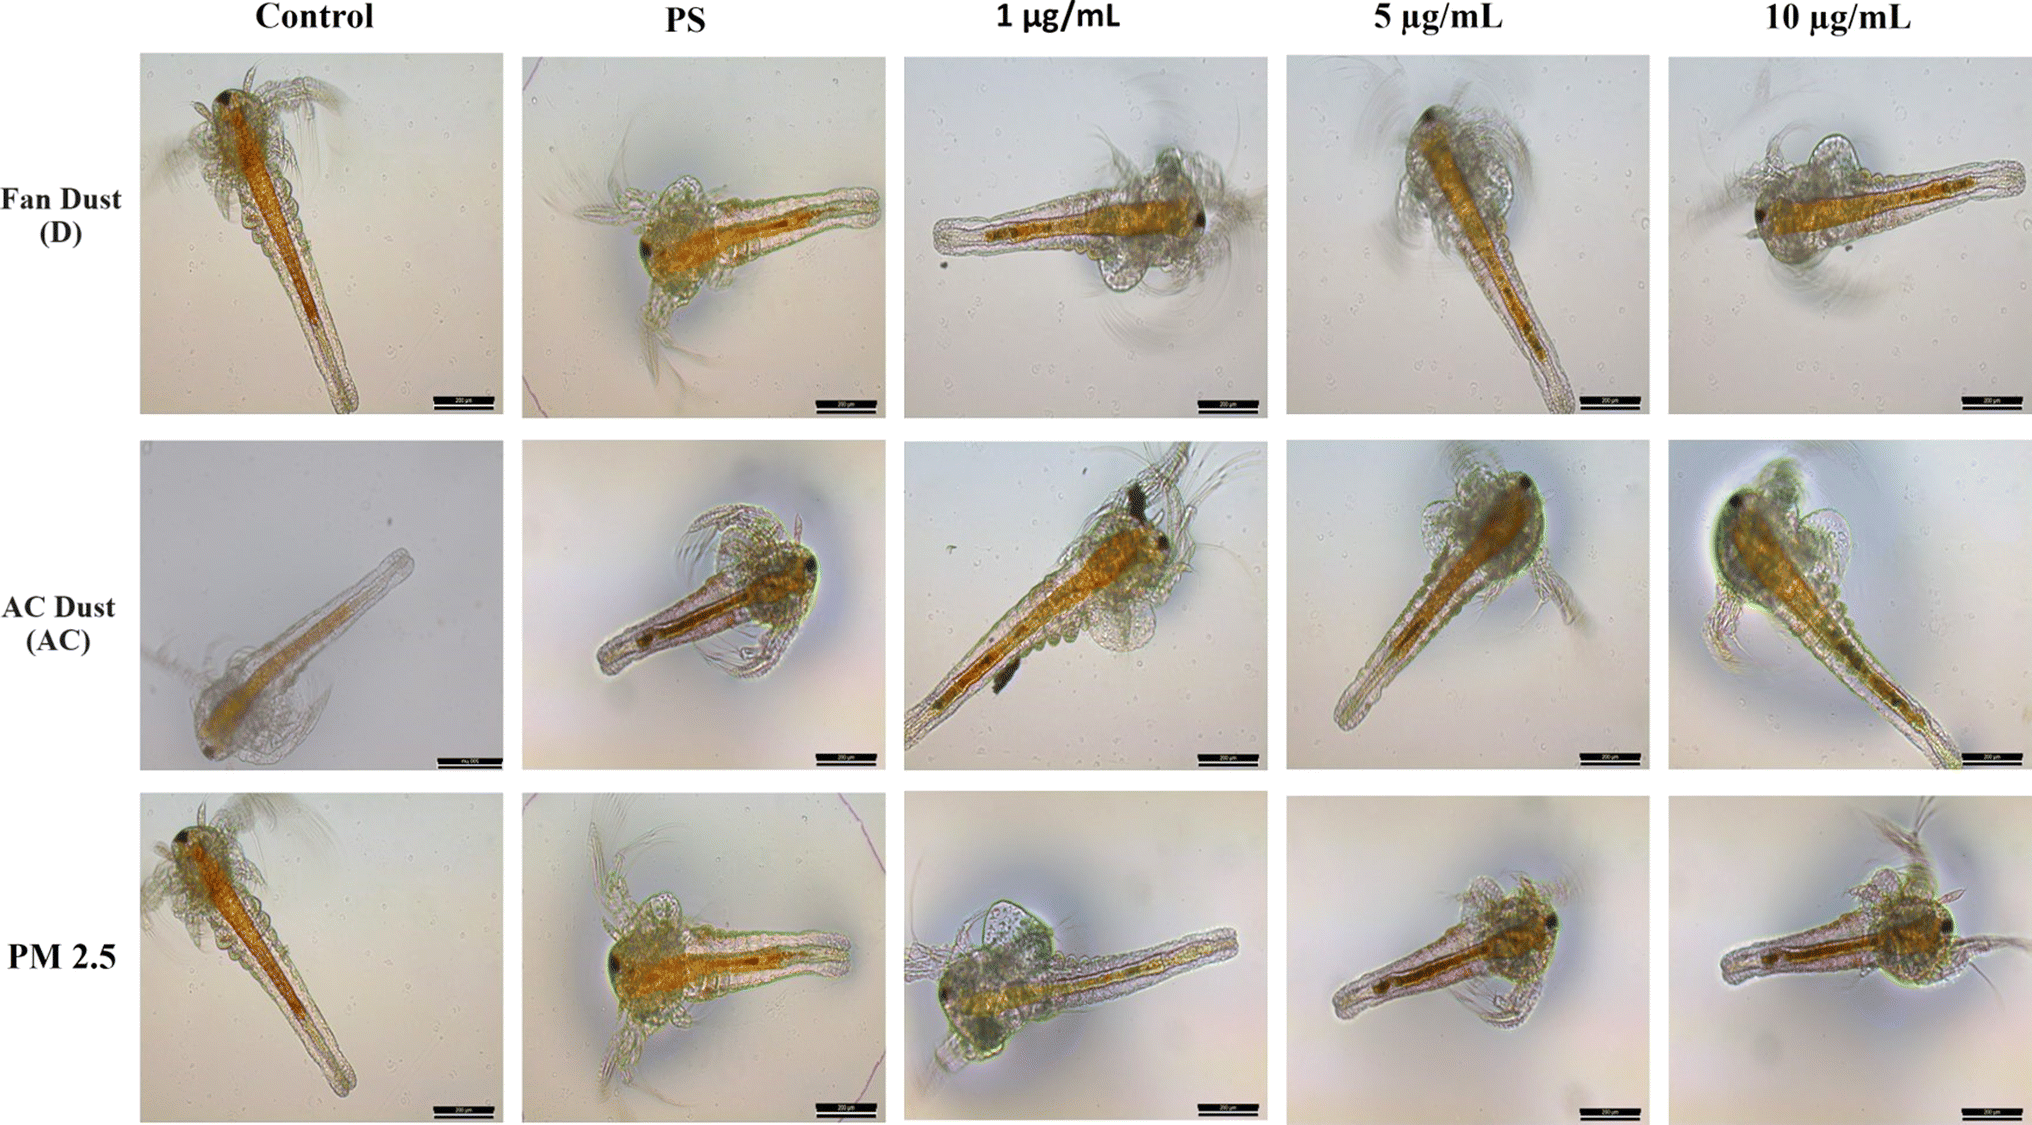
The rate at which A. salina cysts hatched was investigated in these studies using various particle pollutants. In Fig. 3A, the impact of fan dust on hatching rates is evident. In the control group, the hatching rate is 68%, significantly decreasing to 65% after treatment with PS and various doses of fan dust (D1 and D5 μg mL−1). Notably, a more pronounced drop occurs at a higher D10 μg mL−1 dose, bringing the hatching rate down to 62%. Intriguingly, combining PS with D1, D5, and D10 μg mL−1 shows a substantial inhibitory effect, resulting in hatching rate reductions of 52%, 48%, and 35%, respectively. The hatching rate is significantly affected by the variation between the control group with D10 μg mL−1 with PS (p = 0.0034). These findings highlight the negative impact of fan dust, especially when combined with PS, on the success of Artemia hatching. In Fig. 3B, the impact of AC dust on hatching rates is evident, showing a significant decrease from the control group of 70 to 55% in the PS-treated group. Varying concentrations of AC dust (AC1, AC5, AC10 μg mL−1) correspond to hatching rates of 50% and 43%, respectively. Combining AC dust with PS results in synergistic inhibitory effects, with 43%, 40%, and 38% for AC1, AC5, and AC10, respectively. Statistical comparisons underscore the substantial influence of AC dust, particularly in interaction with PS, revealing significant differences between the control group and various AC dust concentrations with PS. Fig. 3C illustrates outdoor particulate pollutant effects. The control hatching rate is almost 80%, drastically lowering to 61% in PS. The different PM2.5 concentration cause different hatching rates of PM1, PM5, PM10 had 53%, 44%, and 48%, (p < 0.001), respectively. Interestingly, the hatching rate further declines in PM1, PM5, and PM10 μg mL−1 to 52%, 50%, and 48%, respectively, having a cumulative inhibitory impact. Comparing the control group to the PM2.5 group statistically shows substantial differences, with the PS group significantly beyond the significant threshold. To support this finding, in Artemia salina, the accumulation of particulate matter was observed in the gut region of treated animals, as shown in Fig. 4. It represents the treatment of only different forms of particulate matter in different concentrations alone or treated with PS and only PS.
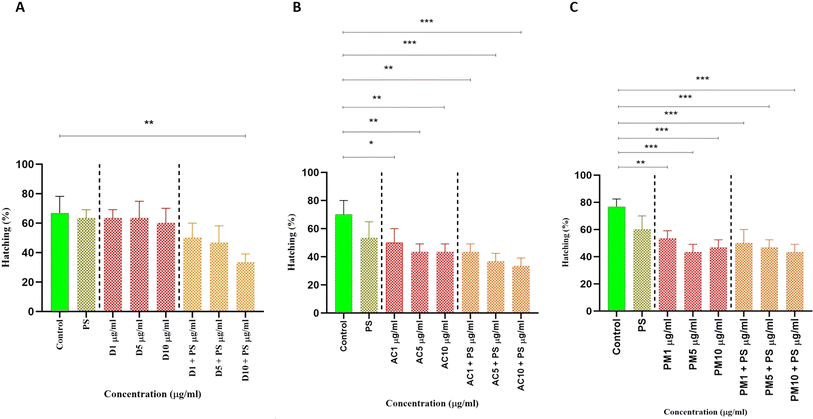 |
| | Fig. 3 Shows the percentage of Artemia salina cysts hatching upon exposure to different concentrations of particulate pollutants: (A) indoor fan dust, (B) indoor AC dust, and (C) outdoor PM2.5 particles. | |
 |
| | Fig. 4 Depicts the intake and bioaccumulation of particles in the gut region of treated animals, contrasting with the clear digestive tract of the control group, visible from the 2nd nauplii stage. | |
3.3. Biochemical characterization
3.3.1. Reactive oxygen species (ROS) activity.
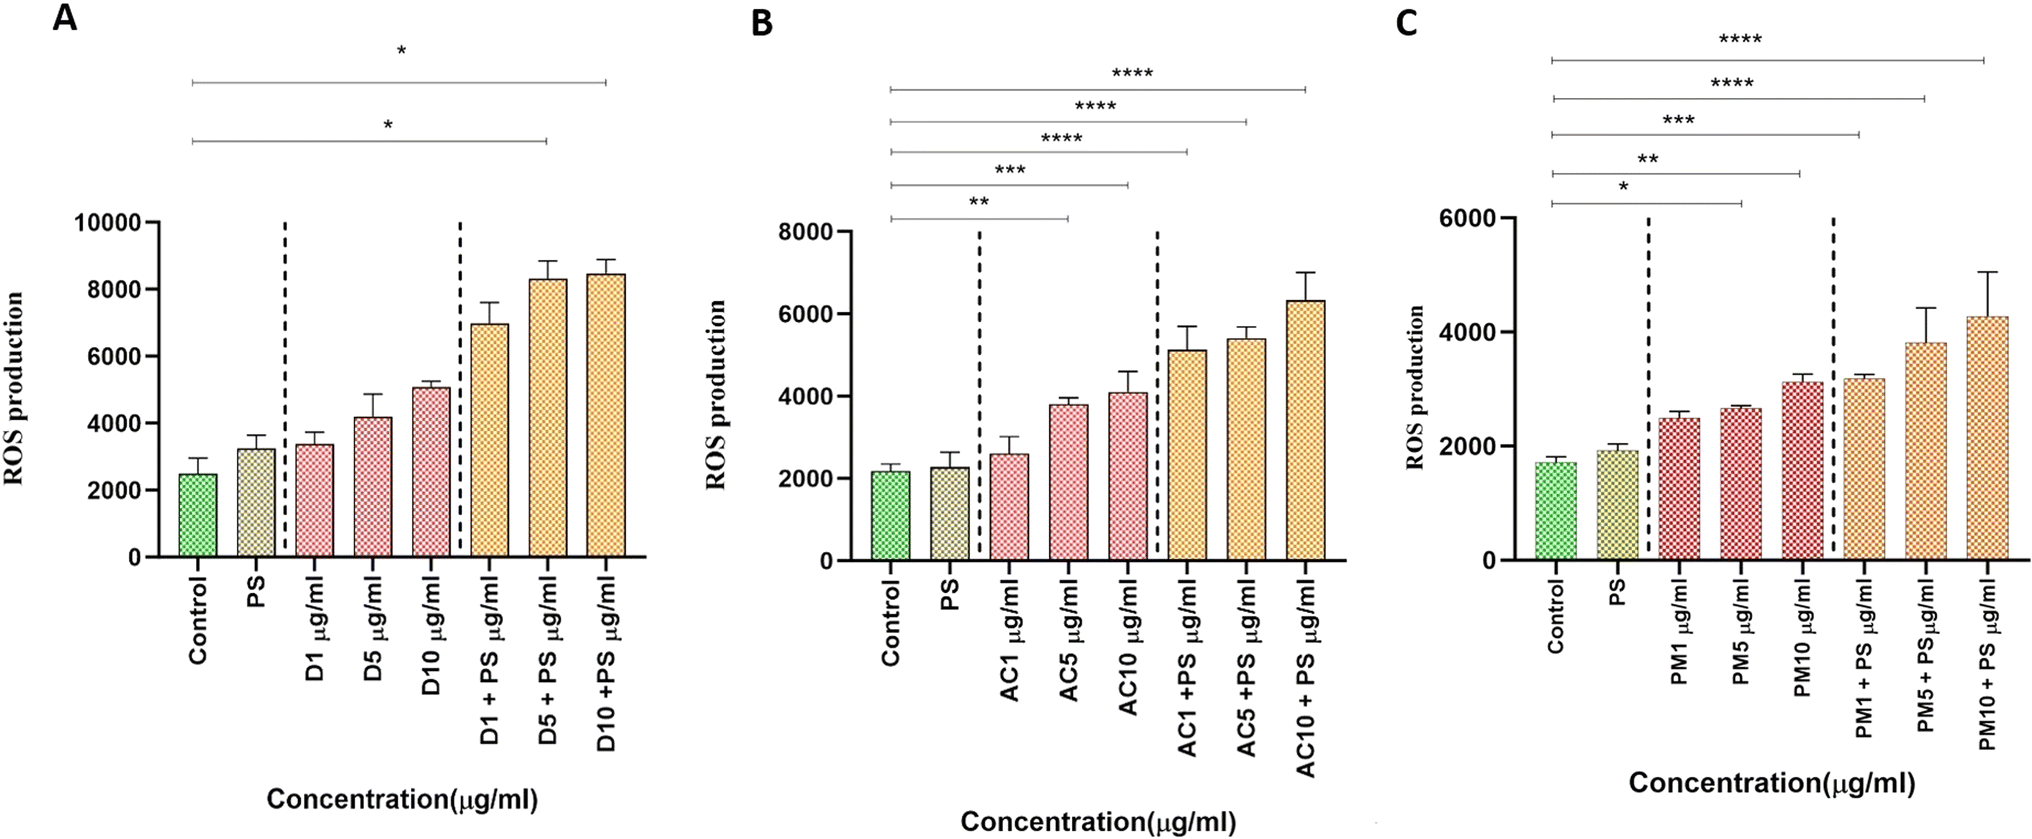
ROS are extremely reactive oxygen radicals in all their forms produced as a typical by-product of cell metabolism.49 A higher amount of ROS production is observed when the cells are under stress conditions. We observed that the interaction of NPs with particulate pollutant samples caused oxidative stress, which subsequently stimulated the generation of ROS. The production of ROS was closely associated with the existence of AC dust particles and PM2.5 at varying concentrations. In Fig. 5A, the Bonferroni multiple comparisons test (BMCT) was employed to conduct detailed pairwise comparisons within the three groups, illustrating the statistical significance of ROS activity. In brief, Fig. 5A represents the particulate pollutant of a fan dust particle in that the significant increase in ROS level is observed when the 1 PPM of PS interacts with 5 μg mL−1 and 10 μg mL−1. The p-values for these comparisons are 0.04 and 0.02, respectively, when compared to the control group. Whereas in Fig. 5B represents the particulate pollutant of AC dust particles; the Bonferroni correlation shows the discrete significant differences between the control and other groups. In summary, no statistically significant changes were seen between the control group and those exposed to PS or AC dust at one μg mL−1 (ns, p > 0.99), respectively. Nonetheless, a dose-dependent impact was noted, with ROS level showing a significant rise at 5 μg mL−1 (p = 0.001) and a considerable increase at 10 μg mL−1 (p = 0.0003). Additionally, the combination of 1 PPM of PS with AC dust particles showed even more noticeable effects with highly significant differences at AC1 μg mL−1 + PS, AC5 μg mL−1 + PS, AC10 μg mL−1 + PS, (***, p < 0.001 for each), respectively. These results highlight the significant effect of AC dust on ROS levels, particularly at higher concentrations and when combined with PS, similar to Fig. 5C represents the evaluation of outdoor pollutants of PM2.5; no statistically significant changes were seen when comparing the exposure to PS or PM2.5 at 1 μg mL−1 (ns, p > 0.99) with the control group. On the other hand, ROS levels showed a significant rise at 5 μg mL−1 (p = 0.03) and a more significant rise at 10 μg mL−1 (p = 0.001), respectively. Additionally, the combination of PS and PM2.5 showed dose-dependent effects with very substantial differences at PM2.5 1 μg mL−1 + PS (***), PM2.5 5 μg mL−1 + PS, and PM2.5 10 μg mL−1 + PS (p < 0.001 for each). The results above highlight the influence of PM2.5 exposure on ROS levels, especially when combined with PS and at elevated concentrations. These studies demonstrate a clear relationship between increased ROS generation, a sign of oxidative stress, and particle pollutants, including PM2.5 and AC dust. The dose-dependent impact is observed in the AC dust; it highlights the possible health consequences of exposure to excessive concentrations of pollutants in the environment. Also, this undoubtedly carries the risk of oxidative damage to various biological components, as well as mutagenesis, carcinogenicity, lipid peroxidation, DNA damage, and impaired reproductive capacity.50
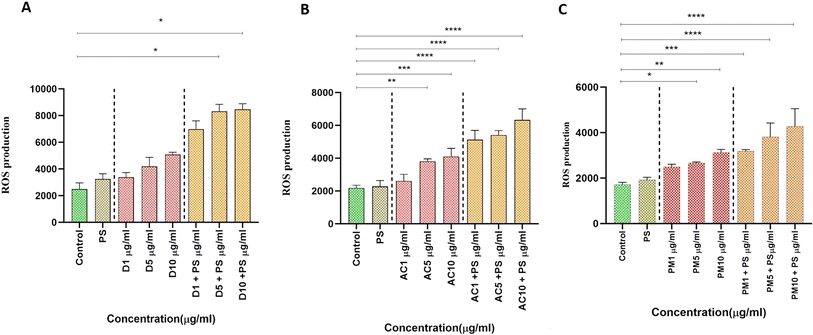 |
| | Fig. 5 Illustrates the production of reactive oxygen species (ROS) in particulate pollutants with statistical significance (p < 0.001): (A) indoor fan dust, (B) indoor AC dust, and (C) outdoor PM2.5. | |
3.3.2. Catalase activity.
The enzyme catalase is in charge of breaking down hydrogen peroxide into molecules of water and oxygen. Cells may accumulate hydrogen peroxide, which can seriously harm an organism.51Fig. 6A. It represents the particulate pollutant of a fan dust particle; the Bonferroni correlation suggests that compared to a control group with PS exposure, there were no significant differences (ns, p = 0.06). However, exposure to fan dust concentration of (1, 5, 10 μg mL−1) resulted in significant increases in catalase activity (p = 0.02, p = 0.04, p = 0.0003), respectively. However, when exposed to 1 μg mL−1 in combination with 1 PPM of PS, no significant changes in catalase activity were observed. In contrast, catalase activity showed substantial increases when exposed to 5 μg mL−1 (p = 0.0002) and 10 μg mL−1 (p = 0.01). These results point to a concentration-dependent effect of fan dust on catalase activity, with subtle differences in responses noted when catalase is paired with PS. This highlights the sensitivity of catalase to different concentrations of pollutants. Where Fig. 6B represents the particulate pollutant of AC dust particles, the Bonferroni correlation shows that the comparison between the PS and different concentrations of AC dust (1, 5, 10 μg mL−1) did not exhibit statistically significant differences, as indicated by non-significant adjusted p-value is (p > 0.05). Nevertheless, a noticeable change happened when 1 PPM and AC dust concentration were integrated. The groups that were subjected to AC1 μg mL−1 + PS, AC5 μg mL−1 + PS, and AC10 + PS μg mL−1 all showed significantly enhanced catalase activity; these groups adjusted p-values were 0.013, 0.010, and 0.015, respectively. The catalase activity may not be affected by the single concentration of AC dust, but its effects are amplified when combined with PS, as shown in Fig. 6C represents the evaluation of outdoor pollutants of PM2.5 concentration of (1, 5, 10 μg mL−1) in comparison to the control group, has non-significant corrected p-value (p > 0.005), and indicates that there was no statistically significant difference in catalase activity. The catalase activity was significantly elevated when PS and PM2.5 were exposed together, highlighting the possible synergistic effect of pollutant interactions. It is seen that there is a discernible rise when PS is combined with particle pollution, which may indicate possible synergistic pollutant interactions.
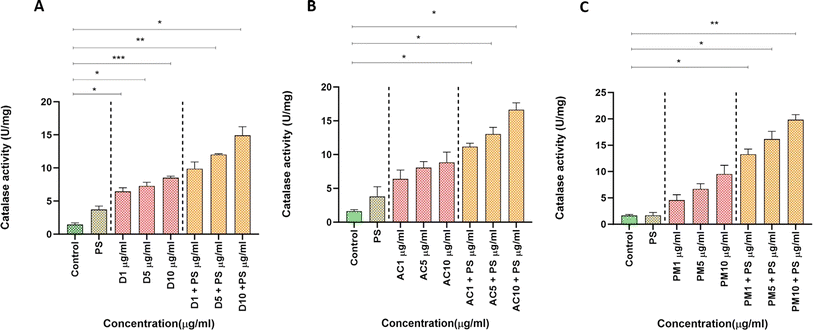 |
| | Fig. 6 Presents the superoxide dismutase (SOD) activity in particulate pollutants, indicating significant differences via one-way ANOVA (p < 0.001). (A) indoor fan dust, (B) indoor AC dust, and (C) outdoor PM2.5. | |
3.3.3. Superoxide dismutase (SOD) activity.
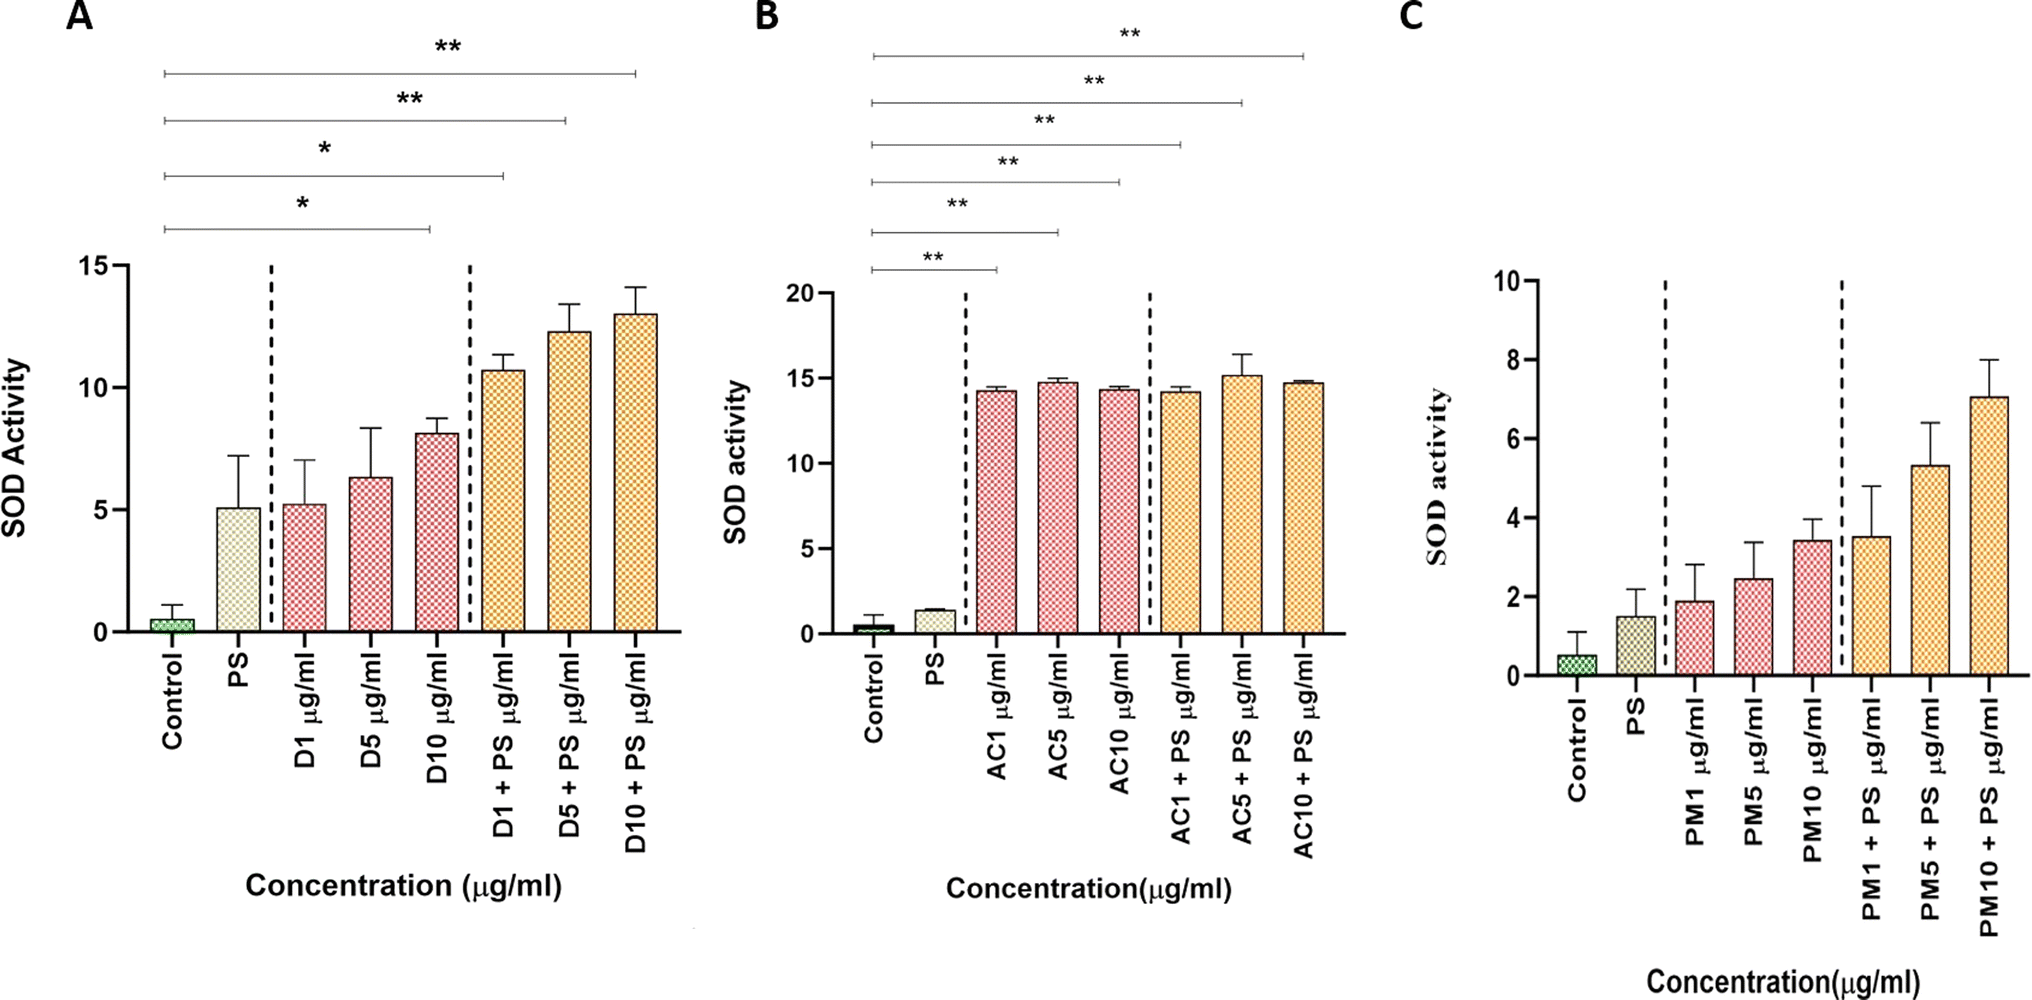
SOD catalyzes the conversion of superoxide radicals into oxygen and hydrogen peroxide molecules.52Fig. 7A describes the Bonferroni multiple comparisons test of the control group and various concentrations of fan dust. However, combined with PS at 1 PPM, there were no significant differences at lower concentrations. Fan dust may have a concentration-dependent influence on this antioxidant enzyme, as seen by statistically significant increases in SOD activity at higher concentrations of D5 and D10 μg mL−1 with PS. Fig. 7B represents the particle pollutants of AC dust particles. At the same time, no significant changes were observed at lower concentrations, and higher concentrations of (AC1 and AC5, AC10 μg mL−1) as well as in combination with PS, exhibited statistically significant increases, suggesting a concentration-dependent impact on AC dust on SOD activity. Similarly, in Fig. 7C, the outdoor pollutant PM2.5 reveals no significant changes at lower PM2.5 concentrations. Nevertheless, statistically significant increases of (p = 0.15) were observed at higher PM2.5 concentrations with 1 PPM of PS, indicating a possible concentration with a dependent effect of PM2.5 on SOD activity, with subtle differences in responses observed at different exposure levels. In these, we found that the particulate pollutant, the SOD, initially increased relative to the control and then declined. Because the SOD enzyme was first activated to decrease the high ROS concentrations, there may have been an increase in SOD at lower particulate pollutant concentrations.53 The toxicants present in the particulate pollution may have caused damage to the enzyme machinery, leading to a subsequent drop in SOD levels.54
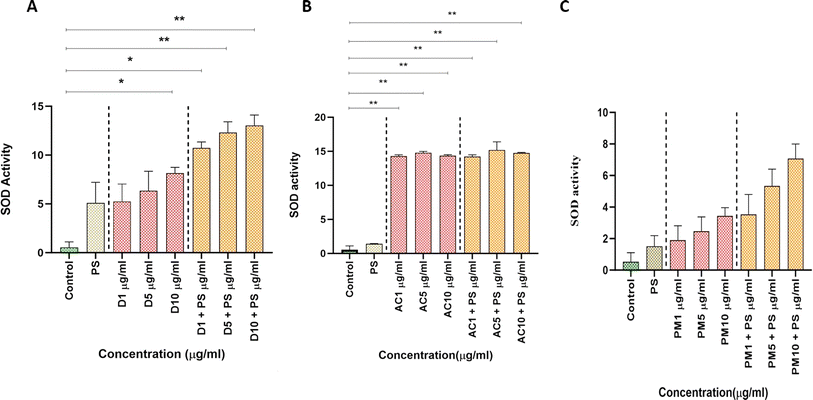 |
| | Fig. 7 Presents the superoxide dismutase (SOD) activity in particulate pollutants, indicating significant differences via one-way ANOVA (p < 0.001). (A) indoor fan dust, (B) indoor AC dust, and (C) outdoor PM2.5. | |
3.3.4. Lipid peroxidation (LPO) activity.
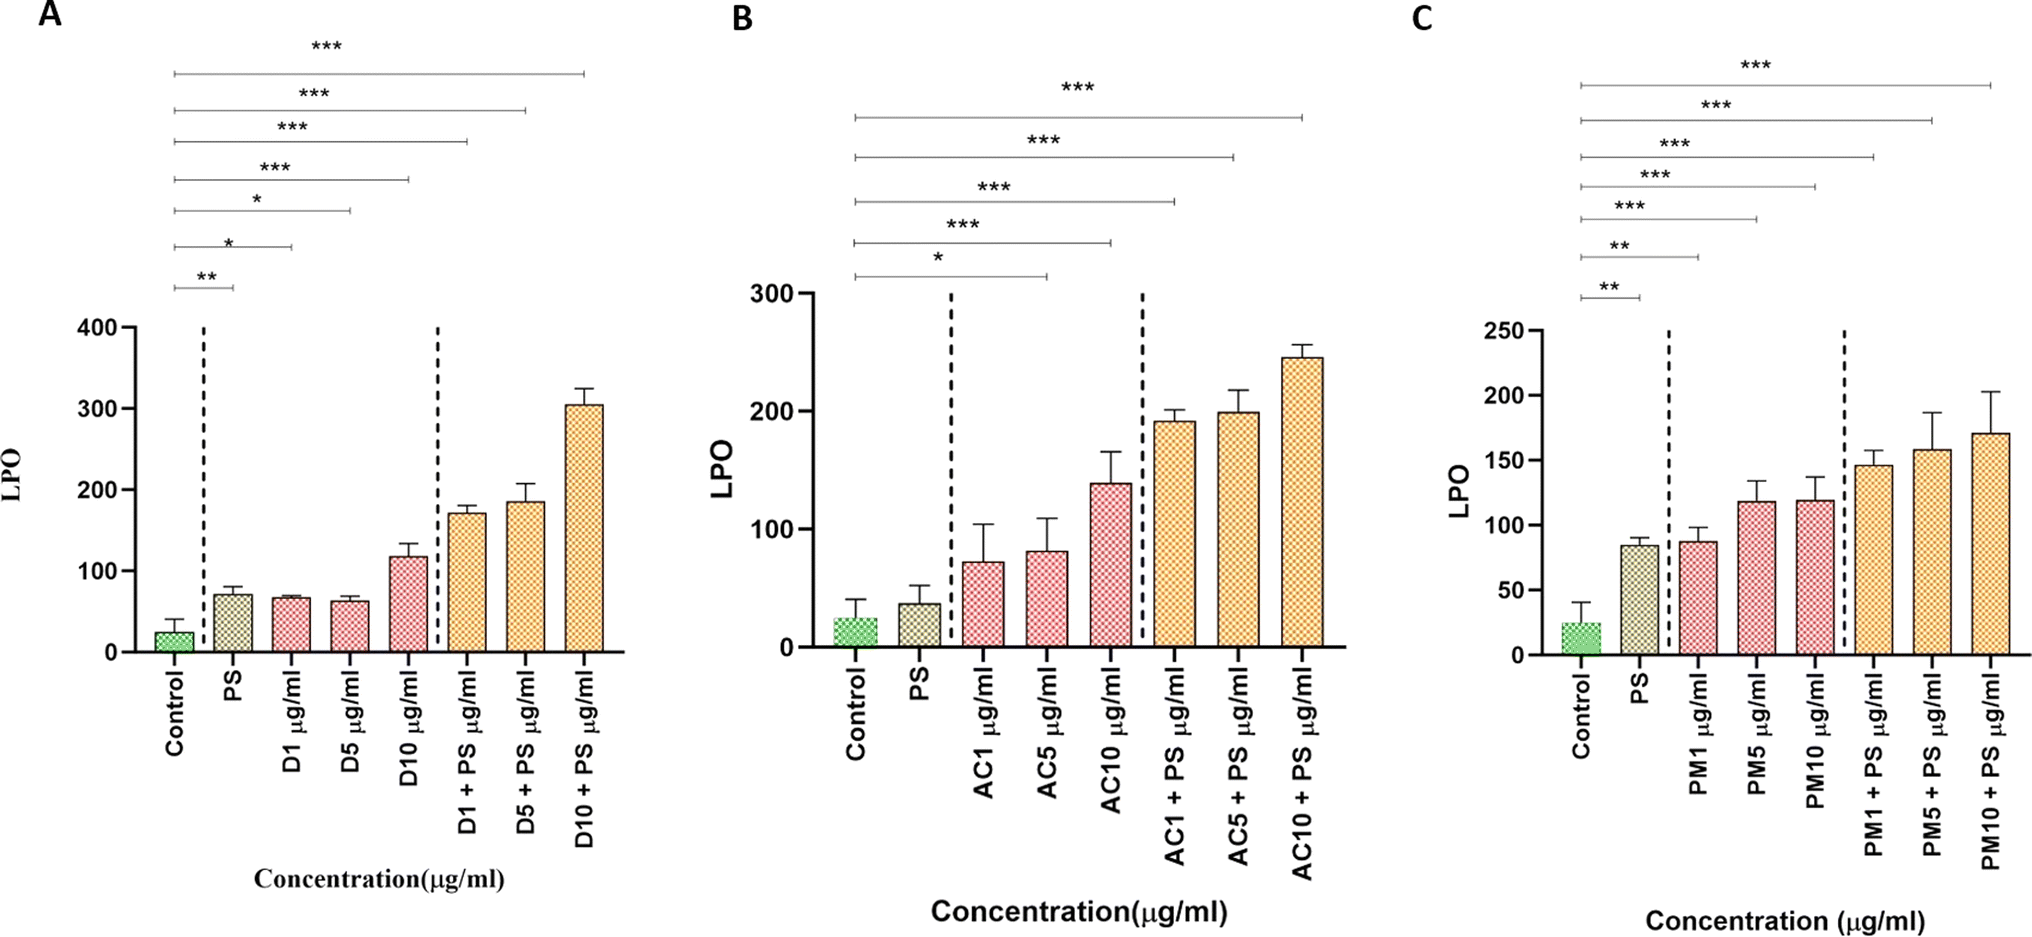
LPO-induced ROS leads to the production of Malondialdehyde (MDA) in cells, causing a reduction in lipid metabolism.55,56Fig. 8A illustrates significant differences in LPO levels between the control group and various concentrations of fan dust, both alone and combined with PS at 1 PPM. Exposure to fan dust, especially at higher concentrations and in combinations with PS, is implicated in elevated LPO. Similarly, in Fig. 8B, although there were no statistically significant changes at lower concentrations of AC dust alone or combined with PS, significant increases were observed at higher doses (AC5 and AC10 μg mL−1) with PS, indicating potential adverse effects on cellular lipid peroxidation. In Fig. 8C, exposure to outdoor pollutants of PM2.5, both alone and with PS, resulted in significant increases in LPO levels at all concentrations (PM1, PM5, PM10 μg mL−1) with PS, suggesting potential influences of particle pollution on cellular lipid peroxidation. The heightened levels of MDA in all exposure scenarios indicate a compromised antioxidant system, possibly due to oxidative stress exceeding the cellular antioxidant capacity. This implies that the interaction of particulate pollutants with PS contributes to elevated LPO and subsequent cellular damage.57 In summary, injective NPs exhibit adverse effects on growth, induce liver inflammation, and act as vectors for chemical contaminants. Limited studies have explored the impact of NPs on atmospheric particulate matter in urban settings, particularly regarding inhalation or ingestion.58,59 Studies also indicate that small-sized NPs, when interacting with respiratory or gastrointestinal epithelium cells, can penetrate cells and reach other organs, including the circulatory system.60
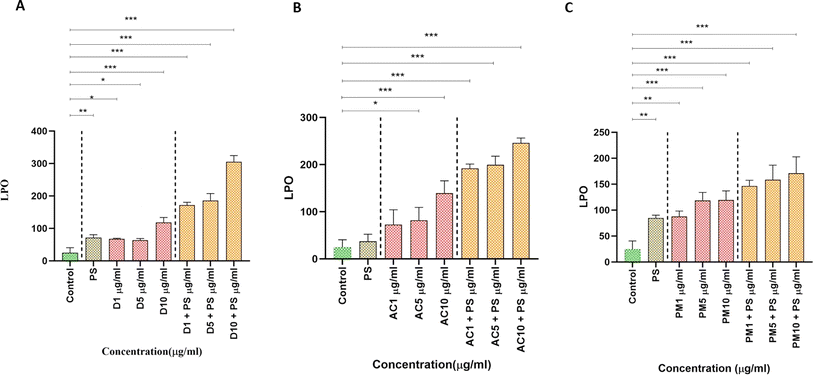 |
| | Fig. 8 Depicts the malondialdehyde (MDA) concentration in particulate pollutants alone or combined with PS, highlighting significant changes as per one-way ANOVA (p < 0.001). (A) indoor fan dust, (B) indoor AC dust, and (C) outdoor PM2.5. | |
4. Conclusions
The existence of NPs in the air could have severe health implications that have not been sufficiently addressed. This study is the first to verify the presence of breathable NPs in both indoor and outdoor air samples and to examine their toxicological effects on Artemia salina, a type of brine shrimp. Our findings indicate that NPs, particularly when mixed with PS, significantly increase ROS and MDA levels, indicating cellular damage and oxidative stress. We observed a decrease in SOD activity, suggesting potential harm to the enzyme system, while CAT activity indicated a compensatory response to oxidative stress. These results highlight the complex effects of NPs on cellular defense mechanisms and underscore the critical importance of understanding the sources, transmission, and impacts of NP pollution. Further research should focus on exploring the long-term effects of NP exposure, potential bioaccumulation in different species, and effective remediation techniques to mitigate NP pollution. These findings will be crucial in developing strategies to safeguard human health and aquatic ecosystems from the detrimental effects of particulate pollution.
Abbreviations
| PM | Particulate matter |
| ROS | Reactive oxygen species |
| MDA | Malondialdehyde |
| CAT | Catalase activity |
| PAHs | Polycyclic aromatic hydrocarbons |
| NPs | Nanoplastics |
| FTIR | Fourier transform infrared spectroscopy |
| PTFE | Polytetrafluoroethylene |
| ABS | Acrylamide butadiene styrene |
| EVA | Ethylene-vinyl acetate |
| LDPE | Low-density polyethylene |
| HDPE | High-density polystyrene |
| AC | Air conditioner |
| BMCT | Bonferroni multiple comparisons test |
| SOD | Superoxide dismutase |
| LPO | Lipid peroxidation |
| FE-SEM | Field emission scanning electron microscope |
| NSW | Natural seawater |
Data availability
Data will be made available on request.
Author contributions
Mohanraj Gopikrishnan, Subramanian kanimozhi, Ashwin Krn, George Priya Doss C., B. Srimuruganandam, Natarajan Chandrasekaran: conceptualization, investigation, methodology, formal analysis, writing – original draft, writing – review & editing, funding acquisition. Mohanraj Gopikrishnan, Subramanian kanimozhi, Ashwin Krn: formal analysis, visualization. George Priya Doss C., B. Srimuruganandam, Natarajan Chandrasekaran: investigation, project administration. George Priya Doss C., B. Srimuruganandam, Natarajan Chandrasekaran: methodology, funding acquisition.
Conflicts of interest
There are no conflicts to declare.
Acknowledgements
The authors would like to take this opportunity to thank the management of Vellore Institute of Technology (VIT), Vellore, Tamil Nadu, India, for providing the Field Emission Scanning electron microscope (FE-SEM) and encouragement to carry out this work.
References
- T. Gokul, K. R. Kumar, V. Veeramanikandan, A. Arun, P. Balaji and C. Faggio, Environ. Toxicol. Pharmacol., 2023, 100, 104146 CrossRef CAS PubMed.
- Y. Wang, L. Huang, C. Huang, J. Hu and M. Wang, Environ. Int., 2023, 172, 107752 CrossRef CAS PubMed.
-
C. Zaharia, Current topics, concepts and research priorities in environmental chemistry (III), 2014, pp. 221–244 Search PubMed.
- M. Inerb, W. Phairuang, P. Paluang, M. Hata, M. Furuuchi and P. Wangpakapattanawong, Atmosphere, 2022, 13, 626 CrossRef CAS.
- P. Suriyawong, S. Chuetor, H. Samae, S. Piriyakarnsakul, M. Amin, M. Furuuchi, M. Hata, M. Inerb and W. Phairuang, Heliyon, 2023, 9, e14261 CrossRef PubMed.
- Y. Nazzal, F. M. Howari, A. Yaslam, J. Iqbal, L. Maloukh, L. K. Ambika, A. A. Al-Taani, I. Ali, E. M. Othman, A. Jamal and M. Naseem, Atmosphere, 2022, 13, 1276 CrossRef CAS.
- C. E. Enyoh, A. W. Verla, E. N. Verla, F. C. Ibe and C. E. Amaobi, Environ. Monit. Assess., 2019, 191, 668 CrossRef CAS PubMed.
- I. B. Abaje, Y. Bello and S. A. Ahmad, J. Appl. Sci. Environ. Manage., 2020, 24, 373–379 CAS.
- P. Wang, Q. Zhang, Y. Li, J. Matsiko, Y. Zhang and G. Jiang, Environ. Sci.: Processes Impacts, 2017, 19, 983–999 RSC.
- X. Querol, A. Tobías, N. Pérez, A. Karanasiou, F. Amato, M. Stafoggia, C. Pérez García-Pando, P. Ginoux, F. Forastiere, S. Gumy, P. Mudu and A. Alastuey, Environ. Int., 2019, 130, 104867 CrossRef CAS PubMed.
- X. Querol, A. Alastuey, T. Moreno, M. M. Viana, S. Castillo, J. Pey, S. Rodríguez, B. Artiñano, P. Salvador, M. Sánchez, S. Garcia Dos Santos, M. D. Herce Garraleta, R. Fernandez-Patier, S. Moreno-Grau, L. Negral, M. C. Minguillón, E. Monfort, M. J. Sanz, R. Palomo-Marín, E. Pinilla-Gil, E. Cuevas, J. de la Rosa and A. Sánchez de la Campa, Atmos. Environ., 2008, 42, 3964–3979 CrossRef CAS.
- H. Kim, W.-H. Kim, Y.-Y. Kim and H.-Y. Park, Front. Public Health, 2020, 8, 575330 CrossRef PubMed.
- J. Zhang, Y. Liu, L. Cui, S. Liu, X. Yin and H. Li, Sci. Rep., 2017, 7, 11209 CrossRef PubMed.
- Y.-F. Xing, Y.-H. Xu, M.-H. Shi and Y.-X. Lian, J. Thorac. Dis., 2016, 8, E69–E74 Search PubMed.
- W. Xie, J. You, C. Zhi and L. Li, J. Appl. Toxicol., 2021, 41, 713–723 CrossRef CAS PubMed.
- H. Liu, W. Cui and M. Zhang, Sustain. Cities Soc., 2022, 80, 103783 CrossRef.
- I. Kousis, M. Manni and A. L. Pisello, Renewable Sustainable Energy Rev., 2022, 169, 112847 CrossRef.
-
A. Rodríguez-Seijo and R. Pereira, in Comprehensive Analytical Chemistry, ed. T. A. P. Rocha-Santos and A. C. Duarte, Elsevier, 2017, vol. 75, pp. 49–66 Search PubMed.
- B. S. S. Ramasamy and S. Palanisamy, Environ. Sci. Pollut. Res., 2021, 28, 43258–43273 CrossRef CAS PubMed.
- A. Bianco and M. Passananti, Sustainability, 2020, 12, 7327 CrossRef.
- R. Dris, J. Gasperi, C. Mirande, C. Mandin, M. Guerrouache, V. Langlois and B. Tassin, Environ. Pollut., 2017, 221, 453–458 CrossRef CAS PubMed.
- L. Cai, J. Wang, J. Peng, Z. Tan, Z. Zhan, X. Tan and Q. Chen, Environ. Sci. Pollut. Res. Int., 2017, 24, 24928–24935 CrossRef PubMed.
- R. Akhbarizadeh, S. Dobaradaran, M. Amouei Torkmahalleh, R. Saeedi, R. Aibaghi and F. Faraji Ghasemi, Environ. Res., 2021, 192, 110339 CrossRef CAS PubMed.
- I. Paul-Pont, K. Tallec, C. Gonzalez-Fernandez, C. Lambert, D. Vincent, D. Mazurais, J.-L. Zambonino-Infante, G. Brotons, F. Lagarde, C. Fabioux, P. Soudant and A. Huvet, Front. Mar. Sci., 2018, 5, 252 CrossRef.
-
M. Vighi, J. Bayo, F. Fernández-Piñas, J. Gago, M. Gómez, J. Hernández-Borges, A. Herrera, J. Landaburu, S. Muniategui-Lorenzo, A.-R. Muñoz, A. Rico, C. Romera-Castillo, L. Viñas and R. Rosal, in Reviews of Environmental Contamination and Toxicology, ed. P. de Voogt, Springer International Publishing, Cham, 2021, vol. 257, pp. 163–218 Search PubMed.
- M. S. Kabir, H. Wang, S. Luster-Teasley, L. Zhang and R. Zhao, Environ. Sci. Ecotechnol., 2023, 16, 100256 CrossRef CAS PubMed.
- R. Kumar, C. Manna, S. Padha, A. Verma, P. Sharma, A. Dhar, A. Ghosh and P. Bhattacharya, Chemosphere, 2022, 298, 134267 CrossRef CAS PubMed.
-
H. K. Karapanagioti and I. K. Kalavrouziotis, Microplastics in Water and Wastewater, IWA Publishing, 2019 Search PubMed.
- M. H. Rabin, Q. Wang, C. E. Enyoh, X. Kai and T. F. Sheuty, Environments, 2023, 10, 130 CrossRef.
- I. Ali, T. Ding, C. Peng, I. Naz, H. Sun, J. Li and J. Liu, Chem. Eng. J., 2021, 423, 130205 CrossRef CAS.
- S. Franzellitti, L. Canesi, M. Auguste, R. H. G. R. Wathsala and E. Fabbri, Environ. Toxicol. Pharmacol., 2019, 68, 37–51 CrossRef CAS PubMed.
- R. Trevisan, P. Ranasinghe, N. Jayasundara and R. T. Di Giulio, Toxics, 2022, 10, 326 CrossRef CAS PubMed.
- M. Hu and D. Palić, Redox Biol., 2020, 37, 101620 CrossRef CAS PubMed.
- G. Chen, Q. Feng and J. Wang, Sci. Total Environ., 2020, 703, 135504 CrossRef CAS PubMed.
- A. Salam, M. Assaduzzaman, M. N. Hossain and A. K. M. N. A. Siddiki, Open J. Air Pollut., 2015, 4, 99–108 CrossRef CAS.
-
M. A. Mohamed, J. Jaafar, A. F. Ismail, M. H. D. Othman and M. A. Rahman, in Membrane Characterization, ed. N. Hilal, A. F. Ismail, T. Matsuura and D. Oatley-Radcliffe, Elsevier, 2017, pp. 3–29 Search PubMed.
- M. R. Madhav, S. E. M. David, R. S. S. Kumar, J. S. Swathy, M. Bhuvaneshwari, A. Mukherjee and N. Chandrasekaran, Environ. Toxicol. Pharmacol., 2017, 52, 227–238 CrossRef CAS PubMed.
- V. V. Arun, N. Saharan, V. Ramasubramanian, A. M. Babitha Rani, K. R. Salin, R. Sontakke, H. Haridas and D. G. Pazhayamadom, Sci. Rep., 2017, 7, 40394 CrossRef CAS PubMed.
-
N. J. Kruger, in The Protein Protocols Handbook, ed. J. M. Walker, Humana Press, Totowa, NJ, 2009, pp. 17–24 Search PubMed.
- Y. Kono, Arch. Biochem. Biophys., 1978, 186, 189–195 CrossRef CAS PubMed.
- P. A. Athulya, Z. Sunil, S. Manzo and N. Chandrasekaran, J. Environ. Manage., 2023, 348, 119367 CrossRef CAS PubMed.
- Y. Li and H. E. Schellhorn, J. Biomol. Tech., 2007, 18, 185–187 Search PubMed.
- C.-G. Bornehag, B. Lundgren, C. J. Weschler, T. Sigsgaard, L. Hagerhed-Engman and J. Sundell, Environ. Health Perspect., 2005, 113, 1399–1404 CrossRef CAS PubMed.
- J. Zhu, X. Zhang, K. Liao, P. Wu and H. Jin, Sci. Total Environ., 2022, 833, 155256 CrossRef CAS PubMed.
- M. R. Jung, F. D. Horgen, S. V. Orski, V. C. Rodriguez, K. L. Beers, G. H. Balazs, T. T. Jones, T. M. Work, K. C. Brignac, S.-J. Royer, K. D. Hyrenbach, B. A. Jensen and J. M. Lynch, Mar. Pollut. Bull., 2018, 127, 704–716 CrossRef CAS PubMed.
- J.-H. Tsai, Y.-T. Lu, I.-I. Chung and H.-L. Chiang, Atmosphere, 2020, 11, 1015 CrossRef CAS.
- Y. N. Myat, J. Kongpran, U. Vattanasit and S. Tanaka, Case Stud. Chem. Environ. Eng., 2024, 9, 100682 CrossRef CAS.
- S. Abbasi, B. Keshavarzi, F. Moore, A. Turner, F. J. Kelly, A. O. Dominguez and N. Jaafarzadeh, Environ. Pollut., 2019, 244, 153–164 CrossRef CAS PubMed.
- T. Y. Suman, P.-P. Jia, W.-G. Li, M. Junaid, G.-Y. Xin, Y. Wang and D.-S. Pei, J. Hazard. Mater., 2020, 400, 123220 CrossRef CAS PubMed.
- U. S. Srinivas, B. W. Q. Tan, B. A. Vellayappan and A. D. Jeyasekharan, Redox Biol., 2019, 25, 101084 CrossRef CAS PubMed.
- M. Nishikawa, M. Hashida and Y. Takakura, Adv. Drug Delivery Rev., 2009, 61, 319–326 CrossRef CAS PubMed.
- G. R. Buettner, Anti-Cancer Agents Med. Chem., 2011, 11, 341–346 CrossRef CAS PubMed.
- S. A. Gurgueira, J. Lawrence, B. Coull, G. G. K. Murthy and B. González-Flecha, Environ. Health Perspect., 2002, 110, 749–755 CrossRef CAS PubMed.
- Z. Sunil, J. Thomas, A. Mukherjee and N. Chandrasekaran, Environ. Toxicol. Pharmacol., 2023, 101, 104205 CrossRef CAS PubMed.
- S. Abidli, M. Pinheiro, Y. Lahbib, T. Neuparth, M. M. Santos and N. Trigui El Menif, Environ. Sci. Pollut. Res., 2021, 28, 26643–26652 CrossRef CAS PubMed.
- E. B. Kurutas, Nutr. J., 2016, 15, 71 CrossRef PubMed.
- P. Mishra, S. Vinayagam, K. Duraisamy, S. R. Patil, J. Godbole, A. Mohan, A. Mukherjee and N. Chandrasekaran, Environ. Sci. Pollut. Res., 2019, 26, 1537–1547 CrossRef CAS PubMed.
- S. Abbasi, B. Keshavarzi, F. Moore, H. Delshab, N. Soltani and A. Sorooshian, Environ. Earth Sci., 2017, 76, 798 CrossRef.
- S. Dehghani, F. Moore and R. Akhbarizadeh, Environ. Sci. Pollut. Res., 2017, 24, 20360–20371 CrossRef CAS PubMed.
- J. C. Prata, Environ. Pollut., 2018, 234, 115–126 CrossRef CAS PubMed.
|
| This journal is © The Royal Society of Chemistry 2024 |
Click here to see how this site uses Cookies. View our privacy policy here. 
 Open Access Article
 This Open Access Article is licensed under a
  a,
Kanimozhi
Subramanian
b,
Ashwin
Krn
c,
George Priya
Doss C.
a,
Kanimozhi
Subramanian
b,
Ashwin
Krn
c,
George Priya
Doss C.