
 Open Access Article
 This Open Access Article is licensed under a
 Creative Commons Attribution 3.0 Unported Licence
Modeling study of the effects of entrainment-mixing on fog simulation in the chemistry–weather coupling model GRAPES_Meso5.1/CUACE CW
Yang
Zhao
 ab,
Hong
Wang
*a,
Xiaoqi
Xu
c,
Wenjie
Zhang
a,
Chen
Han
a,
Yue
Peng
a and
Chunsong
Lu
*b
ab,
Hong
Wang
*a,
Xiaoqi
Xu
c,
Wenjie
Zhang
a,
Chen
Han
a,
Yue
Peng
a and
Chunsong
Lu
*b
aState Key Laboratory of Severe Weather (LASW) & Key Laboratory of Atmospheric Chemistry of China Meteorological Administration, Chinese Academy of Meteorological Sciences (CAMS), Beijing, 100081, China. E-mail: wangh@cma.gov.cn
bChina Meteorological Administration Aerosol-Cloud and Precipitation Key Laboratory/Collaborative Innovation Centre on Forecast and Evaluation of Meteorological Disasters (CIC-FEMD), Nanjing University of Information Science and Technology, Nanjing 210044, China. E-mail: clu@nuist.edu.cn
cNanjing Joint Institute for Atmospheric Sciences, Nanjing, China
First published on 19th February 2024
Abstract
Entrainment-mixing processes of fog with the surrounding ambient air are extremely intricate and impose significant effects on the microphysical and radiative properties of fog. However, it is difficult to utilize the default Thompson scheme of the atmospheric chemistry model GRAPES_Meso5.1/CUACE to examine the effects of different entrainment-mixing mechanisms on the microphysical and radiative properties of fog. To address this issue, this scheme is modified to include homogeneous mixing degree to investigate the effects of various entrainment-mixing processes on typical regional fog simultaneously occurring in the Northeast China and Yangtze River Delta regions from December 31, 2016, to January 2, 2017, and from January 6 to 8, 2017. It is revealed that inhomogeneous entrainment-mixing processes can result in smaller fog droplet number concentration and lower liquid water path, and larger fog droplet size. These phenomena, in turn, can lead to a decreased fog optical thickness and increased visibility. Furthermore, the effects of inhomogeneous entrainment-mixing processes depend on fog thickness, i.e., the effects in thin fog in the Northeast China region are more significant than those in thick fog in the Yangtze River Delta region. This primarily occurs because the proportion of evaporated grids in thin fog is higher than that in thick fog by 16% and 6%, respectively. These findings enhance the theoretical understanding of entrainment-mixing processes and lay the foundation for improving model parameterization.
Environmental significanceEntrainment-mixing processes of fog with its surrounding ambient air alter the atmospheric temperature and humidity by influencing the microphysical properties of fog. Homogeneous mixing degree, which can be modified to any value between 0 and 1 to represent different entertainment-mixing processes, is introduced to the default Thompson scheme within the chemistry-atmosphere model GRAPES_Meso5.1/CUACE CW and the impacts of different entertainment-mixing processes on regional-scale fog events in two typical regions with different meteorology backgrounds, Northeast China region and the Yangtze River Delta region, are studied. The study examines the effects of various entrainment mixing processes on the microphysical and radiative properties of regional fog at different depths and provides an explanation of the underlying mechanism. |
1 Introduction
Covering 65–70% of the Earth, clouds play a crucial role in the global radiation budget and atmospheric hydrological cycle.1,2 By reflecting solar radiation to space and trapping longwave radiation in the Earth-atmosphere system, clouds significantly affect the energy balance of the Earth-atmosphere system.3–6 Additionally, extreme weather events are closely connected to microphysical processes in clouds.7–10 Therefore, it is highly necessary to investigate cloud microphysics and associated radiative effects in depth. The entrainment-mixing process is one of the cloud microphysical processes with high uncertainty. In this process, unsaturated environmental air is entrained into clouds, and the environmental air and clouds are mixed, causing cloud droplets to evaporate. entrainment-mixing processes can impose significant effects on the microphysical and radiative properties of clouds,11–24 which in turn can influence warm rain initiation,25,26 cloud–climate feedbacks,12,27 and aerosol indirect effects.28–32 Fog is essentially a type of near-surface cloud. The microphysical properties, radiative properties, and key quantity visibility (Vis) are also influenced by the entrainment-mixing processes caused by boundary layer turbulence during the fog lifecycle.However, very little research has been conducted focusing on the entrainment-mixing processes in fog. Telford and Chai utilized aircraft observational data and found that the turbulence in fog is weak.33 They observed that fog droplets are entrained and diluted, resulting in nearly constant fog droplet sizes but significant changes in the fog droplet number concentrations. Wu et al. analyzed near-surface observational data and found that extremely inhomogeneous entrainment-mixing processes dominate at the mature stage of fog, while homogeneous entrainment-mixing processes prevail at the dissipation stage.34 In terms of simulation, Yang and Gao considered entrainment near the fog top, which improved the simulation process and yielded closer results to the observations.27
The most frequently accepted notions regarding entrainment-mixing processes are homogeneous and inhomogeneous entertainment-mixing processes.35,36 In homogeneous entertainment-mixing processes, turbulence is strong, and the mixing of cloud droplets with environmental air occurs faster than the evaporation of cloud droplets. As a result, all the cloud/fog droplets evaporate simultaneously, while the cloud/fog droplet number remains constant. In extremely inhomogeneous entertainment-mixing processes, turbulence is weak, and evaporation occurs faster than mixing, leading to the complete evaporation of cloud/fog droplets close to the surrounding air, while the sizes of other cloud/fog droplets remain unchanged. Inhomogeneous entertainment-mixing processes lie between these two extreme cases. Several studies have indicated the dominance of homogeneous entrainment-mixing processes in clouds,37,38 while others have shown that extremely inhomogeneous entrainment-mixing processes dominate.39–42 Additionally, studies have shown that entrainment-mixing processes can occur somewhere in the middle.15,43 The dominant entrainment-mixing processes in clouds are related to the cloud type, development stage, location in the clouds, and other factors.
Numerous studies have been conducted utilizing observational data to study entrainment-mixing processes. Lu et al. discovered that in shallow cumulus clouds, entrainment-mixing processes become increasingly inhomogeneous with increasing timescale.44 Gao et al. further found that entrainment-mixing processes become increasingly homogeneous or inhomogeneous with increasing aircraft sampling scale in stratocumulus clouds.45 Desai et al. focused on warm marine stratocumulus clouds and found that entrainment-mixing processes are largely inhomogeneous near the cloud top and homogeneous near the cloud base.46 Yum et al. and Yeom et al. found that inhomogeneous mixing dominates near the cloud top, while homogeneous mixing is stronger at lower altitudes due to vertical circulation mixing.47,48 Moreover, Yeom et al. found that the clouds are locally inhomogeneous but globally homogeneous entrainment mixing, by injecting dry air with different temperatures and flow rates in the Pi cloud chamber.49
In addition to observational studies, modeling studies have been conducted. Xu et al. found that inhomogeneous entrainment-mixing processes dominate in stratocumulus clouds, especially against the background of high aerosol number concentrations, while homogeneous entrainment-mixing processes dominate in cumulus clouds. Moreover, both stratocumulus and cumulus clouds exhibit higher entrainment-mixing inhomogeneity at the mature stage than at the dissipation stage.50 Furthermore, Kumar et al. conducted numerous relevant studies through direct numerical simulations (DNS) and found that Dam Kohler number, the ratio of the mixing time to the evaporation time, can well describe the evolution of entrainment-mixing processes; the probability density function of supersaturation at cloud droplet locations initially exhibits high negative skewness and the droplet size distribution broadens significantly.51,52 Additionally, they found that inhomogeneous mixing becomes increasingly significant with increasing domain size.53 Grabowski adopted a cloud-resolving model and found that, assuming homogeneous mixing, the amount of solar energy reaching the surface in the pristine cloud case matches that in the polluted cloud case with extremely inhomogeneous mixing.54 Lasher-Trapp et al. used a three-dimensional cloud model coupled with a Lagrangian microphysical parcel model and found that with increasing degree of inhomogeneity of the entrainment-mixing processes, the cloud number concentrations decrease, and the cloud droplet scale increases.55 Tölle and Krueger employed the EMPM model and found that the cloud droplet spectrum broadens during entrainment-mixing processes.56
Despite the extensive studies of the entrainment-mixing processes and mechanisms in cloud/fog, our understanding of their effects on cloud/fog microphysical and radiative properties remains incomplete. To address this gap, we modify the default Thompson scheme by introducing homogeneous mixing degree (ψ) to investigate the effects of various entrainment-mixing processes on cloud/fog. The remainder of this paper is organized as follows: in Section 2, the GRAPES_Meso5.1/CUACE atmospheric chemical coupling model, Thompson cloud microphysical scheme, entrainment-mixing parameterization, data used, and simulation cases are described in detail. Model evaluation, the effects of different entrainment-mixing processes and physical mechanisms are presented and examined in Section 3. Conclusions are outlined in Section 4.
2 Model and methods
2.1 GRAPES_Meso5.1/CUACE model
The GRAPES_Meso5.1/CUACE atmospheric chemical coupling model was established by online integration of the updated version GRAPES_Meso5.1 with the CUACE atmospheric chemical module.57,58 The GRAPES_Meso model, developed by Chen and Shen,59 includes a fully compressible nonhydrostatic model core and a physical parameterization package.60 The dynamic framework is used to simulate large-scale horizontal and vertical transport, as well as diffusion processes for all gases and aerosols.61 The physical parameterization package covers clouds and precipitation processes, boundary layer processes, land surface processes, and radiative transfer processes.62 The CUACE module incorporates an emission inventory system, CAM aerosol module, regional acid deposition model (RADM2), and gas-particle transformation-related processes.63,64 The anthropogenic emission data for the input model are obtained from the Multiresolution Emission Inventory for China (MEIC) developed by Tsinghua University in December 2016.65 This inventory provides monthly gridded 0.1° × 0.1° emission data, considering the electricity, industry, civil, transportation, and agriculture sectors, and it is assigned 32 types of emission species corresponding to the CUACE chemical system. After key meteorological parameters, such as temperature, humidity, wind velocity, and atmospheric pressure, which are obtained from the GRAPES_Meso5.1 model, are entered along with emission data into the CUACE module, real-time information on the aerosol number concentrations, aerosol component, and aerosol droplet scale is obtained. These data are subsequently fed back into the dynamic framework of the GRAPES_Meso5.1 model. By utilizing the cloud microphysical schemes and the radiation schemes of the GRAPES_Meso5.1 model, the microphysical and radiative properties of hydrometeors, as well as the radiative budget of the Earth-atmosphere system, can be obtained. This allows for the realization of two-way chemistry-weather feedback.This model has been extensively applied in research related to dust,66,67 haze/fog, and visibility (Vis) simulation.57,58,68–71 Additionally, it has been applied to evaluate various cloud microphysical schemes by simulating cloud microphysical properties and precipitation. Moreover, it has been used to investigate the effects of the cloud condensation nuclei concentrations on cloud microphysical and radiative properties.72,73 Zhang et al. replaced the assumed aerosol number concentrations in the Thompson scheme in the GRAPES_Meso5.1/CUACE model with the real-time simulated aerosol number concentrations simulated by the CUACE module.70 They investigated real-time aerosol–cloud interactions, with a particular focus on regions experiencing high aerosol pollution levels.
The physical parameterization schemes selected in this study include the rapid radiative transfer model (RRTM) longwave radiation scheme,74 the Goddard shortwave radiation scheme,75 the Noah land surface scheme,76 the Mellor–Yamada–Janjic (MYJ) Monin–Obukhov surface layer scheme, the Mellor–Yamada–Janjic (MYJ) turbulent kinetic energy (TKE) boundary layer scheme,77 the KF-eta cumulus convection scheme,78 and the Thompson cloud microphysics scheme.79
2.2 Thompson cloud microphysics scheme
The Thompson bulk cloud microphysical parameterization scheme is designed to treat five separate water species: cloud water, cloud ice, rain, snow, and a hybrid graupel–hail category. Previous versions of this scheme entailed the use of a single moment (mixing ratios) for the prediction of certain water species (cloud water, snow, and graupel) while utilizing double moments (mixing ratios and number concentrations) for the prediction of cloud ice and rain. The recent version of the scheme incorporates the activation of aerosols as cloud condensation nuclei and ice nuclei.80 Furthermore, Zhang et al. replaced the assumed aerosol number concentrations in this updated Thompson scheme with the real-time simulated aerosol number concentrations simulated by the CUACE module.70 This modification allows for real-time activation of aerosols.2.3 Introduction of entrainment-mixing parameterization
The role of the entrainment-mixing processes in microphysical schemes is generally expressed as follows:81 | (1) |
| α = 1 − ψ | (2) |
2.4 Data
Hourly observational data, including relative humidity (RH) and Vis, are provided by China's national surface stations of the China Meteorological Administration. Daily liquid water path (LWP) and cloud/fog optical thickness (C/FOT) data are derived from the combined Aqua and Terra Moderate Resolution Imaging Spectroradiometer (MODIS) Cloud Properties product with a spatial resolution of 1° (https://ladsweb.modaps.eosdis.nasa.gov/search/order/1/MCD06COSP_D3_MODIS—62; last access: 26 June 2023). The final analysis (FNL) data of the National Centers for Environmental Prediction (temporal resolution: 6 h; spatial resolution: 0.25°) are used as the initial fields and boundary conditions of the model.2.5 Fog cases and experimental design
The majority of eastern China is included in the model simulation region, which spans from 100–135°E and 20–50°N, with a horizontal resolution of 0.1°, 49 vertical layers, and a model top height of approximately 31 km. The latitude and longitude ranges for the study regions are as follows: 42–46°N, 122.5–127.5°E for the Northeast China region, and 29–34°N, 116–122°E for the Yangtze River Delta region.
Fig. 1 shows the observed Vis and RH from China's national surface stations in Case 1. The red and green rectangles indicate the Northeast China and Yangtze River Delta regions, respectively. As shown in Fig. 1, the Vis values in the Northeast China region were generally greater than 7 km, and the RH values remained less than 65% at 07:00 UTC on January 6. By 12:00 UTC on January 7, the RH values increased, resulting in a decrease in Vis values across most regions. The Vis values decreased below 4 km, with the RH values exceeding 80%, and some stations even recorded Vis values lower than 1 km and RH values higher than 90%, indicating a gradual fog thickening during this period. By 6:00 UTC on January 8, the fog had gradually dissipated with decreasing RH and increasing Vis. Fig. 2, which is a true color satellite cloud map from the NASA Worldview website (https://worldview.earthdata.nasa.gov/), along with Fig. 1, reveal the presence of fog in the Northeast China region and surface fog accompanied by clouds in the sky in the Yangtze River Delta region on January 7. For simplicity, both regions are referred to as cloud/fog without further clarification. Fig. 3 shows the observed Vis and RH from China's national surface stations in Case 2. At 08:00 UTC on December 31, the Vis values in most parts of the Yangtze River Delta region were greater than 6 km, with RH values less than 65%. However, over time, Vis started to gradually decrease, and RH increased. By 12:00 UTC on January 1, several central areas in the Yangtze River Delta region exhibited Vis values less than 1 km, with the RH values exceeding 90%. However, by 6:00 UTC on January 2, the fog had gradually dissipated. In comparison, fog occurred earlier in the Northeast China region than in the Yangtze River Delta region. During the period from 11:00 UTC on December 31 to 12:00 UTC on January 1, some southwestern parts of the Northeast China region exhibited Vis values less than 1 km, and the RH values consistently exceeded 90%. However, by 6:00 on January 2, the Vis values in most areas exceeded 10 km, the RH values were less than 65%, and the fog had gradually dissipated. The entire simulation period ranges from December 31, 2016, to January 8, 2017. The simulation period in Case 1 ranges from January 6 to 8, 2017. To compare the fog in the two regions consistently, January 7 is selected as the study period in Case 1. In Case 2, the simulation period ranges from December 31, 2016, to January 2, 2017. The same treatment as that in Case 1 is used: to compare the fog in the two regions consistently, January 1, 2017, is selected as the study period in Case 2. The surface station observational data of RH and Vis is utilized to determine the occurrence of fog during the study period.
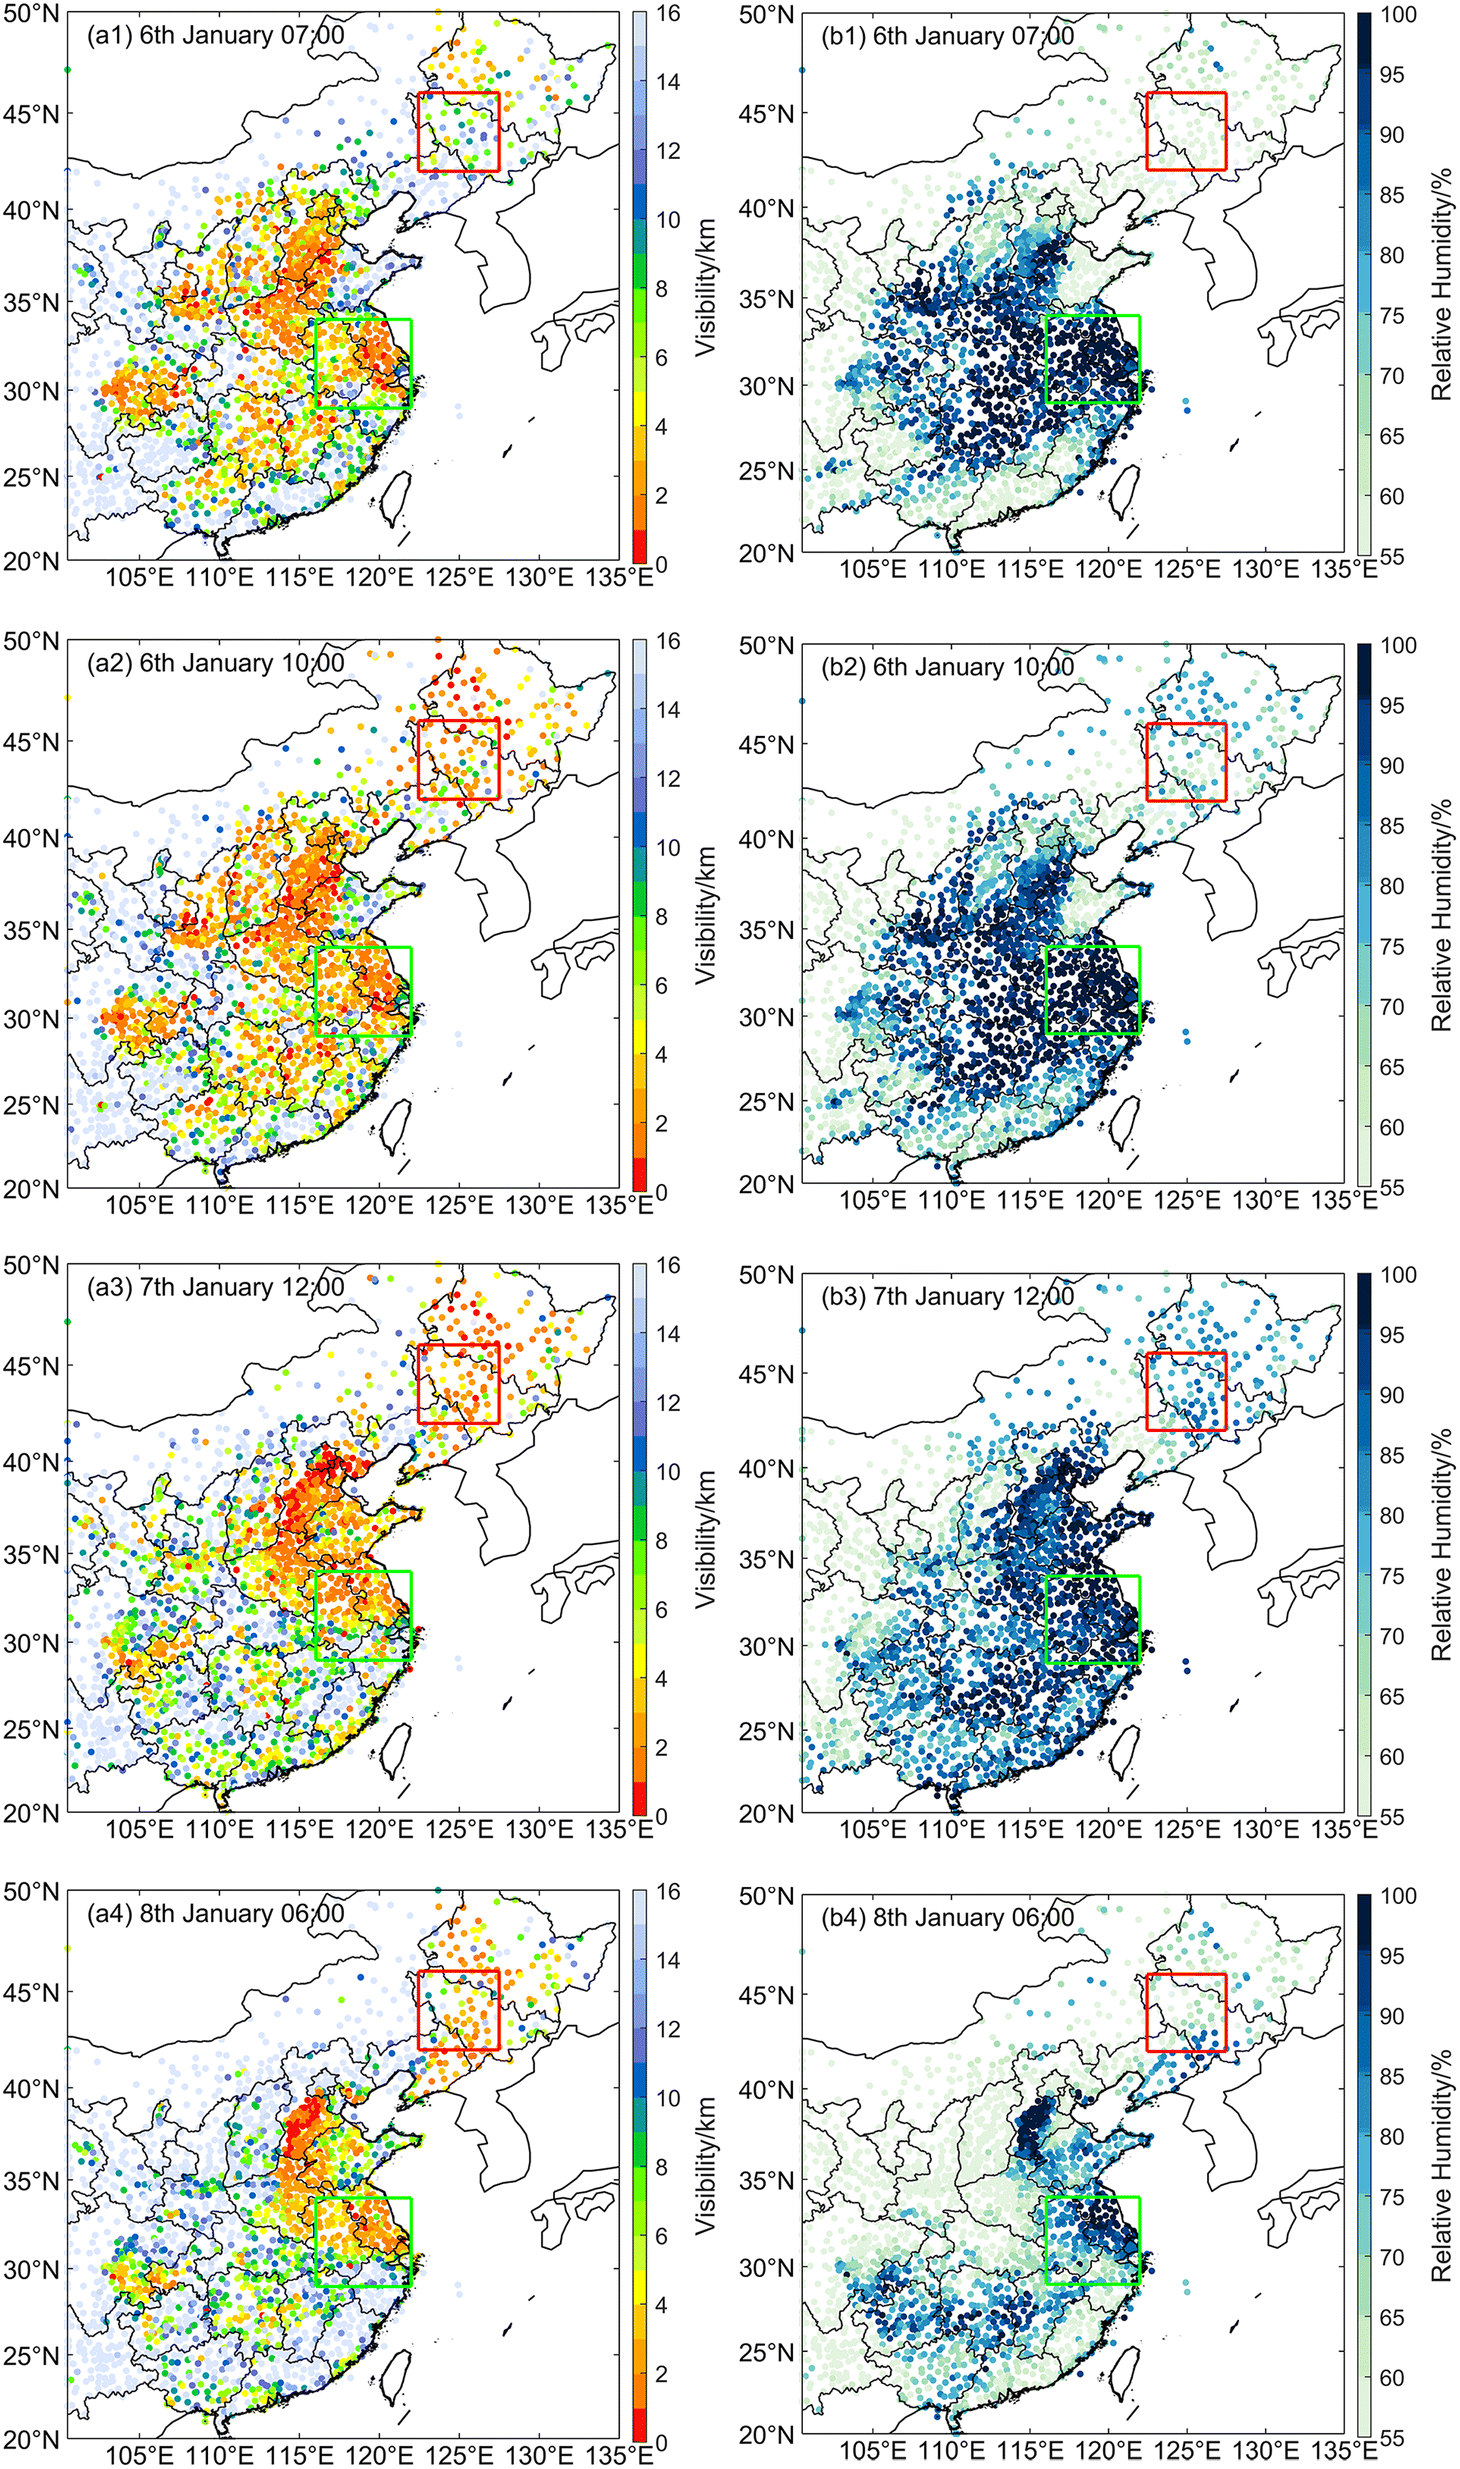 | ||
| Fig. 1 Observed visibility (Vis, left column) and relative humidity (RH, right column) at China's national surface stations in Case 1 (the red and green rectangles indicate the Northeast China and Yangtze River Delta regions, respectively). | ||
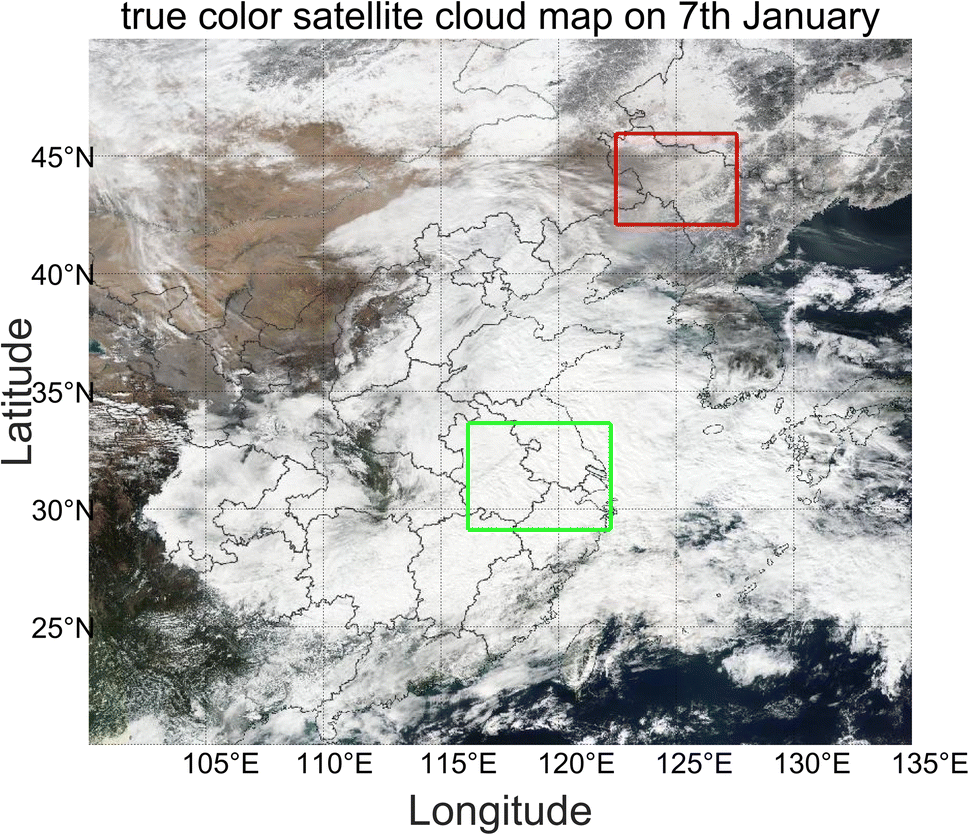 | ||
| Fig. 2 True color satellite cloud map from the NASA Worldview website on 7 January 2017 (the red and green rectangles indicate the Northeast China and Yangtze River Delta regions, respectively). | ||
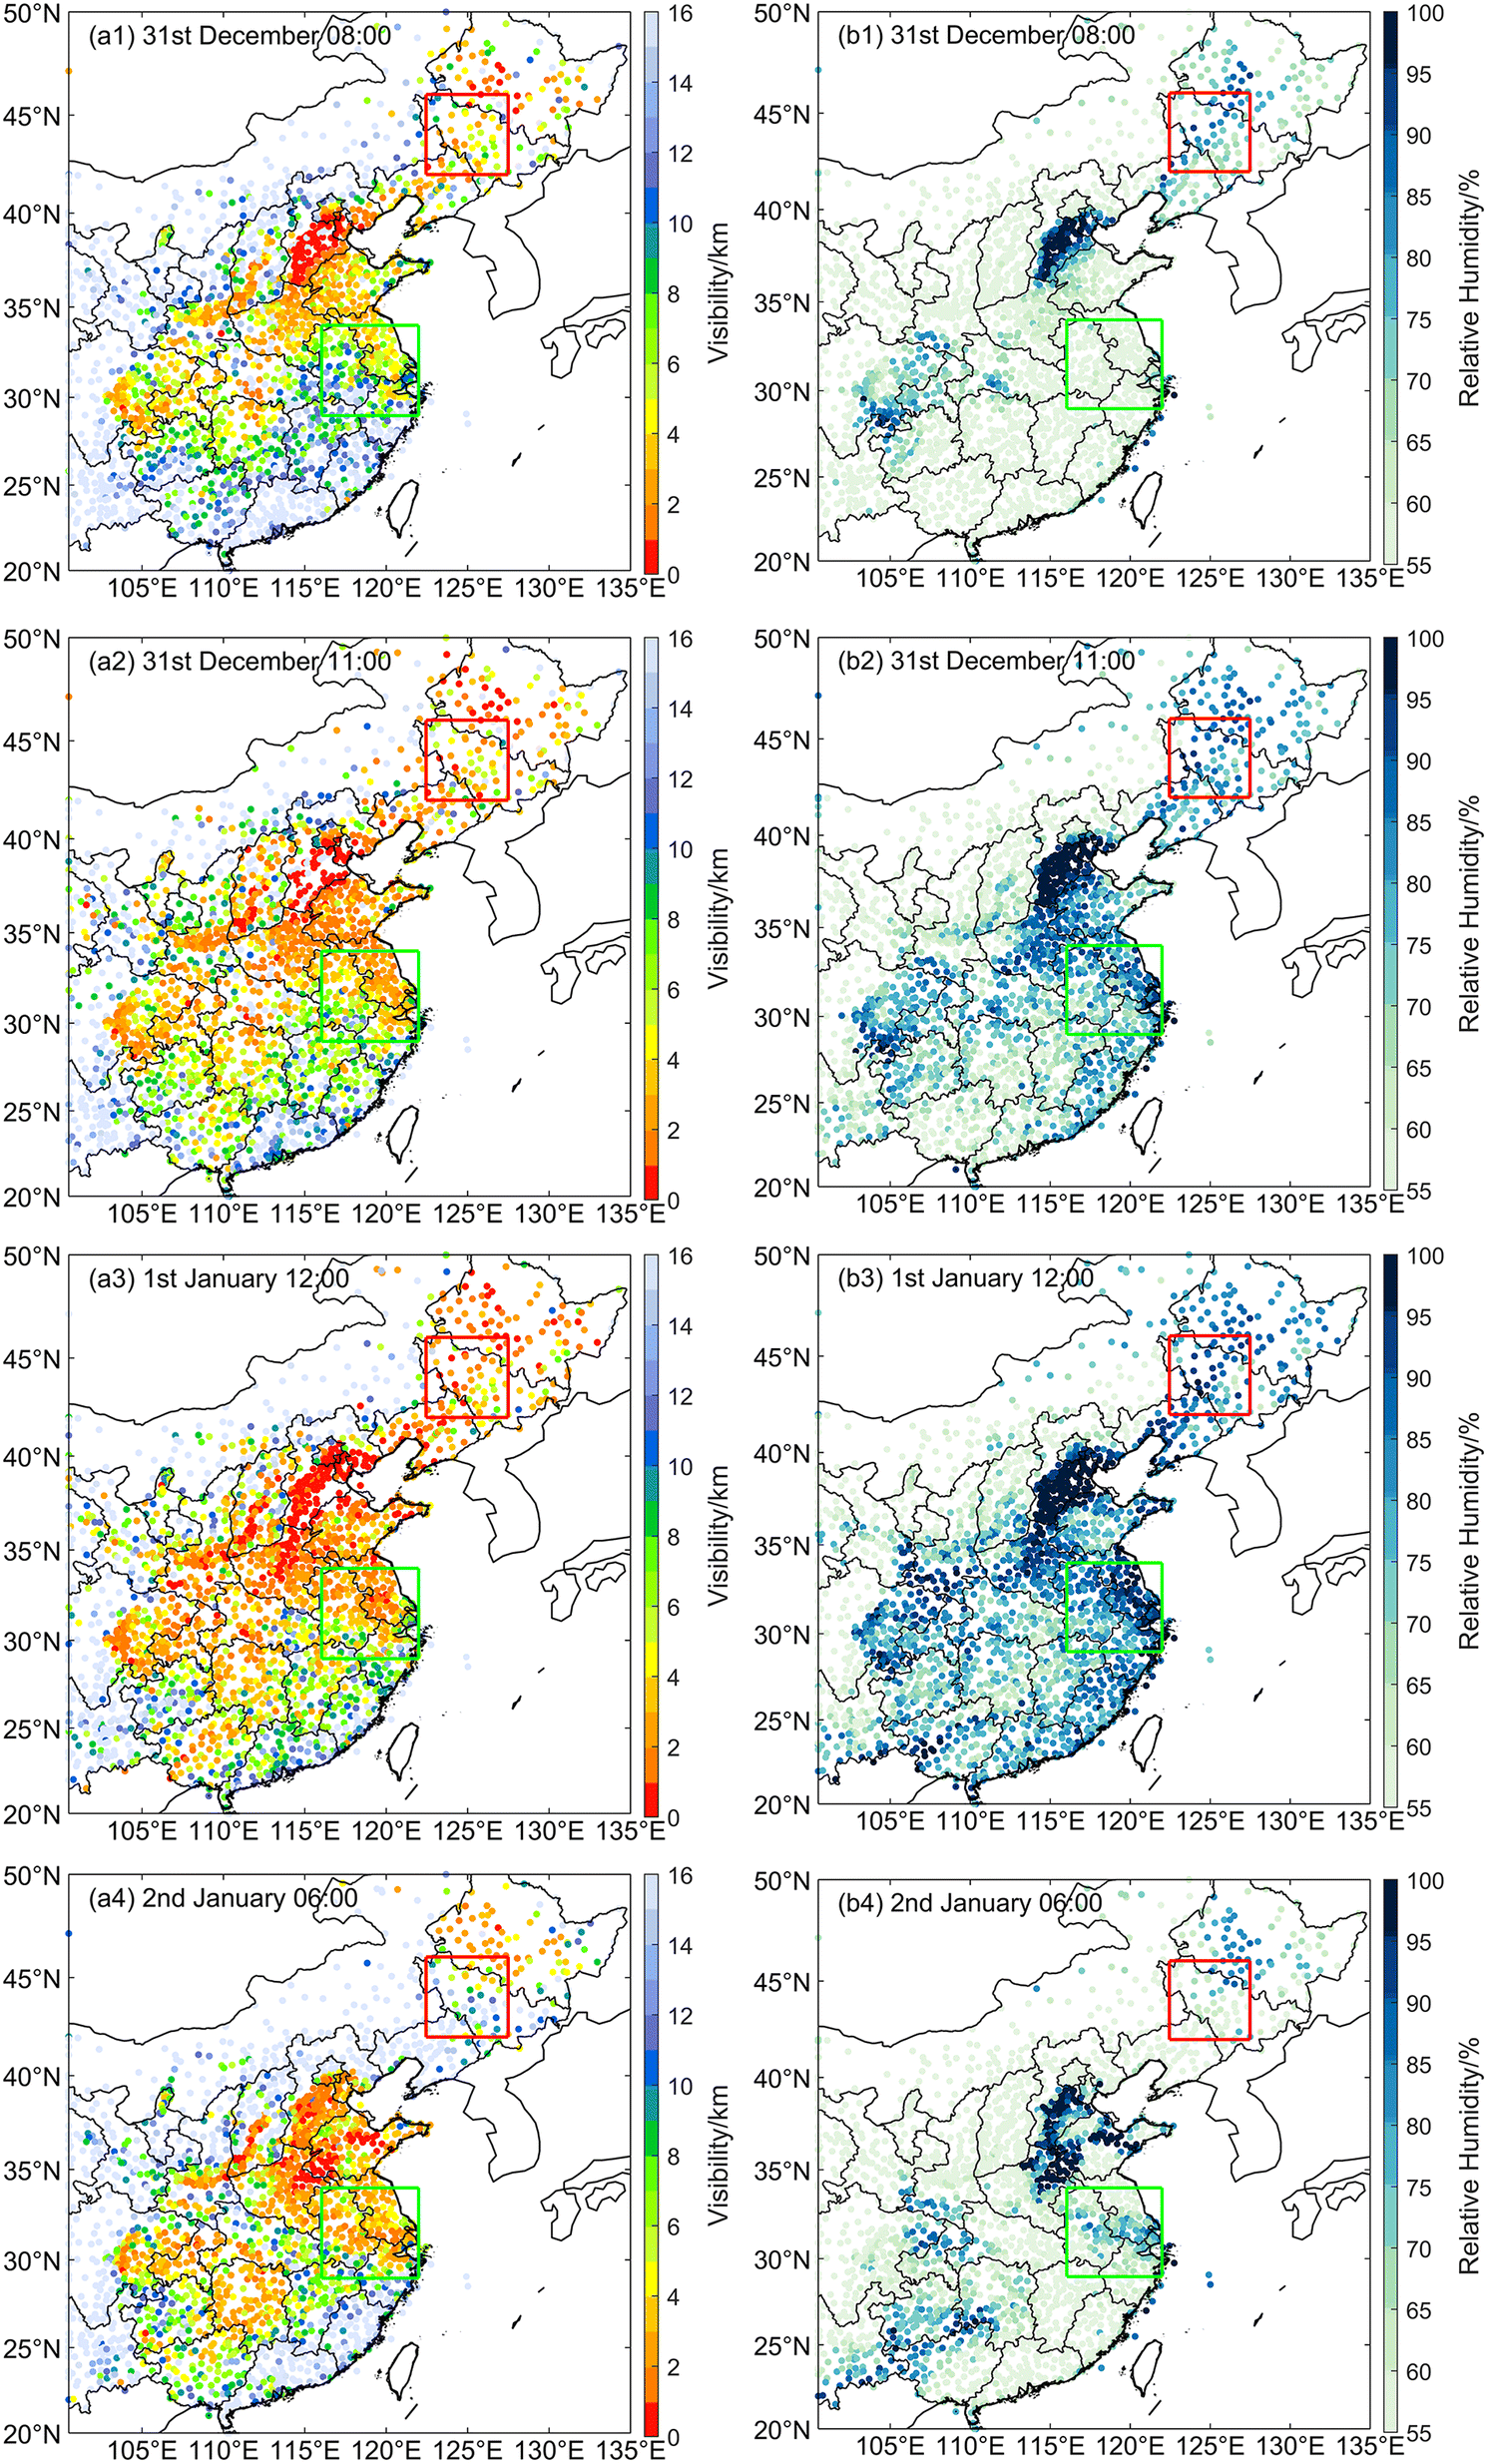 | ||
| Fig. 3 Observed visibility (Vis, left column) and relative humidity (RH, right column) at China's national surface stations in Case 2 (the red and green rectangles indicate the Northeast China and Yangtze River Delta regions, respectively). | ||
The parameter ψ can be set to any value between 0 and 1 to represent the degree of homogeneity of the subgrid entrainment-mixing processes. Here, ψ is set to 1 (homogeneous entrainment-mixing processes), 0.5, and 0 (extremely inhomogeneous entrainment-mixing processes) to explore the effects of various entrainment-mixing processes on the microphysical and radiative properties of cloud/fog, as well as to compare the microphysical and radiative properties of cloud/fog in the Northeast China and Yangtze River Delta regions with different ψ values.
3 Results
3.1 Model evaluation
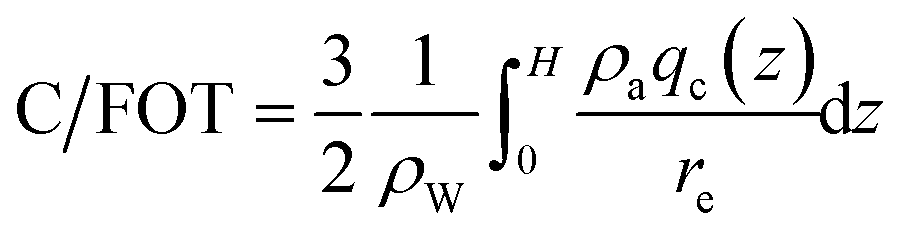
The entire simulation period (ranging from December 31, 2016, to January 8, 2017) is chosen for model evaluation. Fig. 4 shows the horizontal distributions of the mean LWP, RH, and Vis for both the observed and simulated over the entire simulated period. In Fig. 4 a1 and a2, the simulated LWP is close to the observations in the Yangtze River Delta and Northeast China regions, respectively. However, the simulations in the northeastern region of the Northeast China region yield lower values than the observations. Additionally, Fig. 4b1 and b2 show that the simulated RH in both regions is similar to the observed RH. Regarding Vis, Fig. 4c1 and c2 reveal that there is a high degree of consistency between the observed and simulated Vis data in terms of the spatial distribution and variation.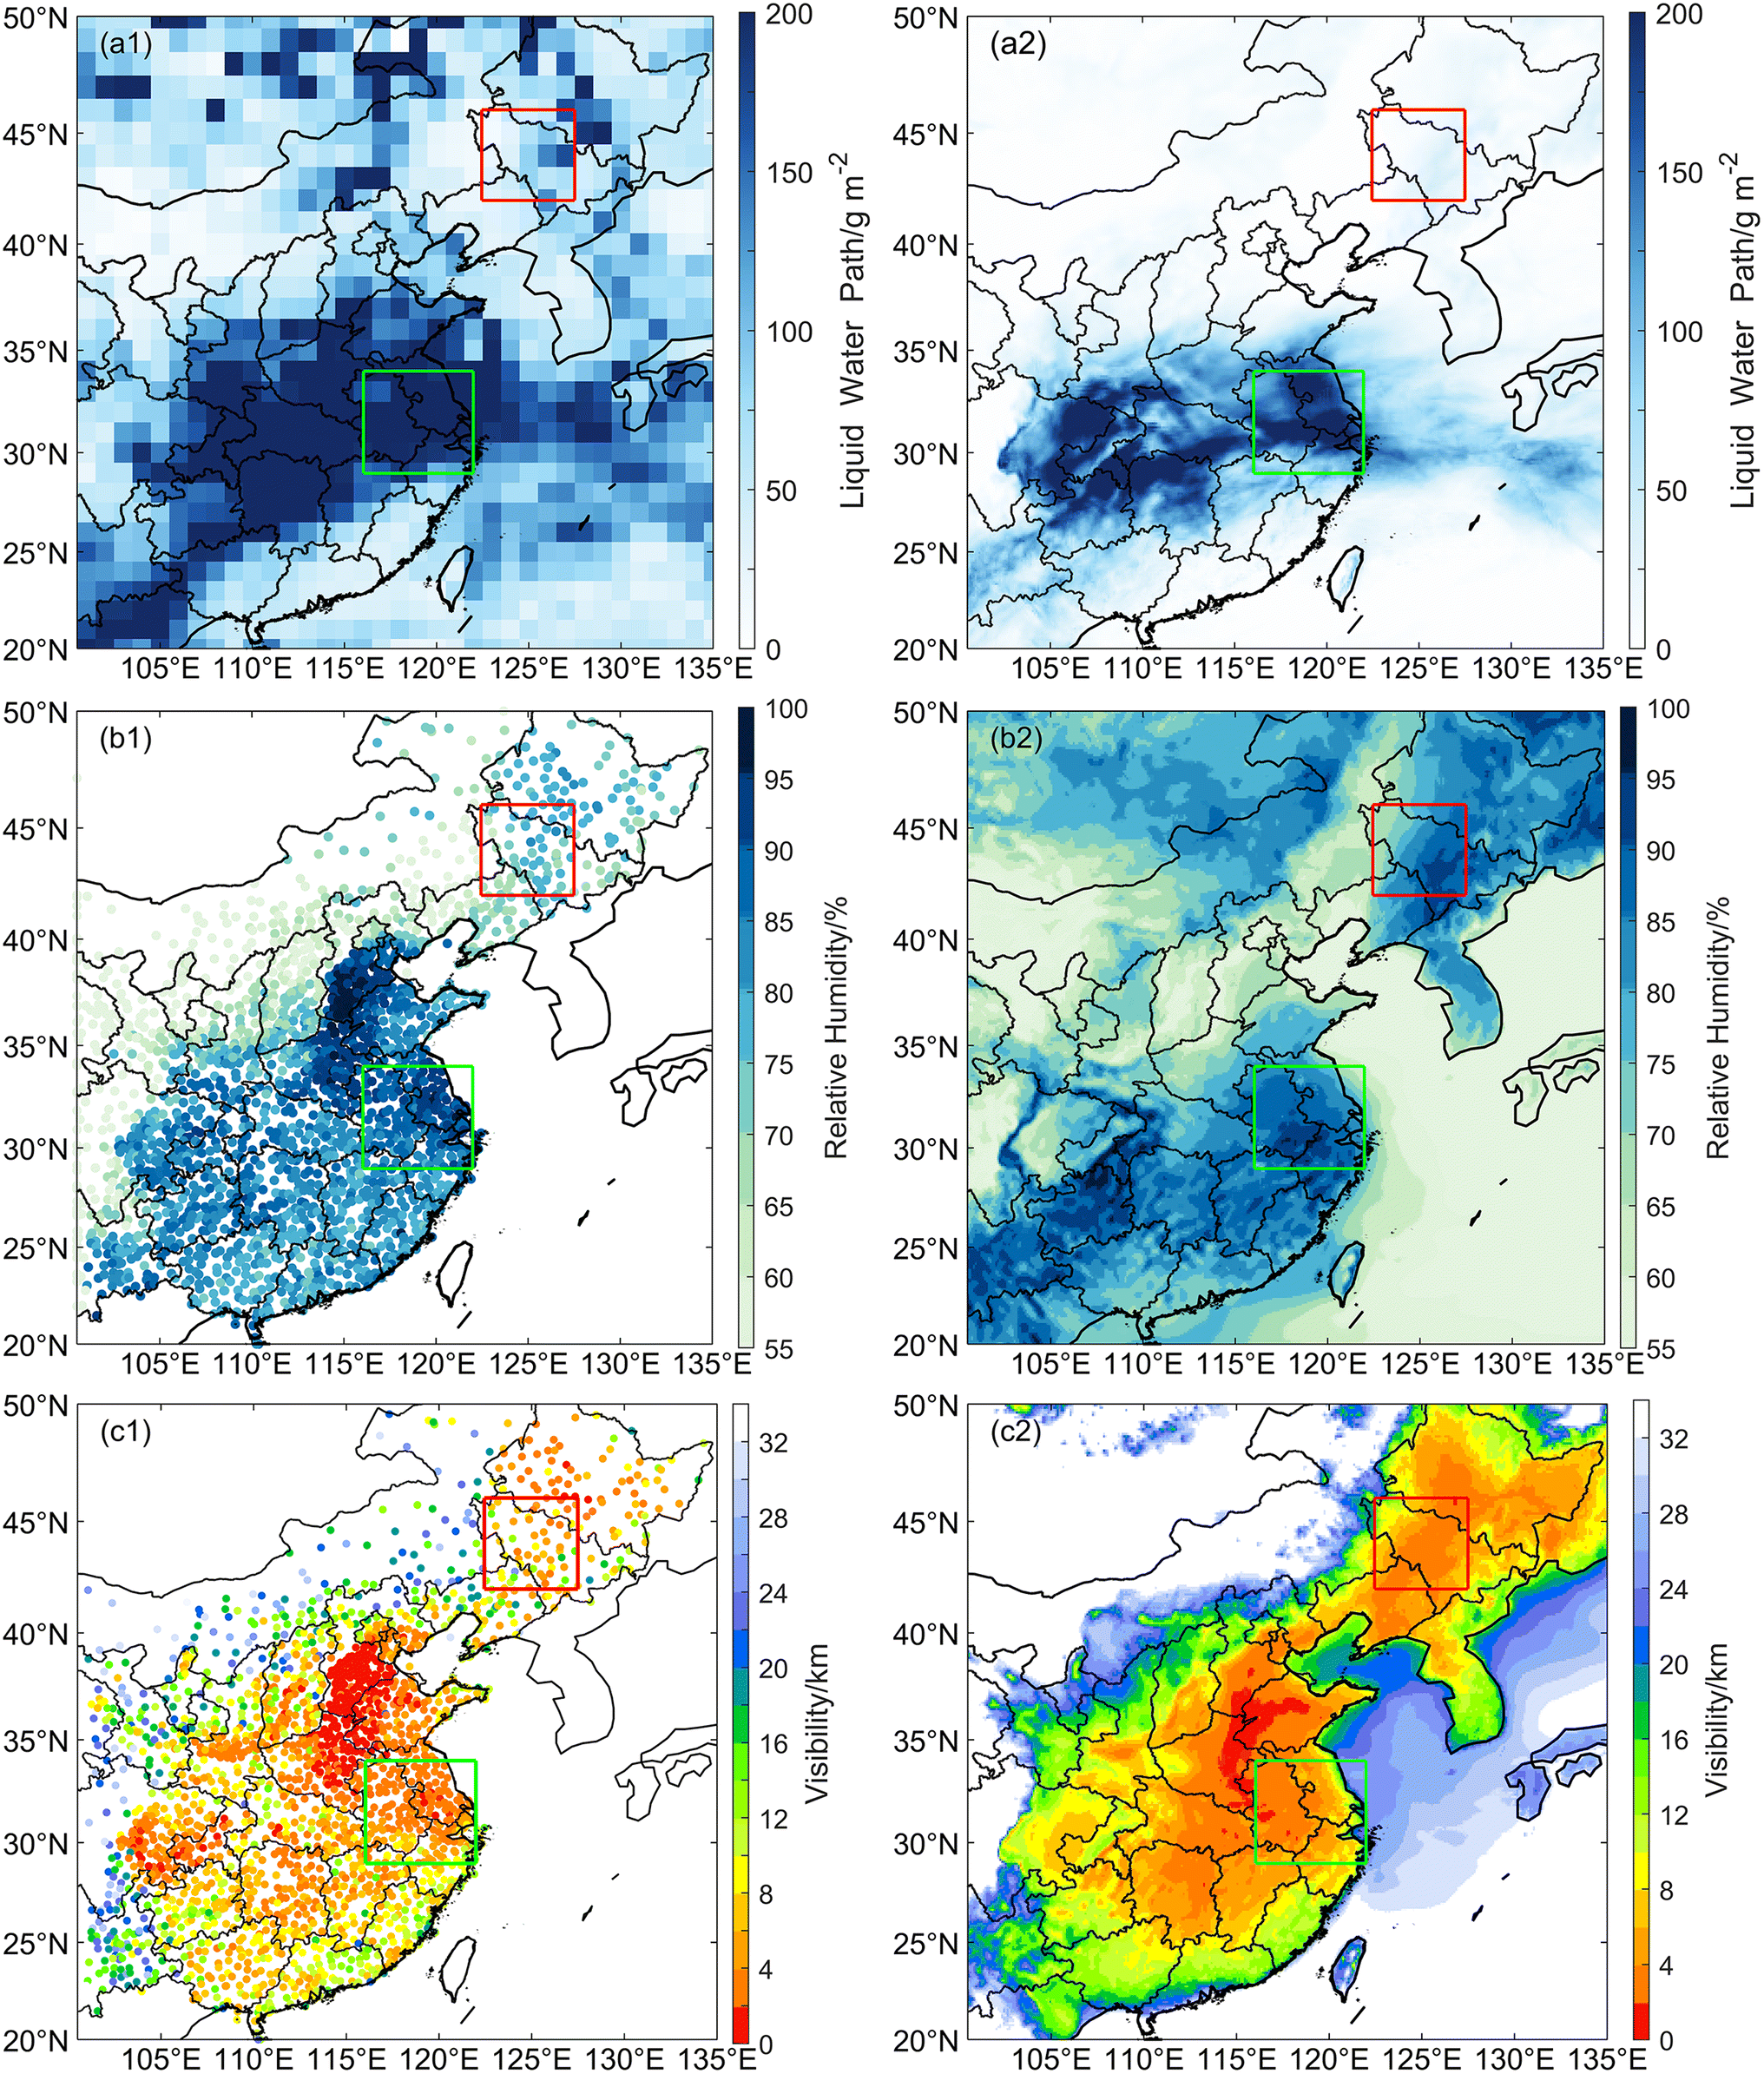 | ||
| Fig. 4 Comparison of the observations (left column) and simulations (right column) of the mean liquid water path (LWP; a), relative humidity (RH; b) and visibility (Vis; c) over the entire simulated period (the red and green rectangles indicate the Northeast China and Yangtze River Delta regions, respectively). | ||
To comprehensively evaluate the model simulation results, it is necessary to compare the observed and simulated Vis, RH, and LWP data from the perspectives of the temporal variation and statistics. Fig. 5 shows the time series of the simulated and observed Vis and RH in Changchun and Nanjing over the entire simulation period, as well as the time series of LWP in the two regions. The simulated and observed Vis, RH, and LWP values show good agreement.
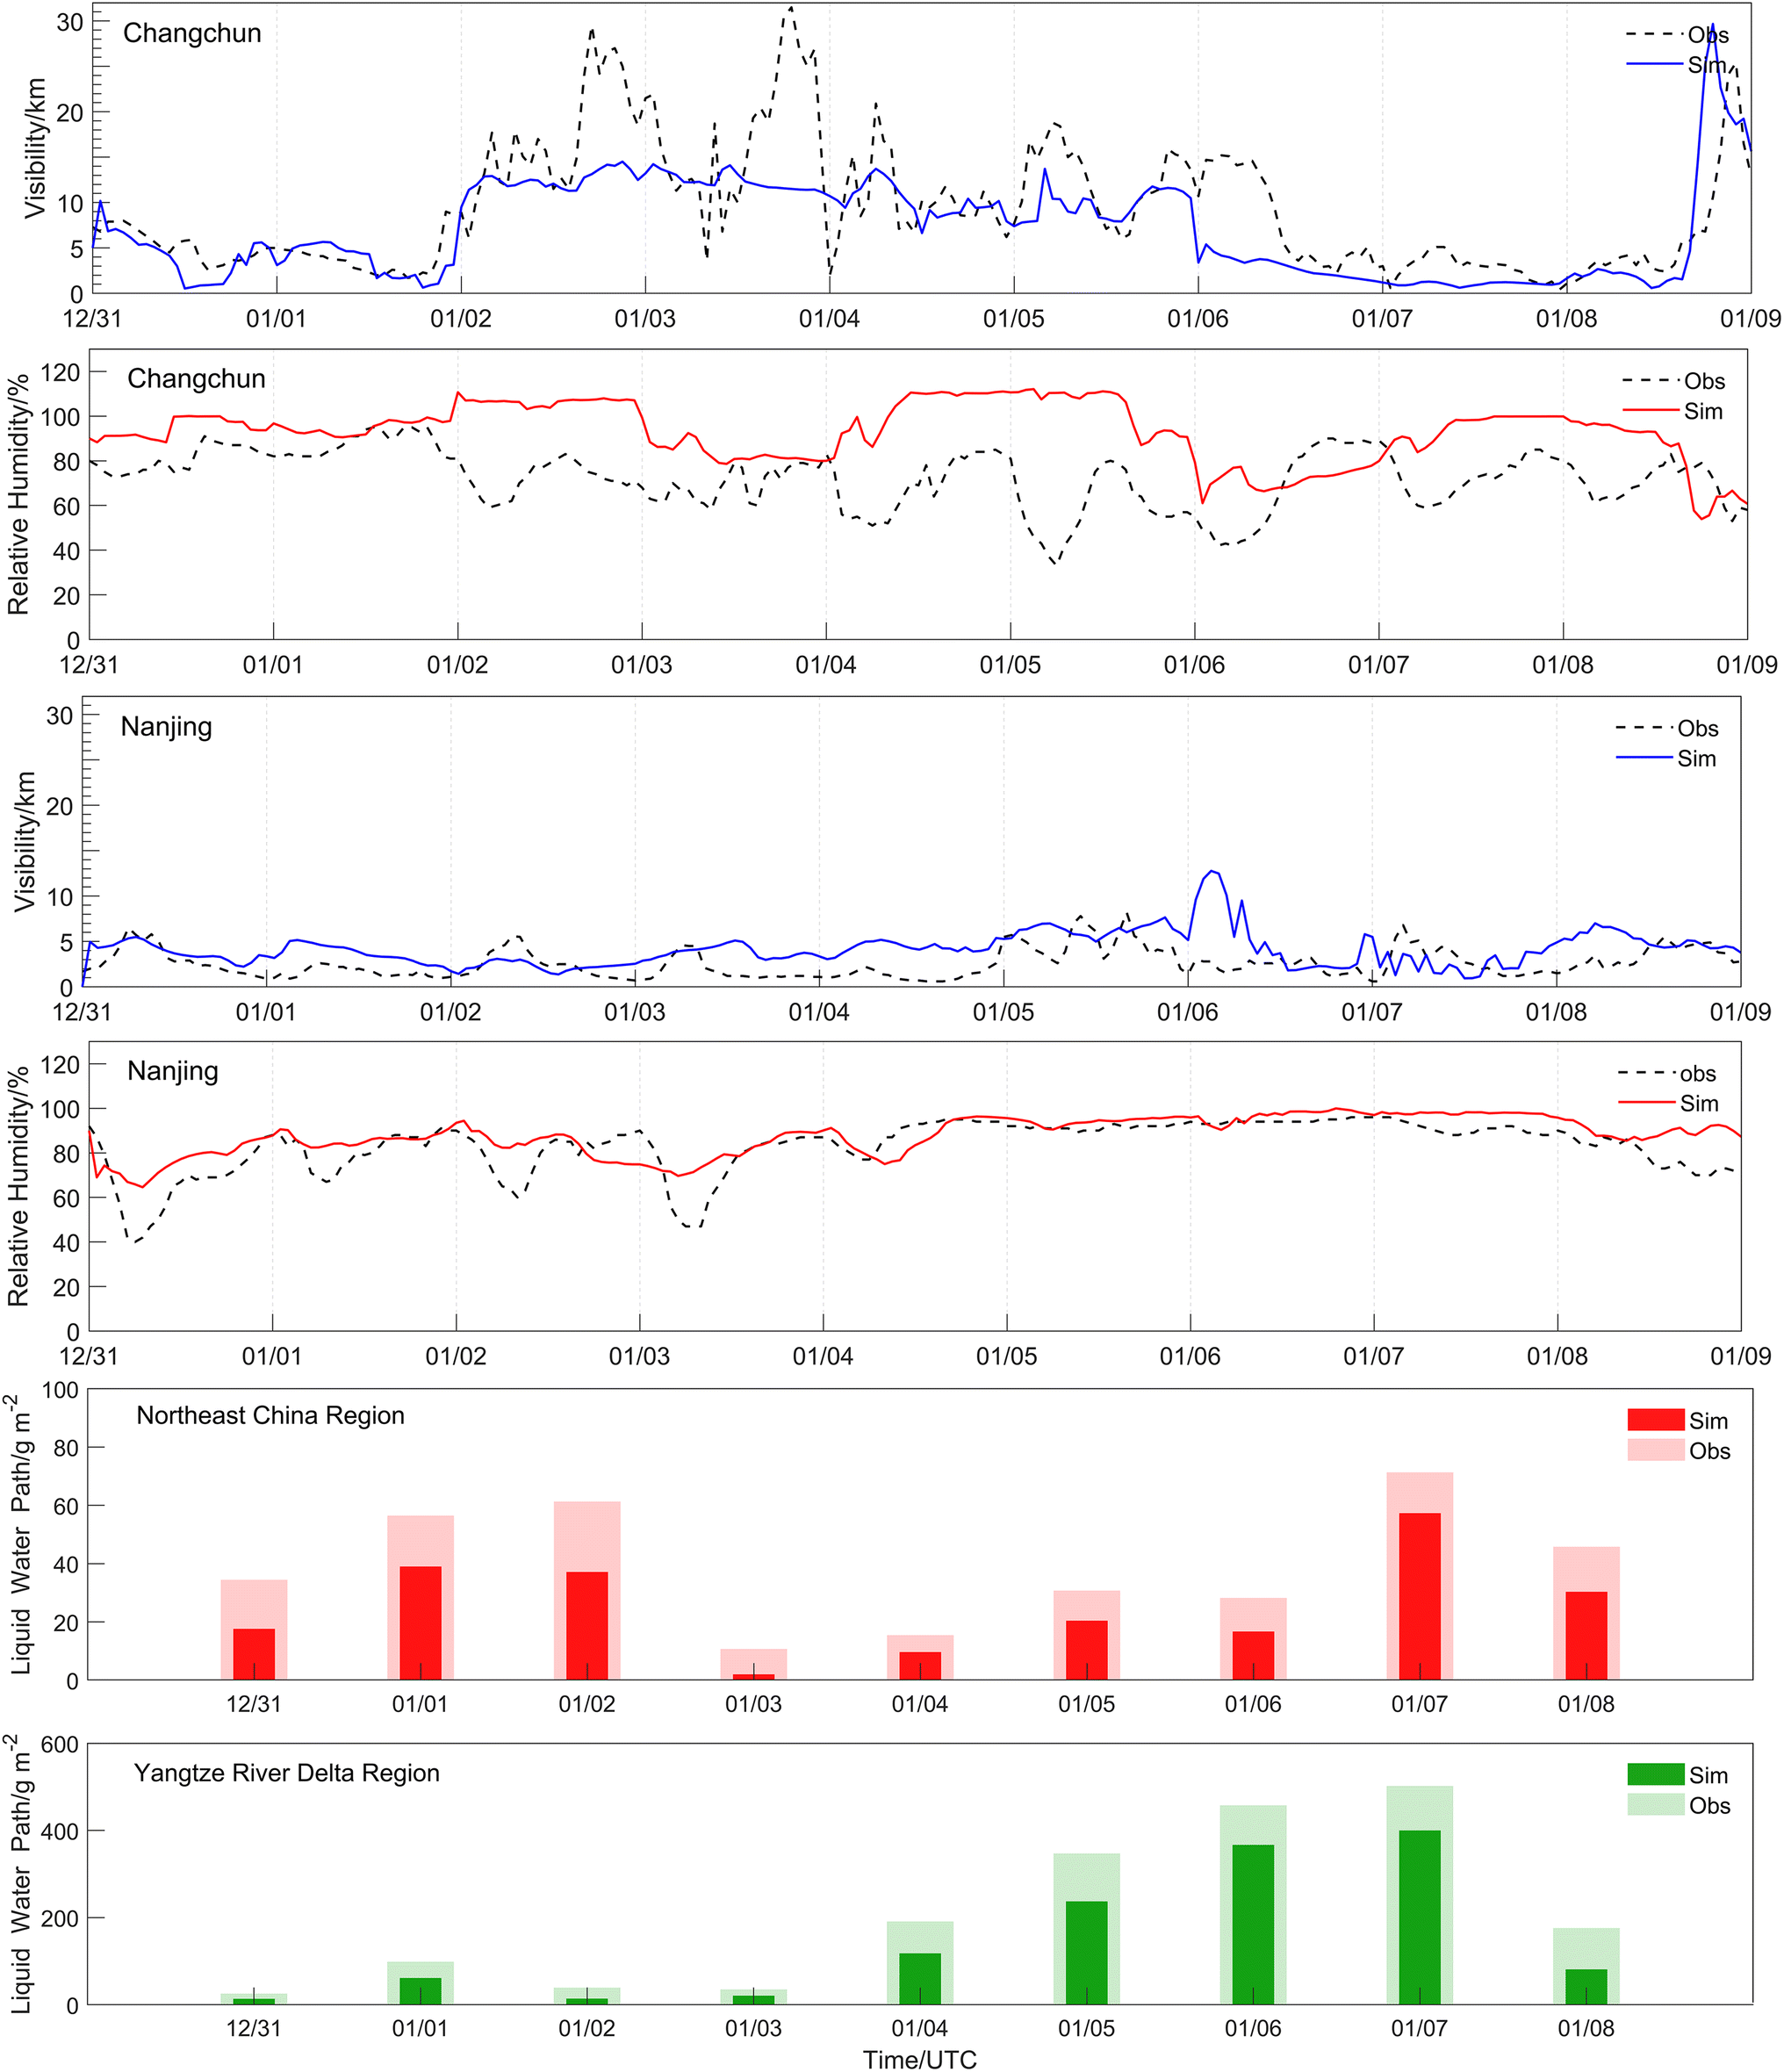 | ||
| Fig. 5 Time series of the simulated and observed visibility (Vis) relative humidity (RH), and liquid water path (LWP) over the entire simulated period in both regions and typical representative cities of the region: Changchun, and Nanjing. | ||
The root mean square error (RMSE) and normalized mean bias (NMB) between the observed and simulated Vis, RH, and LWP with different ψ throughout the entire simulated period in the various cities and regions are provided in Table 1. In Changchun, the RMSE for Vis is approximately 5.4 km at ψ = 1, 0.5, and 0, with the RMSE for RH reaching approximately 27 at ψ = 1, 21 at ψ = 0.5, and 0. The NMB for Vis is approximately −0.23 at ψ = 1, 0.5, and 0, while the NMB for RH reaching approximately 0.29 at ψ = 1, 0.21 at ψ = 0.5, and 0. When ψ = 1 and 0.5, the simulated Vis and RH values in Changchun align more closely with the observed values. In Nanjing, the RMSE for Vis is approximately 2.6 km at ψ = 1, 0.5, and 0, and the RMSE for RH is approximately 9.4 at ψ = 1, 9.5 at ψ = 0.5, and 0. The NMB for Vis and RH are approximately 0.60 and 0.06 at ψ = 1, 0.5, and 0, respectively. Table 1 shows that the model reasonably simulates Vis and RH in the typical representative cities of Changchun and Nanjing. There is no significant difference between the observed and the simulated values for Vis and RH with different ψ in Changchun and Nanjing. Furthermore, the model provides reasonably accurate simulations of LWP in the Northeast China and Yangtze River Delta regions, although it underestimates the LWP relative to the observations. When ψ = 1, the simulated LWP values in both regions align more closely with the observed LWP values. It is difficult to find a definitive ψ that satisfies all the observed data. The reasons behind these results must be investigated further through more research, and it is necessary to implement the entertainment-mixing parameterization for real-time calculation of ψ, as did in Xu et al.50.
| Cities/regions | ψ | RMSE | NMB | |
|---|---|---|---|---|
| a RMSE, root mean square error; NMB, normalized mean bias. | ||||
| Changchun | Vis (km) | 1 | 5.39 | −0.23 |
| 0.5 | 5.42 | −0.24 | ||
| 0 | 5.40 | −0.23 | ||
| RH (%) | 1 | 27.2 | 0.29 | |
| 0.5 | 21.3 | 0.21 | ||
| 0 | 21.4 | 0.21 | ||
| Nanjing | Vis (km) | 1 | 2.64 | 0.59 |
| 0.5 | 2.62 | 0.60 | ||
| 0 | 2.64 | 0.59 | ||
| RH (%) | 1 | 9.41 | 0.06 | |
| 0.5 | 9.50 | 0.06 | ||
| 0 | 9.52 | 0.06 | ||
| Northeast China region | LWP (g m−2) | 1 | 14.6 | −0.35 |
| 0.5 | 15.6 | −0.37 | ||
| 0 | 16.9 | −0.39 | ||
| Yangtze River Delta region | BAT (g m−2) | 1 | 72.6 | −0.30 |
| 0.5 | 74.5 | −0.31 | ||
| 0 | 76.7 | −0.32 | ||
3.2 Effects of different entrainment-mixing processes on the cloud/fog microphysical and radiative properties
Fig. 6 shows the horizontal distributions of the daily mean cloud/fog droplet number concentration (Nc/f), cloud/fog droplet effective radius (re), and cloud/fog water mixing ratio (qc) at ψ = 1, as well as the differences between ψ = 0.5, 0, and 1 in Case 1. Grid points with Nc/f and qc greater than 1 cm−3 and 0.01 g kg−1, respectively, are defined as cloudy/foggy areas.83 The cloud/fog distribution in the Northeast China region is smaller than that in the Yangtze River Delta region. The Yangtze River Delta region exhibits larger Nc/f and qc values than the Northeast China region as a whole. In contrast to the Northeast China region, where the maximum Nc/f does not exceed 600 cm−3, the maximum Nc/f exceeds 600 cm−3 in the Yangtze River Delta region and even reaches approximately 800 cm−3. Both regions exhibit qc values less than 0.3 g kg−1. Additionally, there is no significant difference in the magnitude of re between the two regions.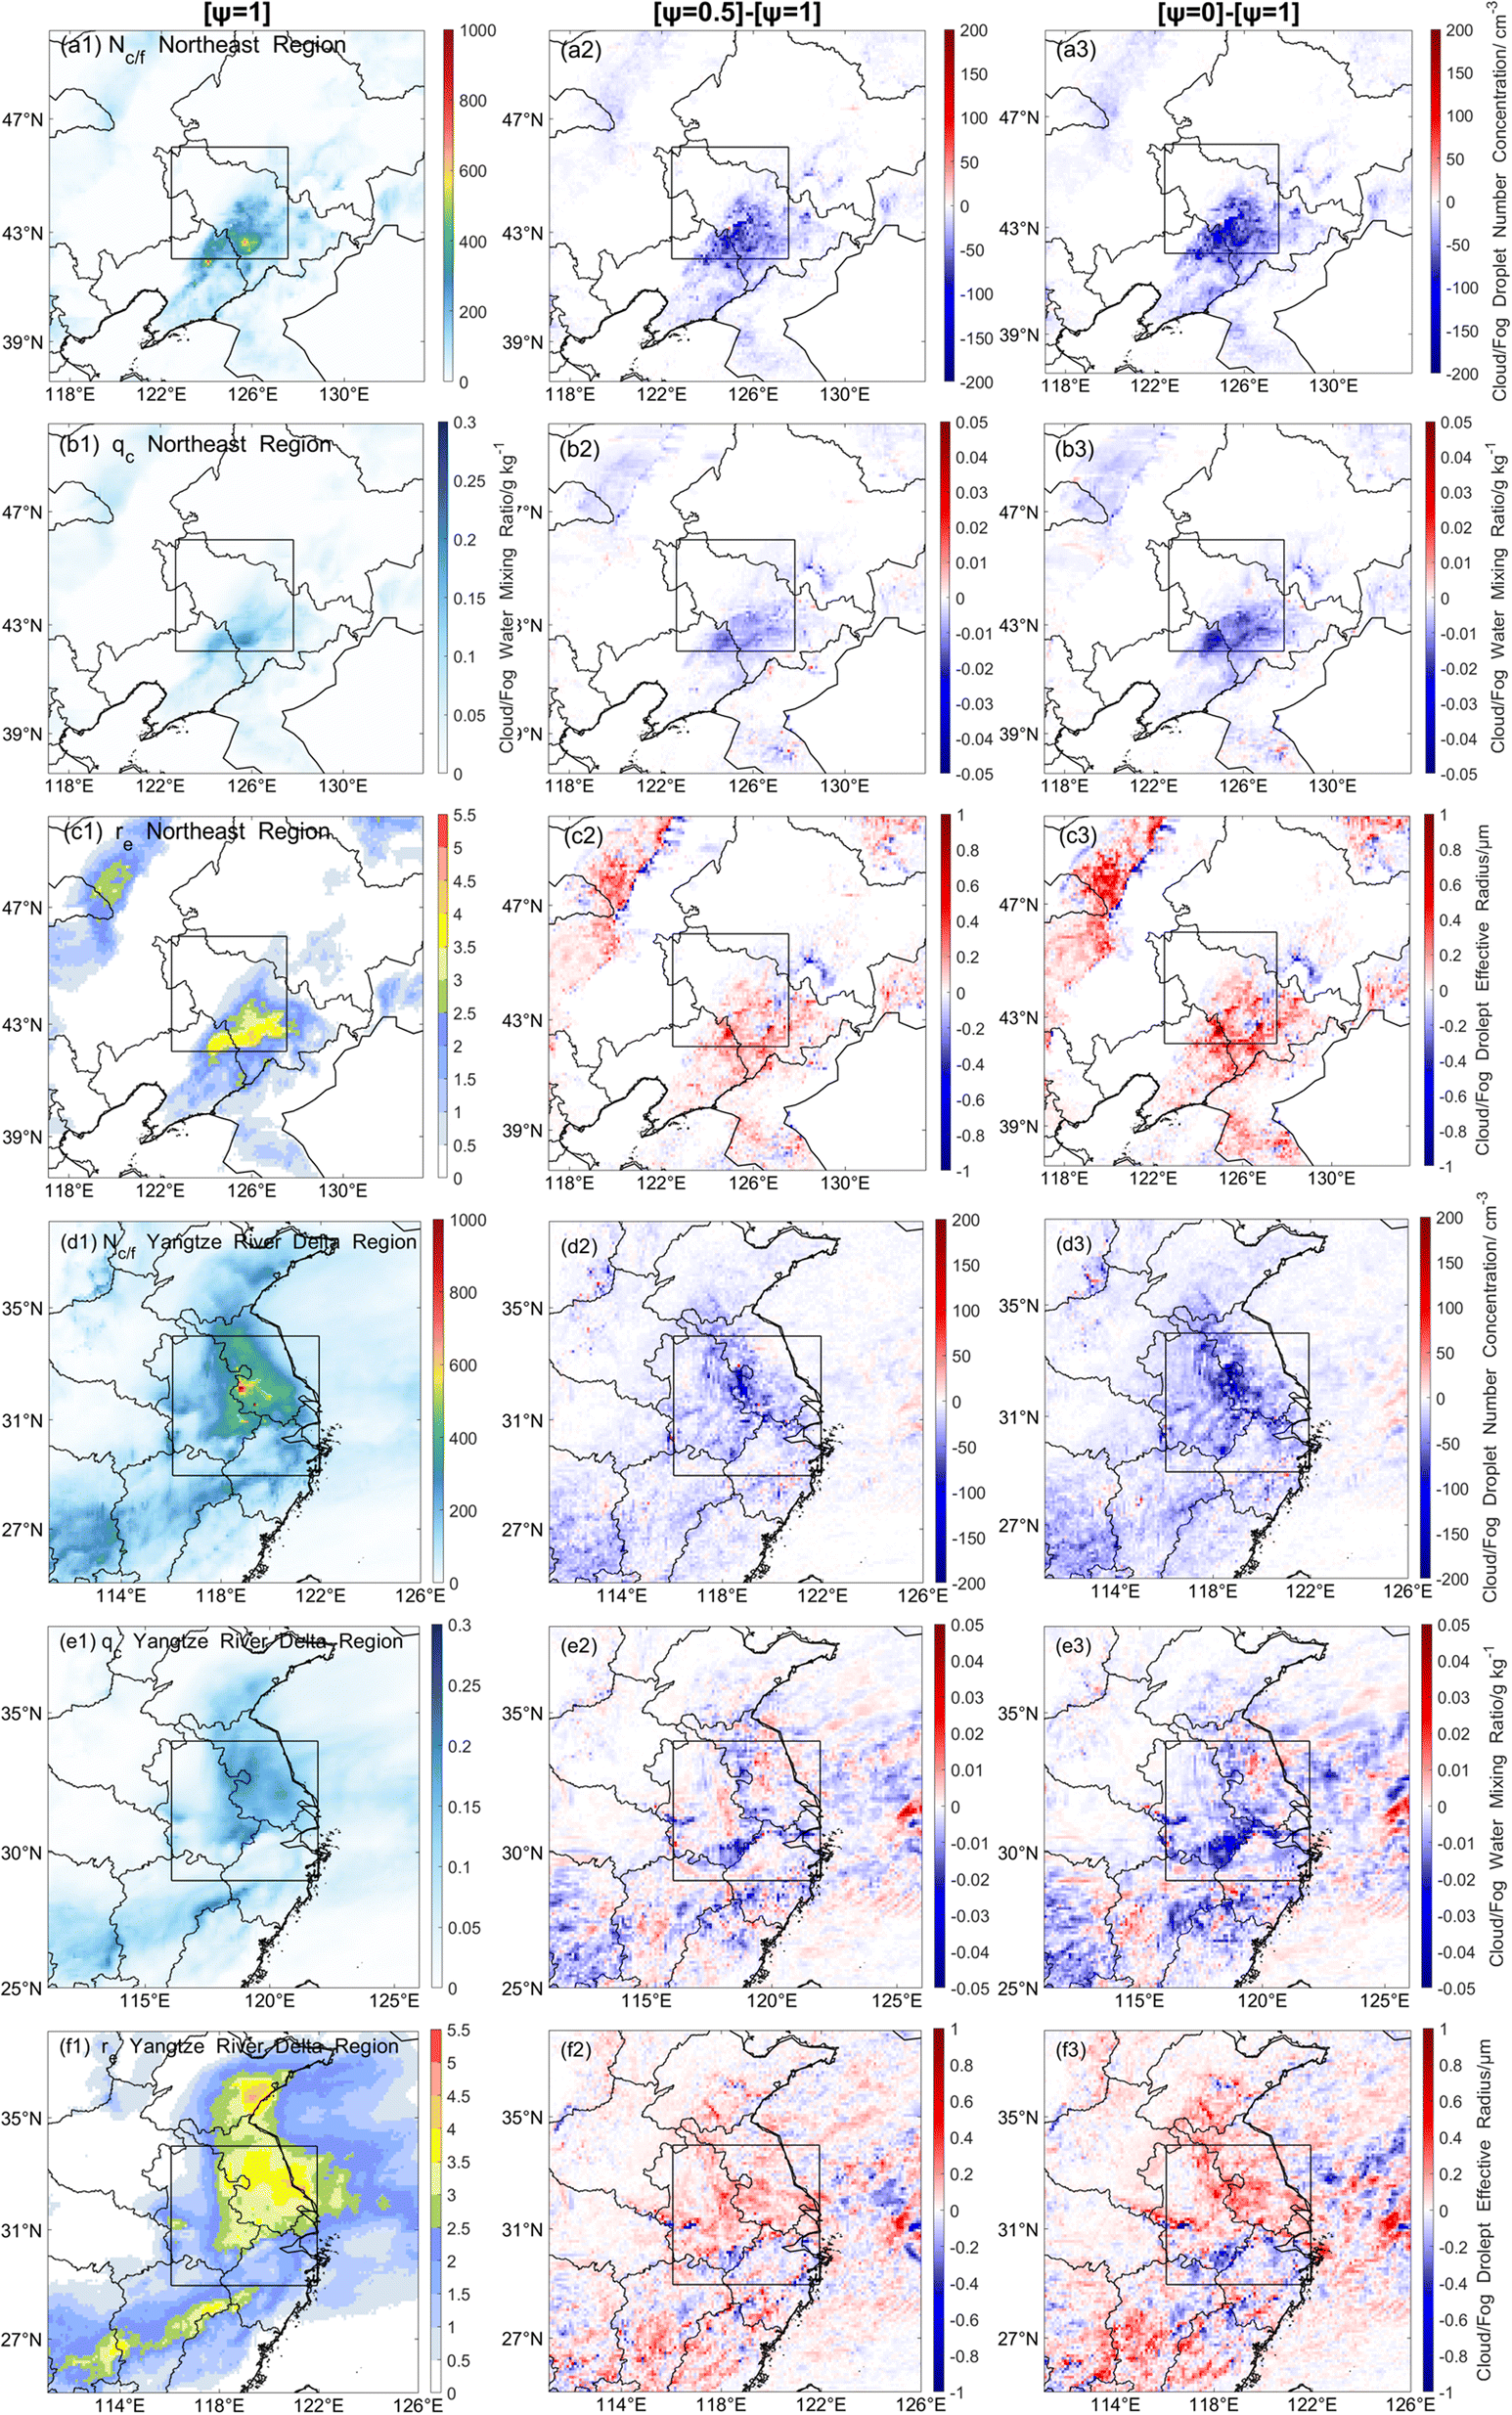 | ||
| Fig. 6 Horizontal distributions of the simulated daily mean cloud/fog droplet number concentration (Nc/f), cloud/fog droplet effective radius (re), and cloud/fog water mixing ratio (qc) at homogeneous mixing degrees (ψ) = 1, as well as the differences between ψ = 0.5, 0, and 1 in Case 1 (panels a, b, and c show the Northeast China region; panels d, e, and f show the Yangtze River Delta region). | ||
The variations in Nc/f and re with ψ change are consistent with the anticipated outcomes: compared to homogeneous entrainment-mixing processes, inhomogeneous entrainment-mixing processes result in smaller Nc/f and larger cloud/fog droplet size. More details are given in Section 3.3.
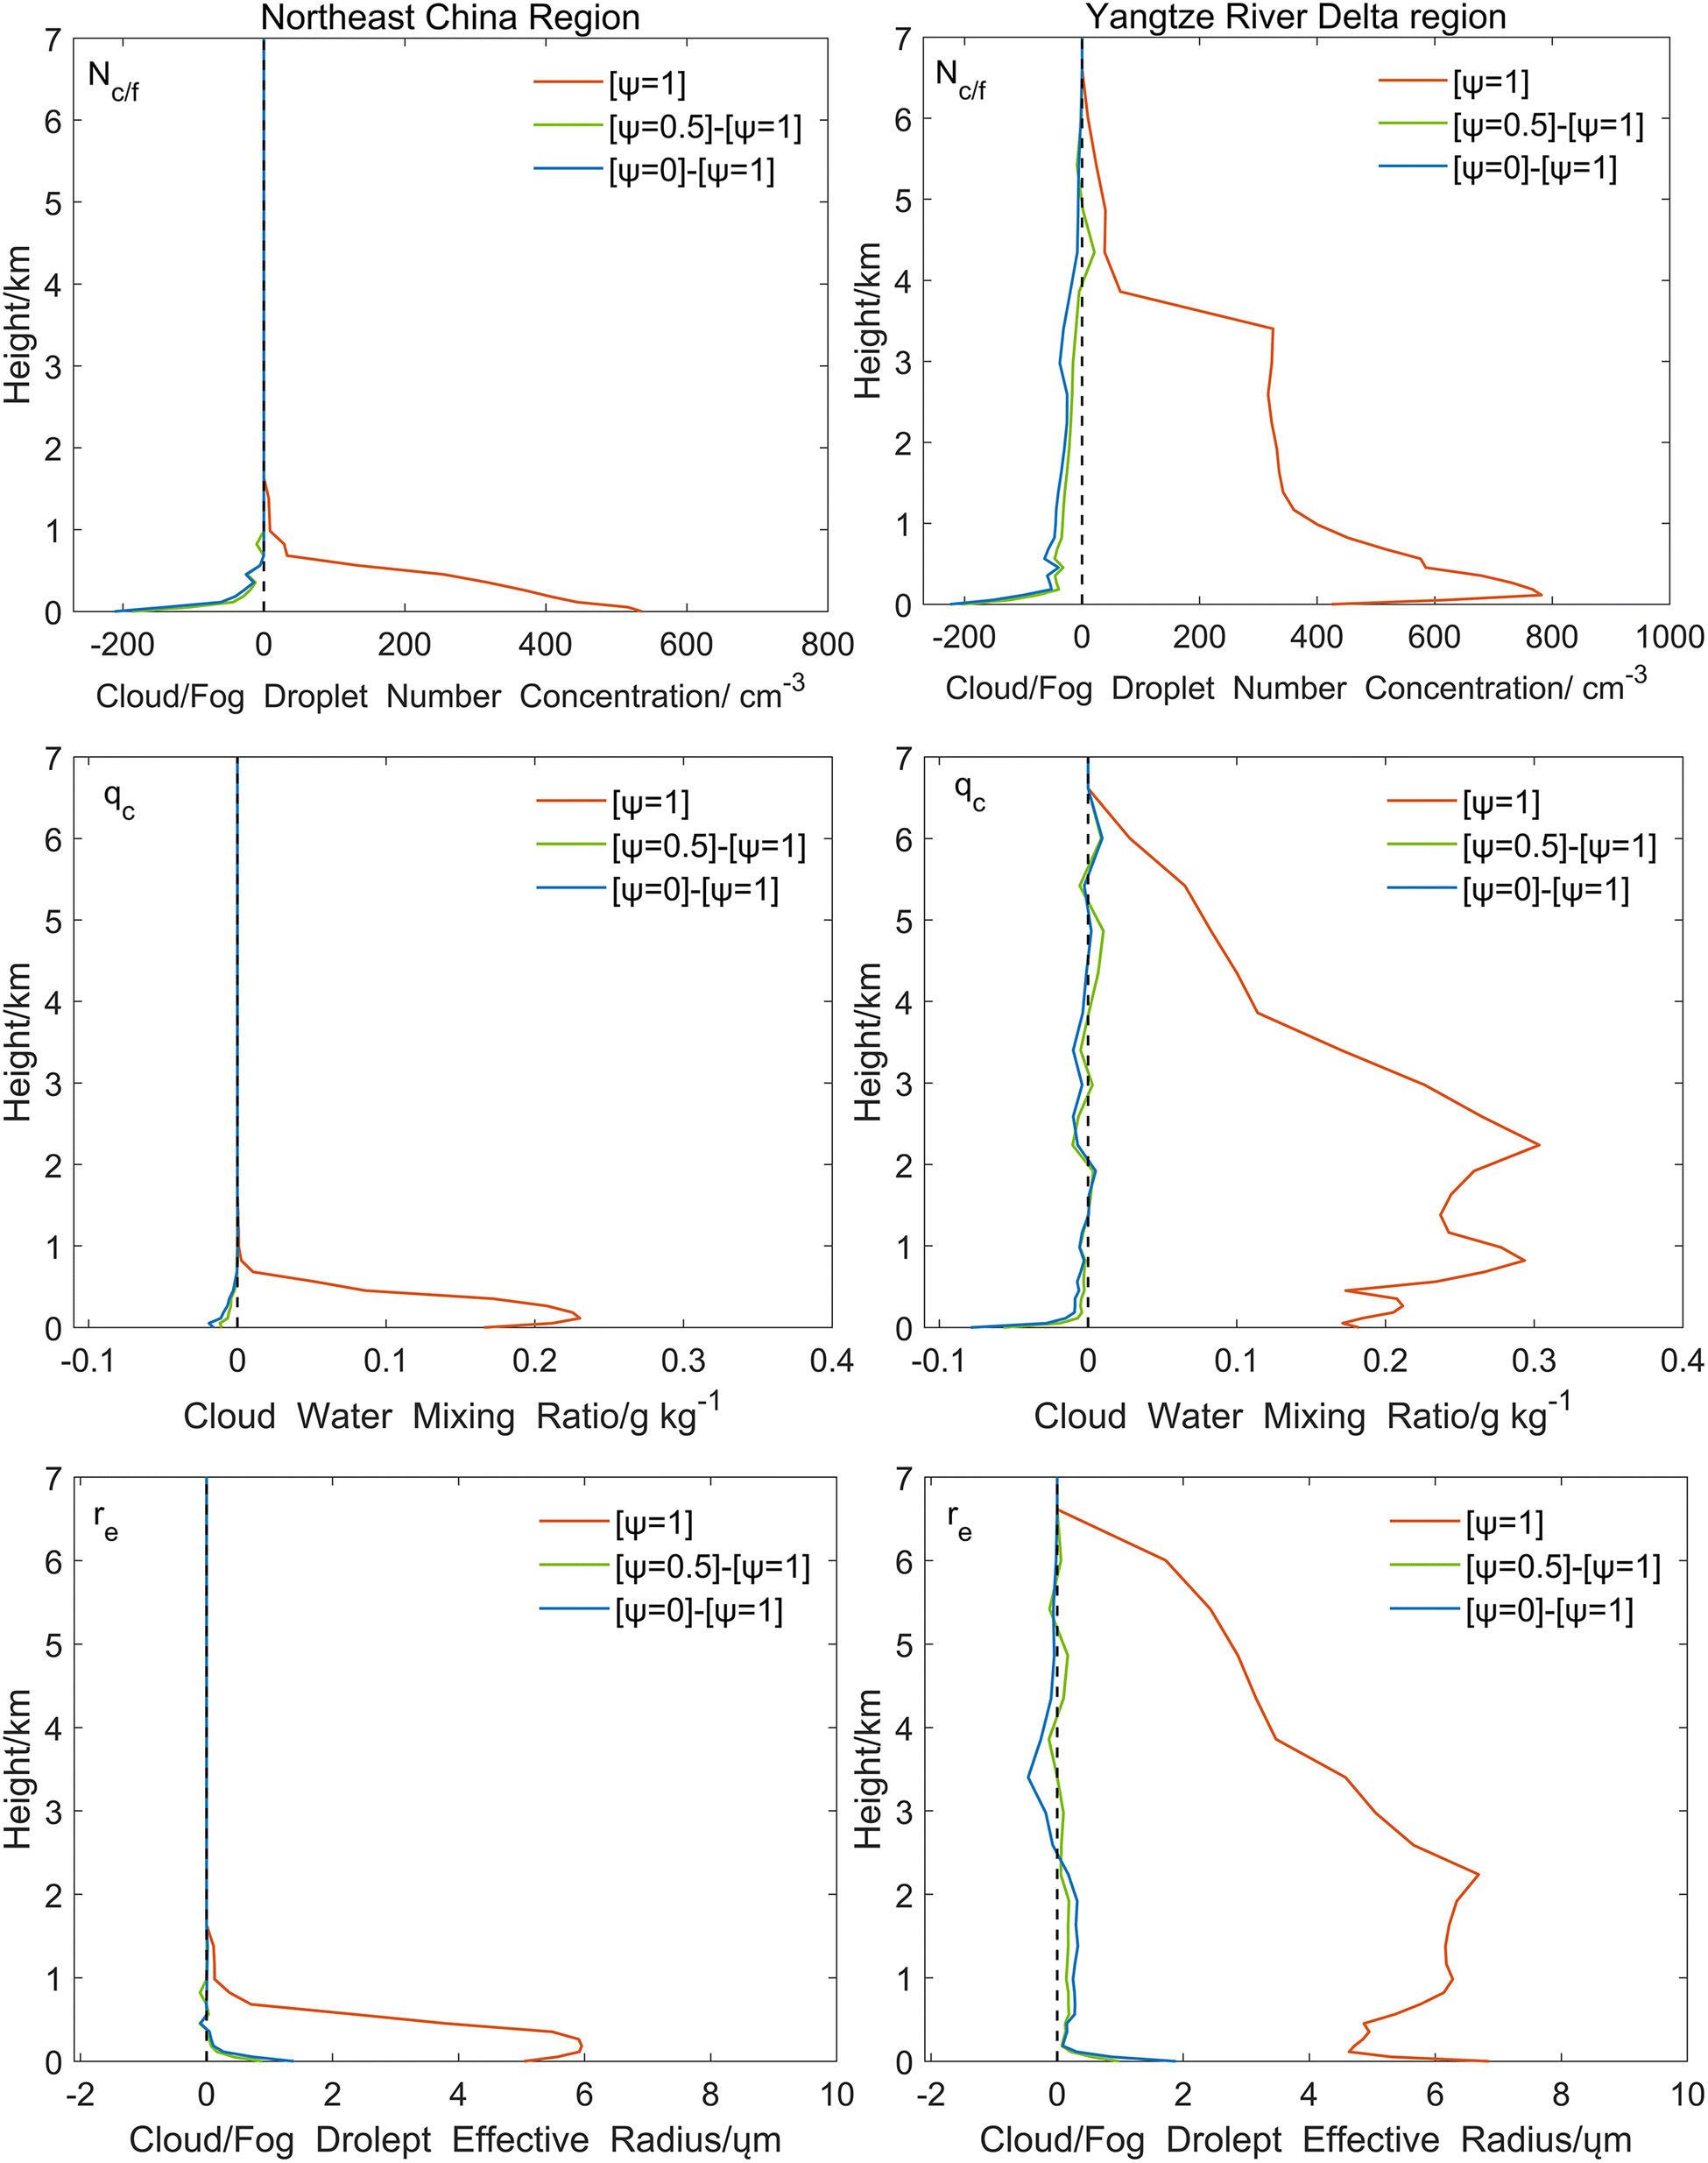
Fig. 7 shows the vertical profiles of the daily mean Nc/f, qc, and re at ψ = 1, along with the vertical profiles of the differences between ψ = 0.5, 0, and 1 in Case 1. The cloud/fog in the Yangtze River Delta region is thicker than those in the Northeast China region. Regarding all the cloud/fog heights in the Northeast China region, the highest values of Nc/f, qc, and re are 536.1 cm−3, 0.23 g kg−1, and 5.95 μm, respectively. The maximum values of Nc/f, qc, and re for all cloud/fog heights in the Yangtze River Delta region are higher than those in the Northeast China region, at 781.5 cm−3, 0.30 g kg−1, and 6.85 μm, respectively. In Fig. 8, the vertical profiles of the daily mean Nc/f, qc, and re at ψ = 1, as well as the vertical profiles of the differences between ψ = 0.5, 0, and 1 in Case 2, are shown. Similar to Case 1, the cloud/fog in the Yangtze River Delta region is thicker than those in the Northeast China region. The largest values of Nc/f, qc, and re for all clouds/fog heights are 702.7 cm−3, 0.22 g kg−1, and 5.49 μm, respectively, in the Northeast China region, while the maximum values reach 603.5 cm−3, 0.48 g kg−1, and 6.57 μm, respectively, in the Yangtze River Delta region.
 | ||
| Fig. 7 Vertical profiles of the simulated daily mean cloud/fog droplet number concentration (Nc/f), cloud/fog droplet effective radius (re), and cloud/fog water mixing ratio (qc) at homogeneous mixing degrees (ψ) = 1, and vertical profiles of the differences between ψ = 0.5, 0, and 1 in Case 1. | ||
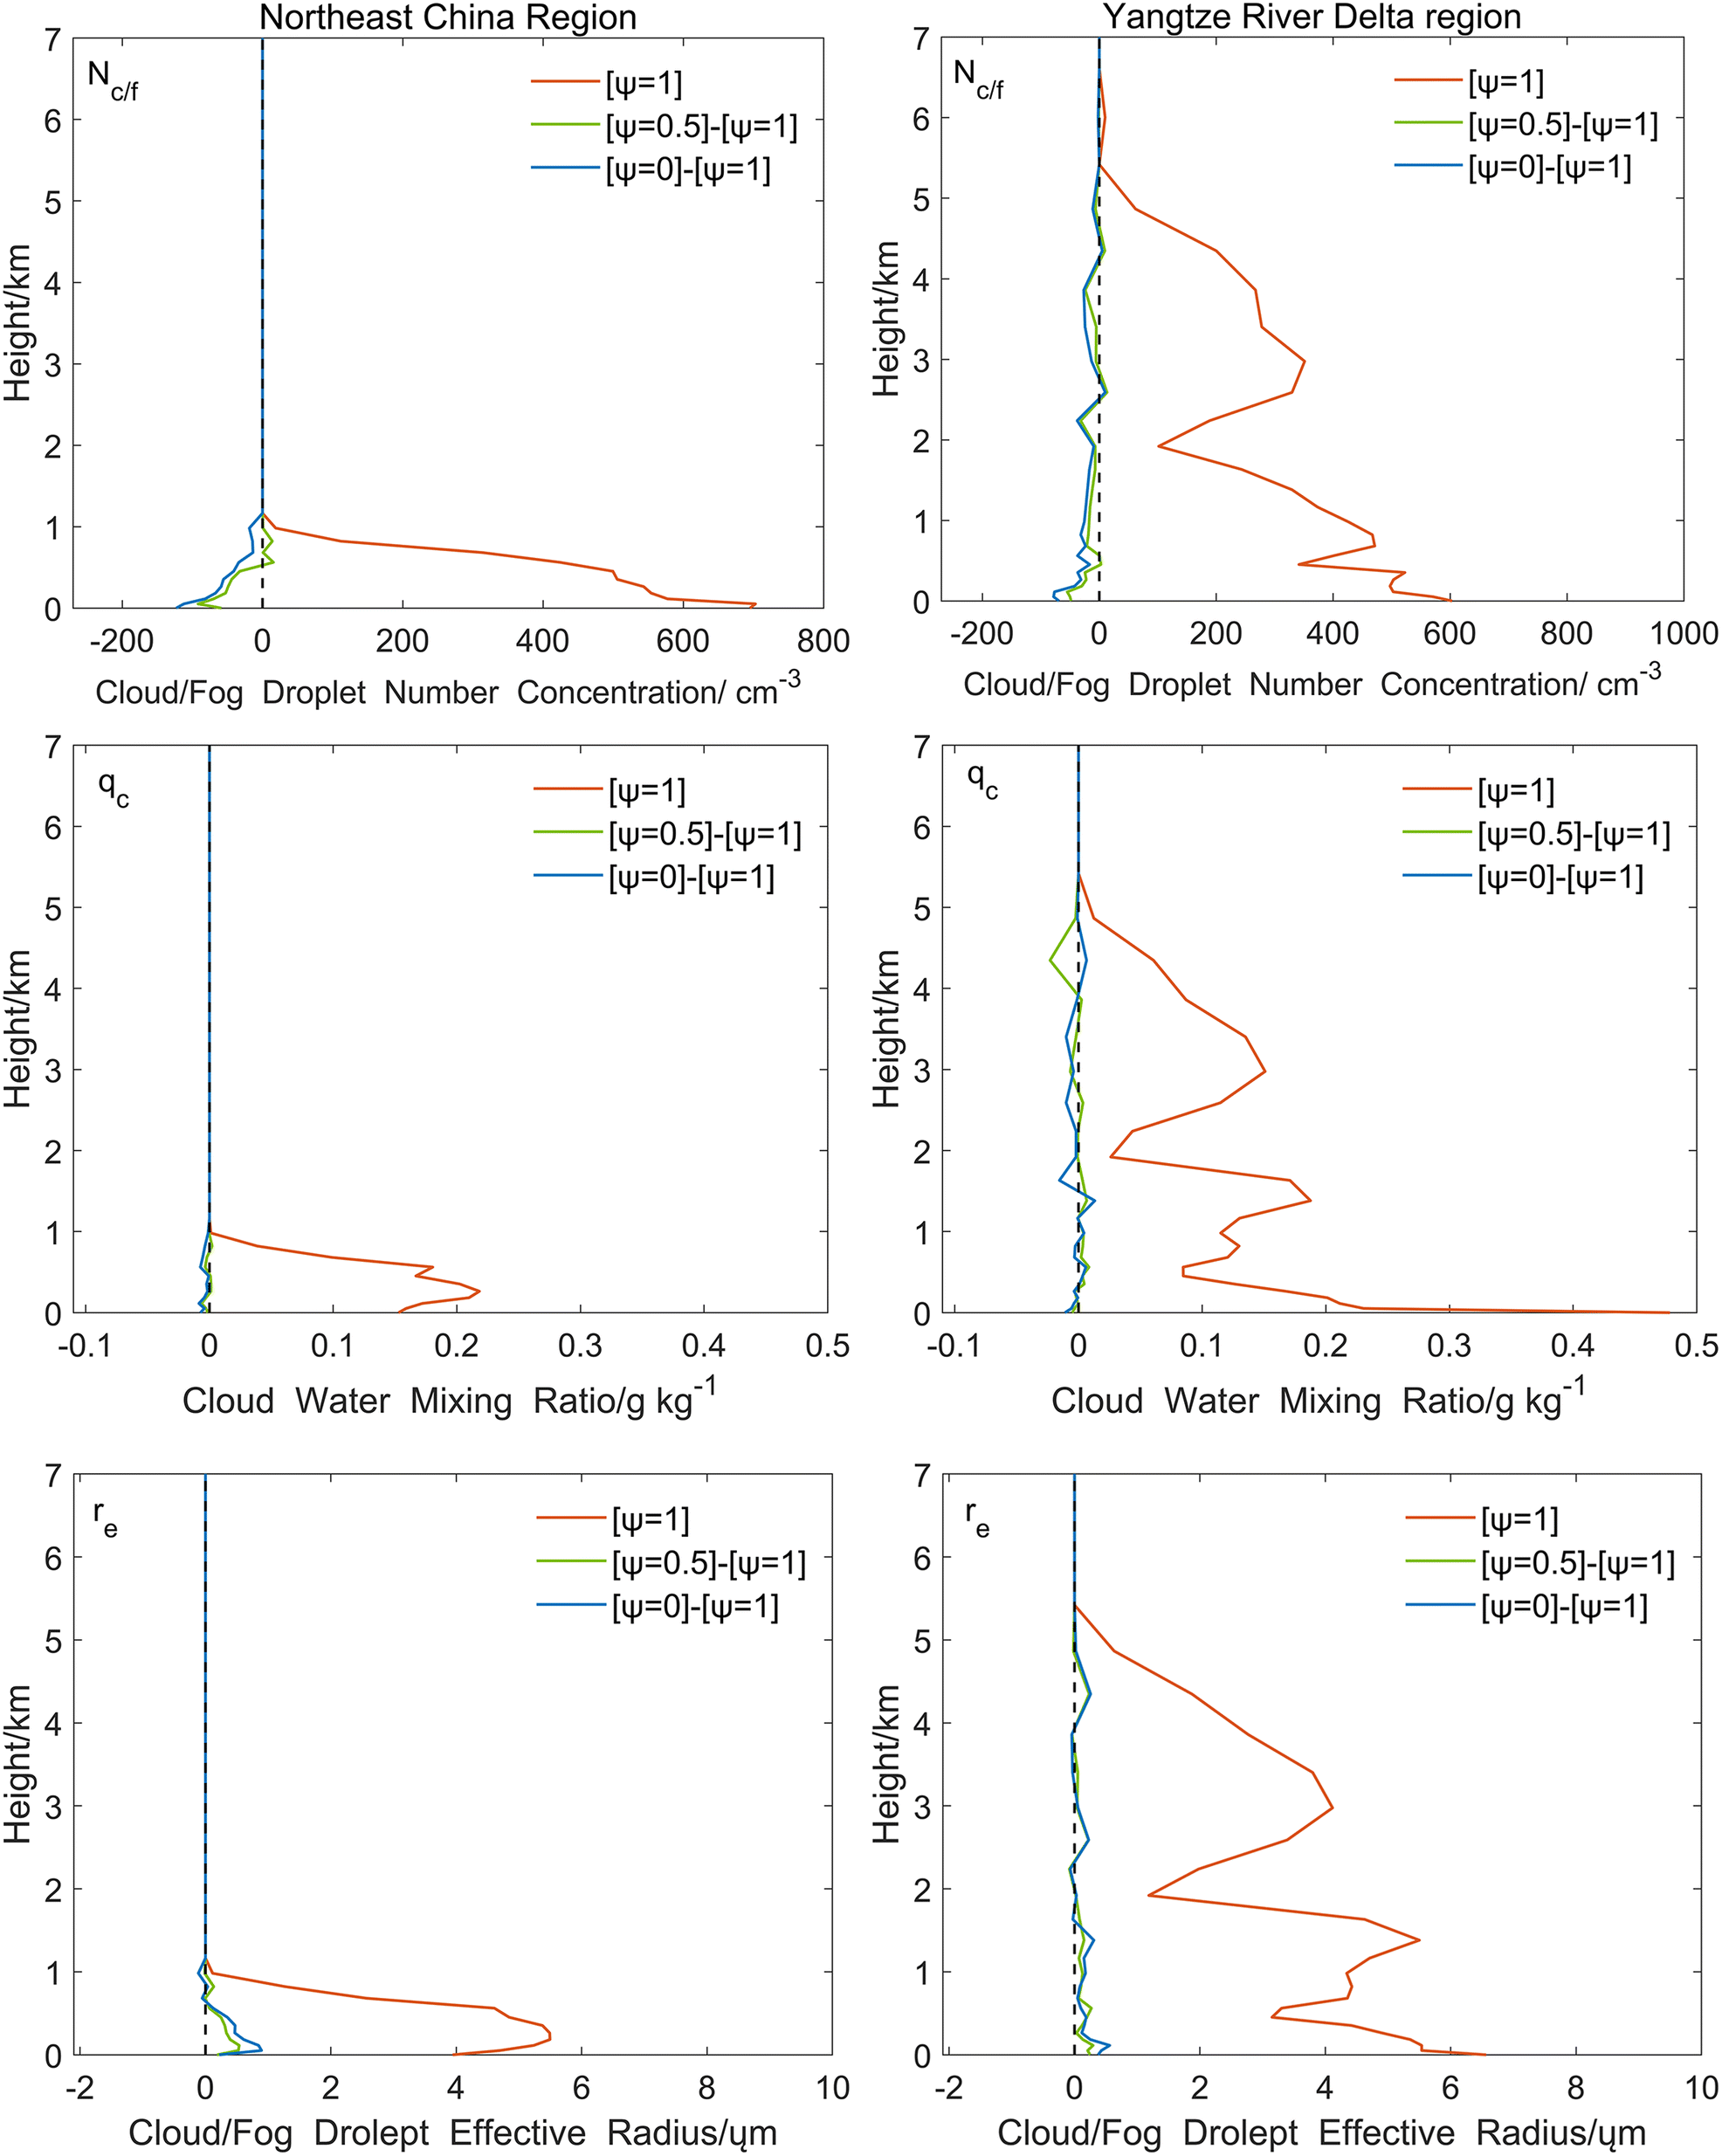 | ||
| Fig. 8 Vertical profiles of the simulated daily mean cloud/fog droplet number concentration (Nc/f), cloud/fog droplet effective radius (re), and cloud/fog water mixing ratio (qc) at homogeneous mixing degrees (ψ) = 1, and vertical profiles of the differences between ψ = 0.5, 0, and 1 in Case 2. | ||
Consistent with the findings shown in Fig. 6–8 show that the presence of inhomogeneous entrainment-mixing processes leads to smaller Nc/f and qc and generally larger re than those in the presence of homogeneous entrainment-mixing processes. This observation aligns with the findings of Lasher-Trapp et al., who studied the effects of different entrainment-mixing processes using a three-dimensional cloud model coupled with a Lagrangian microphysical parcel model.55 For more inhomogeneous entrainment-mixing processes, Nc/f decreased, allowing the remaining droplets to grow faster. The vertical profiles in Fig. 7 and 8 directly demonstrate that the effects of the entrainment-mixing processes cover the entire cloud/fog layer.
In addition to the effects of entrainment-mixing processes on Nc/f and re, Fig. 9 shows the horizontal distributions of the simulated daily mean LWP and C/FOT at ψ = 1, 0.5, and 0, as well as the corresponding observations in Case 1. Fig. 10 shows the probability density distribution functions of the simulated daily mean LWP and C/FOT at ψ = 1, 0.5, and 0 in Case 1. As shown in Fig. 7 and 9, the cloud/fog in the Yangtze River Delta region is more extensively dispersed (both vertically and horizontally) than those in the Northeast China region, resulting in larger LWP and C/FOT for the cloud/fog in this region (Fig. 10). The LWP is calculated as follows:
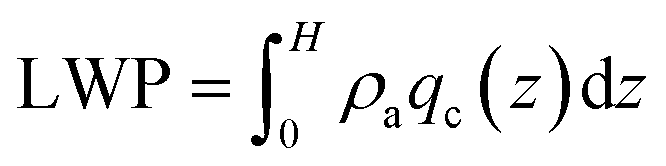 | (3) |
 | (4) |
 | ||
| Fig. 9 Horizontal distributions of the simulated daily mean liquid water path (LWP) and cloud/fog optical thickness (C/FOT) at homogeneous mixing degrees (ψ) = 1, 0.5, and 0, as well as the corresponding observations in Case 1 (the red and green rectangles indicate the Northeast China and Yangtze River Delta regions, respectively). | ||
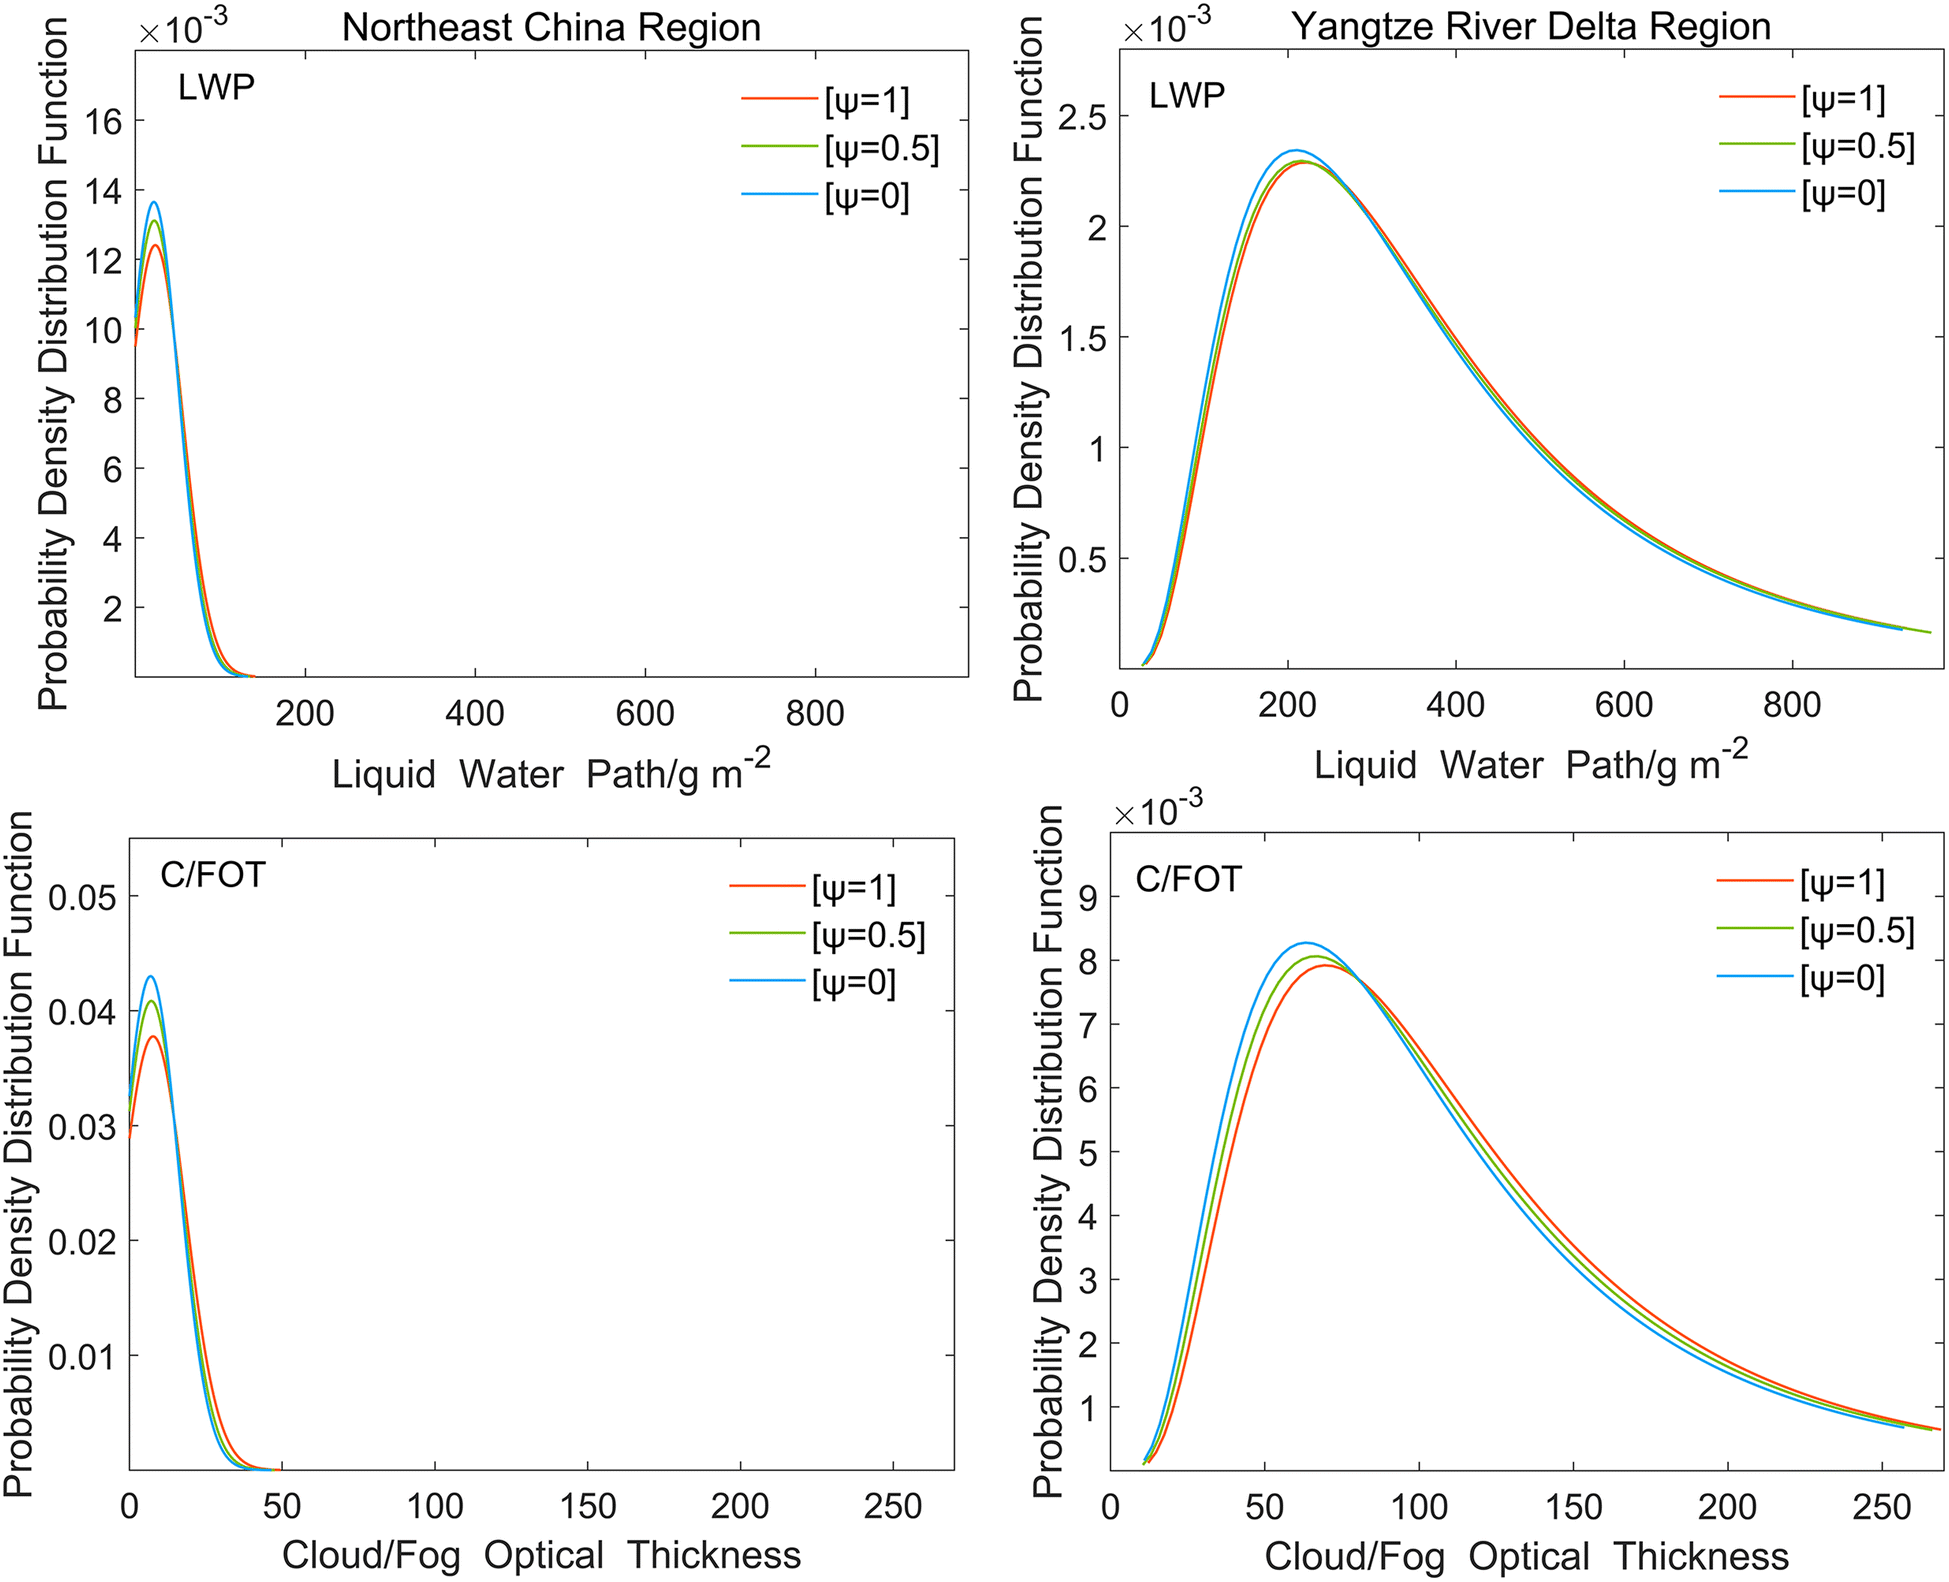 | ||
| Fig. 10 Probability density distribution functions of the simulated daily mean liquid water path LWP and cloud/fog optical thickness (C/FOT) at homogeneous mixing degrees (ψ) = 1, 0.5, and 0 in Case 1. | ||
Vis is a crucial parameter of atmospheric transmittance and serves as a key indicator of the fog intensity. The forecasting methods for Vis can be categorized into two groups: humidity diagnostic methods and fog microphysical characteristics diagnostic methods.84 Entrainment-mixing processes significantly affect Vis by influencing the microphysical properties of fog. Additionally, in contrast to humidity diagnostic methods, fog microphysical characteristics diagnostic methods are more widely utilized and offer higher accuracy in predicting low-Vis events. Therefore, in this study, the Vis equation proposed by Rui et al. is employed to investigate the effects of entrainment-mixing processes on Vis:85
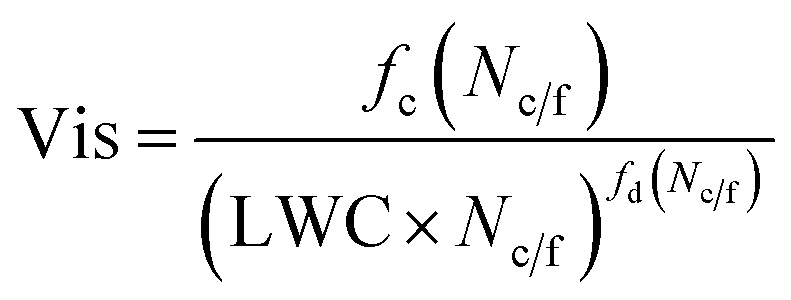 | (5) |
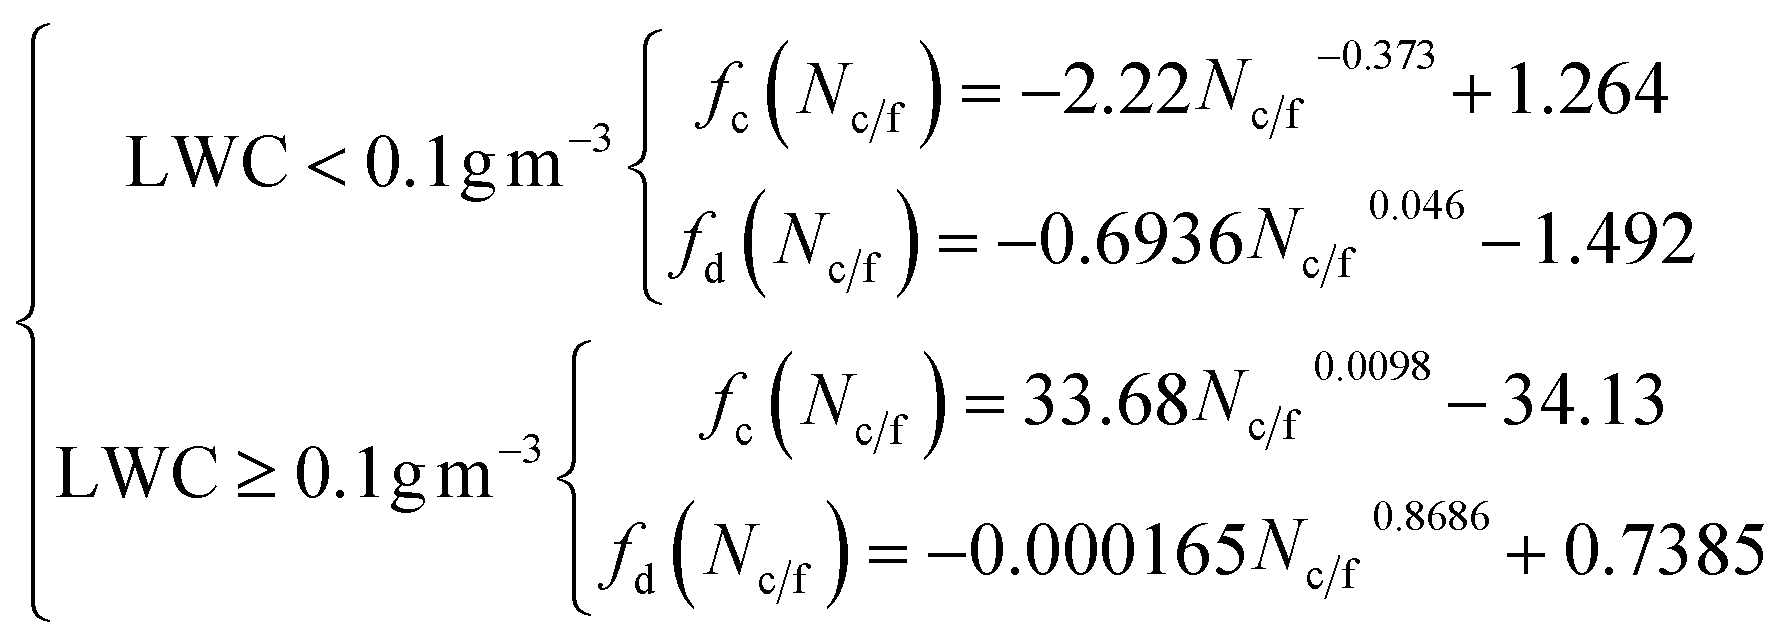 | (6) |
Table 2 shows the daily simulated and observed regional mean Vis in the surface fog area of the Northeast China region and Yangtze River Delta regions with different ψ values for both cases. Vis is inversely correlated with Nc/f and LWC. As previously discussed, there exists a positive correlation between ψ and these variables. Consequently, Vis increases with decreasing ψ in both cases. In Case 1, the Northeast China region experiences an increase from 0.162 to 0.237 km, while the Yangtze River Delta region experiences an increase from 0.171 to 0.310 km. In Case 2, the Northeast China region experiences an increase from 0.380 to 0.414 km, while the Yangtze River Delta region experiences a slight increase from 0.187 to 0.189 km. The corresponding observed Vis values in the Northeast China region and Yangtze River Delta regions are 0.678 and 0.613 km, respectively, in Case 1, while in Case 2, they are 0.717 and 0.618 km, respectively. Obviously, the difference between the simulated and observed Vis value is large in both cases. Studies show that accurate Vis modeling, especially for low Vis (as low as <3 km, even <1 km), is very complicated and faces serious challenges, and the lower the Vis, the worse the model results.58,69,86 The Vis differences between the observation (∼0.6 km) and the simulation (0.2–0.3 km) here are still reasonable considering the current modeling level of such extreme low Vis.87
| Northeast China region | Yangtze River Delta region | ||||||
|---|---|---|---|---|---|---|---|
| Case l | ψ | 1 | 0.5 | 0 | 1 | 0.5 | 0 |
| Vis (km) | 0.162 | 0.226 | 0.237 | 0.171 | 0.280 | 0.310 | |
| Obs-Vis (km) | 0.678 | 0.613 | |||||
| Case 2 | ψ | 1 | 0.5 | 0 | 1 | 0.5 | 0 |
| Vis (km) | 0.380 | 0.397 | 0.414 | 0.187 | 0.188 | 0.189 | |
| Obs-Vis (km) | 0.717 | 0.618 | |||||
3.3 Dependence of the effects on the cloud/fog depth
Table 3 provides the daily simulated regional mean cloud/fog key quantities with different ψ values for both cases. This provides valuable insights into the overall cloud/fog situation as well as the impact of various entrainment-mixing processes on the microphysical and radiative properties of cloud/fog in these regions. In addition, Fig. 11 shows the relative changes (inhomogeneous entrainment-mixing processes compared to homogeneous entrainment-mixing processes) in the daily simulated regional mean cloud/fog key quantities in both cases.| Northeast China region | Yangtze River Delta region | ||||||
|---|---|---|---|---|---|---|---|
| Case l | ψ | 1 | 0.5 | 0 | 1 | 0.5 | 0 |
| N c/f (cm−3) | 235.5 | 201.9 | 195.1 | 406.7 | 368.4 | 354.3 | |
| q c (g kg−1) | 0.151 | 0.146 | 0.143 | 0.190 | 0.186 | 0.182 | |
| LWP (g m−2) | 57.34 | 54.87 | 52.29 | 399.9 | 397.2 | 391.7 | |
| r e (μm) | 3.19 | 3.30 | 3.39 | 4.83 | 4.98 | 5.04 | |
| C/FOT | 20.66 | 19.35 | 18.30 | 121.8 | 118.9 | 116.7 | |
| Case 2 | ψ | 1 | 0.5 | 0 | 1 | 0.5 | 0 |
| N c/f (cm−3) | 449.6 | 416.2 | 393.2 | 365.1 | 348.0 | 336.2 | |
| q c (g kg−1) | 0.146 | 0.144 | 0.141 | 0.140 | 0.139 | 0.138 | |
| LWP (g m−2) | 39.03 | 38.24 | 37.36 | 61.30 | 60.98 | 60.58 | |
| r e (μm) | 3.97 | 4.21 | 4.32 | 3.93 | 4.05 | 4.10 | |
| C/FOT | 14.22 | 13.55 | 13.06 | 24.34 | 24.23 | 23.88 | |
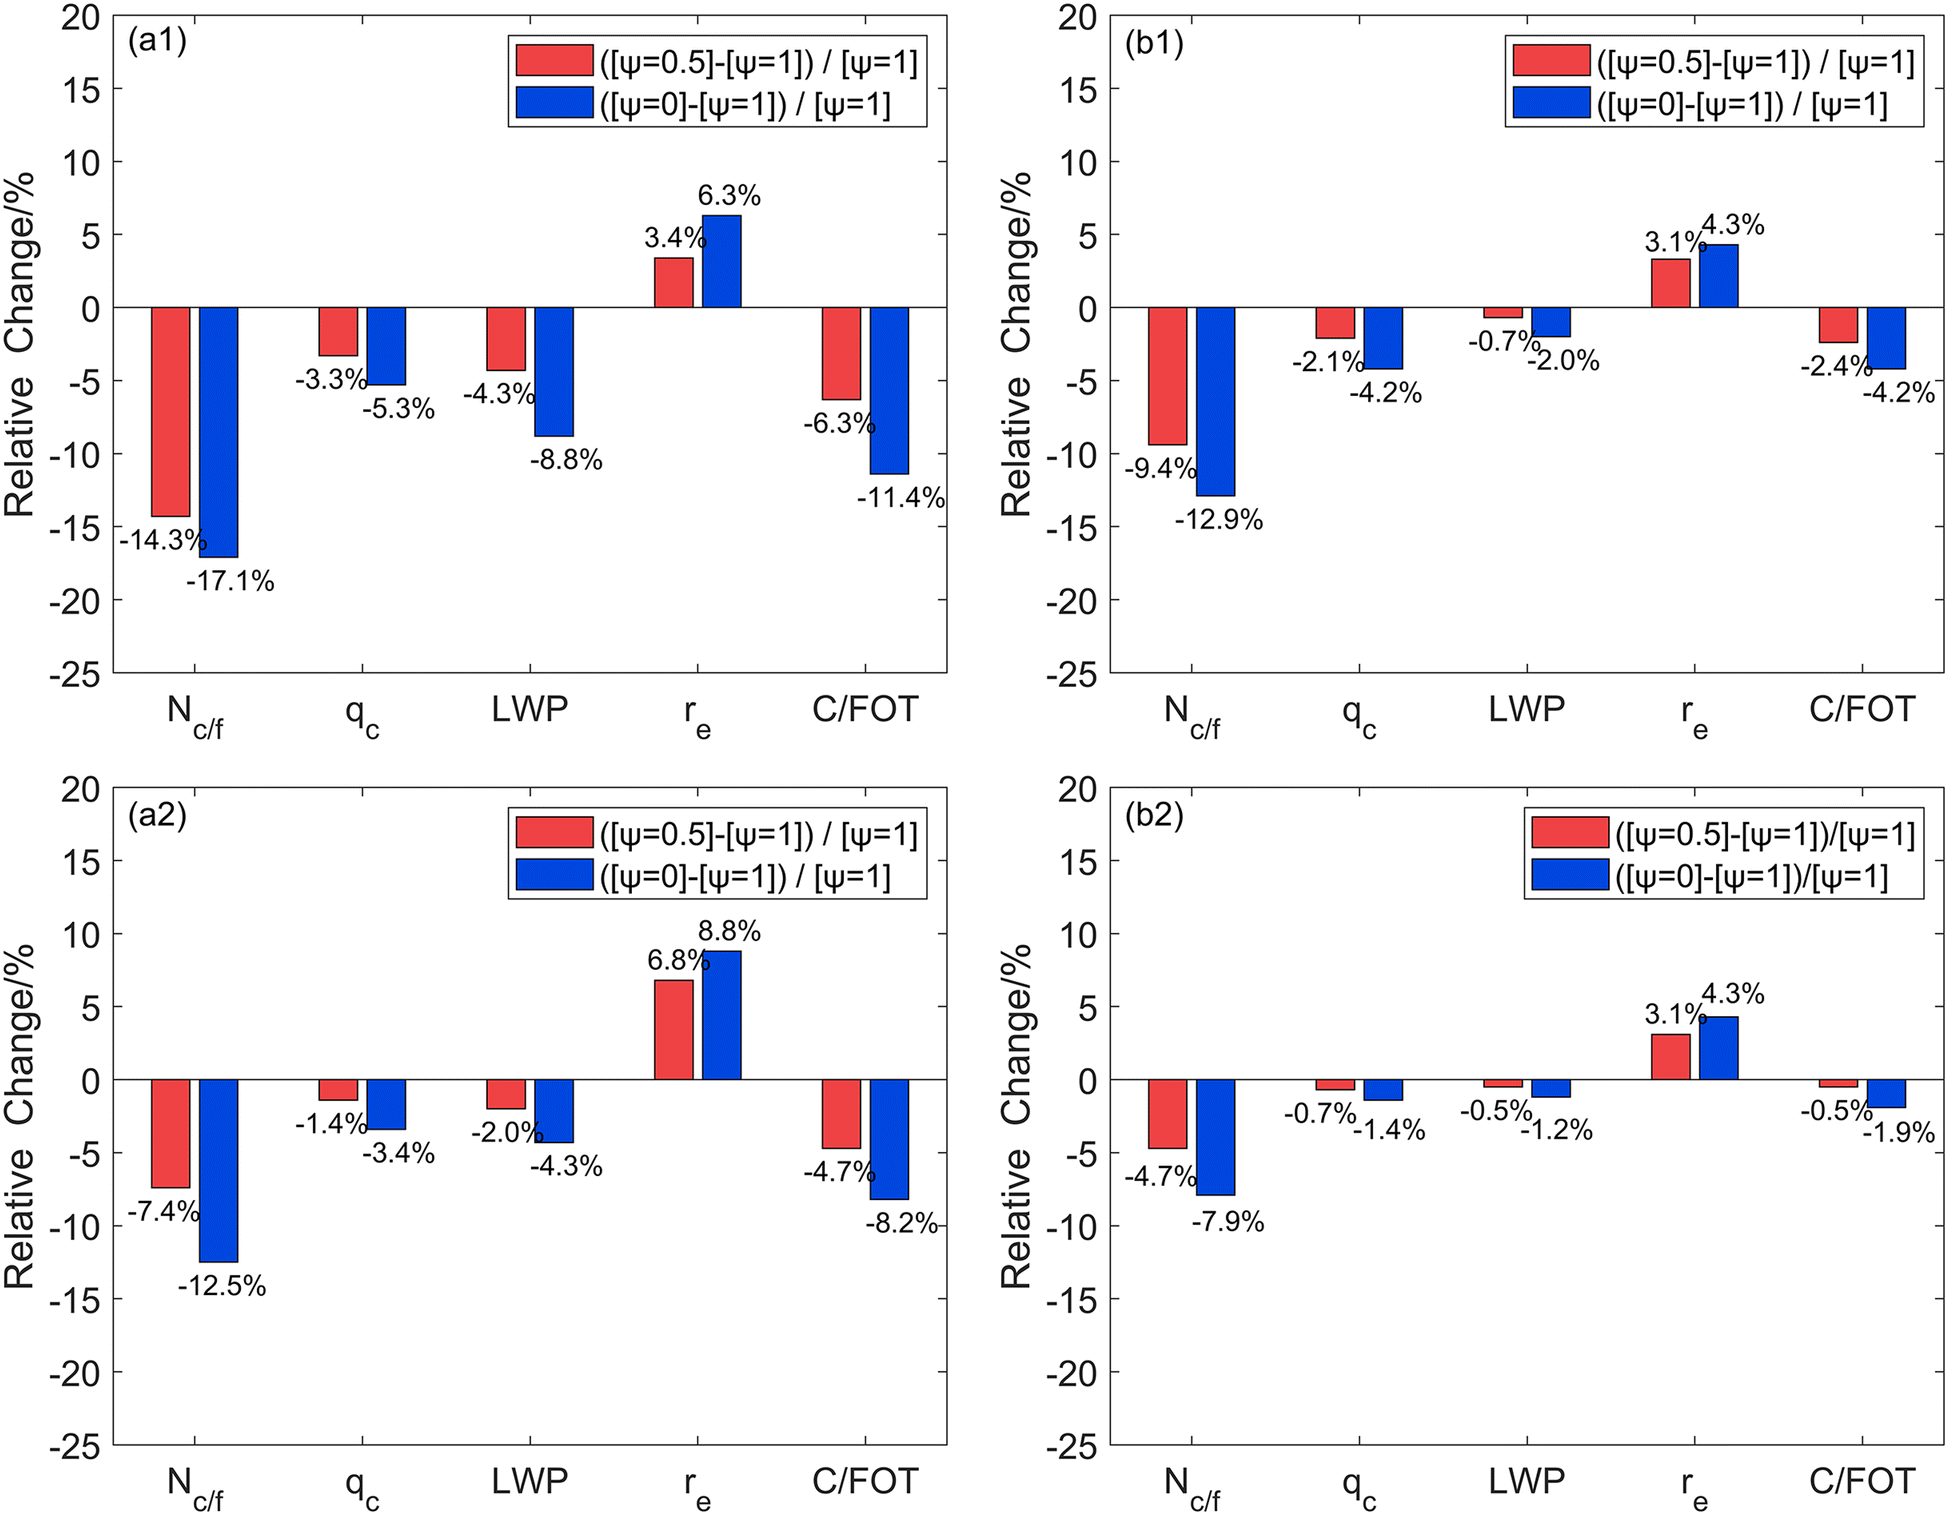 | ||
| Fig. 11 Relative changes in the daily simulated regional mean cloud/fog key quantities in the Northeast China region (left column) and the Yangtze River Delta region (right column) in Case 1 (a1 and b1) and Case 2 (a2 and b2) with homogeneous mixing degrees (ψ) = 0.5 and 0 compared to ψ = 1, including the cloud/fog droplet number concentration (Nc/f), cloud/fog water mixing ratio (qc), liquid water path (LWP), cloud/fog droplet effective radius (re), and cloud/fog optical thickness (C/FOT). | ||
Inhomogeneous entrainment-mixing processes lead to smaller Nc/f, LWP, and C/FOT and larger re in both regions in both cases. Compared to those in Case 1, where ψ = 1, Nc/f, LWP, and C/FOT decrease by 33.6 (40.4) cm−3, 2.5 (5.0) g m−2, and 1.3 (2.4), respectively, and re increases by 0.11 (0.20) μm for ψ = 0.5 (0) in the Northeast China region. Correspondingly, in the Yangtze River Delta region, Nc/f, LWP, and C/FOT decrease by 38.3 (52.4) cm−3, 2.7 (8.2) g m−2, and 2.9 (5.1), respectively, and re increases by 0.15 (0.21) μm for ψ = 0.5 (ψ = 0) compared to ψ = 1. The relative differences in Case 1 are also assessed using percentages. In the Northeast China region, Nc/f, LWP, and C/FOT decrease by 14.3% (17.1%), 4.3% (8.8%), and 6.3% (11.4%), respectively, whereas re increases by 3.4% (6.3%) at ψ = 0.5 (ψ = 0) compared to ψ = 1. In the Yangtze River Delta region, Nc/f, LWP, and C/FOT decrease by 9.4% (12.9%), 0.7% (2.0%), and 2.4% (4.2%), respectively, whereas re increase by 3.1% (4.3%) at ψ = 0.5 (ψ = 0) compared to ψ = 1. The relative changes in the cloud/fog key quantities in the Northeast China region are greater than those in the Yangtze River Delta region. Therefore, inhomogeneous entrainment-mixing processes impose more significant effects on the cloud/fog key quantities in the Northeast China region than in the Yangtze River Delta region in Case 1. Fig. 7 shows that the cloud/fog in the northeast China region are thinner than those in the Yangtze River Delta region, which suggests that inhomogeneous entrainment-mixing processes exert more significant effects on thin cloud/fog than on thick cloud/fog. According to Table 3 and Fig. 11, the same conclusion can also be reached in Case 2. The reasons for this difference are described below.
Based on the spatial distribution of liquid water (horizontally and vertically) in the two regions depicted in Fig. 6 and 7 for Case 1, there is a decrease in qc/f as the entertainment-mixing processes transition from homogeneous to inhomogeneous. This phenomenon can be attributed to the fact that when the entrainment-mixing processes in the clouds transition from homogeneous mixing to inhomogeneous mixing, the sizes of cloud/fog droplets increase. Consequently, the collision efficiency between cloud/fog droplets and other hydrometeor particles such as snow, graupel, and raindrops is also enhanced, and the mixing ratios of these hydrometeors in cloud/fog increase at the same time. In Case 1, for ψ = 1 and 0, the sum of the mixing ratios of snow, graupel, and raindrops in the Northeast China region is 0.00228, and 0.00234 g kg−1, respectively; the values are 0.0695 and 0.0714 g kg−1 in the Yangtze River Delta region.
3.4 Mechanisms underlying the dependence on cloud/fog depth
The proportions of evaporated grids in both regions are provided in Table 4 for both cases. The depth of cloud/fog variation between the two regions is observed, shedding light on the mechanisms of the effects of inhomogeneous entrainment-mixing processes on cloud/fog at different depths. In the inhomogeneous entrainment-mixing processes, 60% of the cloud/fog evaporated grids in the Northeast China region is inundated at ψ = 0.5 and 59% at ψ = 0 in Case 1, 51% at ψ = 0.5 and 50% at ψ = 0 in Case 2; these proportions are significantly greater than those in the Yangtze River Delta region (44% at ψ = 0.5 and 43% at ψ = 0 in Case 1; 45% at ψ = 0.5 and 44% at ψ = 0 in Case 2). This indicates that a higher portion of cloud/fog is affected by inhomogeneous entrainment-mixing processes in the Northeast China region than in the Yangtze River Delta region, and the relative changes (inhomogeneous entrainment-mixing processes compared to homogeneous entrainment-mixing processes) in cloud/fog key quantities are greater in the Northeast China region than in the Yangtze River Delta region for both cases. Consequently, the effects of inhomogeneous entrainment-mixing processes on cloud/fog key quantities are more significant in the Northeast China region than that of homogeneous entrainment-mixing processes in both cases. Physically, entrainment-mixing processes mainly occur near the cloud/fog top and lateral boundary; in the case of thin cloud/fog, entrainment of environmental air can affect cloud/fog more significantly.| Northeast China region | Yangtze River Delta region | ||
|---|---|---|---|
| Case l | Proportion of evaporated grids [ψ = 0.5] | 60% | 44% |
| Proportion of evaporated grids [ψ = 0] | 59% | 43% | |
| Case 2 | Proportion of evaporated grids [ψ = 0.5] | 51% | 45% |
| Proportion of evaporated grids [ψ = 0] | 50% | 44% | |
4 Conclusions
The microphysical and radiative properties of cloud/fog significantly affect precipitation, radiative transfer, and even the energy budget of the Earth-atmosphere system. The entrainment-mixing processes between cloud/fog and ambient air can alter the microphysical properties of the cloud/fog, impacting their radiative properties.However, it is difficult to utilize the default Thompson scheme of the atmospheric chemistry model GRAPES_Meso5.1/CUACE to examine the effects of different entrainment-mixing mechanisms on the microphysical and radiative properties of cloud/fog. In this study, this scheme is modified to include homogeneous mixing degree (ψ) to investigate the effects of various entrainment-mixing processes on the microphysical and radiative properties of cloud/fog. These cloud/fog properties include the cloud/fog droplet number concentration (Nc/f), liquid water path (LWP), cloud/fog droplet effective radius (re), visibility (Vis), and cloud/fog optical thickness (C/FOT).
The different homogeneous mixing degrees (ψ) represent various entrainment-mixing processes, indicating the homogeneity degree of the subgrid entrainment-mixing processes. In this study, the homogenous mixing degree (ψ) is set to 1, 0.5, or 0, representing homogeneous entrainment-mixing processes, inhomogeneous entrainment-mixing processes, or extremely inhomogeneous entrainment-mixing processes, respectively. The purpose of this study is to investigate the effects of these various entrainment-mixing processes on the microphysical and radiative properties of regional fog that simultaneously occurred in the Northeast China and Yangtze River Delta regions from December 31, 2016, to January 2, 2017, and from January 6 to 8, 2017.
Compared to homogeneous entrainment-mixing processes (ψ = 1), inhomogeneous entrainment-mixing processes (ψ < 1) result in lower smaller cloud/fog droplet number concentration (Nc/f), liquid water path (LWP), and larger cloud/fog droplet effective radius (re). Consequently, this results in reduced cloud/fog optical thickness (C/FOT) and increased visibility (Vis) for cloud/fog in both regions.
Furthermore, compared with those in the Yangtze River Delta region, the inhomogeneous entrainment-mixing processes exert more significant effects in the Northeast China region on the relative changes in the cloud/fog droplet number concentration (Nc/f), liquid water path (LWP), cloud/fog droplet effective radius (re), and cloud/fog optical thickness (C/FOT). The thickness of cloud/fog in the Northeast China region is smaller than that in the Yangtze River Delta region, so inhomogeneous entrainment-mixing processes impose more significant effects on thinner cloud/fog than on thicker cloud/fog. This difference occurs because the proportion of evaporated grids in the cloud/fog in the Northeast China region is higher than that in the Yangtze River Delta region. At homogeneous mixing degrees (ψ) of 0.5 and 0, the proportions of evaporated grids in the Northeast China region are 51% and 50%, respectively, during the previous period, 60% and 59%, respectively, during the following period. In comparison, the proportions of evaporated grids in the Yangtze River Delta region are 44% and 43%, respectively, during the previous period, and 45% and 44%, respectively, during the following period. This results in more cloud/fog droplets evaporates in the Northeast China region. In conclusion, the effects of inhomogeneous entrainment-mixing processes are more significant in thin cloud/fog in the Northeast China region than in thick cloud/fog in the Yangtze River Delta region.
Data availability
Data will be made available on request.Author contributions
Yang Zhao: data curation, formal analysis, investigation, methodology, software, visualization, validation, & writing – original draft. Hong Wang: conceptualization, funding acquisition, project administration, supervision, & writing – review & editing. Xiaoqi Xu: software, writing – review & editing. Wenjie Zhang: software, resources. Chen Han: software. Yue Peng: software. Chunsong Lu: conceptualization, funding acquisition, project administration, supervision, & writing – review & editing.Conflicts of interest
The authors declare no conflict of interest.Acknowledgements
This research has been supported by the National Natural Science Foundation of China (42325503) and the National Natural Science Foundation of China (42175099).References
- M. D. King, S. Platnick, W. P. Menzel, S. A. Ackerman and P. A. Hubanks, Spatial and temporal distribution of clouds observed by MODIS onboard the Terra and Aqua satellites, IEEE Trans. Geosci. Remote Sens., 2013, 51, 3826–3852 Search PubMed.
- C. J. Stubenrauch, W. B. Rossow, S. Kinne, S. Ackerman, G. Cesana, H. Chepfer, L. Di Girolamo, B. Getzewich, A. Guignard, A. Heidinger, B. C. Maddux, W. P. Menzel, P. Minnis, C. Pearl, C. Platnick, C. Poulsen, J. Riedi, S. Sun-Mack, A. Walther, D. Winker, S. Zeng and G. Zhao, Assessment of global cloud datasets from satellites: Project and database initiated by the GEWEX radiation panel, Bull. Am. Meteorol. Soc., 2013, 94, 1031–1049 CrossRef.
- B. Yang, Y. Qian, G. Lin, L. R. Leung, P. J. Rasch, G. J. Zhang, S. A. McFarlane, C. Zhao, Y. Zhang, H. Wang, M. Wang and X. Liu, Uncertainty quantification and parameter tuning in the CAM5 Zhang-McFarlane convection scheme and impact of improved convection on the global circulation and climate, J. Geophys. Res.: Atmos., 2013, 118, 395–415 CrossRef.
- G. Chen, W. Wang and J. Chen, Aerosol-stratocumulus-radiation interactions over the southeast Pacific, J. Atmos. Sci., 2015, 72, 2612–2621 CrossRef.
- C. Zhao, Y. Yang, Y. Chi, Y. Sun, X. Zhao, L. Husi and Y. Xia, Recent progress in cloud physics and associated radiative effects in China from 2016 to 2022, Atmos. Res., 2023, 293, 106899 CrossRef.
- X. Gong, H. Wex, T. Müller, A. Wiedensohler, K. Höhler, K. Kandler, N. Ma, B. Dietel, T. Schiebel, O. Möhler and F. Stratmann, Characterization of aerosol properties at Cyprus, focusing on cloud condensation nuclei and ice-nucleating particles, Atmos. Chem. Phys., 2019, 19(16), 10883–10900 CrossRef CAS.
- G. Caniaux, J. L. Redelsperger and J. P. Lafore, A numerical study of the stratiform region of a fast-moving squall line. Part I: General description and water and heat budgets, J. Atmos. Sci., 1994, 51(14), 2046–2074 CrossRef.
- P. R. Bannon, Theoretical foundations for models of moist convection, J. Atmos. Sci., 2002, 59(12), 1967–1982 CrossRef.
- W. Gao, L. Liu, J. Li and C. Lu, The microphysical properties of convective precipitation over the Tibetan Plateau by a subkilometer resolution cloud-resolving simulation, J. Geophys. Res.: Atmos., 2018, 123(6), 3212–3227 CrossRef.
- S. Yu, Y. Luo, C. Wu, D. Zheng, X. Liu and W. Xu, Convective and microphysical characteristics of extreme precipitation revealed by multisource observations over the Pearl River Delta at monsoon coast, Geophys. Res. Lett., 2022, 49(2), e2021GL097043 CrossRef.
- W. W. Grabowski, Indirect impact of atmospheric aerosols in idealized simulations of convective-radiative quasi equilibrium, J. Clim., 2006, 19, 4664–4682 CrossRef.
- H. Siebert, K. Lehmann and M. Wendisch, Observations of small-scale turbulence and energy dissipation rates in the cloudy boundary layer, J. Atmos. Sci., 2006, 63, 1451–1466 CrossRef.
- F. Chosson, J. L. Brenguier and L. Schüller, Entrainment-mixing and radiative transfer simulation in boundary layer clouds, J. Atmos. Sci., 2007, 64, 2670–2682 CrossRef.
- J. Slawinska, W. W. Grabowski, H. Pawlowska and A. A. Wyszogrodzki, Optical properties of shallow convective clouds diagnosed from a bulk-microphysics large-eddy simulation, J. Clim., 2008, 21, 1639–1647 CrossRef.
- K. Lehmann, H. Siebert and R. A. Shaw, Homogeneous and inhomogeneous mixing in cumulus clouds: Dependence on local turbulence structure, J. Atmos. Sci., 2009, 66, 3641–3659 CrossRef.
- W. W. Grabowski and H. Morrison, Indirect impact of atmospheric aerosols in idealized simulations of convective–radiative quasi equilibrium. Part II: Double-moment microphysics, J. Clim., 2011, 24, 1897–1912 CrossRef.
- C. Lu, Y. Liu and S. Niu, Examination of turbulent entrainment-mixing mechanisms using a combined approach, J. Geophys. Res.: Atmos., 2011, 116, D20207 CrossRef.
- J. Slawinska, W. W. Grabowski, H. Pawlowska and H. Morrison, Droplet activation and mixing in large-eddy simulation of a shallow cumulus field, J. Atmos. Sci., 2012, 69, 444–462 CrossRef.
- D. Jarecka, W. W. Grabowski, H. Morrison and H. Pawlowska, Homogeneity of the subgrid-scale turbulent mixing in large-eddy simulation of shallow convection, J. Atmos. Sci., 2013, 70, 2751–2767 CrossRef.
- M. H. Tölle and S. K. Krueger, Effects of entrainment and mixing on droplet size distributions in warm cumulus clouds, J. Adv. Model. Earth Syst., 2014, 6, 281–299 CrossRef.
- C. Lu, L. Zhu, Y. Liu, F. Mei, J. D. Fast, M. S. Pekour, S. Luo, X. Xu, X. He, J. Li and S. Gao, Observational study of relationships between entrainment rate, homogeneity of mixing, and cloud droplet relative dispersion, Atmos. Res., 2023, 293, 106900 CrossRef.
- L. Zhu, C. Lu, X. Xu, X. He, J. Li, S. Luo, Y. Wang and F. Wang, The Probability Density Function Related to Shallow Cumulus Entrainment Rate and Its Influencing Factors in a Large-Eddy Simulation, Adv. Atmos. Sci., 2023, 1–15 Search PubMed.
- X. Xu, Z. Heng, Y. Li, S. Wang, J. Li, Y. Wang, J. Chen, P. Zhang and C. Lu, Improvement of cloud microphysical parameterization and its advantages in simulating precipitation along the Sichuan-Tibet Railway, Sci. China: Earth Sci., 2024, 1869–1897 Search PubMed.
- C. Lu, Y. Liu, X. Xu, S. Gao, and C. Sun, Entrainment, Mixing, and Their Microphysical Influences, Fast Processes in Large Scale Atmospheric Models, 2023, pp. 87–120 Search PubMed.
- W. A. Cooper, S. G. Lasher-Trapp and A. M. Blyth, The influence of entrainment and mixing on the initial formation of rain in a warm cumulus cloud, J. Atmos. Sci., 2013, 70, 1727–1743 CrossRef.
- C. Lu, Y. Liu, S. Niu and A. M. Vogelmann, Empirical relationship between entrainment rate and microphysics in cumulus clouds, Geophys. Res. Lett., 2013, 40, 2333–2338 CrossRef.
- Y. Yang and S. Gao, The impact of turbulent diffusion driven by fog-top cooling on sea fog development, J. Geophys. Res.: Atmos., 2020, 125, e2019JD031562 CrossRef.
- H. Shao and G. Liu, Influence of mixing on evaluation of the aerosol first indirect effect, Geophys. Res. Lett., 2006, 33, L14809 CrossRef.
- H. Xue and G. Feingold, Large-eddy simulations of trade wind cumuli: Investigation of aerosol indirect effects, J. Atmos. Sci., 2006, 63, 1605–1622 CrossRef.
- H. Xue, G. Feingold and B. Stevens, Aerosol effects on clouds, precipitation, and the organization of shallow cumulus convection, J. Atmos. Sci., 2008, 65, 392–406 CrossRef.
- J. Guo, M. Deng, S. S. Lee, F. Wang, Z. Li, P. Zhai, H. Liu, W. Lv, W. Yao and X. Li, Delaying precipitation and lightning by air pollution over the Pearl River Delta. Part I: Observational analyses, J. Geophys. Res.: Atmos., 2016, 121, 6472–6488 CrossRef.
- R. Li, X. Dong, J. Guo, Y. Fu, C. Zhao, Y. Wang and Q. Min, The implications of dust ice nuclei effect on cloud top temperature in a complex mesoscale convective system, Sci. Rep., 2017, 7, 13826 CrossRef PubMed.
- J. W. Telford and S. K. Chai, Marine fog and its dissipation over warm water, J. Atmos. Sci., 1993, 50, 3336–3349 CrossRef.
- S. Wu, C. Lu, L. Zhu, S. Gao and J. Lü, Examination of Mechanisms Underlying the Variations of Microphysical Properties in Different Fog Phases from the Perspective of Entrainment, Chin. J. Atmos. Sci., 2021, 45, 1057–1070 Search PubMed.
- M. B. Baker and J. Latham, The evolution of droplet spectra and the rate of production of embryonic raindrops in small cumulus clouds, J. Atmos. Sci., 1979, 36, 1612–1615 CrossRef.
- M. B. Baker, R. G. Corbin and J. Latham, The influence of entrainment on the evolution of cloud droplet spectra: I. A model of inhomogeneous mixing, Q. J. R. Meteorol. Soc., 1980, 106, 581–598 CrossRef.
- J. B. Jensen, P. H. Austin, M. B. Baker and A. M. Blyth, Turbulent mixing, spectral evolution and dynamics in a warm cumulus cloud, J. Atmos. Sci., 1985, 42, 173–192 CrossRef.
- F. Burnet and J. L. Brenguier, Observational study of the entrainment-mixing process in warm convective clouds, J. Atmos. Sci., 2007, 64, 1995–2011 CrossRef.
- H. Pawlowska, J. L. Brenguier and F. Burnet, Microphysical properties of stratocumulus clouds, Atmos. Res., 2000, 55, 15–33 CrossRef.
- K. E. Haman, S. P. Malinowski, M. J. Kurowski, H. Gerber and J. L. Brenguier, Small scale mixing processes at the top of a marine stratocumulus-A case study, Q. J. R. Meteorol. Soc., 2007, 133, 213–226 CrossRef.
- E. Freud, D. Rosenfeld, M. O. Andreae, A. A. Costa and P. Artaxo, Robust relations between CCN and the vertical evolution of cloud drop size distribution in deep convective clouds, Atmos. Chem. Phys., 2008, 8, 1661–1675 CrossRef CAS.
- E. Freud, D. Rosenfeld and J. R. Kulkarni, Resolving both entrainment-mixing and number of activated CCN in deep convective clouds, Atmos. Chem. Phys., 2011, 11, 12887–12900 CrossRef CAS.
- S. Luo, C. Lu, Y. Liu, J. Bian, W. Gao, J. Li, X. Xu, S. Gao, S. Yang and X. Guo, Parameterizations of entrainment-mixing mechanisms and their effects on cloud droplet spectral width based on numerical simulations, J. Geophys. Res.: Atmos., 2020, 125, e2020JD032972 CrossRef.
- C. Lu, Y. Liu, S. Niu and S. Endo, Scale dependence of entrainment-mixing mechanisms in cumulus clouds, J. Geophys. Res.: Atmos., 2014, 119, 13877–13890 Search PubMed.
- S. Gao, C. Lu, Y. Liu, F. Mei, J. Wang, L. Zhu and S. Yan, Contrasting scale dependence of entrainment-mixing mechanisms in stratocumulus clouds, Geophys. Res. Lett., 2020, 47, e2020GL086970 CrossRef.
- N. Desai, Y. Liu, S. Glienke, R. A. Shaw, C. Lu, J. Wang and S. Gao, Vertical variation of turbulent entrainment mixing processes in marine stratocumulus clouds using high-resolution digital holography, J. Geophys. Res.: Atmos., 2021, 126, e2020JD033527 CrossRef.
- S. S. Yum, J. Wang, Y. Liu, G. Senum, S. Springston, R. McGraw and J. M. Yeom, Cloud microphysical relationships and their implication on entrainment and mixing mechanism for the stratocumulus clouds measured during the VOCALS project, J. Geophys. Res.: Atmos., 2015, 120, 5047–5069 CrossRef.
- J. M. Yeom, S. S. Yum, R. A. Shaw, I. La, J. Wang, C. Lu, Y. Liu, F. Mei, B. Schmid and A. Matthews, Vertical variations of cloud microphysical relationships in marine stratocumulus clouds observed during the ACE-ENA campaign, J. Geophys. Res.: Atmos., 2021, 126, e2021JD034700 CrossRef.
- J. M. Yeom, I. Helman, P. Prabhakaran, J. C. Anderson, F. Yang, R. A. Shaw and W. Cantrell, Cloud microphysical response to entrainment and mixing is locally inhomogeneous and globally homogeneous: Evidence from the lab, Proc. Natl. Acad. Sci. U.S.A., 2023, 120, e2307354120 CrossRef CAS PubMed.
- X. Xu, C. Lu, Y. Liu, S. Luo, X. Zhou, S. Endo, L. Zhu and Y. Wang, Influences of an entrainment-mixing parameterization on numerical simulations of cumulus and stratocumulus clouds, Atmos. Chem. Phys., 2022, 22, 5459–5475 CrossRef CAS.
- B. Kumar, F. Janetzko, J. Schumacher and R. A. shaw, Extreme responses of a coupled scalar–particle system during turbulent mixing, New J. Phys., 2012, 14(11), 115020 CrossRef.
- B. Kumar, J. Schumacher and R. A. shaw, Cloud microphysical effects of turbulent mixing and entrainment, Theor. Comput. Fluid Dyn., 2013, 27, 361–376 CrossRef.
- B. Kumar, P. Götzfried, N. Suresh, J. Schumacher and R. A. Shaw, Scale dependence of cloud microphysical response to turbulent entrainment and mixing, J. Adv. Model. Earth Syst., 2018, 10, 2777–2785 CrossRef.
- W. W. Grabowski, Indirect impact of atmospheric aerosols in idealized simulations of convective–radiative quasi equilibrium, J. Clim., 2006, 19, 4664–4682 CrossRef.
- S. G. Lasher-Trapp, W. A. Cooper and A. M. Blyth, Broadening of droplet size distributions from entrainment and mixing in a cumulus cloud, Q. J. R. Meteorol. Soc., 2005, 131, 195–220 CrossRef.
- M. H. Tölle and S. K. Krueger, Effects of entrainment and mixing on droplet size distributions in warm cumulus clouds, J. Adv. Model. Earth Syst., 2014, 6, 281–299 CrossRef.
- Y. Peng, H. Wang, X. Zhang, Y. Zheng, X. Zhang, W. Zhang, Z. Liu, K. Gui, H. Liu and Y. Wang, Aerosol-radiation interaction in the operational atmospheric chemistry model GRAPES_Meso5. 1/CUACE and its impacts on mesoscale NWP in Beijing-Tianjin-Hebei, China, Atmos. Res., 2022, 280, 106402 CrossRef CAS.
- H. Wang, X. Zhang, P. Wang, Y. Peng, W. Zhang, Z. Liu, C. Han, S. Li, Y. Wang and H. Che, Chemistry-Weather Interacted Model System GRAPES_Meso5. 1/CUACE CW V1. 0: Development, Evaluation and Application in Better Haze/Fog Prediction in China, J. Adv. Model. Earth Syst., 2022, 14, e2022MS003222 CrossRef.
- D. Chen and X. Shen, Recent progress on GRAPES research and application, J. Appl. Meteorol. Sci., 2006, 17, 773–777 Search PubMed.
- D. Chen, J. Xue, X. Yang, H. Zhang, X. Shen, J. Hu, Y. Wang, L. Ji and J. Chen, New generation of multi-scale NWP system (GRAPES): General scientific design, Chin. Sci. Bull., 2008, 53, 3433–3445 CrossRef.
- H. Wang, M. Xue, X. Zhang, H. Liu, C. Zhou, S. Tan, H. Che, B. Chen and T. Li, Mesoscale modeling study of the interactions between aerosols and PBL meteorology during a haze episode in Jing–Jin–Ji (China) and its nearby surrounding region–Part 1: Aerosol distributions and meteorological features, Atmos. Chem. Phys., 2015, 15, 3257–3275 CrossRef CAS.
- G. Xu, D. Chen, J. Xue, J. Sun, X. Shen, Y. Shen, L. Huang, X. Wu, H. Zhang and S. Wang, The program structure designing and optimizing tests of GRAPES physics, Chin. Sci. Bull., 2008, 53, 3470–3476 CrossRef.
- S. Gong, L. A. Barrie, J. P. Blanche, K. Von Salzen, U. Lohmann, G. Lesins, L. Spacek, L. Zhang, E. Girard and H. Lin, Canadian Aerosol Module: A size-segregated simulation of atmospheric aerosol processes for climate and air quality models 1. Module development, J. Geophys. Res.: Atmos., 2003, 108, 4007 CrossRef.
- S. Gong and X. Zhang, CUACE/Dust–an integrated system of observation and modeling systems for operational dust forecasting in Asia, Atmos. Chem. Phys., 2008, 8, 2333–2340 CrossRef CAS.
- B. Zheng, D. Tong, M. Li, F. Liu, C. Hong, G. Geng, H. Li, X. Li, L. Peng and J. Qi, Trends in China's anthropogenic emissions since 2010 as the consequence of clean air actions, Atmos. Chem. Phys., 2018, 18, 14095–14111 CrossRef CAS.
- H. Wang, S. Gong, H. Zhang, Y. Chen, X. Shen, D. Chen, J. Xue, Y. Shen, X. Wu and Z. Jin, A new-generation sand and dust storm forecasting system GRAPES_CUACE/Dust: Model development, verification and numerical simulation, Chin. Sci. Bull., 2010, 55, 635–649 CrossRef CAS.
- H. Wang, X. Zhang, S. Gong, Y. Chen, G. Shi and W. Li, Radiative feedback of dust aerosols on the East Asian dust storms, J. Geophys. Res.: Atmos., 2010, 115, D23214 Search PubMed.
- H. Wang, Y. Peng, X. Zhang, H. Liu, M. Zhang, H. Che, Y. Cheng and Y. Zheng, Contributions to the explosive growth of PM 2.5 mass due to aerosol–radiation feedback and decrease in turbulent diffusion during a red alert heavy haze in Beijing–Tianjin–Hebei, China, Atmos. Chem. Phys., 2018, 18, 17717–17733 CrossRef CAS.
- Y. Peng, H. Wang, M. Hou, T. Jiang, M. Zhang, T. Zhao and H. Che, Improved method of visibility parameterization focusing on high humidity and aerosol concentrations during fog–haze events: Application in the GRAPES_CAUCE model in Jing-Jin-Ji, China, Atmos. Environ., 2020, 222, 117139 CrossRef CAS.
- W. Zhang, H. Wang, X. Zhang, L. Huang, Y. Peng, Z. Liu, X. Zhang and H. Che, Aerosol–cloud interaction in the atmospheric chemistry model GRAPES_Meso5. 1/CUACE and its impacts on mesoscale numerical weather prediction under haze pollution conditions in Jing–Jin–Ji in China, Atmos. Chem. Phys., 2022, 22, 15207–15221 CrossRef CAS.
- W. Zhang, X. Zhang and H. Wang, The Role of Aerosol-Radiation Interaction in the Meteorology Prediction at the Weather Scale in the Numerical Weather Prediction Model, Geophys. Res. Lett., 2022, 49, e2021GL097026 CrossRef.
- M. Zhang, H. Wang, X. Zhang, Y. Peng and H. Che, Applying the WRF double-moment six-class microphysics scheme in the GRAPES_Meso model: A case study, J. Meteorol. Res., 2018, 32, 246–264 CrossRef.
- Y. Shi, H. Wang, X. Shen, W. Zhang, M. Zhang, X. Zhang, Y. Peng, Z. Liu and J. Han, Application of Morrison Cloud Microphysics Scheme in GRAPES_Meso Model and the Sensitivity Study on CCN's Impacts on Cloud Radiation, Atmosphere, 2021, 12, 489 CrossRef.
- E. J. Mlawer, S. J. Taubman, P. D. Brown, M. J. Iacono and S. A. Clough, Radiative transfer for inhomogeneous atmospheres: RRTM, a validated correlated-k model for the longwave, J. Geophys. Res.: Atmos., 1997, 102, 16663–16682 CrossRef CAS.
- M. D. Chou, M. J. Suarez, C. H. Ho, M. M. Yan and K. T. Lee, Parameterizations for cloud overlapping and shortwave single-scattering properties for use in general circulation and cloud ensemble models, J. Clim., 1998, 11, 202–214 CrossRef.
- F. Chen and J. Dudhia, Coupling an advanced land surface–hydrology model with the Penn State–NCAR MM5 modeling system. Part I: Model implementation and sensitivity, Mon. Weather Rev., 2001, 129, 569–585 CrossRef.
- Z. I. Janić, Nonsingular Implementation of the Mellor-Yamada Level 2.5 Scheme in the NCEP Meso Model, 2001 Search PubMed.
- J. S. Kain and J. M. Fritsch, Convective Parameterization for Mesoscale Models: The Kain–Fritsch Scheme, ed. K. A. Emanuel and D. J. Raymond, American Meteorological Society, Boston, MA, 1993, pp. 165–170 Search PubMed.
- G. Thompson, P. R. Field, R. M. Rasmussen and W. D. Hall, Explicit forecasts of winter precipitation using an improved bulk microphysics scheme. Part II: Implementation of a new snow parameterization, Mon. Weather Rev., 2008, 136, 5095–5115 CrossRef.
- G. Thompson and T. Eidhammer, A Study of Aerosol Impacts on Clouds and Precipitation Development in a Large Winter Cyclone, J. Atmos. Sci., 2014, 71, 3636–3658 CrossRef.
- H. Morrison and W. W. Grabowski, Modeling supersaturation and subgrid-scale mixing with two-moment bulk warm microphysics, J. Atmos. Sci., 2008, 65, 792–812 CrossRef.
- C. Lu, Y. Liu, S. Niu, S. Krueger and T. Wagner, Exploring parameterization for turbulent entrainment-mixing processes in clouds, J. Geophys. Res.: Atmos., 2013, 118, 185–194 CrossRef.
- N. Shao, C. Lu, X. Jia, Y. Wang, Y. Li, Y. Yin, B. Zhu, T. Zhao, D. Liu, S. Niu, S. Fan, S. Yan and J. Lv, Radiation fog properties in two consecutive events under polluted and clean conditions in the Yangtze River Delta, China: A simulation study, Atmos. Chem. Phys., 2023, 23, 9873–9890 CrossRef CAS.
- X. Cao, L. Shao and X. Li, Study on Visibility Parameterization Scheme in Fog Model [C]//The 31st Annual Meeting of Chinese Meteorological Society S2 Disaster Weather Monitoring, Analysis and Forecast (in Chinese), Beijing, Chinese Meteorological Society, Beijing, 2014 Search PubMed.
- X. Rui, C. Lu, Y. Yin, J. Lü, K. Chen, Y. Xue, Y. Wang, X. Xu and J. Wang, Improved Visibility Diagnostic Scheme Based on Fog Microphysical Observation, Chinese J. Atmospheric Sci., 2022, 47, 1–13 Search PubMed.
- Z. Liu, H. Wang, Y. Peng, W. Zhang and M. Zhao, Multiple Regression Analysis of low visibility focusing on severe haze-fog pollution in various regions of China, Atmosphere, 2022, 13(2), 203 CrossRef.
- C. Han, H. Wang, Y. Peng, Z. Liu, W. Zhang, Y. Zhao, H. Ning, P. Wang and H. Che, The application study of the revised IMPROVE atmospheric extinction algorithm in atmospheric chemistry model focusing on improving low visibility prediction in eastern China, Atmos. Res., 2023, 298, 107135 CrossRef.
| This journal is © The Royal Society of Chemistry 2024 |