
 Open Access Article
 This Open Access Article is licensed under a
 Creative Commons Attribution 3.0 Unported Licence
Trigonal NHC bis-pyridyl silver(I) complexes: a beacon of light in the darkness of light-emitting electrochemical cells?†
Ginevra
Giobbio
 ab,
Lucie
Greffier
c,
Sophia
Lipinski
b,
Anaïs
Montrieul
a,
Jean-François
Lohier
d,
Mathieu
Linares
e,
Rubén D.
Costa
*b and
Sylvain
Gaillard
*a
ab,
Lucie
Greffier
c,
Sophia
Lipinski
b,
Anaïs
Montrieul
a,
Jean-François
Lohier
d,
Mathieu
Linares
e,
Rubén D.
Costa
*b and
Sylvain
Gaillard
*a
aNormandy University, ENSICAEN, UNICAEN, CNRS, LCMT, 1400 Caen, France. E-mail: sylvain.gaillard@ensicaen.fr
bTechnical University of Munich, Campus Straubing for Biotechnology and Sustainability, Chair of Biogenic Functional Materials, Schulgasse 22, 94315, Germany. E-mail: ruben.costa@tum.de
cDivision of Theoretical Chemistry and Biology, School of Engineering Sciences in Chemistry, Biotechnology and Health, KTH Royal Institute of Technology, SE-100 44 Stockholm, Sweden
dNormandy University, ENSICAEN, UNICAEN, CNRS, CRISMAT, 14000 Caen, France
ePDC Centre for High Performance Computing, EECS, KTH Royal Institute of Technology, Stockholm, Sweden
First published on 16th October 2024
Abstract
Complex [Ag(IPr)(3-Medpa)][PF6] (1), possessing the same combination of ligands as previously reported [Cu(IPr)(3-Medpa)][PF6] (2) applied in a blue-emitting light-emitting electrochemical cell (LEC), has been synthesized and fully structurally and photophysically characterized both in powder and thin-film form. In detail, temperature-dependent steady-state, time-resolved emission experiments, and computational calculations have been performed to understand the impact of the nature of the metal ion center on the photophysical and electroluminescent properties. Here, a direct comparison between the complexes reveals (i) a distinct emission behavior, such as fluorescence (1) vs. thermally activated delay fluorescence (2), caused by the changes of the nature of the emitting excited states from ligand centered (1) to metal-to-ligand charge transfer (2), (ii) an unforeseen crystallinity-dependent emission in 1 that leads to either smooth and non-emissive thin-films or phase aggregated and emissive thin-films, and (iii) 1-based LECs with a stable electrical behavior over 100 h, which contrasts with the prior start-of-the-art value of a few minutes (2).
Introduction
Light-emitting electrochemical cells (LECs) have now been studied for three decades as an alternative or close congener of OLEDs.1–3 During this time, many types of emitter have been explored, such as conjugated polymers, ionic transition metal complexes (iTMCs), small molecules, and quantum dots.4–8 Among the iTMCs, the first iridium(III) complexes have been extensively studied as phosphorescent emitters that could allow a theoretically 100% external quantum efficiency (EQE). Even though very impressively performing LECs have been achieved with iridium(III) complexes (>5000 h stability and external quantum efficiencies of >20%),9,10 they present too many drawbacks for wide-spread industrial use, such as price and the lack of stable blue-emitting derivatives.3 Thus, copper(I) complexes have led the race due to (i) the d10 configuration, avoiding non-radiative metal-centered (MC) transition, (ii) their emission mechanism, i.e. thermally activated delayed fluorescence (TADF), allowing also a theoretical 100% EQE, and (iii) the abundance of copper in the Earth's crust, making them less expensive.11–16 Nevertheless, the best performance of LECs developed with copper(I) complexes as emitters has only reached a record of 200 h17 and they have only recently achieved performance on par with that of blue LECs based on iridium(III) complexes.18–20 To provide stable LEC devices incorporating non-expensive iTMCs as an emitter, silver(I) complexes have appeared recently to be a good compromise between iridium(III) and copper(I) complexes. Indeed, emissive silver(I) complexes are characterized by higher stability and ability to design complexes emitting in the high-energy part of the spectrum compared to their Cu(I)-based analogues.21,22 In detail, the silver(I) complexes are characterized by a highly blue-shifted emission since the 4d orbitals of silver(I) are often lower in energy compared to ligand-centered orbitals. Thus, their emission is usually characterized by ligand-centered transitions (LC), since MLCT excited states are too high in energy to be accessible.23–26 In spite of this fact, their use as emitters for LECs is still very rare. In short, Moudam et al. showed a yellowish electroluminescent response of heteroleptic silver(I) complexes without disclosing device performance.27 Fresta et al. reported yellow-emitting LECs incorporating silver(I) complexes combining XanthPhos (4,5-bis(diphenylphosphino)-9,9-dimethylxanthene) and bipyridine derivatives, elucidating the device degradation of a few seconds via the formation of Ag(0) nanoclusters under device operation. The device was optimized with 2-(4-tert-butylphenyl)-5-(4-biphenylyl)-1,3,4-oxadiazole (PBD) as an electron transport layer (ETL), increasing the stability up to 80 h with a good luminance (Lmax) level of 35 cd m−2.28 Of note, the copper-based analogue in LECs showed a slightly higher luminance (Lmax = 54 cd m−2), but starkly lower stability (t1/2 = 1.8 min).29 Finally, Lipinski et al. reported red-emitting LECs using a silver(I) complex bearing XanthPhos and biquinoline derivatives as ligands. In this case, Ag(0) nanoclusters were not formed in solution or the devices, while the use of 4,4′-bis(N-carbazolyl)-1,1′-biphenyl (CBP) as a hole transport layer led to devices with Lmax of 12 cd m−2 and a t1/2 of 5 h.30 Likewise, the copper(I) analogue implemented in the same device architecture led to a lifetime of only 25 min.31 As far as trigonal silver(I) complexes are concerned, we recently reported an interesting aggregation induced emission (AIE) occurring with [Ag(IPr)(bpy)][PF6] (bpy = 2,2′-bipyridine) that could pave the way to a new class of silver(I) emitter in LEC devices.32 They featured a stable electrical behavior, but a lack of light response since the active layers did not feature any AIE behavior. Under the spotlight of these works, we envisaged to incorporate analogous N-heterocyclic carbene (NHC) silver(I) complexes bearing a bis-pyridyl derivative in LEC devices.19,33,34 Here, we report the synthesis, and the structural, photophysical and theoretical studies of [Ag(IPr)(3-Medpa)][PF6] (1) (IPr = 2,6-diisopropylimidazolylidene and 3-Medpa = 3,3′-dimethyl-2,2′-dipyridylamine) in comparison with the highly efficient blue emitting copper(I) complex (2) that we previously reported (Scheme 1).33 In short, a direct comparison between the complexes reveals an emission mechanism change from fluorescence (1) to thermally activated delayed fluorescence (2). This is related to the changes of the nature of the emitting excited states from ligand centered (1) to metal-to-ligand charge transfer (2). In addition, 1 shows an emission dependent on the crystallinity, which leads to highly emissive powders and thin-films that are not suitable for thin-film lighting devices, while smooth films are non-emissive. However, 1-based LECs featured a stable electrical behavior over 100 h that contrasts with the prior state-of-the-art value of a few minutes (2). Overall, this work highlights that this family of silver(I) complexes deserves attention toward activating the emission features by increasing the CT character in the emitting excited state. | ||
| Scheme 1 Synthesis of 1 and 2. | ||
Results and discussion
Synthesis and structural characterization
The synthesis started with the preparation of the 3-Medpa ligand following a reported Buchwald–Hartwig coupling using 2-amino-3-methylpyridine and 2-bromo-3-methylpyridine.33,35,37 The neutral complexes [M(IPr)Cl] 3 and 4 (M = Ag for 3 and M = Cu for 4) were prepared according to the Nolan and Cazin's procedures for the synthesis of Ag(I) and Cu(I) complexes.36–38With these precursors in hand, the targeted cationic heteroleptic complexes were synthesized following the procedure already reported for the synthesis of [Cu(IPr)(3-Medpa)][PF6] and applied for the silver(I) congener.32,33 Although this synthetic strategy is pleasantly effective for Cu(I)-based complexes (98% isolated yield for 2),19,33,34 the yield and selectivity decreased significantly for 1. Indeed, 3 was fully converted into 1 with the formation of 4.5% of the homoleptic [Ag(IPr)2][PF6] complex as a side product. Then, 1 was successfully purified by slow-gas diffusion crystallization, but this purification drastically compromised the isolated yield (30%). At first, the coordination of the carbene ligand (IPr) was detected by 13C NMR due to the characteristic two doublet signals attributed to the direct coupling of the carbon nucleus with the two magnetically active isotopes of silver, i.e.107Ag and 109Ag, having natural abundance of 51% and 49%, respectively.36 Additionally, 1H NMR spectroscopy showed the expected 1![[thin space (1/6-em)]](https://www.rsc.org/images/entities/char_2009.gif) :1 ratio between IPr and 3-Medpa for the formation of the heteroleptic complex 1. Then, the structure of 1 was confirmed by X-ray diffraction analysis. Indeed, needle-like crystals suitable for this analysis were obtained by using slow gas diffusion recrystallization of a concentrated dichloromethane solution of 1 and diethyl ether as a light solvent (Fig. 1). Relevant bond lengths and angles were reported in Table 1 along with the data previously reported for 2 for comparison purposes.33
:1 ratio between IPr and 3-Medpa for the formation of the heteroleptic complex 1. Then, the structure of 1 was confirmed by X-ray diffraction analysis. Indeed, needle-like crystals suitable for this analysis were obtained by using slow gas diffusion recrystallization of a concentrated dichloromethane solution of 1 and diethyl ether as a light solvent (Fig. 1). Relevant bond lengths and angles were reported in Table 1 along with the data previously reported for 2 for comparison purposes.33
 | ||
| Fig. 1 Ellipsoid representations at 50% probability of the XRD analysis of 1 (side view on the left and top view on the right). Counter ions and some hydrogen atoms were omitted for clarity. | ||
The size of the metal center (Ag = 1.65 Å vs. Cu = 1.54 Å)36,39 appeared to have a pivotal effect on the overall structure in both complexes. Indeed, the higher radius of the Ag(I) metal center caused an increase of the bond lengths toward the ligands. In detail, the bond length of Ag–CIPr in 1 was significantly longer than that in 2 (2.0744(15) vs. 1.921(18)) – Table 1. Then, higher bond lengths in 1 were also observed with the nitrogen atoms of the 3-Medpa ligands, 2.2872(14) and 2.0577(18) for 1 and 2, respectively. These longer bond lengths between the ligands and the metal center in 1 led to a decrease of the previously defined plane angle θ for 2, with a value of 22.4°, and found at 18.29° for 1 (Fig. 1, right).33 Of note, albeit considerably more planar than 2, no interactions between the metal centers or ligands were detected in the unit cell of 1, probably due to the steric hindrance generated by the isopropyl groups out of the plane of the metal center. Finally, the presence of the methyl groups in the 3-position relative to the pyridine rings does not allow intermolecular π-π interactions, which are key in the photophysical behavior of recently reported trigonal silver(I) complexes.32
Photophysical and computational studies
The absorption and emission spectra in solution and powder form are shown in Fig. 2, while the most relevant figures-of-merit for the emission are summarized in Table 2. The UV-visible absorption spectra of 1 and 2 were recorded in dichloromethane solution (10−5 M) (Fig. 2, left). The absorption spectra showed bands in the far UV-region with the maximum at 259 for 1 and 252 nm for 2, respectively. According to time-dependent Density Functional Theory (TD-DFT) calculations, these features can be assigned to a π–π* ligand centered (LC) transitions for both the complexes. In addition, absorption features until 350 and 380 nm are also noted for 1 and 2, respectively. According to analysis of the Natural Transition Orbitals (NTOs), these lower energy bands displayed drastically different electronic transitions. In detail, 2 exhibited a broad band characterized by the excited states 4, 5 and 7 that are assigned to an admixture of LC in 3-Medpa and MLCT from copper to 3-Medpa (Fig. S3 and Table S2 in the ESI†). In contrast, 1 showed two bands mainly driven by the first and third calculated excited states resulting from a ligand centered transition (LC) located in 3-Medpa (Fig. S2 and Table S1 in the ESI†). In other words, the lowest singlet excited state of 1 presented almost exclusively a LC transition with 97% of the transition being localized on the 3-Medpa ligand, while 2 exhibited a pronounced MLCT character from the metal to the 3-Medpa ligand (69%) along with some LC transition on the 3-Medpa ligand (26%) (Fig. 3).19,33 Next, the emission features in the solution and powder states were studied. While they are not emissive in solution, the powder samples exhibit strong, broad, and blue emission bands centered at 3.07 eV (λem = 404 nm) and 2.72 eV (λem = 455 nm) for 1 and 2, respectively (Fig. 2, right). Theoretical calculations were in good agreement, predicting the S1 → S0 transition at 2.77 eV (448 nm) for 1 and 2.43 eV (510 nm) for 2. Please note that the difference in energy between the two sets of data resulted from the fact that the calculations were performed under vacuum. The blue-shifted emission between silver and its congener is not surprising since the silver ion has a bigger atomic radius compared to copper and the 4d orbitals of the silver metal center are of lower energy level than copper.23,40,41 As a consequence, the lowest lying excited state does not involve the metal center. Indeed, this was further confirmed by steady-state emission measurement at 77 K. | ||
| Fig. 2 UV-visible spectra of 1 and 2 in dichloromethane solution (10−5 M), left; and emission spectra of 1 and 2 at 77 K (dash line) and 298 K (solid line), right. | ||
 | ||
| Fig. 3 Transition diagram calculated on the Natural Transition orbital for the S0 → S1 transition for the complexes [M(IPr)(3-Medpa)][PF6]. Left: complex 1 and right: complex 2. | ||
| Complex | λ abs [nm] (ε [104 L·mol−1·cm−1]) | λ em [nm] | τ em | PLQYb [%] | λ em [nm] | τ em |
|---|---|---|---|---|---|---|
| 298 K | 298 K | 77 K | 77 K | |||
| a 10−5 in CH2Cl2 solution. b In powder. c Data from ref. 19. d λ ex = 290 nm. e λ ex = 365 nm. | ||||||
| 1 | 259 [0.90] 288 (s) [0.65] | 404d | 7.4 nsd | 25d | 383d | 9.5 nsd |
| 295 [0.71] 315 [0.70] | ||||||
| 2 | 252 [0.44] 268 (s) [0.27] | 455e | 44 μse | 86e | 460e | 81 μse |
| 302 [0.29] 318 (s) [0.23] | ||||||
Here, the emission spectrum of 1 displayed the typical vibronic resolution of LC transitions (Fig. 2, right). In contrast, the featureless emission band shape of 2 holds at 77 K, confirming the MLCT character of the excited state. More importantly, time-resolved spectroscopy assays showed that the lowest excited state of 1 should be correlated to a singlet excited state as the excited state lifetimes (τ) are ca. 7 and 9 ns at 298 and 77 K with a PLQY of 25%, while 2 shows the typical TADF behavior with τ values of 44 (298 K) and 81 μs (77 K) and PLQY of 86%, (Table 2). This experimental observation was further confirmed by TD-DFT calculations showing a singlet–triplet energy splitting (ΔES1–T1) of 0.32 eV for 1 whereas the analog copper complex (2) featured a much smaller value of 0.14 eV (Fig. S6†). Of note, the fluorescence of 1 is in stark contrast with the dual phosphorescence emission of our previous silver(I) complex exhibiting AIE.32
To evaluate the possibility of application in LECs, the photophysical properties of 1 in a thin-film were studied. At first, the characterization of the pristine thin film (15 mg ml−1 of 1 in ACN solution) spin-coated onto quartz slides was performed. Atomic Force Microscopy (AFM) inspection of the thin-films confirmed a smooth and homogenous morphology with a root mean square roughness (RMS) of <1 nm (Fig. 4), indicating that they are adequate for device fabrication.
 | ||
| Fig. 4 AFM pictures of thin films containing 1% (top; left), 30% (top; right), 70% (bottom; left) and 90% w/w (bottom; right) 1 in PMMA. | ||
Compared to the emission features of 1 in a powder, the pristine thin-film featured a broad red-shifted band (447 nm) associated with a dramatic decrease of the PLQY and τ (Table 3 and Fig. 4). This is typically attributed to short-range aggregation occurring in the thin-film, resulting in new non-radiative deactivation pathways related to film morphology (phase boundaries).42 In contrast to similar trigonal silver(I) complexes,32 the fluorescence nature of the emission holds with short τ values of 3 ns. To recover the emission features in the thin-film, 1% w/w of 1 was dispersed in a poly(methyl methacrylate) (PMMA) matrix. This film featured a similar film morphology (Fig. 4), but a broad emission band centered at 398 nm associated with a PLQY of 7% and τ values of 1.3 ns (Tables 2 and 3, and Fig. S9†). The poor recovery of the PLQY compared to that of the powder samples (25%, Table 2) is very surprising compared to the standard literature. First, pristine 2-based films already showed a <10% loss in PLQY compared to the powder samples.20 Second, the dispersion of iTMCs in PMMA traditionally leads to highly emissive films that are not suitable for thin-film lighting applications as the PMMA is a dielectric system, while the increase of the complex amounts gradually reduces the PLQY.41 To fully investigate this behavior, we prepared PMMA films with a gradual increase in concentration of 1, i.e. 30, 70 and 90% w/w.
As expected, the thin-films showed a poor morphology in which phase separation of aggregates of 1 and PMMA are clearly noted by AFM and detected by powder-XRD (Fig. 4 and 5).
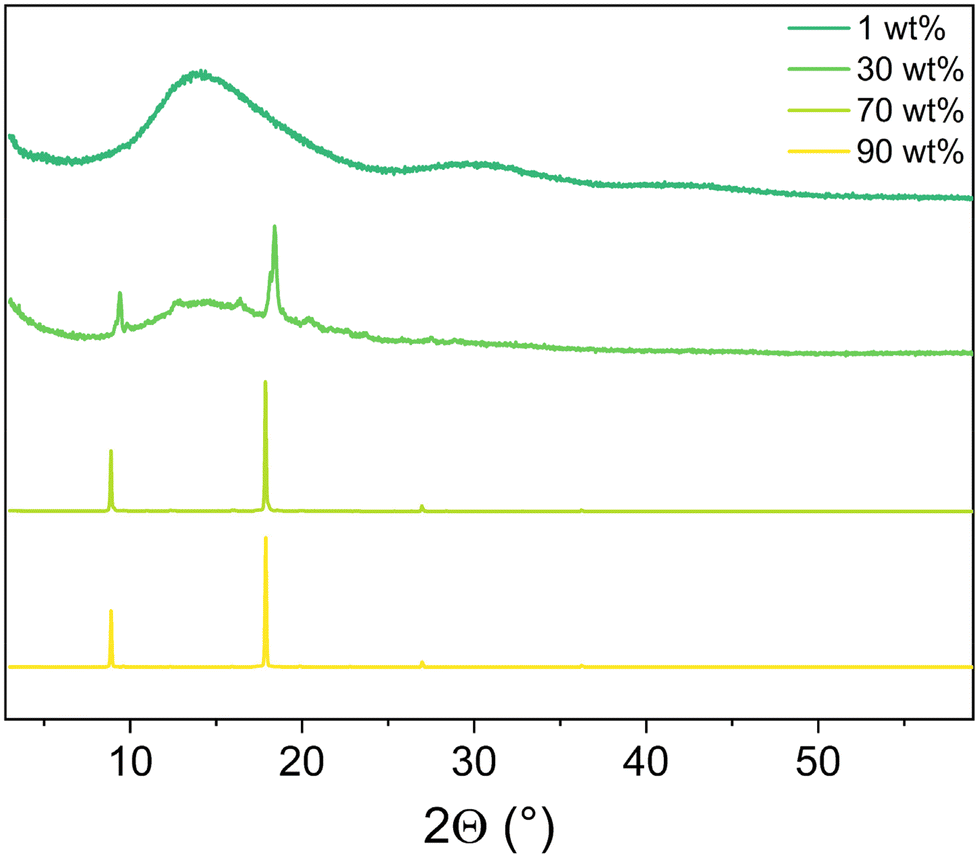 | ||
| Fig. 5 Powder-XRD of the thin films prepared with 1. | ||
Thus, emissive films required a close rearrangement and/or packing of 1. However, this film morphology is not suitable for thin-film lighting applications. A similar behavior has been recently shown in other trigonal silver(I) complexes in which AIE led to an efficient phosphorescent behavior that is lost in smooth and homogenous films applied in lighting devices.32
Electrochemical study in LEC devices
As a preliminary step towards implementing 1 in devices, cyclic voltammetry (CV) experiments were conducted in a THF solution (see ESI). The resulting CV displayed broad features: (i) two peaks in the cathodic scan at −1.55 V and −1.92 V, and (ii) two peaks in the anodic scan at +0.77 V and +1.18 V. Interestingly, no sharp signal, assigned to the Ag(0) nanoclusters,27,28 in the CV was observed at 0 V. Consequently, we assumed that 1 was a potential candidate for LEC application as it appeared more stable than previously studied silver(I) complexes. Then, pristine 1-based devices were prepared in spite of their poor photophysical properties to study its electrical and electroluminescence behaviors. In short, LECs with a stacked two-layer architecture (ITO/PEDOT:PSS/1/Al) were prepared: a first layer (70 nm) of poly(3,4-ethylenedioxythiophene):polystyrene sulfonate (PEDOT:PSS) was spin-coated onto clean indium-tin-oxide (ITO) electrode-coated glass; a layer of 1 was then prepared via spin-coating from a 15 mg ml−1 acetonitrile solution, reaching a thickness of the film of 90 nm and a roughness below 1 nm (Fig. 6, left); a final 100 nm layer of aluminum was prepared by physical vapor deposition. These devices were tested using a pulsed current of 8 mA with a 1 kHz block-wave and a 50% duty cycle on 10 mm2 pixels. | ||
| Fig. 6 1-Based LEC: AFM picture of the active layer (left), average voltage profile vs. time (middle) and device resistance (RLEC) vs. applied potential (right). | ||
As expected from the low PLQY (Table 3) and the electron–hole recombination spin-statistic (25% to singlets), the 1-based LEC did not show any luminance response. However, the electrical stability was remarkable with >100 h (Fig. 6, middle) stable voltage plateau after the exponential decay related to the formation of electrical double layers (EDL) at the electrode interface.31,43,44 As a reference, LECs with 2 showed a very poor electrochemical stability with a rise of the voltage over the first few minutes.20 This is a relevant result related to the state-of-the-art of silver(I) complexes in LECs.27,28,30 Indeed, as mentioned above, silver-based iTMCs in LECs tend to form Ag(0) nanoclusters in the active layer that affect the properties of the device.27,28 In detail, this causes, as initial evidence, a linear and fast decrease of the average voltage due to the resistance drop inside the device.28 As further evidence, electrochemical impedance spectroscopy allows the changes in the device resistance (RLEC) vs. the applied voltage associated with the formation of the EDLs and the electrochemical doping growth at lower and higher voltages to be monitored. In the case of Ag(0) nanocluster formation, a sharp drop in RLEC is noted.28 In 1-based LECs, the RLEC profile of the fresh and used devices is very similar with no indication of severe electrochemical degradation (Fig. 6, right). Finally, the stable electrical behavior allows the dielectric constant (εr = 4.20) and ion conductivities (σ = 1.04−7 S m−1) obtained at 0 V (see Experimental section) of the active layer to be determined. In line with the long time to reach the average voltage plateau compared to analogous LECs based on copper(I) and silver(I) complexes (i.e., a few minutes vs. 5 h),32 the εr values are low compared to LECs. Of note, the dielectric constant was measured as εr = 13.95 for the recently reported [Ag(IPr)(bpy)][PF6] complex,32 indicating that the modification of the N^N ligand is an effective approach to modulate the rate of EDL formation. In contrast, the ionic conductivity increased by one order of magnitude compared to [Ag(IPr)(bpy)][PF6], suggesting an easier formation of the doped regions.32
Conclusions
In this work, we describe the synthesis of the first cationic trigonal silver complex bearing NHC and dipyridylamine derivatives as ligands and coordinated to the same combination of ligands as the best emitting previously reported copper(I) complex design applied in blue-emitting LECs. The silver(I) complex was structurally and photophysically characterized in comparison with its copper(I) analog. The change of the metal ion has a profound effect on the electronic configuration of the emitting excited state that is mainly driven by a fluorescence process from a 1LC excited state, whereas the copper(I) complex emission corresponds to a TADF emission due to the strong MLCT character. What is more, the silver(I) complex shows an unexpected emission dependent on the crystallinity of the sample that significantly contrasts with similar copper(I) and silver(I) complexes. Unfortunately, this leads to non-emissive homogenous films that should be suitable for thin-film lighting applications. Thus, LECs based on silver(I) complexes did not show any electroluminescence response, but a very stable electrical behavior over 100 h, as confirmed by stability assays and EIS. This suggests an extraordinary electrochemical stability of this family of complexes that significantly contrasts with those of copper(I) complexes (a few minutes stable) and other silver(I) complex LECs that have featured electrical stabilities spanning from a few minutes to seconds, respectively. Thus, the electrical behavior of trigonal silver(I) complexes will open a new horizon for future LEC development with more sustainable emitters.Experimental part
Synthesis
Commercially available compounds were used without additional purification. All the reactions were carried out using standard Schlenk techniques under an Ar atmosphere. Purchased solvents were degassed by Ar bubbling before use. The details of the synthesis of [Cu(IPr)(3-Medpa)][PF6] were reported previously33 and those for [Ag(IPr)(3-Medpa)][PF6] were provided in the ESI.Crystallography
Data sets were acquired from single-crystal samples employing a Brüker Kappa APEXII CCD diffractometer. Initial unit cell parameters were determined by fitting the angular settings of strong reflections collected during a 6.0° scan in 12 frames distributed over three distinct sections of the reciprocal space (36 frames in total). Cell refinement and data reduction were conducted using SAINT (Brüker AXS). Absorption correction was implemented through the multiscan method with SADABS 2012/1 (Brüker AXS). The structure was solved using direct methods and refined utilizing SHELXL-97 or SHELXL-2013 (Sheldrick). All non-hydrogen atoms underwent refinement using full-matrix least-squares with anisotropic displacement parameters, while hydrogen atoms were positioned in idealized positions. Short interactions were computed using Platon version 250 420. P-XRD measurements were performed on a Miniflex diffractometer (Rigaku, Tokyo, Japan) with a copper source (1.54 Å) and a silicon strip detector (D/teX Ultra, Rigaku), with a goniometer radius of 150 mm; both Soller slits at 2.5°; a divergence slit fixed at 0.625°; an anti-scatter slit of 8 mm; and a kβ filter of 0.06 mm nickel foil. The powder was placed on a low background silicon wafer sample holder (cut 911). The samples used for P-XRD measurements were prepared via drop casting from an acetonitrile solution with complex x (1, 30, 70 and 90 wt%) and PMMA.Photophysical measurements
UV–vis absorption spectra were obtained at room temperature from 10−5 M solutions in CH2Cl2 using a PerkinElmer Lambda 40 UV-visible spectrometer. Wavelengths are presented in nanometers (nm). Steady-state emission spectra and emission photoluminescence quantum yields (PLQYs) were recorded using an FS5 Spectrofluorometer from Edinburgh Instruments. For the lifetime measurements, Time-Correlated Single-Photo Counting (TCSPC) detectors were employed, along with picosecond pulsed diode lasers (EPL Series) and LEDs (EPLED Series) for excitation. Temperature-dependent measurements were conducted using an optical cryostat (SC-80 holder) with an FS5 Spectrofluorometer. In cases of biexponential decays of the excited state, intensity-weighted lifetime analysis was applied.45Computational details
Geometries were optimized with the PBE0 functional and the effective core potential SDD was used for the copper atom while the 6-31+G(d,p) basis set was used for the remaining atoms. Additionally, DFT-D3 dispersion correction46,47 was included for a better description of long-range interactions, such as CH–π interactions between the dpa and NHC ligands. TD-DFT calculations were performed with the PBE0 functional, which has been shown to be particularly relevant to describe TADF events.48 S1 geometries were optimized by using the implemented TD-DFT gradients, whereas T1 geometries were obtained from open-spin-relaxed open shell calculations. Characterization of the nature of the S0 → S1 transition was performed using the VALET python library48 for Visual Analysis of Electronic Transitions.49Device preparation and characterization
Indium–tin oxide (ITO) substrates, 130 nm in thickness, were purchased from Naranjo Substrates. The substrates underwent a cleaning process involving water-diluted Derquim detergent, distilled water, ethanol, and propan-2-ol, with each step performed in a warm ultrasonic bath. Following this, the substrates were dried with a nitrogen flow and treated in a UV-ozone cleaner. An aqueous solution of PEDOT:PSS (CleviosP VP.Al4083) was sonicated and diluted with propan-2-ol before spin-coating onto the substrates. Film preparation involved spin-coating and drying, with the resulting layers confirmed for suitable morphology using AFM. An aluminum cathode (100 nm) was deposited onto the active layer by physical vapor deposition. The device performance, including voltage and current profiles, was assessed using the Botest OLT OLED Lifetime-Test System in pulsed mode, with ITO serving as the anode and aluminum as the cathode. Time-dependent luminance and electroluminescence spectra were recorded using an Avantes spectrophotometer equipped with a calibrated integrating sphere. Electrochemical Impedance Spectroscopy (EIS) assays were carried out using a Metrohm Autolab III potentiostat/galvanostat with a frequency analyser module (FRA2) in the voltage range of 0 to 7 V, fitted with an equivalent circuit model described in the ESI.Data availability
The data supporting this article have been included as part of the ESI.Conflicts of interest
There are no conflicts to declare.Acknowledgements
This work was supported by the “Ministère de L’Enseignement Supérieur et de la Recherche”, CNRS (Centre National de la Recherche Scientifique) and LABEX SynOrg (ANR-11-LABX-0029). S.G. acknowledges the “Région Normandie” (G.G.), the Graduate School of Research XL-Chem (ANR-18-EURE-0020 XL-Chem) for funding.References
- Light-Emitting Electrochemical Cells, ed. R. D. Costa, Springer International Publishing, Cham, 2017 Search PubMed.
- B. Meier, D. Tordera, A. Pertegás, C. Roldán-Carmona, E. Ortí and H. J. Bolink, Mater. Today, 2014, 17, 217–223 CrossRef.
- H. Yersin, A. F. Rausch, R. Czerwieniec, T. Hofbeck and T. Fischer, Coord. Chem. Rev., 2011, 255, 2622–2652 CrossRef CAS.
- M. D. Weber, J. E. Wittmann, A. Burger, O. B. Malcıoğlu, J. Segarra-Martí, A. Hirsch, P. B. Coto, M. Bockstedte and R. D. Costa, Adv. Funct. Mater., 2016, 37, 6737–6750 CrossRef.
- E. Fresta, G. Volpi, C. Garino, C. Barolo and R. D. Costa, Polyhedron, 2018, 140, 129–137 CrossRef.
- M. D. Weber, V. Nikolaou, J. E. Wittmann, A. Nikolaou, P. A. Angaridis, G. Charalambidis, C. Stangel, A. Kahnt, A. G. Coutsolelos and R. D. Costa, Chem. Commun., 2016, 52, 1602–1605 RSC.
- E. Nannen, J. Frohleiks and S. Gellner, Adv. Funct. Mater., 2020, 30(33), 1907349 CrossRef CAS.
- J. Frohleiks, S. Wepfer, Y. Kelestemur, H. V. Demir, G. Bacher and E. Nannen, ACS Appl. Mater. Interfaces, 2016, 8(37), 24692–24698 CrossRef CAS PubMed.
- J. Gao, ChemPlusChem, 2018, 83, 183–196 CrossRef CAS PubMed.
- D. Tordera, S. Meier, M. Lenes, R. D. Costa, E. Ortì, W. Safert and H. J. Bolink, Adv. Mater., 2012, 24, 897–900 CrossRef CAS PubMed.
- G. U. Mahoro, E. Fresta, M. Elie, D. di Nasso, Q. Zhang, J.-F. Lohier, J.-L. Renaud, M. Linares, R. Wannemacher, J. Cabanillas-Gonzalez, R. D. Costa and S. Gaillard, Dalton Trans., 2021, 50, 11049–11060 RSC.
- E. Fresta, G. U. Mahoro, L. M. Cavinato, J.-F. Lohier, J.-L. Renaud, S. Gaillard and R. D. Costa, Adv. Opt. Mater., 2022, 10, 2101999 CrossRef CAS.
- G. U. Mahoro, J. Fernandez-Cestau, J.-L. Renaud, P. B. Coto, R. D. Costa and S. Gaillard, Adv. Opt. Mater., 2020, 8, 2000260 CrossRef CAS.
- C. E. Housecroft and E. C. Constable, Coord. Chem. Rev., 2017, 350, 155–177 CrossRef CAS.
- C. E. Housecroft and E. C. Constable, J. Mater. Chem. C, 2022, 10, 4456–4482 RSC.
- R. Czerwieniec, M. J. Leitl, H. H. H. Homeier and H. Yersin, Coord. Chem. Rev., 2016, 325, 2–28 CrossRef CAS.
- M. Alkan-Zambada, S. Keller, L. Martínez-Sarti, A. Prescimone, J. M. Junquera-Hernández, E. C. Constable, H. J. Bolink, M. Sessolo, E. Ortí and C. E. Housecroft, J. Mater. Chem. C, 2018, 6, 8460–8471 RSC.
- L. M. Cavinato, S. Wölfl, A. Pöthig, E. Fresta, C. Garino, J. Fernandez-Cestau, C. Barolo and R. D. Costa, Adv. Mater., 2022, 34(12), 2109228 CrossRef CAS PubMed.
- M. Elie, F. Sguerra, F. Di Meo, M. D. Weber, R. Marion, A. Grimault, J.-F. Lohier, A. Stallivieri, A. Brosseau, R. B. Pansu, J.-L. Renaud, M. Linares, M. Hamel, R. D. Costa and S. Gaillard, ACS Appl. Mater. Interfaces, 2016, 8, 14678 CrossRef CAS PubMed.
- M. D. Weber, E. Fresta, M. Elie, M. E. Miehlich, J.-L. Renaud, K. Meyer, S. Gaillard and R. D. Costa, Adv. Funct. Mater., 2018, 28, 1707423 CrossRef.
- A. Kaeser, O. Moudam, G. Accorsi, I. Séguy, J. Navarro, A. Belbakra, C. Duhayon, N. Armaroli, B. Delavaux-Nicot and J.-F. Nierengarten, Eur. J. Inorg. Chem., 2014, 2014, 1345–1355 CrossRef CAS.
- O. Moudam, A. Kaeser, B. Delavaux-Nicot, C. Duhayon, M. Holler, G. Accorsi, N. Armaroli, I. Séguy, J. Navarro, P. Destruel and J.-F. Nierengarten, Chem. Commun., 2007, 3077–3079 RSC.
- C.-W. Hsu, C.-C. Lin, M.-W. Chung, Y. Chi, G.-H. Lee, P.-T. Chou, C.-H. Chang and P.-Y. Chen, J. Am. Chem. Soc., 2011, 133, 12085–12099 CrossRef CAS PubMed.
- K. Matsumoto, T. Shindo, N. Mukasa, T. Tsukuda and T. Tsubomura, Inorg. Chem., 2012, 51, 5805–5813 CrossRef PubMed.
- C.-C. Hsu, C.-C. Lin, P.-T. Chou, C.-H. Lai, C.-W. Hsu, C.-H. Lin and Y. Chi, J. Am. Chem. Soc., 2012, 134, 7715–7724 CrossRef CAS PubMed.
- H. Kunkely and A. Vogler, Inorg. Chim. Acta, 2006, 359, 388–390 CrossRef CAS.
- O. Moudam, A. C. Tsipis, S. Kommanaboyina, P. N. Horton and S. J. Coles, RSC Adv., 2015, 5, 95047–95053 RSC.
- E. Fresta, J. M. Carbonell-Vilar, J. Yu, D. Armentano, J. Cano, M. Viciano-Chumillas and R. D. Costa, Adv. Funct. Mater., 2019, 29, 1901797 CrossRef.
- M. D. Weber, M. Viciano-Chumillas, D. Armentano, J. Cano and R. D. Costa, Dalton Trans., 2017, 46, 6312–6323 RSC.
- S. Lipinski, L. M. Cavinato, T. Pickl, G. Biffi, A. Pöthig, P. B. Coto, J. Fernández-Cestau and R. D. Costa, Adv. Opt. Mater., 2023, 11, 2203145 CrossRef CAS.
- E. Fresta, M. D. Weber, J. Fernandez-Cestau and R. D. Costa, Adv. Opt. Mater., 2019, 7, 1900830 CrossRef CAS.
- G. Giobbio, P. B. Coto, J.-F. Lohier, J.-L. Renaud, S. Gaillard and R. D. Costa, Dalton Trans., 2024, 53, 12307–12315R RSC.
- R. Marion, F. Sguerra, F. Di Meo, E. Sauvageot, J.-F. Lohier, R. Daniellou, J.-L. Renaud, M. Linares, M. Hamel and S. Gaillard, Inorg. Chem., 2014, 53, 9181–9191 CrossRef CAS PubMed.
- M. Elie, M. D. Weber, F. Di Meo, F. Sguerra, J.-F. Lohier, R. B. Pansu, J.-L. Renaud, M. Hamel, M. Linares, R. D. Costa and S. Gaillard, Chem. – Eur. J., 2017, 23, 16328–16337 CrossRef CAS PubMed.
- E. Sauvageot, R. Marion, F. Sguerra, A. Grimault, R. Daniellou, M. Hamel, S. Gaillard and J.-L. Renaud, Org. Chem. Front., 2014, 1, 639–644 RSC.
- P. de Frémont, N. M. Scott, E. D. Stevens, T. Ramnial, O. C. Lightbody, C. L. B. Macdonald, J. A. C. Clyburne, C. D. Abernethy and S. P. Nolan, Organometallics, 2005, 24, 6301–6309 CrossRef.
- C. A. Citadelle, E. L. Nouy, F. Bisaro, A. M. Z. Slawin and C. S. J. Cazin, Dalton Trans., 2010, 39, 4489 RSC.
- O. Santoro, A. Collado, A. M. Z. Slawin, S. P. Nolan and C. S. J. Cazin, Chem. Commun., 2013, 49, 10483 RSC.
- E. Clementi, D. L. Raimondi and W. P. Reinhardt, J. Chem. Phys., 1967, 47, 1300–1307 CrossRef CAS.
- M. Z. Shafikov, A. F. Suleymanova, R. Czerwieniec and H. Yersin, Chem. Mater., 2017, 29, 1708–1715 CrossRef CAS.
- M. Z. Shafikov, R. Czerwieniec and H. Yersin, Dalton Trans., 2019, 48, 2802–2806 RSC.
- J. Mei, N. L. C. Leung, R. T. K. Kwok, J. W. Y. Lam and B. Z. Tang, Chem. Rev., 2015, 115, 11718–11940 CrossRef CAS PubMed.
- B. M. D. Puscher, M. F. Aygüler, P. Docampo and R. D. Costa, Adv. Energy Mater., 2017, 7, 1602283 CrossRef.
- M. D. Weber, M. Viciano-Chumillas, D. Armentano, J. Cano and R. D. Costa, Dalton Trans., 2017, 46, 6312–6323 RSC.
- A. Sillen and Y. Engelborghs, Photochem. Photobiol., 1998, 67, 475 CrossRef CAS.
- S. Grimme, S. Ehrlich and L. Goerigk, J. Comput. Chem., 2011, 32, 1456–1465 CrossRef CAS PubMed.
- S. Grimme, J. Antony, S. Ehrlich and H. Krieg, J. Chem. Phys., 2010, 132, 154104 CrossRef PubMed.
- M. Moral, L. Muccioli, W.-J. Son, Y. Olivier and J.-C. Sancho-García, J. Chem. Theory Comput., 2015, 11, 168–177 CrossRef CAS PubMed.
- https://github.com/tbmasood/VALET .
Footnote |
| † Electronic supplementary information (ESI) available. CCDC 2380164. For ESI and crystallographic data in CIF or other electronic format see DOI: https://doi.org/10.1039/d4dt02473g |
| This journal is © The Royal Society of Chemistry 2024 |