DOI:
10.1039/D4DT01539H
(Paper)
Dalton Trans., 2024,
53, 12527-12542
Position of substituents directs the electron transfer properties of entatic state complexes: new insights from guanidine-quinoline copper complexes†
Received
26th May 2024
, Accepted 8th July 2024
First published on 11th July 2024
Abstract
In a previous study, we showed that the properties and the ability as an entatic state model of copper guanidine quinoline complexes are significantly influenced by a methyl or methyl ester substituent in the 2-position. To prove the importance of the 2-position of the substituent, two novel guanidine quinoline ligands with a methyl or methyl ester substituent in the 4-position and the corresponding copper complexes were synthesized and characterized in this study. The influence of the substituent position on the copper complexes was investigated with various experimental and theoretical methods. The molecular structures of the copper complexes were examined in the solid state by single-crystal X-ray diffraction (SCXRD) and by density functional theory (DFT) calculations indicating a strong dependency on the substituent position compared to the systems substituted in the 2-position from the previous study. Further, the significantly different influence on the donor properties in dependency on the substituent position was analyzed with natural bond orbital (NBO) calculations. By the determination of the redox potentials, the impact on the electrochemical stabilization was examined. With regard to further previously analyzed guanidine quinoline copper complexes, the electrochemical stabilization was correlated with the charge-transfer energies calculated by NBO analysis and ground state energies, revealing the substituent influence and enabling a comparatively easy and accurate possibility for the theoretical calculation of the relative redox potential. Finally, the electron transfer properties were quantified by determining the electron self-exchange rates via the Marcus theory and by theoretical calculation of the reorganization energies via Nelsen's four-point method. The results gave important insights into the dependency between the ability of the copper complexes as entatic state model and the type and position of the substituent.
Introduction
Copper proteins are crucial for many processes in all living organisms. For fast and reversible electron transfer processes, type 1 copper proteins are responsible.1 In the active site, they possess a copper center coordinated by four donors in a distorted coordination geometry, whereby the donors are two histidines (N donor), one cysteine (S donor) and in most cases one methionine (S donor).2 The fast electron transfer is represented by high electron self-exchange rates k11 ranging from ∼103 to ∼106 M−1 s−1.3 This characteristic property of the type 1 copper proteins led to the introduction of the term “entatic state” by Vallee and Williams in 1968.4 The entatic state principle is not limited to type 1 copper proteins but also applicable to other metalloproteins and proteins without a metal ion. According to the definition, the protein exhibits a rigid framework that does not allow, in the case of a metalloprotein, the metal ion in the active site to exist with its energetically preferred coordination geometry. The resulting energization leads to the efficiency of the protein.4,5 Further possibilities for the energization of a protein were suggested and discussed in the literature.5–8 The “rack” mechanism was proposed by Lumry and Eyring and it explains the energization by significant structural changes of the protein framework caused by allosteric effects and by a possibly adverse structural configuration for the metal ion.9 In contrast, in the “induced fit” mechanism, the protein framework possesses a local flexibility that leads to an enforced coordination geometry of the metal ion.10 In the “induced-rack” theory by Malmström, the protein framework has a certain degree of flexibility resulting ideally in two different protein structures. In one structure, the protein framework is relaxed but the coordination geometry around the metal ion is strained and, therefore, energetically unfavorable. In the other structure, the coordination geometry around the metal ion is relaxed but the protein framework is strained and, therefore, energetically unfavorable.11 The “electronic entatic state” was proposed by Rorabacher et al. As for the entatic state, the structural strain of the protein is an important factor but further, the influence of electronic effects is considered.12 Comba suggested a generalized definition by naming the energization as entasis caused by adverse interactions between the metal ion and ligand sphere.6,13 In any case how the energization is explained, it results in a faster reaction because the energy levels of the reactants and products are closer to the energy level of the transition state resulting in a smaller activation energy. The entatic state of type 1 copper proteins can be explained by the extraordinary coordination sphere around the copper center. Which deviates significantly from the ideal tetrahedral coordination geometry preferred by Cu(I) and the ideal square-planar coordination geometry preferred by Cu(II).6 Further, the coordination sphere is very similar in the Cu(I) and the Cu(II) species. Both aspects result in a facilitated transition between the oxidation states and, therefore, an enhanced electron transfer. Parallel, the concept of the “in-between-state” has been proposed by Falcone and Hureau for intrinsically disordered peptides in copper binding proteins.14
Meanwhile, the entatic state principle is applied to explain the improved activity in catalysis or certain properties of metal complexes besides a biological background.7,15 Various copper complexes were reported as model complexes for type 1 copper proteins and their electron self-exchange rates (Fig. 1). The redox couples [Cu(bib)2]+/2+ and [Cu(bite)]+/2+ by Stanbury et al. exhibit very small electron self-exchange rates k11.16 Comba et al. reported a copper complex redox couple of a rigid bispidine ligand and its electron transfer properties.13,17 Due to its inflexibility, the bispidine ligand is preorganized resulting in a low internal reorganization energy λI. Nevertheless, the metal ion is not fixed in the ligand cavity during the electron transfer resulting in a significant rearrangement of the solvent sphere and, therefore, a high solvent reorganization energy λS. In sum, this leads to a low electron self-exchange rate k11 of ∼101 M−1 s−1 in water at 25 °C.17 This result demonstrates that the reorganization of the ligand and solvent sphere is crucial for the electron transfer. However, also copper complex redox couples with high k11 values comparable with those of type 1 copper proteins are known. The redox couple [Cu([15]aneS3bpy)]+/2+ by Rorabacher et al. exhibits a k11 of ∼105 M−1 s−1 in MeCN at 25 °C which is similar to the redox couple [Cu(H2TpyNMes)Cl]0/+ by Szymczak et al. with a k11 of ∼105 M−1 s−1 in THF at room temperature.12,18 For several years, we examined copper guanidine quinoline complex redox couples as entatic state models. Due to the significantly distorted coordination geometries of the Cu(I) and Cu(II) species from the ideal coordination geometries, the related Cu(I) and Cu(II) species of a redox couple possess very similar structures.19–23 The influence of different guanidine moieties and substitution position was examined in the electron transfer. The TMG moiety enabled higher k11 values compared to the DMEG moiety due to a higher similarity of the Cu(I) and Cu(II) species.21 Various substituents in the 2-, 4- and 6-position were tested whereby a methyl and methyl ester substituent in the 2-position of TMG2Mequ (L2) and TMG2Meequ (L4) induced the strongest enhancement of the electron transfer properties.22,23 Therefore, an increase in k11 by one order of magnitude from ∼102 M−1 s−1 for [Cu(TMGqu)2]+/2+ (C1/C2) to ∼103 M−1 s−1 for [Cu(TMG2Mequ)2]+/2+ (C3/C4) and [Cu(TMG2Meequ)2]+/2+ (C5/C6) in MeCN at 25 °C was observed. In the case of [Cu(TMG2Mequ)2]+/2+ (C3/C4), we explained the increase with the higher similarity between the Cu(I) and Cu(II) species caused by the steric demand of the methyl substituent and in the case of [Cu(TMG2Meequ)2]+/2+ (C5/C6), with the various influences of the methyl ester substituent on the copper complexes.23
 |
| | Fig. 1 Ligands used to synthesize copper complexes that were analyzed as entatic state model complexes for the electron transfer.12,13,16–19,21,23 | |
In this study, two novel ligands with a methyl or methyl ester substituent in the 4-position were synthesized. The substituent influence on the properties of the corresponding copper complexes was examined by a plethora of experimental and theoretical methods. The results are discussed in relation to those of the previous study.
Results and discussion
Synthesis of the ligands
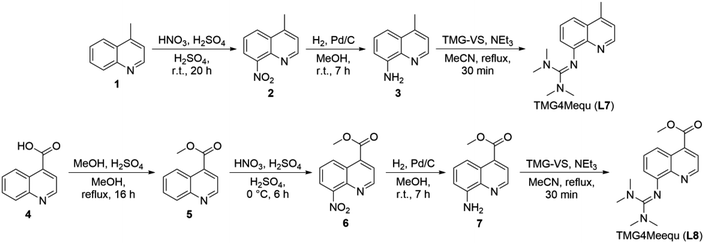
The synthesis of L7 and L8 proceed analogously from the nitration of 4-methylquinoline (1) and methyl quinoline-4-carboxylate (5) in the 8-position resulting in 4-methy-8-nitroquinoline (2) and methyl 8-nitroquinoline-4-carboxylate (6) (Scheme 1).245 was obtained in a preceding step by esterification of quinoline-4-carboxylic acid (4). Afterward, 2 and 6 were reduced with hydrogen using Pd/C as catalyst yielding the amine precursors 4-methy-8-aminoquinoline (3) and methyl 8-aminoquinoline-2-carboxylate (7).25 In the last step, the reaction of 3 and 7 with the Vilsmeier salt N,N,N′,N′-tetramethylchloroformamidinium chloride (TMG-VS) resulted in L7 and L8 analogously to the procedure reported earlier.26 The molecular structure of L7 in the solid state was determined by SCXRD (molecular structure and crystallographic data are provided in Fig. S1 and Table S1 in the ESI†).
 |
| | Scheme 1 Synthetic routes for the synthesis of TMG4Mequ (L7) (top) and TMG4Meequ (L8) (bottom). | |
Influence of the substituents on the electronic properties of the ligands
Density functional theory (DFT) calculations were performed for L7 and L8 applying the functional TPSSh and the basis set def2-TZVP with a solvent model for MeCN using the polarizable continuum model (PCM) and an empirical dispersion correction using the D3 version of Grimme's dispersion with Becke–Johnson damping (GD3BJ) (further information in the ESI†).27–34 This combination was chosen because previous studies showed very good results for comparable systems.20–23,34–37 After structural optimization calculations, natural bond orbital (NBO) calculations were executed to analyze the substituent influence on the guanidine N donor Ngua and quinolinyl N donor Nqu of both ligands and the acyl O atom Oacyl and alcohol O atom Oalc of the methyl ester substituent of L8. The results of L7 and L8 are compared with the results of L1, L2 and L5 from the previous study (Fig. 2).23
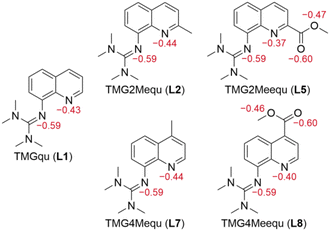 |
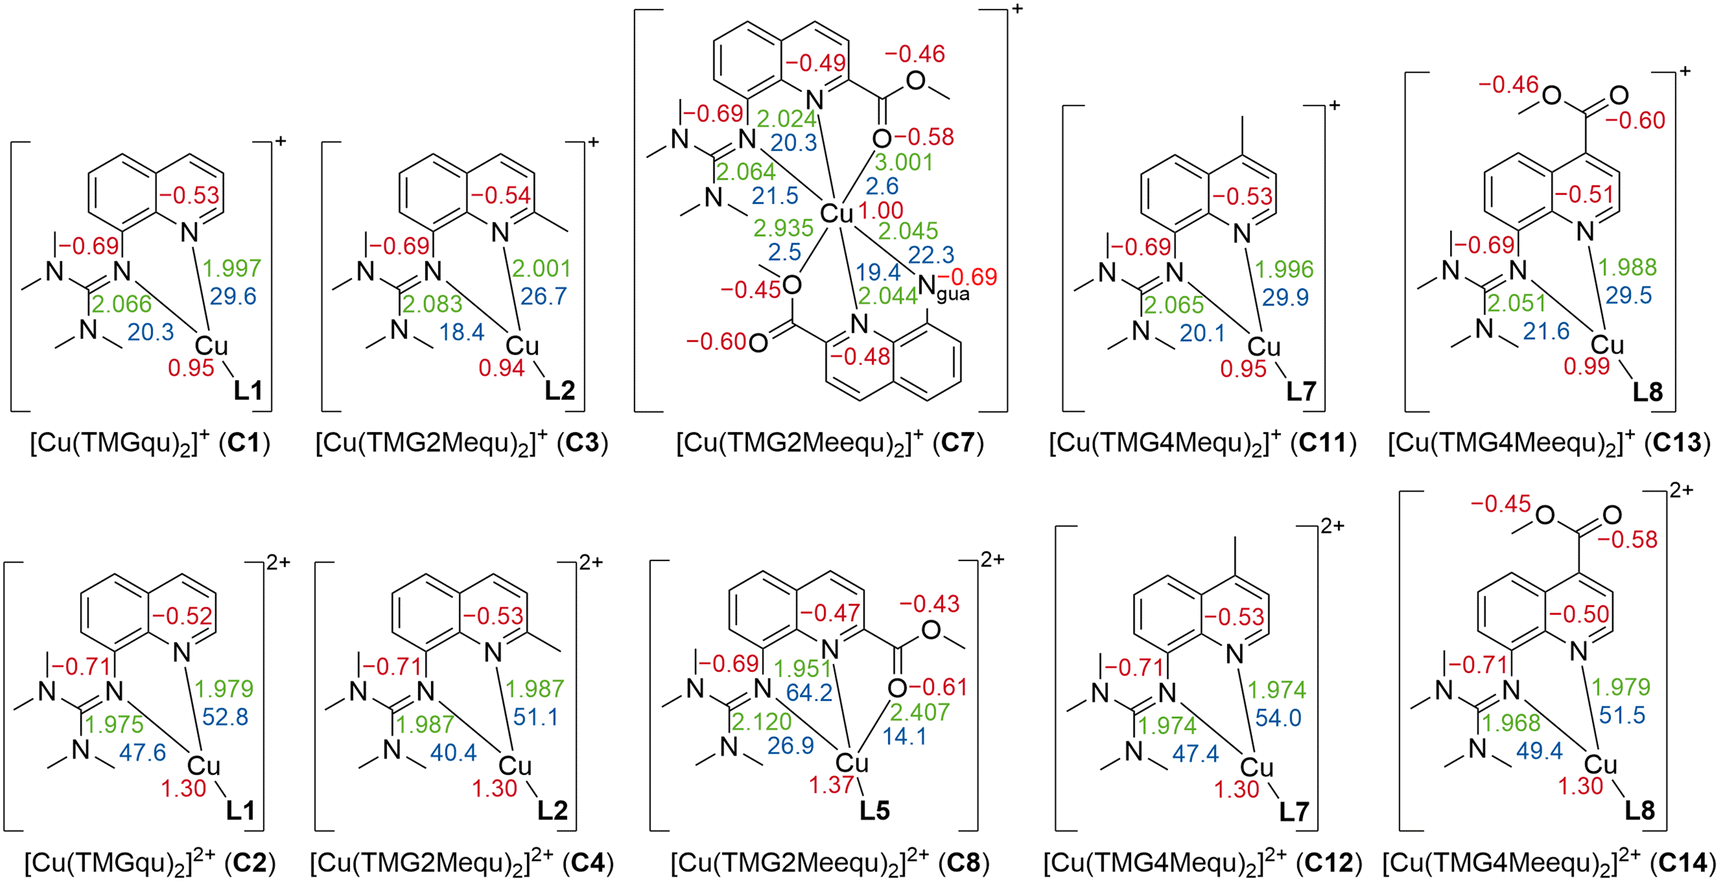
| | Fig. 2 Calculated NBO charges (in e units, red) of the Ngua and Nqu donor atoms of L1,21L2,21L5,21L7 and L8 and of the Oacyl and Oalc atoms of L5 and L7 (NBO6.0, TPSSh, def2-TZVP, GD3BJ, PCM (MeCN)). | |
The NBO charge of the Ngua donor is not affected by the substitutions entailing that the basicity of the Ngua donor is not affected electronically. Since the same donor type is discussed, this result indicates that the donor strength of the Ngua is also not affected by the substituents. Further, the NBO charge of the Ngua donor is more negative than the NBO charge of the Nqu donor indicating a higher basicity of the Ngua donor. However, since NBO charges only correlate with basicity and different donor types are compared this does not imply that the Ngua donor is a stronger donor than the Nqu donor.20,23,25,35,37,38 The basicity and possible donor strength of the Nqu donor of L2 and L7 are not significantly affected by the weak electronic influence of the alkyl substituents. In contrast, the strong electron density withdrawing effect of the methyl ester substituents of L5 and L8 leads to an increase of the NBO charge of the Nqu donor in comparison to the unsubstituted ligand. Therefore, the basicity and the possible donor strength of the Nqu donor are decreased. However, the effect of the methyl ester substituent in the 2-position of L5 is stronger than in the 4-position of L8. The NBO charges of the Oacyl and Oalc atoms are not affected by the position of the methyl ester substituent.
Synthesis and structural characterization of the copper complexes
The reaction of two equivalents of L7 or L8 with Cu(I) or Cu(II) salts with weakly coordinating anions resulted in the corresponding bis(chelate) Cu(I) and Cu(II) complexes. The Cu(I) complexes were crystallized by dissolving L7 or L8 and [Cu(MeCN)4]PF6 in DCM followed by layering with pentane or slow evaporation of the solvent (Scheme 2, top). The Cu(II) complexes were crystallized similarly by dissolving L7 or L8 and [Cu(MeCN)4](OTf)2 in MeOH followed by layering with Et2O or slow evaporation of the solvent (Scheme 2, bottom). The complex cations [Cu(TMG4Mequ)2]+ (C11), [Cu(TMG4Mequ)2(OTf)]+ ((C12+OTf)), [Cu(TMG4Meequ)2]+ (C13) and [Cu(TMG4Meequ)2]+ (C14) were structurally characterized by SCXRD measurements (Fig. 3) of the crystallized compounds C11-PF6, (C12+OTf)-OTf, C13-PF6 and C14-OTf (molecular structures in the solid state and crystallographic data are shown in Fig. S2–S5 and Tables S1, S2 in the ESI†). C11-PF6 possesses two independent molecules in the unit cell which are very similar (Table S3 in the ESI†). Therefore, only one independent molecule is discussed in the following. Important bond lengths, bond angles and structure parameters of the copper complex cations C11–C14 are compared with those of [Cu(TMGqu)2]+ (C1), [Cu(TMGqu)2]2+ (C2), [Cu(TMG2Mequ)2]+ (C3), [Cu(TMG2Mequ)2]2+ (C4), [Cu(TMG2Meequ)2]+ (C7) and [Cu(TMG2Mequ)2]2+ (C8) of the crystallized compounds C1-PF6, C2-OTf, C3-PF6, C4-BF4, C7-PF6 and C8-BF4 of previous studies (Table 1).19,23
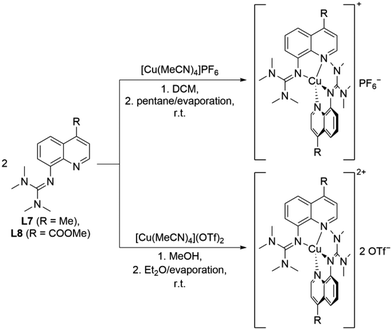 |
| | Scheme 2 Synthesis of the Cu(I) (top) and Cu(II) (bottom) compounds C11-X–C14-X. | |
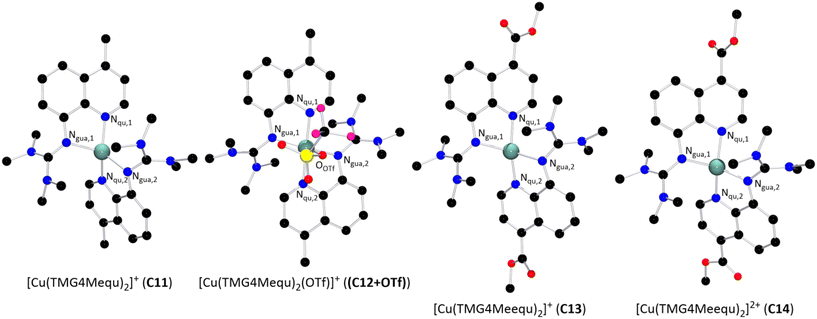 |
| | Fig. 3 Molecular structures of the Cu(I) and Cu(II) complex cations C11–C14 in crystals of C11-X–C14-X (H atoms, non-coordinating anions and solvent molecules are omitted for clarity). | |
Table 1 Selected bond lengths, bond angles and structure parameters of [Cu(TMGqu)2]+ (C1),19 [Cu(TMGqu)2]2+ (C2),19 [Cu(TMG2Mequ)2]+ (C3),23 [Cu(TMG2Mequ)2]2+ (C4),23 [Cu(TMG2Meequ)2]+ (C7),23 [Cu(TMG2Meequ)2]2+ (C8),23 [Cu(TMG4Mequ)2]+ (C11), [Cu(TMG4Mequ)2(OTf)]+ ((C12 + OTf)), [Cu(TMG4Meequ)2]+ (C13) and [Cu(TMG4Meequ)2]2+ (C14)
| |
[Cu(TMGqu)2]+/2+ |
[Cu(TMG2Mequ)2]+/2+ |
[Cu(TMG2Meequ)2]+/2+ |
[Cu(TMG4Mequ)2]+/2+ |
[Cu(TMG4Meequ)2]+/2+ |
|
C1 (Cu(I)) |
C2 (Cu(II)) |
C3 (Cu(I)) |
C4 (Cu(I)) |
C7 (Cu(I)) |
C8 (Cu(II)) |
C11 (Cu(I)) |
(C12+OTf) (Cu(II)) |
C13 (Cu(I)) |
C14 (Cu(II)) |
 .29
The comparability of this value is limited due to the 4 + 2 coordination motif.
The weakly coordinating triflate is not considered. .29
The comparability of this value is limited due to the 4 + 2 coordination motif.
The weakly coordinating triflate is not considered.
|
| Bond lengths [Å] |
| Cu–Ngua,1/2 |
2.068(3), 2.095(3) |
1.959(2), 1.964(2) |
2.091(3), 2.097(3) |
1.979(4), 1.978(4) |
2.047(4), 2.029(4) |
2.039(2), 2.043(2) |
2.082(3), 2.055(3) |
1.987(3), 1.994(3) |
2.056(2), 2.063(2) |
1.969(2), 1.953(2) |
| Cu–Nqu,1/2 |
1.966(4), 1.999(3) |
1.976(2), 1.975(2) |
1.994(3), 1.994(3) |
1.987(4), 1.972(4) |
2.053(3), 2.083(4) |
1.960(2), 1.959(2) |
1.970(3), 1.993(3) |
1.988(3), 1.977(3) |
2.003(2), 1.987(2) |
1.969(2), 1.979(2) |
| Cu–Oacyl,1/2 |
|
|
|
|
2.962(4), 4.312(4) |
2.616(2), 2.595(2) |
|
|
|
|
| Cu–Oalc,1/2 |
|
|
|
|
4.511(4), 3.235(4) |
4.428(2), 4.441(2) |
|
|
|
|
| Cu–OTf |
|
|
|
|
|
|
|
2.444(3) |
|
|
| Bond angles [°] |
| Ngua,1/2–Cu–Nqu,1/2 |
82.6(2), 82.1(2) |
83.5(1), 83.7(1) |
81.7(2), 81.6(2) |
83.2(2), 83.6(2) |
81.3(2), 81.3(2) |
82.2(1), 82.2(1) |
82.8(2), 82.5(2) |
82.2(2), 82.6(2) |
81.7(1), 81.8(1) |
83.8(1), 83.3(1) |
| Ngua,1–Cu–Ngua,2 |
129.1(2) |
149.4(1) |
126.0(2) |
135.9(2) |
124.4(2) |
120.2(1) |
127.5(2) |
144.5(2) |
133.8(1) |
147.5(1) |
| Ngua,1/2–Cu–Nqu,2/1 |
108.2(2), 114.1(2) |
102.6(1), 103.5(1) |
111.7(2), 113.2(2) |
105.4(2), 107.2(2) |
133.0(2), 137.8(2) |
105.3(1), 106.9(1) |
111.3(2), 120.9(2) |
101.9(2), 102.2(2) |
115.9(1), 107.3(1) |
104.1(1), 104.5(1) |
| Nqu,1–Cu–Nqu,2 |
149.0(2) |
154.9(1) |
149.9(2) |
154.6(2) |
105.9(2) |
163.7(1) |
138.1(2) |
165.6(2) |
146.2(1) |
152.4(1) |
| Structure parameters |
|
τ
4 [ ]a |
0.58 |
0.40 |
0.60 |
0.49 |
0.63 |
0.54b |
0.67c |
0.35 |
0.57 |
0.43 |
| ∅τ4 [ ] |
0.49 |
0.54 |
0.59b |
0.51 |
0.50 |
| Δτ4 [ ] |
0.18 |
0.10 |
0.09b |
0.32 |
0.14 |
| ∡ (CuN2, CuN′2) [°] |
65.1 |
42.5 |
68.2 |
54.7 |
69.0 |
65.6b |
74.2 |
40.8 |
63.0 |
45.9 |
| Δ∡ [°] |
22.6 |
13.5 |
3.5b |
33.5 |
17.1 |
| RMSD [Å] |
0.346 |
0.153 |
2.283 |
0.529 |
0.532 |
The geometry of the coordination sphere around the metal center is described by the τ4 parameter and the plane angle ∡ between the planes stretched by the two N donors of each ligand and the copper center.39 In the case of (C12+OTf), the weakly coordinating triflate is not considered for the calculation of the τ4 parameter because the previous study emphasized that the weak coordination of a triflate has no significant influence on the τ4 parameter.23 The τ4 value enables the characterization between an ideal square-planar (τ4 = 0) or ideal tetrahedral (τ4 = 1) coordination geometry. The average coordination geometry of the related Cu(I) and Cu(II) complexes is described by the ∅τ4 parameter, which is the mean of the τ4 parameters of the related Cu(I) and Cu(II) complexes. The similarity between the coordination geometry of the related Cu(I) and Cu(II) complexes is described by the Δτ4 parameter and plane angle difference Δ∡, which are the difference between the τ4 parameters and the plane angles ∡ of the related Cu(I) and Cu(II) complexes, respectively. To describe the similarity between the whole structures of the related Cu(I) and Cu(II) complexes, the root-mean-square deviation (RMSD) is applied.40
In general, all complexes are highly distorted from an ideal coordination geometry indicated by τ4 values clearly deviating from 0 or 1. The Cu(I) complex cations possess higher τ4 values (τ4 = 0.57 to 0.67) compared to the corresponding Cu(II) complex cations (τ4 = 0.35 to 0.54) because Cu(I) prefers a tetrahedral and Cu(II) a square-planar coordination geometry.14 Regarding the Cu–Ngua and Cu–Nqu bond lengths, they are comparable among the Cu(I) complexes C1, C3, C11 and C13 and among the Cu(II) complexes C2, C4, (C12+OTf) and C14. In the Cu(I) complexes C1, C3, C11 and C13, the Cu–Nqu bond lengths are significantly shorter than the Cu–Ngua bond lengths whereas the Cu–Ngua and Cu–Nqu bond lengths are more similar in the Cu(II) complexes C2, C4, (C12+OTf) and C14. Therefore, the methyl substituent in the 2- or 4-position or the methyl ester substituent in the 4-position have no significant influence on the bond lengths of C2, C3, C11, (C12+OTf), C13 and C14 compared to the unsubstituted C1 and C2. The τ4 values and bond lengths of C7 and C8 are not comparable with the other complexes due to the significant influence of the methyl ester substituent.23
In the previous study, we found that the methyl substituent in the 2-position of L2 increases the τ4 parameters of C3 and C4 compared to C1 and C2 and, therefore, also the ∅τ4 parameter of C3 and C4. In addition, the coordination geometries and structures of C3 and C4 possess a higher similarity indicated by the smaller Δτ4 parameter, plane angle difference Δ∡ and RMSD of C3 and C4 compared to C1 and C2. We substantiated these effects with the steric demand of the methyl substituent and not with an electronic effect since the methyl substituent only induces a weak electronic influence.23 The results of C11 and (C12+OTf) prove this argumentation because the observed structural effects in C3 and C4 compared to C1 and C2 are not visible in C11 and (C12+OTf). However, the τ4 parameters of C11 and (C12+OTf) differ significantly from those of C1 and C2 which is probably caused by packing effects and the weak coordination of the triflate in (C12+OTf) (see discussion of the DFT results). Due to the 4-position of the methyl substituent, the electronic effect on the Nqu donor of L7 is similar to that of the methyl substituent in the 2-position of L2 (see discussion of the NBO results of the ligands). Therefore, the steric demand of the methyl substituent in the 2-position of L2 is proven to be the reason for the particular structural properties of C3 and C4.
Further, we discovered that the methyl ester substituent in the 2-position of L5 induces a substantial difference in the structures in C7 and C8 compared to all other related Cu(I) and Cu(II) complexes indicated by the high RMSD. We constituted the elongated Cu–Nqu bond length in C7 compared to C1 with the weakened donor properties of the Nqu donor in C7 induced by the electron density withdrawing effect and the steric demand of the methyl ester substituent.23 However, no elongation of the Cu–Nqu bond length is present in C13 which entails that the elongation in C7 is not caused by the electron density withdrawing effect but just by the steric demand. In C8, we observed a 4 + 2 coordination motif due to the donor properties of the methyl ester substituent in the 2-position.23 This coordination motif is not possible in C14 resulting in a significantly higher structurally similarity between C13 and C14 compared to C7 and C8.
The results show that the 2-position is crucial for the substituent influence on the complex structures because the structural particularities of C3, C4, C7 and C8 are not present in C11–C14. Therefore, the investigation of C11–C14 enables the analysis of the pure electronic effect of the methyl and methyl ester substituent without the influence of a steric demand or additional donor properties.
DFT calculations of the copper complexes
DFT calculations for C11–C14 were performed analogously to the DFT calculations for L7 and L8 (further information in the ESI†).27–34 In the case of C12, the weakly coordinating triflate present in the molecular structure of (C12+OTf) was not considered for the calculations. First, optimization calculations were performed (Table 2, more structural information are provided in Tables S4 and S5 in the ESI†). In general, the complexes possess a high agreement between the molecular structures in the solid state and the calculated structures.
Table 2 Overview of the discussed ligands, complex cations and redox couples
| Ligand (label) |
Complex cation (label) |
Complex redox couple (label) |
| TMGqu (L1) |
[Cu(TMGqu)2]+ (C1) |
[Cu(TMGqu)2]+/2+ (R1) |
| [Cu(TMGqu)2]2+ (C2) |
| TMG2Mequ (L2) |
[Cu(TMG2Mequ)2]+ (C3) |
[Cu(TMG2Mequ)2]+/2+ (R2) |
| [Cu(TMG2Mequ)2]2+ (C4) |
| TMG2cHexqu (L4) |
[Cu(TMG2cHexqu)2]+ (C5) |
[Cu(TMG2cHexqu)2]+/2+ (R3) |
| [Cu(TMG2cHexqu)2]2+ (C6) |
| TMG2Meequ (L5) |
[Cu(TMG2Meequ)2]+ (C7) |
[Cu(TMG2Meequ)2]+/2+ (R4) |
| [Cu(TMG2Meequ)2]2+ (C8) |
| TMG4NMe2qu (L6) |
[Cu(TMG4NMe2qu)2]+ (C9) |
[Cu(TMG4NMe2qu)2]+/2+ (R5) |
| [Cu(TMG4NMe2qu)2]2+ (C10) |
| TMG4Mequ (L7) |
[Cu(TMG4Mequ)2]+ (C11) |
[Cu(TMG4Mequ)2]+/2+ (R6) |
| [Cu(TMG4Mequ)2]2+ (C12) |
| TMG4Meequ (L8) |
[Cu(TMG4Meequ)2]+ (C13) |
[Cu(TMG4Meequ)2]+/2+ (R7) |
| [Cu(TMG4Meequ)2]2+ (C14) |
Following the optimization calculations, NBO calculations were performed for C11–C14 to investigate the substituent influence on the NBO charges of the copper center caused by the methyl ester substituent. In the previous study, we argued that the Nqu donor in C7 is affected by the steric demand and electron density withdrawing effect of the methyl ester substituent.23 However, the results of C13 show that the influence of the methyl ester substituent in C7 is thus limited to the steric demand.
Contrary to the Cu(I) complexes, the substituent influence on the Ngua and Nqu donor is more noticeable in the Cu(II) complexes (Fig. 4, bottom). In C4, a significant weakening of the donor properties of the Ngua donor, revealed by the substantially decreased charge-transfer energy compared to C2, is present. Since this effect on the Ngua donor does not occur in C12, the steric demand of the methyl substituent in the 2-position is responsible for the effect in C4. The results of C14 show that the extraordinary long Cu–Ngua bond length and weak donor properties of the Ngua donor in C8 compared to C2 are a result of the 4 + 2 coordination motif present in C8 and not of a possible electronic influence of the methyl ester substituent on the Ngua donor. The Nqu donor in C12 and C14 is affected in the opposite way by the substituents compared to the Nqu donor in C4 and C8. In C4, the steric demand of the methyl substituent elongates the Cu–Nqu bond length resulting in a lower charge-transfer energy and, therefore, weaker donor properties of the Nqu donor compared to C2. In contrast, the weak electron density donating effect of the methyl substituent induces a higher charge-transfer energy and, therefore, increased donor strength of the Nqu donor in C12 compared to C2. In C8, the pulling effect of the Oacyl donor on the Cu(II) center, induced by the 4 + 2 coordination motif, shortens the Cu–Nqu bond length compared to C2 leading to a significantly increased charge-transfer energy of the Nqu donor. If this pulling effect of the methyl ester substituent is not present as in C14, only the electron density withdrawing effect on the Nqu donor remains. Therefore, the charge-transfer energy of the Nqu donor is decreased in C14 compared to C2. These results demonstrate that in C8 the strengthening of the Nqu donor induced by the pulling effect of the methyl ester substituent on the Cu(II) center overcomes the weakening of the Nqu donor caused by the electron density withdrawing effect of the methyl ester substituent. Regarding all complexes C1–C14 (Table 2), the substituent influence results in different correlations between the charge-transfer energy and the bond length in dependency of the donor and the oxidation state of the copper center (Fig. 5).
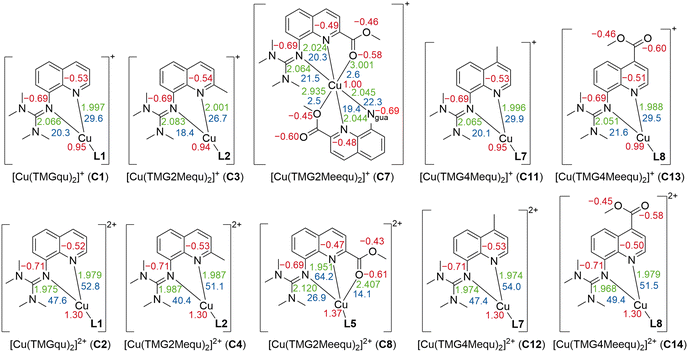 |
| | Fig. 4 Selected calculated NBO charges [e units] (red), charge-transfer energies ECT [kcal mol−1] (blue) and bond length [Å] (green) of the Cu(I) (top) and Cu(II) (bottom) complex cations C1–C4,23C7,23C823 and C11–14 (in case of nonexistent or insignificant differences between both ligands, the average values are presented and the coordination of one bidentate ligand is simplified; NBO6.0, TPSSh, def2-TZVP, GD3BJ, PCM (MeCN); all values are provided in Table S6 and S7 in the ESI†). | |
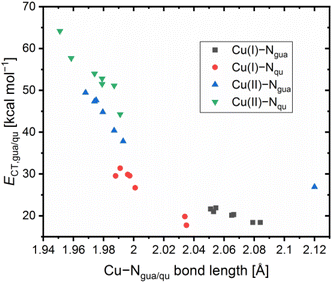 |
| | Fig. 5 Plot of the charge-transfer energies ECT of the Ngua and Nqu donor to the Cu center against the Cu–Ngua and Cu–Nqu bond lengths of C1–C14 (in case the two ligands exhibit different values for the same type of donor, the average value is used). | |
Since the substituents affect the donor properties of the Ngua and Nqu donor, they also affect the total donor properties of the ligands. The total donor properties of the ligands are described by the total charge-transfer energy ECT,total which is the sum of the charge-transfer energies ECT,gua and ECT,qu of the Ngua and Nqu donor (values provided in Table S8 in the ESI†). Due to the donor properties of the methyl ester substituent in the 2-position, a second value for the total charge-transfer energy ECT,total of C7 and C8 considering the charge-transfer energies of the O donors is defined. The different donor properties influence the theoretical stabilization of the copper complexes quantified by the ground state energies EGS,DFT of the copper complexes. To enable the relative comparison of the different substituent influences on the donor properties and, therefore, on the theoretical stabilization of the related Cu(I) and Cu(II) complexes, the related Cu(I) and Cu(II) complexes C1–C14 are regarded as the copper complex redox couples R1–R7 (Table 2). This leads to the calculation of the charge-transfer energy differences ΔECT,total, ΔECT,gua and ΔECT,qu between the related Cu(I) and Cu(II) complexes (eqn (1), values provided in Table S8 in the ESI†).
| | | ΔECT,donor(RX) = ECT,donor(Cu(II)(RX)) − ECT,donor(Cu(I)(RX)) | (1) |
Then, the differences ΔΔECT,total, ΔΔECT,gua and ΔΔECT,qu between the charge-transfer energy differences ΔECT,total, ΔECT,gua and ΔECT,qu of the redox couples and R1 are calculated (eqn (2) and Table 3). These values, referred to as referenced total charge-transfer energy differences ΔΔECT,total, describe whether a substituent induces a relatively better donation in the Cu(I) or Cu(II) species of a redox couple compared to R1. A relatively better donation of the Cu(I) species of a redox couple compared to R1 is indicated by a positive ΔΔECT,total, ΔΔECT,gua and ΔΔECT,qu value and a relatively better donation of the Cu(II) species of a redox couple compared to R1 is indicated by a negative ΔΔECT,total, ΔΔECT,gua and ΔΔECT,qu value.
| | | ΔΔECT,donor(RX) = ΔECT,donor(RX) − ΔECT,donor(R1) | (2) |
Table 3 Calculated ΔΔECT,total (ΔΔECT,total value of R4 that includes the O donors is marked in red), ΔΔECT,gua, ΔΔECT,qu and ΔΔEGS,DFT values of R1–R7 (NBO6.0, TPSSh, def2-TZVP, GD3BJ, PCM (MeCN))
| |
ΔΔECT,total [kcal mol−1] |
ΔΔECT,gua [kcal mol−1] |
ΔΔECT,qu [kcal mol−1] |
ΔΔEGS [kJ mol−1] |
| [Cu(TMGqu)2]+/2+ (R1) |
0.0 |
0.0 |
0.0 |
0.0 |
| [Cu(TMG2Mequ)2]+/2+ (R2) |
−8.5 |
−10.7 |
2.2 |
12.7 |
| [Cu(TMG2cHexqu)2]+/2+ (R3) |
−14.5 |
−21.0 |
6.5 |
23.3 |
| [Cu(TMG2Meequ)2]+/2+ (R4) |
−2.5 (20.4) |
−44.7 |
42.1 |
−1.2 |
| [Cu(TMG4NMe2qu)2]+/2+ (R5) |
4.2 |
−1.9 |
6.1 |
−28.4 |
| [Cu(TMG4Mequ)2]+/2+ (R6) |
1.4 |
−0.3 |
1.7 |
−6.4 |
| [Cu(TMG4Meequ)2]+/2+ (R7) |
−1.7 |
0.9 |
−2.6 |
14.9 |
In an analogous procedure, the referenced ground state energy differences ΔΔEGS,DFT of the redox couples are calculated (eqn (3), (4) and Table 3, EGS,DFT and ΔEGS,DFT values provided in Table S9 in the ESI†). These values describe whether a substituent induces a relatively better theoretical stabilization of the Cu(I) or Cu(II) species of a redox couple compared to R1. A relatively better theoretical stabilization of the Cu(I) species of a redox couple compared to R1 is indicated by a negative ΔΔEGS,DFT value and a relatively better donation of the Cu(II) species of a redox couple compared to R1 is indicated by a positive ΔΔEGS,DFT value.
| | | ΔEGS(RX) = EGS(Cu(II)(RX)) − EGS(Cu(I)(RX)) | (3) |
| | | ΔΔEGS(RX) = ΔEGS(RX) − ΔEGS(R1) | (4) |
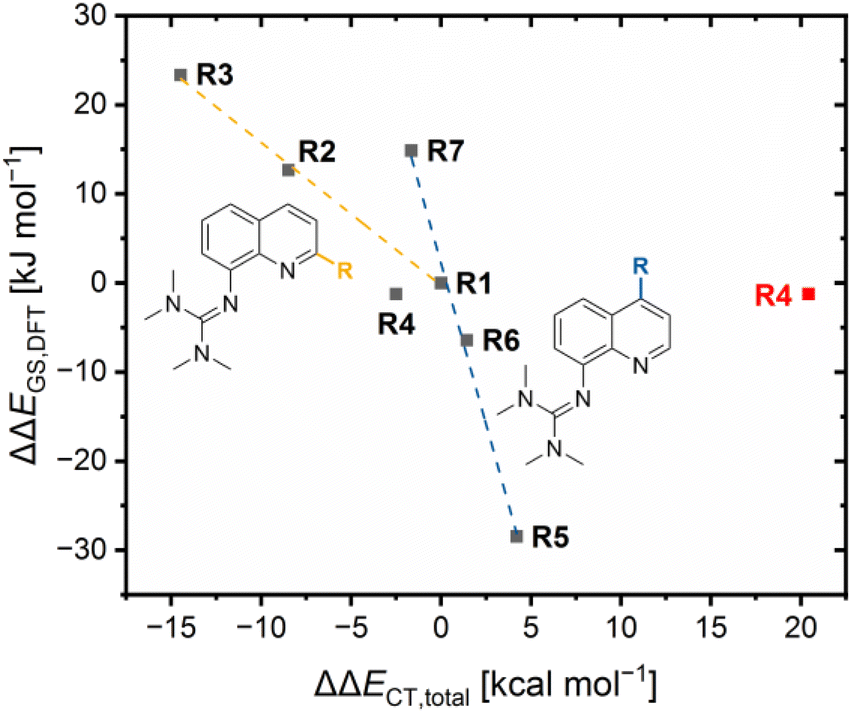
The results demonstrate that the referenced total charge-transfer energy differences ΔΔECT,total and referenced ground state energy differences ΔΔEGS,DFT correlate with each other except for R4 (Fig. 6). For R2, R3 and R7, the relatively stronger total donation in the Cu(I) species compared to R1, indicated by a negative ΔΔECT,total value, leads to a relatively better theoretical stabilization of the Cu(I) species compared to R1, indicated by a positive ΔΔEGS,DFT value. The opposite case occurs for R5 and R7. Therefore, the relative theoretical stabilization can be estimated based on the relative total donor properties of the ligands.
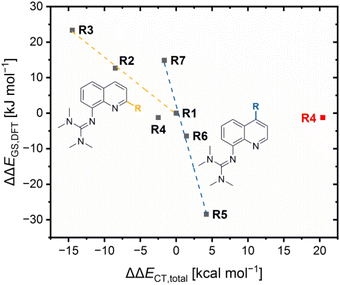 |
| | Fig. 6 Plot of the referenced ground state energy differences ΔΔEGS,DFT against the referenced total charge-transfer energy differences ΔΔECT,total of R1–R7 (yellow correlation considers R1 and in 2-position alkyl-substituted redox couples, blue correlation considers R1 and in 4-position substituted redox couples, data point of R4 that also considers the O donors is marked red). | |
Furthermore, two different linear correlations between the referenced total charge-transfer energy difference ΔΔECT,total and the referenced ground state energy difference ΔΔEGS, depending on the substituent position, are present. R2 and R3 with alkyl substituents in the 2-position and R1 form one correlation and R5, R6 and R7 with substituents in the 4-position and R1 form the other. The reason for the two linear correlations is the different ways the substituents in the 2- and 4-position affect the relative donor properties of the Ngua and Nqu donor represented by the referenced charge-transfer energy differences of the guanidine and quinoline donor ΔΔECT,gua and ΔΔECT,qu, (Table 3). In R2 and R3, the steric demand of the alkyl substituents in the 2-position affects the Ngua and Nqu in opposite ways. Whereas the Ngua donor possesses a relatively stronger donation in the Cu(I) species of R2 and R3 compared to R1, indicated by positive ΔΔECT,qu values, the Nqu donor possesses a relatively stronger donation in the Cu(II) species, indicated by negative ΔΔECT,gua values. However, the relative donor strength of the Ngua donor is significantly more affected than that of the Nqu donor. Therefore, the influence on the Ngua donor prevails that on the Nqu donor. The prevailing influence on the donor properties of the Ngua donor increases with the steric demand (H < Me < cHex). For this reason, the ΔΔECT,total values decrease with the steric demand, indicating a relatively stronger donation of the Cu(I) species.
Contrary effects on the Ngua and Nqu donor, like in R2–R3, are also visible for R5–R7. However, in these cases the relative donor properties of the Nqu donor is more affected than that of the Ngua donor and, hence, the influence on the Nqu donor prevails that on the Ngua donor. The reason is, that the substituents in the 4-position only possess an electronic influence which mainly affects the Nqu donor but no steric demand that could influence the coordination geometry and, therefore, the donor properties of the Ngua donor. The electron density donating effect of the dimethylamine substituent leads to relatively stronger donor properties of the Nqu donor in the Cu(II) species of R5, represented by a positive ΔΔECT,qu value. As a result, a positive ΔΔECT,total value is obtained, indicating a relatively stronger total donation in the Cu(II) species compared to R1. The electron density donating effect of the methyl substituent in R6 is weaker than of the dimethylamine substituent in R5. Further, the effect of the methyl substituent in the 4-position in R6 is completely different to the effect of the methyl substituent in the 2-position in R2. This result confirms that the steric demand of the alkyl substituent in the 2-position is responsible for the relatively stronger total donation in the Cu(I) species of R2 and R3 compared to R1. R7 exhibits the opposite results compared to R5 and R6 due to the electron density withdrawing effect of the methyl ester substituent.
In comparison, the electronic influence of the substituents in the 4-position affects the relative donor properties of the Ngua and Nqu donor in R5–R7 more weakly than the steric demand of the substituents in the 2-position in R2 and R3. Nevertheless, the weaker influence on the relative donor properties of the Nqu donor in R5–R7 has a more substantial effect on the relative theoretical stabilization of the Cu(I) and Cu(II) species than the stronger influence on the relative donor properties of the Ngua donor in R2 and R3. Therefore, the relative theoretical stabilization of the Cu(I) and Cu(II) species of the redox couples is more affected by the donor properties of Nqu donor than by that of the Ngua donor, resulting in the two different linear correlations (Fig. 6).
The results of R4 do not fit to any of the two correlations because of the interactions between the copper center and the methyl ester substituent, especially the 4 + 2 coordination motif in C8. The ΔΔECT,total value that includes the O donors is significantly higher compared to all other redox couples, indicating the highest relative total donation in a Cu(II) species. However, the smallest ΔΔEGS,DFT value is obtained for R4, indicating a similar relative theoretical stabilization compared to R1. The neglect of the O donors results in a ΔΔECT,total value that fits better to the ΔΔEGS,DFT value (Fig. 6, ΔΔECT,total value without the O donors in black and with O donors in red). Therefore, the charge-transfer energies of the O donors are assumed to be overestimated, especially of the Oacyl donor in C8.
Electrochemical properties
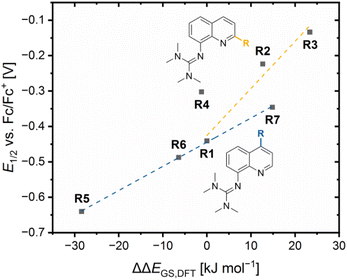
The redox potentials E1/2 were determined by cyclic voltammetry in MeCN starting from the Cu(I) complexes and were referenced against the Fc/Fc+ redox couple as an internal standard (exemplarily shown for R6 in Fig. 7, for R7 see Fig. S7 in the ESI†). The cyclic voltammograms indicate a reversible one-electron redox process caused by the similar structures of the related Cu(I) and Cu(II) complexes and the absence of any side reactions. The results of the novel redox couples R6 and R7 are compared with the redox couples R1–R5 from the previous study (Table 4).23 In the previous study, we already discussed a correlation between the redox potential E1/2 and the donor properties of the ligands and the results of R6 and R7 further support this correlation. The plot of the redox potential E1/2 representing the relative electrochemical stabilization against the referenced total charge-transfer energy difference ΔΔECT,total shows that a relatively stronger total donation in the Cu(I) species of a redox couple compared to R1 leads to an increase in the relative electrochemical stabilization of the Cu(I) species and vice versa (Fig. 8). Hence, the relative electrochemical stabilization can be estimated based on the relative total donor properties of the ligands. Further, two linear correlations depending on the substituent position are visible, which is analogous to the correlation between the relative theoretical stabilization and the relative total donor properties (Fig. 6 and 8). As noted earlier, this is caused by the different ways the substituents affect the Ngua and Nqu donor. This accordance between the experimental electrochemical relative stabilization and the calculated relative stabilization verifies the results of the DFT calculations.
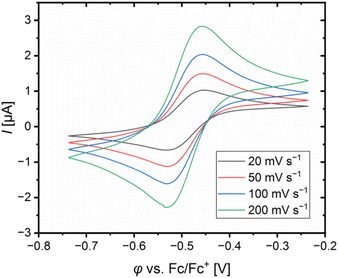 |
| | Fig. 7 Cyclic voltammogram of [Cu(TMG4Mequ)2]+/2+ (R6) starting from [Cu(TMG4Mequ)2]PF6 (c = 1 mM) in MeCN with [NBu4][PF6] (c = 100 mM). | |
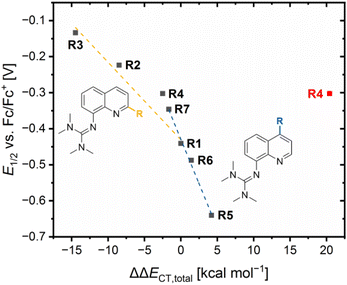 |
| | Fig. 8 Plot of the redox potentials E1/2 against the referenced charge-transfer energy differences ΔΔECT,total of R1–R7 (yellow correlation considers R1 and in 2-position alkyl-substituted redox couples, blue correlation considers R1 and in 4-position substituted redox couples, data point of R4 that also considers the O donors is marked in red). | |
Table 4 Experimental redox potentials E1/2vs. Fc/Fc+ and vs.R1, referenced charge-transfer energy differences ΔΔECT,total, referenced ground state energy differences ΔΔEGS,DFT/CCSD(T) and theoretical redox potentials Etheo,DFT/CCSD(T)vs.R1 of R1–R7 (experimental redox potentials E1/2vs. Fc/Fc+ of R1–R5 from previous study;21 DFT: TPSSh, def2-TZVP, GD3BJ, PCM (MeCN), NBO6.0; DLPNO-CCSD(T): def2-TZVP, def2-TZVP/C, C-PCM (MeCN))
| |
Exp. |
DFT |
DLPNO-CCSD(T) |
|
E
1/2
vs. Fc/Fc+ [V] |
E
1/2
vs.
R1 [V] |
ΔΔECT,total [kcal mol−1] |
ΔΔEGS,DFT [kJ mol−1] |
E
theo,DFT
vs.
R1 [V] |
ΔΔEGS,CCSD(T) [kJ mol−1] |
E
theo,CCSD(T)
vs.
R1 [V] |
| [Cu(TMGqu)2]+/2+ (R1) |
−0.441 |
0.000 |
0.0 |
0.000 |
0.000 |
0.000 |
0.000 |
| [Cu(TMG2Mequ)2]+/2+ (R2) |
−0.224 |
0.217 |
−8.5 |
12.664 |
0.131 |
15.159 |
0.157 |
| [Cu(TMG2cHexqu)2]+/2+ (R3) |
−0.134 |
0.307 |
−14.5 |
23.338 |
0.242 |
34.165 |
0.354 |
| [Cu(TMG2Meequ)2]+/2+ (R4) |
−0.302 |
0.138 |
−2.5 (20.4) |
−1.235 |
−0.013 |
13.799 |
0.143 |
| [Cu(TMG4NMe2qu)2]+/2+ (R5) |
−0.640 |
−0.199 |
4.2 |
−28.446 |
−0.295 |
−14.539 |
−0.151 |
| [Cu(TMG4Mequ)2]+/2+ (R6) |
−0.488 |
−0.047 |
1.4 |
−6.423 |
−0.067 |
−4.075 |
−0.042 |
| [Cu(TMG4Meequ)2]+/2+ (R7) |
−0.346 |
0.095 |
−1.7 |
14.852 |
0.154 |
6.291 |
0.065 |
Since the relative theoretical stabilization and the relative electrochemical stabilization correlate in the same way with the relative donor properties, the direct correlation between both expressions for the relative stabilization is of interest. The plot of the redox potential E1/2 against the referenced ground state energy difference ΔΔEGS,DFT shows a good correlation between the relative electrochemical stabilization and the relative theoretical stabilization for all redox couples except for R4 (Fig. 9). A relatively stronger theoretical stabilization of the Cu(I) species of a redox couple compared to R1 indicated by a positive ΔΔEGS,DFT value results in a relatively stronger electrochemical stabilization of the Cu(I) species a redox couple and, therefore, in a higher redox potential compared to R1. Additionally, the correlation of the redox potential E1/2 and the referenced ground state energy difference ΔΔEGS,DFT depends on the position of the substituent leading to two linear correlations. The reason is again the different ways the substituents affect the relative donor properties of the Ngua and Nqu donor in dependency of the substituent position (see discussion of the NBO results of the complexes). As before, R4 does not fit into the correlation, since the slightly increased relative theoretical stabilization of the Cu(II) species contradicts the significantly increased relative electrochemical stabilization of the Cu(I) species compared to R1. The reason for the misfit could again be the extraordinary 4 + 2 coordination motif in C8 compared to the other complexes.
 |
| | Fig. 9 Plot of the redox potentials E1/2vs. Fc/Fc+ against the referenced ground state energy differences ΔΔEGS,DFT of R1–R7 (yellow correlation considers R1 and in 2-position alkyl-substituted redox couples, blue correlation considers R1 and in 4-position substituted redox couples). | |
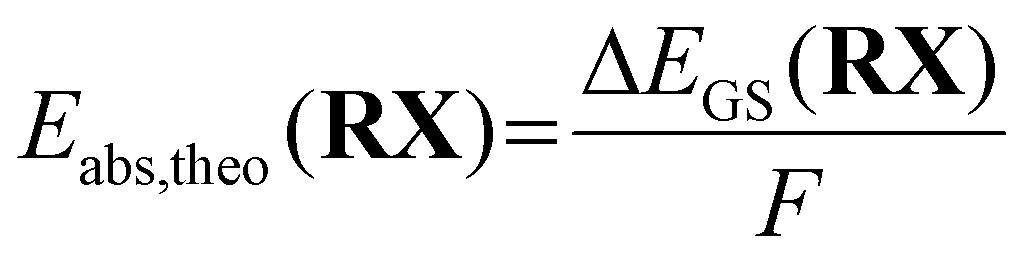
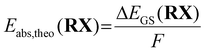
Due to the correlation between the experimental redox potential E1/2 and the referenced ground state energy differences ΔΔEGS, the calculation of theoretical redox potentials Etheo was performed. The absolute redox potential depends on the Gibbs free energy difference ΔG between the Cu(I) and Cu(II) species of a redox couple (eqn (5)).
| |  | (5) |
In a previous study, we calculated the Gibbs free energy difference ΔG using a Born–Haber cycle.41 Here, the ground state energy difference ΔEGS,DFT was used instead of the Gibbs free energy difference ΔG as a simplification (eqn (6)).
| |  | (6) |
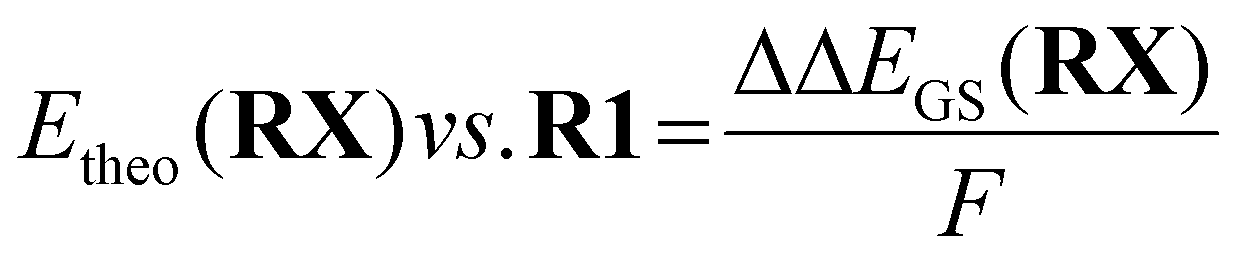
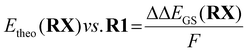
To obtain a redox potential Etheo relative to the redox potential of R1, the referenced ground state energy differences ΔΔEGS,DFT was used (eqn (7) and Table 4).
| |  | (7) |
Next to theoretical redox potential Etheo,DFT based on the referenced ground state energy differences ΔΔEGS,DFT determined by DFT calculations, theoretical redox potentials Etheo,CCSD(T) based on the referenced ground state energy differences ΔΔEGS,CCSD(T) determined by domain-based local pair natural orbital coupled cluster with singles, doubles and perturbative triples excitations (DLPNO-CCSD(T)) calculations were calculated (Table 4, EGS,CCSD(T) and ΔEGS,CCSD(T) values provided in Table S9 in the ESI†). The DLPNO-CCSD(T) calculations were conducted applying the basis set def2-TZVP, the auxiliary basis set def2-TZVP/C and the conductor-like polarizable continuum model (C-PCM) as solvent model for MeCN (further information in the ESI†). The plot of the theoretical redox potentials Etheo,DFT/CCSD(T) against the experimental redox potentials E1/2 indicates the accuracy of the results (Fig. 10). The DFT based theoretical redox potentials Etheo,DFT of R2–R6 are lower than the experimental redox potentials E1/2 whereas for R7 the opposite case is present. The mean deviation between experimental and computed values of R2–R7 is 0.079 V. However, the shift of the redox potential compared to R1 is estimated correctly by the DFT based theoretical redox potentials Etheo,DFT for R2, R3 and R5–R7. For R4, the influence of the methyl ester substituent is not as well predicted as the influence of the other substituents, which could be caused by the coordinative interactions between the copper center and the methyl ester substituent. Compared to the DFT based theoretical redox potentials Etheo,DFT, the DLPNO-CCSD(T) based theoretical redox potentials Etheo,CCSD(T) of R2–R7 fit even better to the experimental redox potentials E1/2 resulting in a smaller mean deviation of 0.033 V. In particular, the influence of the methyl ester substituent in R4 is much better predicted by the DLPNO-CCSD(T) calculations than by the DFT calculations. In general, this method proved to be suitable for the estimation of redox potentials with a good accuracy despite small effort. Usually, the determination of theoretical redox potentials of larger molecules like copper complex redox couples is complicated since a redox potential is defined by the small energy difference between the comparable large total energy values of the reduced and oxidized species of a redox couple. These total energy values contain each an energy value defined by the structure and a solvation energy contribution. If a redox process causes significant changes in the structure and the solvent sphere, the exact calculation of the difference in the total energy values is more difficult than for small changes in the structure and the solvent sphere.42 Usually, the Cu(I) and Cu(II) species of a redox couple possess significantly different structures because Cu(I) and Cu(II) each favor different coordination numbers and geometries.14 Therefore, the accurate determination of theoretical redox potentials is still challening.42 The reason for the relatively good accuracy of the DFT based theoretical redox potentials Etheo,DFT of R2, R3 and R5–R7 is presumably the high structural similarity between the related Cu(I) and Cu(II) species. In contrast, the low accuracy of the DFT based theoretical redox potentials Etheo,DFTR4 is probably caused by the larger structural differences between the Cu(I) and Cu(II) species or by an overestimated stabilizing effect of the methyl ester substituent in the Cu(II) species. The high accuracy of the DLPNO-CCSD(T) based theoretical redox potentials Etheo,CCSD(T) of R4 despite the same large structural differences between the Cu(I) and Cu(II) species indicates that the DFT calculations overestimate the stabilizing influence of the interactions between Cu(II) center and the methyl ester substituent.
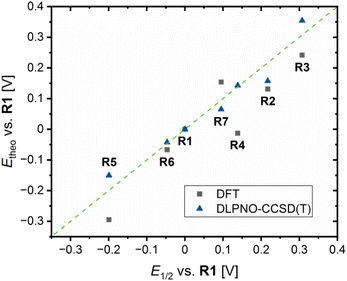 |
| | Fig. 10 Plot of the theoretical redox potentials Etheo,DFT/CCSD(T)vs.R1 against the experimental redox potentials E1/2vs.R1 of R1–R7 (green line represents perfect accordance between both values). | |
Electron transfer studies
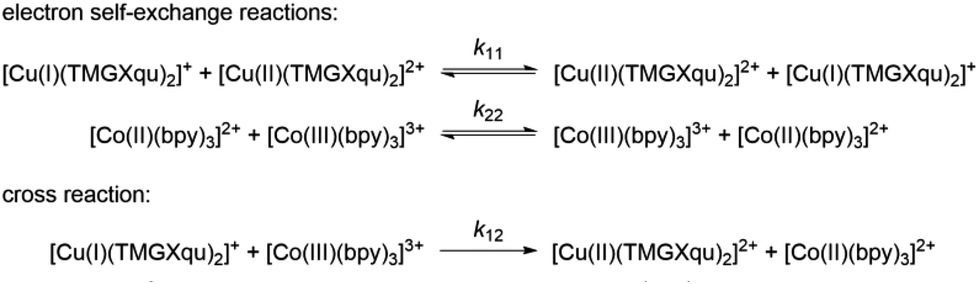
The electron transfer properties of R6 and R7 were analyzed like these of R1–R5 in the previous study by determination of the electron self-exchange rate k11 using the Marcus cross relation (eqn (8)–(11)). The Marcus cross relation is based on the Marcus theory describing the mechanism of the outer-sphere electron transfer between two metal complexes.43 The electron self-exchange rate k11 is the reaction rate of the electron transfer reaction between the reduced and the oxidized species of the same redox couple. An electron is transferred from the reduced to the oxidized species resulting in the same species as before the electron transfer. In case of the copper redox couples the electron is transferred from the Cu(I) species to the Cu(II) species (Scheme 3, top). Since the electron self-exchange rate depends on the temperature, the solvent and the activity coefficient of the reactants, a direct comparison of electron self-exchange rates k11 of different redox couples is only applicable if they were determined under same conditions. For the determination of the electron self-exchange rate k11via the Marcus cross relation, the reaction rate k12 of a cross reaction between one species of the investigated redox couple and a counter complex has to be determined (Scheme 3, bottom). The counter complex itself is the reduced or oxidized species of the counter complex redox couple, whose electron self-exchange rate k22 must be known (Scheme 3, middle). During the cross reaction, the counter complex oxidizes or reduces the reduced or oxidized species of the analyzed redox couple. In the ideal case, it would make no difference whether the oxidation or the reduction is analyzed to determine the electron self-exchange rate k11. Nevertheless, the direct comparison is only possible if the same counter complex is used since only a small measurement uncertainty in the electron self-exchange rate k22 of the counter complex redox couple can result in a large error. In accordance with the previous study, the counter complex [Co(bpy)3]3+ of the counter complex redox couple [Co(bpy)3]2+/3+ was used (Scheme 3, middle).23 Due to the redox potential of [Co(bpy)3]2+/3+, the Cu(I) species of R6 and R7 are oxidized by [Co(bpy)3]3+ (Scheme 3, bottom). The electron self-exchange rate k22 of [Co(bpy)3]2+/3+ in MeCN at 298 K is reported in the literature.44| | 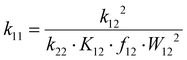 | (8) |
| |  | (9) |
| |  | (10) |
| |  | (11) |
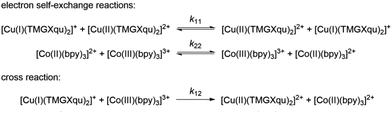 |
| | Scheme 3 Electron self-exchange reactions of a copper guanidine quinoline redox couple (top) and the counter complex redox couple [Co(bpy)3]2+/3+ (middle) and the cross reaction between the Cu(I) species of a copper guanidine quinoline redox couples and the counter complex [Co(bpy)3]3+ (bottom) (TMGXqu represents the different guanidine quinoline ligands). | |
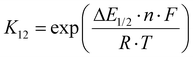
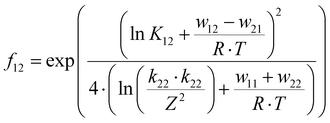
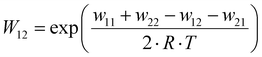
The electron self-exchange rate k11 is calculated with the experimentally determined reaction rate k12 and equilibrium constant K12 (eqn (9)) of the cross reaction, the electron self-exchange rate k22 of the counter complex redox couple, the term f12 (eqn (10)) and the work term W12 (eqn (11)).
Since the cross reaction is a redox reaction, the equilibrium constant K12 is defined by the redox potential difference ΔE1/2 of the copper complex redox couple and the counter complex redox couple (eqn (9) and Table 5).
Table 5 Redox potential differences ΔE1/2 between R1–R7 and the counter complex redox couple [Co(bpy)3]2+/3+, equilibrium constants K12 and reaction rates k12 of the cross reactions between the Cu(I) species of R1–R7 and the counter complex [Co(bpy)3]3+ and electron self-exchange rates k11 and calculated ∅τ4 and Δτ4 parameters of R1–R7 (values of R1–R5 from previous study21)
| |
ΔE1/2 [V] |
K
12 [ ] |
k
12 [M−1 s−1] |
k
11 [M−1 s−1] |
Δτ4,DFT [ ] |
∅τ4,DFT [ ] |
|
The comparability of this value is limited due to the 4 + 2 coordination motif.
|
| [Cu(TMGqu)2]+/2+ (R1) |
−0.385 |
3.19 × 10⁶ |
(2.31 ± 0.07) × 104 |
(2.81 ± 0.18) × 102 |
0.20 |
0.53 |
| [Cu(TMG2Mequ)2]+/2+ (R2) |
−0.168 |
6.81 × 10² |
(1.63 ± 0.16) × 103 |
(2.19 ± 0.44) × 103 |
0.13 |
0.59 |
| [Cu(TMG2cHexqu)2]+/2+ (R3) |
−0.078 |
2.04 × 101 |
(2.25 ± 0.14) × 102 |
(1.15 ± 0.15) × 103 |
0.07 |
0.68 |
| [Cu(TMG2Meequ)2]+/2+ (R4) |
−0.246 |
1.46 × 10⁴ |
(6.67 ± 0.30) × 103 |
(2.33 ± 0.22) × 103 |
0.00a |
0.61a |
| [Cu(TMG4NMe2qu)2]+/2+ (R5) |
−0.584 |
7.45 × 10⁹ |
(4.74 ± 0.27) × 105 |
(3.38 ± 0.44) × 102 |
0.20 |
0.54 |
| [Cu(TMG4Mequ)2]+/2+ (R6) |
−0.431 |
2.52 × 10⁷ |
(4.90 ± 0.19) × 104 |
(2.38 ± 0.20) × 102 |
0.20 |
0.53 |
| [Cu(TMG4Meequ)2]+/2+ (R7) |
−0.290 |
9.24 × 10⁴ |
(3.88 ± 0.16) × 103 |
(1.48 ± 0.13) × 102 |
0.19 |
0.53 |
The reaction rates k12 of the cross reactions of the Cu(I) complexes C11 and C13 with the counter complex [Co(bpy)3]3+ were determined in MeCN at 298 K using stopped-flow UV/Vis spectroscopy. During the cross reaction UV/Vis spectra were recorded and the time-dependent changes examined (exemplarily shown for C13 in Fig. 11, left). The cross reactions were performed with an excess of [Co(bpy)3]3+ resulting in a nearly constant concentration of [Co(bpy)3]3+ throughout the reaction. Therefore, the cross reaction is pseudo-first order which enables the determination of the reaction rate kobs by a first order decay fit of the absorption at the absorption maxima of the Cu(I) complex against the reaction time (exemplarily shown for C13 in Fig. 11, middle). The reaction rate kobs was determined for five different concentrations of [Co(bpy)3]3+. By a linear fit of the reaction rate kobs against the concentration of [Co(bpy)3]3+, the reaction rate k12 is obtained (exemplarily shown for C13 in Fig. 11, right; for C11 see Fig. S10 in the ESI;†Table 5). The influence of the ionic strength on the activity coefficients of the reactants is neglected.
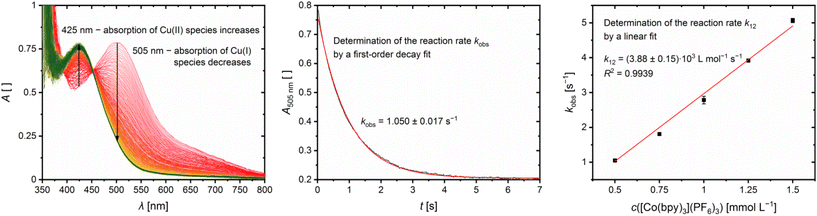 |
| | Fig. 11 Results of the cross reaction of [Cu(TMG4Meequ)2]+ (C13) with [Co(bpy)3]3+: time-dependent change of the UV/Vis spectra (left) and time-trace of the Cu(I) absorption band at 505 nm (middle; black: measurement, red: fit) during the cross reaction with an excess of [Co(bpy)3]3+ (1![[thin space (1/6-em)]](https://www.rsc.org/images/entities/char_2009.gif) :5) in MeCN at 298 K and plot of the reaction rate kobs against the concentration of [Co(bpy)3]3+ (right; black: measurement, red: fit; some error bars are too small to be visualized properly). :5) in MeCN at 298 K and plot of the reaction rate kobs against the concentration of [Co(bpy)3]3+ (right; black: measurement, red: fit; some error bars are too small to be visualized properly). | |
Following the Marcus cross relation, the electron self-exchange rates k11 of R6 and R7 were calculated and compared with those of R1–R5 from the previous study (eqn (8) and Table 5).23 For R6, a similar electron self-exchange rate k11 compared to R1 is obtained. Therefore, the methyl substituent in the 4-position and its weak electronic effect have no significant influence on the electron transfer. Further, R6 and R1 possess identical Δτ4 and ∅τ4 parameter because the methyl substituent in the 4-position does not exhibit any steric demand. Hence, from the structural point of view, they are similar entatic state models and, therefore, similar electron self-exchange rates are expectable. Compared to R6, the methyl substituent in the 2-position of R2 exhibits a steric demand resulting in more similar structures of the Cu(I) and Cu(II) species indicated by a smaller Δτ4 parameter and, thus, in a higher electron self-exchange rate k11 compared to R1. This results shows that the steric demand of the methyl substituent in the 2-position of R2 is crucial for the accelerated electron transfer and the enhanced ability as entatic state model. For R7, an electron self-exchange rate k11 half as large but in the same order of magnitude as for R1 is obtained. Therefore, the methyl ester substituent in the 4-position and its electronic effect slightly decelerates the electron transfer. In our previous study, we found that the methyl ester substituent in the 2-position of R4 induces a significant increase in the electron self-exchange rate k11. We made different hypotheses to explain this influence of the methyl ester substituent in the 2-position on the electron transfer.23 The electron self-exchange rate of R7 provides new insights into the role of the methyl ester substituent in R4 regarding the fast electron transfer. The suggested hypothesis that the methyl ester substituent in R4 could act as an electron bridge for the outer-sphere electron transfer resulting in a shortened jump length of the electron through space can be rejected. If this hypothesis would be the reason for the fast electron transfer of R4, a faster electron transfer should also be visible for R7 because substituents in the 2- and 4-position exhibit similar electronic effects on the aromatic system. Hence, the extraordinary coordinative behavior of the ligand is the reason for the fast electron transfer and the enhanced entatic state whereby two different explanations are possible. First, the additional coordinative interactions between the methyl ester substituent and the copper center could be energetically unfavorable for the copper center. In the Cu(I) species of R4, the additionally weak interactions between the methyl ester substituent and the Cu(I) center could be energetically unfavorable since Cu(I) prefers to be four-coordinate in a tetrahedral geometry. In the Cu(II) species of R4, the 4 + 2 coordination motif with the two non-axially positioned elongated Cu–Oacyl bonds could be energetically unfavorable. These energetically unfavored interactions in the Cu(I) and Cu(II) species of R4 could be comparable to the energetically unfavorable stronger distortion in R2 and R3 and, therefore, the reason for the accelerated electron transfer compared to R1. Second, the methyl ester substituent could insulate the solvent sphere from the charge of the copper center by its weak donor properties. Hence, the reorganization of the solvent molecules during the electron transfer is reduced resulting in a lower solvent reorganization energy.
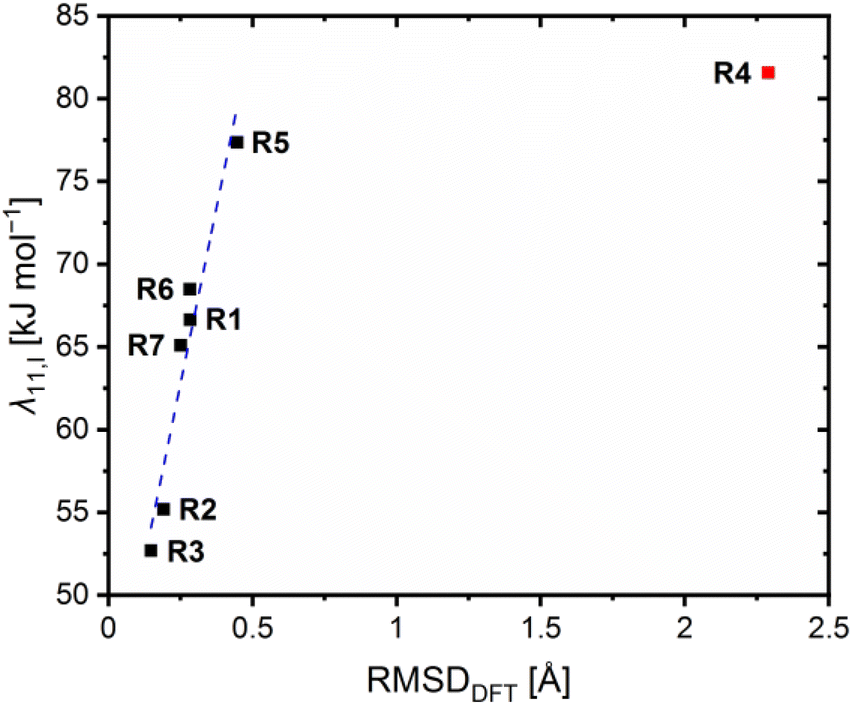
To further correlate the determined electron self-exchange rates, the internal, solvent and total reorganization energies λ11,I, λ11,S and λ11,T of R6 and R7 were calculated analogously to R1–R5 from the previous study (Table 6, necessary energy values provided in Table S10 in the ESI†).23 Previously, we observed that the internal reorganization energies λ11,I correlate with the structural similarity between the related Cu(I) and Cu(II) species of the redox couples and, therefore, with the RMSD values. For all previous redox couples except for R4, a linear correlation was found.23 The results of R6 and R7 fit into this linear correlation (Fig. 12). The internal and solvent reorganization energies λ11,I and λ11,S of R6 are similar to those of R1 and not decreased like those of R2. Hence, also the total reorganization energies λ11,T of R1 and R6 are similar which is in accordance with the similar electron self-exchange rates. This underlines again the negligible influence of the methyl substituent in the 4-position on R6 and the importance of the methyl substituent in the 2-position for the enhanced electron transfer properties of R2 indicated by the faster electron self-exchange rate k11 and lower total reorganization energy λ11,T compared to R1. The internal reorganization energy λ11,I of R7 is similar to those of R1 and R6 because the methyl ester substituent in the 4-position does not affect the structural similarity between the Cu(I) and Cu(II) complex significantly. Therefore, the methyl ester substituent in the 4-postion exerts no significant influence on the internal reorganization energy λ11,I of R7 compared to the methyl ester substituent in the 2-position in R4. Further, the position of the methyl ester substituent affects the influence on the solvent reorganization energy λ11,S. Whereas the methyl ester substituent in the 2-position reduces the solvent reorganization energy λ11,S of R4 significantly compared to R1, the influence of the methyl ester substituent in the 4-position on the solvent reorganization energy λ11,S of R7 is not that strong. This result underlines that the weak coordinative interactions between the methyl ester substituent and the copper center in R4 result in an insulation of the solvent sphere from the changing charge of the copper center during the electron transfer. Nevertheless, also the solvent reorganization energy λ11,S of R7 is decreased compared to R1 without any further coordinative interactions. The reason could be that the extended π system of the ligand in R7, caused by the methyl ester substituent, dampens the impact of the changing charge on the solvent sphere stronger than the smaller π system of the ligand in R1. In sum, R7 exhibits a lower total reorganization energy λ11,T than R4 with is in contrast to the higher electron self-exchange rate of R4 compared to R7. A reason could be that the internal and solvent reorganization energies do not contribute in the same way to the velocity of the electron transfer. Further, this emphasizes that although the calculated reorganization energies give important insights into the electron transfer properties, their influence should not be overestimated. They are based on theoretically calculated energy values like the theoretical redox potentials Etheo,DFT. In the case of the theoretical redox potentials, the good accuracy enables the estimation of the redox potential but not the exact determination. Hence, this circumstance also applies to the reorganization energies.
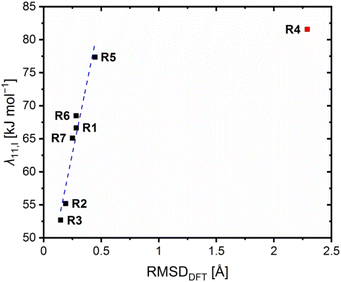 |
| | Fig. 12 Plot of the internal reorganization energies λ11,I against the calculated RMSD values of R1–R7 (blue correlation considers R1–R3, R5–R7, data point of R4 is marked in red due to the misfit to the linear correlation). | |
Table 6 Calculated internal, solvent and total reorganization energies λ11,I, λ11,S and λ11,T and calculated RMSD values of R1–R7 (values of R1–R5 from previous study21)
| |
λ
11,I [kJ mol−1] |
λ
11,S [kJ mol−1] |
λ
11,T [kJ mol−1] |
RMSDDFT [Å] |
| [Cu(TMGqu)2]+/2+ (R1) |
66.6 |
135.2 |
201.8 |
0.283 |
| [Cu(TMG2Mequ)2]+/2+ (R2) |
55.2 |
128.6 |
183.8 |
0.191 |
| [Cu(TMG2cHexqu)2]+/2+ (R3) |
52.7 |
110.7 |
163.3 |
0.147 |
| [Cu(TMG2Meequ)2]+/2+ (R4) |
81.6 |
123.5 |
205.1 |
2.289 |
| [Cu(TMG4NMe2qu)2]+/2+ (R5) |
77.4 |
128.2 |
205.6 |
0.446 |
| [Cu(TMG4Mequ)2]+/2+ (R6) |
68.5 |
132.9 |
201.4 |
0.282 |
| [Cu(TMG4Meequ)2]+/2+ (R7) |
65.1 |
129.2 |
194.2 |
0.250 |
Conclusions
In this study, two novel guanidine quinoline ligands with a methyl or methyl ester substituent in the 4-position were synthesized to analyze the importance of the position on the substituent influence compared to the ligands with a methyl or methyl ester substituent in the 2-position. The related novel Cu(I) and Cu(II) complexes C11–C14 were synthesized and structurally investigated by XRD and DFT calculations, indicating that the 2-position is crucial for the significant substituent influence on the structures of C3, C4, C7 and C8 (Fig. 13). In addition, the donor properties of the ligands were examined by NBO calculations, revealing opposite substituent influences depending on the position. The different substituent influences on the complex structures and ligand donor properties are reflected in the redox potentials of the copper complex redox couples R2, R4, R6 and R7 and therefore, in the electrochemical stabilization (Fig. 13). In consideration of the redox potentials and DFT results of R1–R7, an easy method for the estimation of the redox potential with a good accuracy was demonstrated. Finally, the determination of the electron self-exchange rates and reorganization energies of R6 and R7 and the comparison with R2 and R4 indicated that also the electron transfer properties depend significantly on the substituent position (as summarized in Fig. 13). Only the substituents in the 2-position, which affect the structure of the complexes, exert a strong and enhancing influence on the electron transfer properties, whereas the pure electronic influence of substituents in the 4-position is negligible. Overall, the results demonstrate the importance of the position on the substituent influence affecting several properties of the copper complexes and give new crucial insights into the targeted design of better entatic state models.
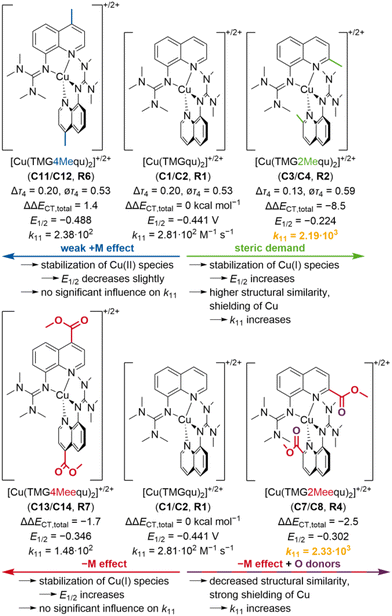 |
| | Fig. 13 Summary of the substituent influences on the properties of the copper complex redox couples R2, R4, R6 and R7 compared to R1 (substituents and initial effects are marked in the same color; two highest electron self-exchange rates are marked in orange; units are only given for R1; redox potentials E12vs. Fc/Fc+; Δτ4 and ∅τ4 parameters, redox potentials E12 and electron self-exchange rates k11 of R1, R2 and R4 from previous study21). | |
Data availability
All synthetic details are described in the ESI.† Additional information on the synthesis of the target compounds and original analysis data files are available in the Chemotion repository (for corresponding links see the ESI†).
Author contributions
J. H. and A. K. synthesized the ligands and complexes. They performed and evaluated the CV, NMR, IR, UV/Vis measurements. Further, they evaluated the MS measurements. J. H. performed the stopped-flow UV/Vis spectroscopic measurements and fluorescence spectroscopic measurements and determined the electron self-exchange rates. Furthermore, J. H. and A. K. executed and evaluated the DFT calculations. J. H. executed and evaluated the CREST and DLPNO-CCSD(T) calculations. J. H. determined the reorganization energies applying the Nelsen's four-point method. A. H. checked and finalized the crystallographic data. J. H., A. H. and S. H.-P. wrote the manuscript. S. H.-P. supervised the project.
Conflicts of interest
There are no conflicts to declare.
Acknowledgements
S. H.-P. acknowledge financial support by the Deutsche Forschungsgemeinschaft (DFG, 413524714). We thank the Regional Computing Center of the University of Cologne (RRZK) for providing computing time on the DFG-funded High Performance Computing (HPC) system CHEOPS as well as support.
References
-
(a) W. Kaim and J. Rall, Angew. Chem., Int. Ed. Engl., 1996, 35, 43 (
Angew. Chem.
, 1996
, 108
, 47
) CrossRef CAS;
(b) I. A. Koval, P. Gamez, C. Belle, K. Selmeczi and J. Reedijk, Chem. Soc. Rev., 2006, 35, 814 RSC;
(c)
R. L. Peterson, S. Kim and K. D. Karlin, in Comprehensive inorganic chemistry II, ed. J. Reedijk and K. R. Poeppelmeier, Elsevier, Amsterdam, 2013, pp. 149–177 Search PubMed;
(d) E. I. Solomon, D. E. Heppner, E. M. Johnston, J. W. Ginsbach, J. Cirera, M. Qayyum, M. T. Kieber-Emmons, C. H. Kjaergaard, R. G. Hadt and L. Tian, Chem. Rev., 2014, 114, 3659 CrossRef CAS PubMed.
- J. Liu, S. Chakraborty, P. Hosseinzadeh, Y. Yu, S. Tian, I. Petrik, A. Bhagi and Y. Lu, Chem. Rev., 2014, 114, 4366 CrossRef CAS PubMed.
-
(a) S. Dahlin, B. Reinhammar and M. T. Wilson, Biochem. J., 1984, 218, 609 CrossRef CAS PubMed;
(b) F. A. Armstrong, P. C. Driscoll, H. Allen and O. Hill, FEBS Lett., 1985, 190, 242 CrossRef CAS;
(c) A. Lommen and G. W. Canters, J. Biol. Chem., 1990, 265, 2768 CrossRef CAS PubMed;
(d) C. Dennison, Coord. Chem. Rev., 2005, 249, 3025 CrossRef CAS;
(e) K. Sato, T. Kohzuma and C. Dennison, J. Am. Chem. Soc., 2003, 125, 2101 CrossRef CAS PubMed.
- B. L. Vallee and R. J. Williams, Proc. Natl. Acad. Sci. U. S. A., 1968, 59, 498 CrossRef CAS PubMed.
- R. J. Williams, Eur. J. Biochem., 1995, 234, 363 CrossRef CAS PubMed.
- P. Comba, Coord. Chem. Rev., 2000, 200–202, 217 CrossRef CAS.
- J. Stanek, A. Hoffmann and S. Herres-Pawlis, Coord. Chem. Rev., 2018, 365, 103 CrossRef CAS.
- W. R. Hagen, Metallomics, 2019, 11, 1768 CrossRef CAS PubMed.
- R. Lumry and H. Eyring, J. Phys. Chem., 1954, 58, 110 CrossRef CAS.
-
(a)
J. M. Berg, J. L. Tymoczko, G. J. Gatto and L. Stryer, Biochemistry, Macmillan International Higher Eduction, New York, 2019 Search PubMed;
(b) J. A. Yankeelov and D. E. Koshland, J. Biol. Chem., 1965, 240, 1593 CrossRef CAS PubMed;
(c) W. W. Cleland, Acc. Chem. Res., 1975, 8, 145 CrossRef CAS.
-
(a) B. Karlsson, R. Aasa, B. G. Malmström and L. G. Lundberg, FEBS Lett., 1989, 253, 99 CrossRef CAS;
(b) B. G. Malmström, Biol. Met., 1990, 3, 64 CrossRef;
(c) B. G. Malmström, Eur. J. Biochem., 1994, 223, 711 CrossRef PubMed.
- G. Chaka, J. L. Sonnenberg, H. B. Schlegel, M. J. Heeg, G. Jaeger, T. J. Nelson, L. A. Ochrymowycz and D. B. Rorabacher, J. Am. Chem. Soc., 2007, 129, 5217 CrossRef CAS PubMed.
- P. Comba and W. Schiek, Coord. Chem. Rev., 2003, 238–239, 21 CrossRef CAS.
- E. Falcone and C. Hureau, Chem. Soc. Rev., 2023, 52, 6595 RSC.
-
(a) A. Das, C. Hessin, Y. Ren and M. Desage-El Murr, Chem. Soc. Rev., 2020, 49, 8840 RSC;
(b) L. Garcia, F. Cisnetti, N. Gillet, R. Guillot, M. Aumont-Nicaise, J.-P. Piquemal, M. Desmadril, F. Lambert and C. Policar, J. Am. Chem. Soc., 2015, 137, 1141 CrossRef CAS PubMed;
(c) D. Coquière, A. de La Lande, S. Martí, O. Parisel, T. Prangé and O. Reinaud, Proc. Natl. Acad. Sci. U. S. A., 2009, 106, 10449 CrossRef PubMed;
(d) N. Le Poul, M. Campion, G. Izzet, B. Douziech, O. Reinaud and Y. Le Mest, J. Am. Chem. Soc., 2005, 127, 5280 CrossRef CAS PubMed;
(e) S. Warzeska and R. Krämer, Chem. Commun., 1996, 52, 499 RSC;
(f) Y. Ren, J. Forté, K. Cheaib, N. Vanthuyne, L. Fensterbank, H. Vezin, M. Orio, S. Blanchard and M. Desage-El Murr, iScience, 2020, 23, 100955 CrossRef CAS PubMed;
(g) P. J. Griffin, B. J. Charette, J. H. Burke, J. Vura-Weis, R. D. Schaller, D. J. Gosztola and L. Olshansky, J. Am. Chem. Soc., 2022, 144, 12116 CrossRef CAS PubMed;
(h) J. Vallejo, E. Pardo, M. Viciano-Chumillas, I. Castro, P. Amorós, M. Déniz, C. Ruiz-Pérez, C. Yuste-Vivas, J. Krzystek, M. Julve, F. Lloret and J. Cano, Chem. Sci., 2017, 8, 3694 RSC.
-
(a) B. Xie, T. Elder, L. J. Wilson and D. M. Stanbury, Inorg. Chem., 1999, 38, 12 CrossRef CAS;
(b) B. Xie, L. J. Wilson and D. M. Stanbury, Inorg. Chem., 2001, 40, 3606 CrossRef CAS PubMed.
- P. Comba, M. Kerscher and A. Roodt, Eur. J. Inorg. Chem., 2004, 2004, 4640 CrossRef.
- E. W. Dahl and N. K. Szymczak, Angew. Chem., Int. Ed., 2016, 55, 3101 (
Angew. Chem.
, 2016
, 128
, 3153
) CrossRef CAS PubMed.
- A. Hoffmann, S. Binder, A. Jesser, R. Haase, U. Flörke, M. Gnida, M. Salomone Stagni, W. Meyer-Klaucke, B. Lebsanft, L. E. Grünig, S. Schneider, M. Hashemi, A. Goos, A. Wetzel, M. Rübhausen and S. Herres-Pawlis, Angew. Chem., Int. Ed., 2014, 53, 299 (
Angew. Chem.
, 2014
, 126
, 305
) CrossRef CAS PubMed.
- A. Hoffmann, J. Stanek, B. Dicke, L. Peters, B. Grimm-Lebsanft, A. Wetzel, A. Jesser, M. Bauer, M. Gnida, W. Meyer-Klaucke, M. Rübhausen and S. Herres-Pawlis, Eur. J. Inorg. Chem., 2016, 2016, 4731 CrossRef CAS.
- J. Stanek, N. Sackers, F. Fink, M. Paul, L. Peters, R. Grunzke, A. Hoffmann and S. Herres-Pawlis, Chem. – Eur. J., 2017, 23, 15738 CrossRef CAS PubMed.
- J. Stanek, M. Konrad, J. Mannsperger, A. Hoffmann and S. Herres-Pawlis, Eur. J. Inorg. Chem., 2018, 2018, 4997 CrossRef CAS.
- J. Heck, F. Metz, S. Buchenau, M. Teubner, B. Grimm-Lebsanft, T. P. Spaniol, A. Hoffmann, M. A. Rübhausen and S. Herres-Pawlis, Chem. Sci., 2022, 13, 8274 RSC.
-
(a) O. H. Johnson and C. S. Hamilton, J. Am. Chem. Soc., 1941, 63, 2864 CrossRef CAS;
(b) S. Lutun, E. Guichard, B. Hasiak and D. Couturier, Synth. Commun., 1999, 29, 175 CrossRef CAS;
(c) H. Chen, P. Li, M. Wang and L. Wang, Eur. J. Org. Chem., 2018, 2018, 2091 CrossRef CAS.
- T. Rösener, A. Hoffmann and S. Herres-Pawlis, Eur. J. Inorg. Chem., 2018, 2018, 3164 CrossRef.
-
(a) W. Kantlehner, E. Haug, W. W. Mergen, P. Speh, T. Maier, J. J. Kapassakalidis, H.-J. Bräuner and H. Hagen, Liebigs Ann. Chem., 1984, 1984, 108 CrossRef;
(b) S. Herres-Pawlis, A. Neuba, O. Seewald, T. Seshadri, H. Egold, U. Flörke and G. Henkel, Eur. J. Org. Chem., 2005, 4879 CrossRef CAS.
- J. Tao, J. P. Perdew, V. N. Staroverov and G. E. Scuseria, Phys. Rev. Lett., 2003, 91, 146401 CrossRef PubMed.
- V. N. Staroverov, G. E. Scuseria, J. Tao and J. P. Perdew, J. Chem. Phys., 2003, 119, 12129 CrossRef CAS.
- A. Schäfer, C. Huber and R. Ahlrichs, J. Chem. Phys., 1994, 100, 5829 CrossRef.
- K. Eichkorn, F. Weigend, O. Treutler and R. Ahlrichs, Theor. Chem. Acc., 1997, 97, 119 Search PubMed.
- F. Weigend and R. Ahlrichs, Phys. Chem. Chem. Phys., 2005, 7, 3297 RSC.
- S. Grimme, S. Ehrlich and L. Goerigk, J. Comput. Chem., 2011, 32, 1456 CrossRef CAS PubMed.
- L. Goerigk and S. Grimme, Phys. Chem. Chem. Phys., 2011, 13, 6670 RSC.
- A. Hoffmann, R. Grunzke and S. Herres-Pawlis, J. Comput. Chem., 2014, 35, 1943 CrossRef CAS PubMed.
- A. Hoffmann, M. Rohrmüller, A. Jesser, I. dos Santos Vieira, W. G. Schmidt and S. Herres-Pawlis, J. Comput. Chem., 2014, 35, 2146 CrossRef CAS PubMed.
-
(a) A. Jesser, M. Rohrmüller, W. G. Schmidt and S. Herres-Pawlis, J. Comput. Chem., 2014, 35, 1 CrossRef CAS PubMed;
(b) M. Rohrmüller, S. Herres-Pawlis, M. Witte and W. G. Schmidt, J. Comput. Chem., 2013, 34, 1035 CrossRef PubMed;
(c) M. Rohrmüller, A. Hoffmann, C. Thierfelder, S. Herres-Pawlis and W. G. Schmidt, J. Comput. Chem., 2015, 36, 1672 CrossRef PubMed.
- T. Rösener, O. Bienemann, K. Sigl, N. Schopp, F. Schnitter, U. Flörke, A. Hoffmann, A. Döring, D. Kuckling and S. Herres-Pawlis, Chem. – Eur. J., 2016, 22, 13550 CrossRef PubMed.
- P. Liebhäuser, K. Keisers, A. Hoffmann, T. Schnappinger, I. Sommer, A. Thoma, C. Wilfer, R. Schoch, K. Stührenberg, M. Bauer, M. Dürr, I. Ivanović-Burmazović and S. Herres-Pawlis, Chem. – Eur. J., 2017, 23, 12171 CrossRef PubMed.
- L. Yang, D. R. Powell and R. P. Houser, Dalton Trans., 2007, 955 RSC.
- A. Wagner and H.-J. Himmel, J. Chem. Inf. Model., 2017, 57, 428 CrossRef CAS PubMed.
- L. Raßpe-Lange, A. Hoffmann, C. Gertig, J. Heck, K. Leonhard and S. Herres-Pawlis, J. Comput. Chem., 2023, 44, 319 CrossRef PubMed.
- L. Yan, Y. Lu and X. Li, Phys. Chem. Chem. Phys., 2016, 18, 5529 RSC.
-
(a) R. A. Marcus, Pure Appl. Chem., 1997, 69, 13 CrossRef CAS;
(b) R. A. Marcus, Angew. Chem., Int. Ed. Engl., 1993, 32, 1111 (
Angew. Chem.
, 1993
, 105
, 1161
) CrossRef;
(c) R. A. Marcus and N. Sutin, Biochim. Biophys. Acta, Rev. Bioenerg., 1985, 811, 265 CrossRef CAS.
- B. C. Dunn, L. A. Ochrymowycz and D. B. Rorabacher, Inorg. Chem., 1995, 34, 1954 CrossRef CAS.
Footnote |
| † Electronic supplementary information (ESI) available: Experimental data of the methods and details of the synthesis with characterization (NMR and IR spectroscopy and mass spectrometry), crystallographic information, UV/Vis-spectra, CVs and stopped-flow UV/Vis spectra, DFT details, NMR spectra, additional plots and further discussions. CCDC 2358203–2358207. For ESI and crystallographic data in CIF or other electronic format see DOI: https://doi.org/10.1039/d4dt01539h |
|
| This journal is © The Royal Society of Chemistry 2024 |
Click here to see how this site uses Cookies. View our privacy policy here. 
 Open Access Article
 This Open Access Article is licensed under a
  ,
Anastasia
Kucenko
,
Anastasia
Kucenko


 .29
b The comparability of this value is limited due to the 4 + 2 coordination motif.
c The weakly coordinating triflate is not considered.
.29
b The comparability of this value is limited due to the 4 + 2 coordination motif.
c The weakly coordinating triflate is not considered.