 Open Access Article
Ruthenium nitrosyl complexes with NO release capability: the use of fluorene as an antenna†
Vladyslav
Mudrak
 ac,
Pascal G.
Lacroix
 *a,
Marine
Tassé
a,
Sonia
Mallet-Ladeira
ab,
Alexander
Roshal
 *c and
Isabelle
Malfant
 *a
*a
aLaboratoire de Chimie de Coordination du CNRS, 205 Route de Narbonne, F-31077 Toulouse, France. E-mail: pascal.lacroix@lcc-toulouse.fr
bInstitut de Chimie de Toulouse (ICT, UAR 2599), 118 Route de Narbonne, 31062 Toulouse Cedex 09, France
cInstitute of Chemistry at V.N. Karazin Kharkiv National University, 4 Svobody sqr., Kharkov 61022, Ukraine
First published on 17th May 2024
Abstract
A ruthenium nitrosyl complex of formula [RuII(fluorene(C6)CH2O-terpy)(bipy)(NO)]3+ (AC) in which fluorene(C6) is the 9,9-dihexylfluorene, terpy the 2,2′;6′,2′′-terpyridine, and bipy the 2,2′-bipyridine is presented with its related [RuII(MeO-terpy)(bipy)(NO)]3+ (C) and 9,9-dihexylfluorene 2-hydroxymethylfluorene (A) building blocks. The reference complex C undergoes NO release capabilities under irradiation at λ = 365 nm. The effect of the introduction of the fluorescent A antenna within the resulting AC complex is discussed both experimentally and theoretically. The importance of the encaging parameter defined as ϕAC·IAC, in which IAC is the quantity of light absorbed by AC and ϕAC the quantum yield of NO release is evidenced and found to be concentration dependent. The conditions of optimization of the antenna approach to maximize ϕAC·IAC are discussed. The crystal structure of [RuII(fluorene(C6)CH2O-terpy)(bipy)(NO2)](PF6), the last intermediate in the synthesis of AC is also presented.
1. Introduction
The last two decades have witnessed a growing interest for exogenous nitric oxide (NO˙) donors in relation to the gradual recognition of the numerous biological roles devoted to the radical NO˙.1–5 Among them, ruthenium–nitrosyl (Ru–NO) complexes appear especially appealing due to their high design flexibility, generally good stability in solution and furthermore their capability of releasing NO˙ under irradiation exclusively, taking advantage of the noninvasive character of light.6–13 These species undergo the following photoreaction: | (1) |
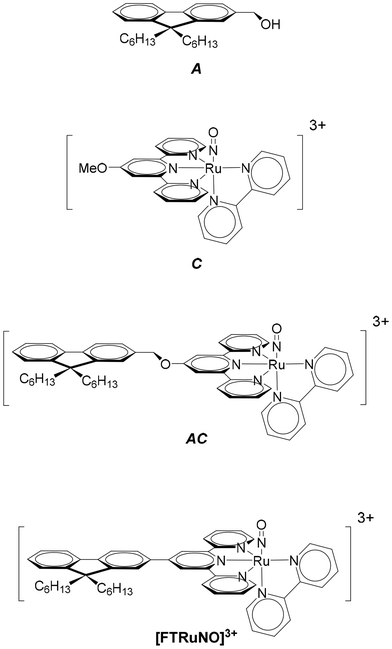
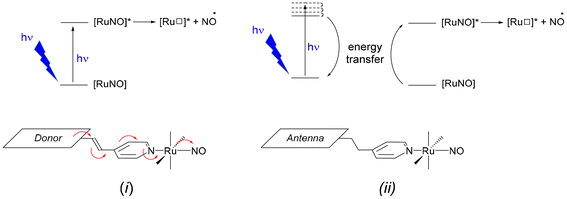
In the starting complex, NO is present as the nitrosonium cation NO+, while the photo-released species is invariably the radical NO˙. This observation suggests that an electron-donor ligand L could favor a large charge transfer towards the withdrawing nitrosyl ligand, and hence enhance the efficiency of the release depicted in eqn (1). Following this idea, we have reported on various ruthenium–nitrosyl complexes built up from the ancillary fluorenylterpyridine ligand which contains the electron-rich fluorene fragment, introduced to bring a “push–pull” electronic character to the resulting Ru–NO complex, denoted [FTRuNO]3+ in Chart 1.14–16
Beside this general push–pull approach, an alternative strategy is based on the use of antennas which could first absorb, then induce the NO˙ release by energy transfer to the Ru–NO units. The use of antennas for drug delivery has been addressed in the literature.17–25 An antenna refers to a fluorescent fragment of the ligand in which both ground and excited state electron densities are located (the donor), without any electronic contribution of the rest of the complex (the acceptor). After photon absorption by the antenna, an energy transfer occurs to the acceptor, followed by the desirable electronic effect. Both strategies are illustrated in Scheme 1. To date, few investigations have been reported on iron-nitrosyl complexes, in which antennas were grafted.26–29 Nevertheless, and to the best of our knowledge, it was never employed for Ru–NO species.
In a continuous effort aiming at extending the scope of application of fluorene-based Ru–NO complexes, we wish to report here on a new complex AC in which the Ru–NO complex C is linked to a fluorene unit A. The three compounds are shown in chart 1. Contrary to the situation encountered in the push–pull complex [FTRuNO]3+, A is not π-conjugated with the Ru–NO fragment in AC, but can be used as an antenna, capable to collect photons, and finally enhance the NO˙ release efficiency of the reference complex C, by energy transfer. The organization of the manuscript is the following: theoretical aspects of the antenna approach are presented in a first section. Another section reports on our results as follows: (i) synthesis of the compounds under investigation; (ii) crystal structure of a ruthenium nitrite complex, intermediate step toward AC; (iii) optical properties with UV-visible spectra and fluorescence measurements; (iv) NO˙ release investigation. In a final section, the relevance of the antenna approach is discussed for these species.
2. Theoretical background
AC refers to a system built from two sub-units, a photochemically active core C, and a fluorescent antenna A, non-conjugated to C, but capable to transfer part of its energy to C, once promoted to the excited state (A*). We can define a quantum yield (ϕ) introduced to quantify the efficiency of a photo-induced event under investigation as follows: | (2) |
For isolated A or C species, ϕ is written ϕA (quantum yield of fluorescence of A) and ϕC (quantum yield of photoreaction of C). In the case of AC, the quantum yield ϕAC reflect the global efficiency of AC regarding the photochemical event (e.g. NO˙ release from Ru–NO complex). In this present case, the photochemical reaction within the AC species can occurs from two different routes as follows:
In route (a), a photon is directly absorbed by the C fragment of AC, while in route (b) it is first absorbed by the antenna, which undergoes an energy transfer to C. Nevertheless, ϕAC results from the sum of the NO˙ released from both route (a) and (b) divided by the sum of the photons absorbed by both electronically isolated A or C fragments. In the case of NO˙ release, eqn (2) becomes:
 | (3) |
In this equation, #NO(a) and #NO(b) are the number of NO˙ produced by route (a) and (b), respectively. #hνA and #hνC are the number of photons absorbed by the core C and the antenna A, respectively. Importantly, only a fraction (k) of the photons absorbed by the antenna leads to energy transfer to C. Then, eqn (3) can be written as follows:
 | (4) |
In this equation, (1−k)#hνA is the number of photos lost for the NO˙ release process. In the more favorable case, 100% of the photons absorbed by A lead to energy transfer to C and k = 1. In this case, ΦAC = ϕC. But more generally, the following fundamental inequality is observed:
| ϕAC < ϕC | (5) |
To further estimate the fraction k, one can express it as the product of the quantum yield of fluorescence of the antenna (ϕA) by the efficiency of the A → C energy transfer (EFRET), assuming a FRET mechanism, which is favored when long distances (≈10 Å) prohibit the direct orbital overlap between A and C.30 Therefore k must be written as follows:
| k = ϕA × EFRET | (6) |
From the reactions depicted in Scheme 2 and eqn (6), the total quantum yield of photorelease (ϕAC) appears as the sum of two components, Φroute A and Φroute B. The first one arising from the direct photon absorption by C can be expressed as follows:
 | (7) |
The second one, involving the antenna is expressed as follows:
 | (8) |
In these expressions, εA and εC are the molar extinction coefficients of A and C, respectively. Therefore,  and
and  denote the fraction of light absorbed by A and C, respectively.
The sum of (7) and (8) leads to the following expression of the total quantum yield of photorelease:
 | (9) |
Which can be simplifies as:
 | (10) |
Eqn (10) can be further completed, taking into account that (i) more than one antenna can be present in the complex and moreover (ii) the fact that the real efficiency of AC is not expressed by ϕAC, but is better described by the encaging parameter ϕAC·IAC, in which IAC is the quantity of light absorbed by AC. Following this approach, the encaging parameter depends on the absorbance of AC (AbsAC), which is the sum of the absorbance of the A (AbsA) and C (AbsC) fragments in AC. Then, the efficiency of the antenna becomes concentration dependent. Thus, the relative efficiency of the molecular device (EA) can be described by the ratio between the encaging parameters of AC and C. Taking into account the possibility of implying more than one identical antenna, it can be express as:
 | (11) |
 . The magnitude of the concentration-dependent relative EA efficiency, is illustrated in Fig. 1, which contains computations performed in various conditions, assuming εA = εC, n = 1 to 5, and ΦA·EFRET = 0.3,0.5,0.7, which correspond to realistic situations.
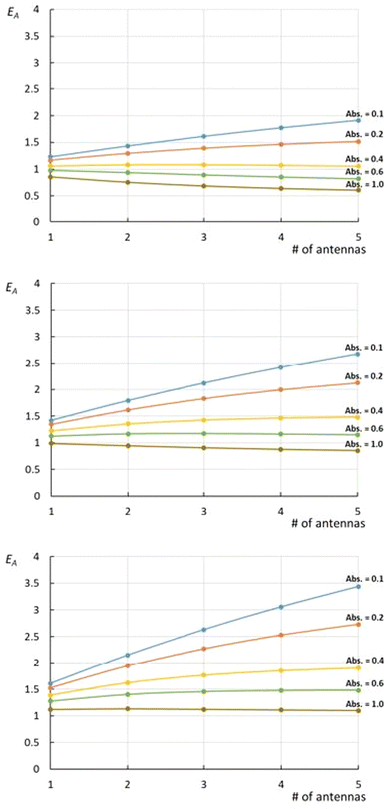 | ||
| Fig. 1 Relative efficiency EA (eqn (11)) expressed at various ΦA·EFRET values [0.3 (top), 0.5 (middle), and 0.7 (bottom)] for complexes bearing 1 to 5 antennas. On each graph, the curves are drawn at various of absorbance ranging from Abs. = 0.1 to 1.0, with the assumption that εA = εC. | ||
What immediately strikes from the examination of Fig. 1 is that increasing the number of antennas, does not necessarily imply that the relative efficiency of AC increases, due to the deleterious effect of modest energy transfer efficiencies (ΦA·EFRET), in some cases. Indeed, weak ΦA·EFRET values increases the loss of photons, when the number of antennas increases, thus decreasing the EA values. Additionally, the concentration-dependence of EA is confirmed with better values observed at low concentrations (low absorbance), where EA is roughly proportional to the number of antennas. This linearity arises from the fact that the absorption of photons grows linearly with the concentration at very low absorbance values, where  .
.
Additionally, the dependence of EA on absorbance is drawn in Fig. 2, for various values of ΦA·EFRET. It clearly shows that the relative efficiency of the device (EA > 1) requires a low absorbance.
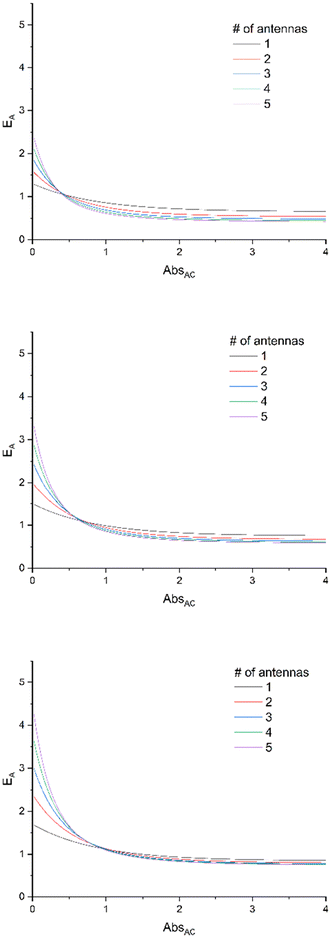 | ||
| Fig. 2 E A expressed at various ΦA·EFRET values [0.3 (top), 0.5 (middle), and 0.7 (bottom)] for complexes bearing 1 to 5 antennas, according to eqn (11), with the assumption that εA = εC. | ||
More precisely, the limit of eqn (11) at low concentration (c → 0) leads to the following equation:
 | (12) |
From this equation, representative EA values are shown in Table 1. The data gathered in the table reveal how important the ΦA·EFRET parameter is in the design of an efficient AC device.
| Φ A·EFRET | Number of antennas in the device | ||||
|---|---|---|---|---|---|
| 1 | 2 | 3 | 4 | 5 | |
| 0.3 | 1.3 | 1.6 | 1.9 | 2.2 | 2.5 |
| 0.5 | 1.5 | 2.0 | 2.5 | 3.0 | 3.5 |
| 0.7 | 1.7 | 2.4 | 3.1 | 3.8 | 4.5 |
In eqn (11), the ε and Φ parameters are easily available by standard UV-visible investigations and NO˙ release measurements. The estimation of EFRET can be expressed as follows:31
 | (13) |
In this expression, R is the distance between the donor (fluorene) and the acceptor (RuNO), evaluated around ≈9.5 Å in the present AC complex (vide infra), and a is the number of donors (a = 1 in the present investigation). R0 is the Förster radius, F and τ are the intensity and the lifetime of fluorescence of A and AC. F and τ are readily available by fluorescence experiment. By contrast, R0 depends on various factors (spectral overlap integral between the emission of A and the absorption of C, orientational factor between the emission transition moment of A and the absorption transition moment of C, refractive index of the medium),31 and it can hardly be estimated very precisely.32 Nevertheless, R0 values vary significantly depending on the donor/acceptor couple and the nature of the linker. Among representative references: 20–60 Å,33 10–100 Å,34 50–60 Å.35 It is important to point out that, for distances R shorter than R0, EFRET quickly converges to 1. For instance, R/R0 = 0.6 leads to EFRET = 0.95 while R/R0 = 0.47 leads to EFRET = 0.99.
3. Results and discussion
3.1. Synthesis and characterization
The first report of a Ruthenium-nitrosyl complex containing the terpyridine ligand is that of [RuCl2(NO)(terpy)]+.36 It was first reported to undergo a Ru–NO ↔ Ru–ON photoisomerization in solid state,37 then to lead to NO˙ photorelease under irradiation.38 The modulations of the electronic properties of such complex are readily accessible by introducing substituents of various donor/acceptor capabilities on the central pyridine of the terpyridine unit.39 In the context of the push–pull strategy towards efficient NO˙ release ((i) in Scheme 1), we have investigated various substituents π-conjugated to the terpyridine.40–43 By contrast, the synthetic procedures afferent to the antenna strategy ((ii) in Scheme 1) require non-conjugated substituents and therefore, have to be completely reconsidered.Fluorene appears to be a good candidate as an A antenna. Indeed, it fulfills two important requirements while incorporated in the present AC system: (i) the fact that A must be fluorescent (in solid state, it forms white crystals with violet fluorescence, from which its name was derived); and (ii) a significant overlap between its emission spectrum and the absorption spectrum of C (Scheme 1 (ii)) is observed, otherwise no A → C energy transfer could take place.
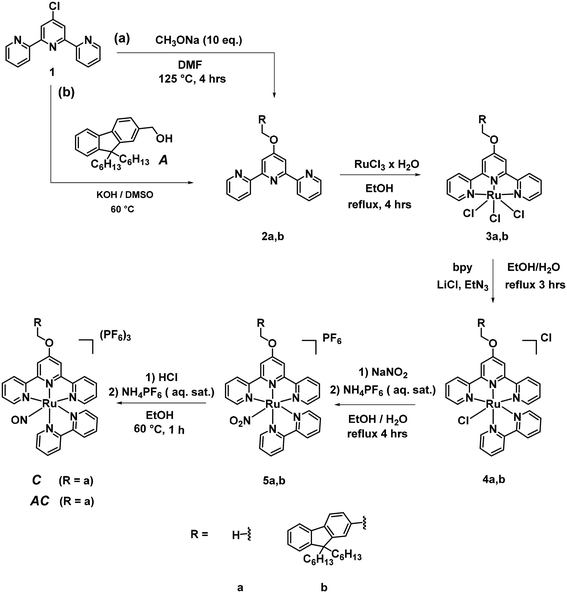
The general synthetic route towards A, C, and AC is shown in Scheme 3. An ether was selected as the non-conjugated linkage between A and C in the AC complex. Its synthesis is based on a condensation between a 4-chloropyridine and an alcohol, in alkaline medium (“superbasic” medium in the case of 2b).44 The resulting A antenna, in which the electronically neutral –CH2OH substituent is present is expected to exhibit similar fluorescent properties than those of the parent non-substituted fluorene.45 By contrast, introducing an oxygen in the 4′-position of the terpyridine may slightly enhance the ligand → Ru–NO charge transfer, nevertheless with the possible outcome of a better NO˙ release efficiency in agreement with the push–pull strategy. A short linker (–CH2–O–) was chosen with the expectation that the value of EFRET will be close to 1, which is necessary for the efficient energy transfer according to eqn (13).
The synthesis of A is readily was achieved as previously reported in the literature.46 Its purity was carefully checked by NMR, HRMS and CHN analysis, prior to any optical investigation. C and AC require a synthesis in 5 steps. In the route towards C, the ligand 2a was obtained as previously published,47 as were the intermediate complexes 3a and 4a.48 Finally, the sequential synthesis of 5a and C was achieved by the well-known methodology previously applies in our group.41,49 In the route towards AC, an aromatic nucleophilic substitution reaction of 1b with 4′-chloro-2,2′:6′,2′′-terpyridine in “superbasic” medium (KOH/DMSO) was performed to get the ligand 2b in a good yield. The procedures used to get the final AC complex are then the same as those described for the complexes of a-series. Great care has to be taken in the purification of 4b by column chromatography where a reduced amount of Al2O3 must be used in order not to lose a large part of the crude compounds with the concomitant deleterious effect on the yield. The compounds were all characterized with 1H NMR, 13C NMR, HRMS methods. The NMR spectra are provided in ESI.†
3.2. Crystal structure of 5b
The difficulties encountered in the growth of single crystals suitable for crystal structure determination encouraged us to try to use any ruthenium complexes available in order to investigate the relative orientation of the fluorene moieties with respect to the π-electronic structure of the terpyridine ligand. In this context, we succeeded to obtain single crystals of the ruthenium nitrite precursor, last step towards AC. The compound crystallizes in the P21/n monoclinic space group, in which four complexes are present in the crystal unit cell. The main crystal data are gathered in Table 2. The crystal unit cell is shown in Fig. 3. The presence of a single PF6− anion, indicates that the ruthenium atom is in the +II oxidation state, which was invariably the case in Ru(terpy)(bipy) complexes previously investigated in our group.14–16,41,49–51 In the substituted terpyridine ligand, the fluorenyl unit is planar with largest distance to the mean plane equal to 0.028 Å at C38. Similarly, the terpyridine unit is nearly planar with largest distance to the mean plane equal to 0.048 Å at C1. The distance between the ruthenium atom and the centroid of the π-core of the first fluorene ring (6 carbon atoms) is equal to ≈9.540 Å, which provides an idea of the value of the Förster distance (R) in AC.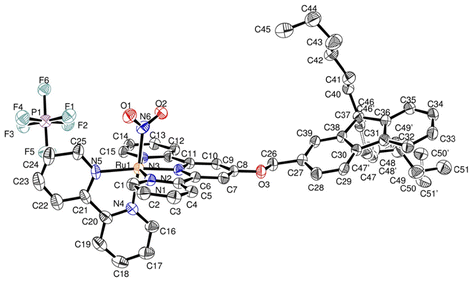 | ||
| Fig. 3 Asymmetric unit of [FCH2OTRu(NO2)](PF6) with atom labeling scheme. Hydrogens are omitted for clarity. | ||
| Chemical formula | C51H53N6O3Ru, PF6 |
| Formula weight (M) | 1044.03 |
| Unit-cell dimensions | a = 13.2505(2) Å |
| b = 11.0878(2) Å | |
| c = 32.1285(4) Å | |
| α = 90° | |
| β = 92.6550(10)° | |
| γ = 90° | |
| Volume (Å3) | 4715.22(13) |
| Temperature (K) | 100(2) |
| Crystal system | Monoclinic |
| Space group | P21/n |
| Z | 4 |
| Reflections measured | 76![[thin space (1/6-em)]](https://www.rsc.org/images/entities/char_2009.gif) 605 605 |
| Reflections unique | 10![[thin space (1/6-em)]](https://www.rsc.org/images/entities/char_2009.gif) 112 [R(int) = 0.0659] 112 [R(int) = 0.0659] |
| Final R indices [I > 2σ(I)] | R 1 = 0.0520, wR2 = 0.1325 |
| R indices (all data) | R 1 = 0.0702, wR2 = 0.1428 |
Importantly, the torsion angle between fluorene and terpyridine is equal to 33.9°. As pointed out in the introduction section, the relative orientation of the antenna with respect to the complex is an important parameter, when the possibility of energy transfer has to be considered. To clarify this issue, AC has been optimized by DFT. It turns out that the ground state conformation is that having the fluorenyl and the terpyridine plans roughly orthogonal. It will subsequently be denoted AC⊥ in the next section. Similarly, the excited state conformation is that having the fluorenyl and the terpyridine plans roughly parallel, and will be denoted AC‖. Interestingly, the fluorene-ruthenium Förster distance (R) in the computed structures is found equal to 9.632 Å and 9.678 Å, for AC⊥ and AC‖, respectively. Therefore, the effect of the rotation is negligible on R. Furthermore, the rotation of the fluorene reveals an energy barrier of 1.4 kcal mol−1 (see ESI†), roughly the half of the 3 kcal mol−1 found in the CC rotation of ethane.52 This low value indicates a nearly free rotation of fluorene. The experimental torsional frequency is around 290 cm−1 in alkyl chains,53 which corresponds to rotation motions achieved in about 0.1 ps. Within typical lifetimes of fluorescence of several nanoseconds for fluorene derivatives (vide infra), optimized energy transfers cannot be hampered by conformational effects in AC.
3.3. Optical properties
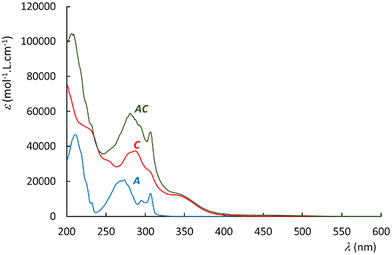
The UV-visible spectra recorded in acetonitrile are shown in Fig. 4 for A, C, and AC. The reference complex C exhibits a large band around 350 nm, and a more intense band in the range of 275–325 nm. The spectrum of the antenna A reveals electronic transitions around 300 nm, and 275 nm. Interestingly, the spectrum of AC appears to be roughly the sum of those of A and C, which may suggest that both A and C units keep their individual spectral properties in AC. In particular, no new push–pull transition arising from the electron rich A fragment towards the withdrawing Ru–NO complex is evidenced in AC. These observations have been supported computationally by DFT.The time dependent DFT transitions are listed in Table 3. The comparison of the experimental and computed data shows a general tendency for red-shifted transitions in the computed data versus experiment. More precisely, the agreement which appears satisfactory for the Ru–NO complexes at the low energy band is more questionable in the antenna (λDFT = 261 nm, λUV-vis = 300 nm) and corresponds to 5000 cm−1, a rather large difference for organic molecules.54 However, the CAM-B3LYP hybrid functional is employed here for consistency with our numerous computations performed on terpyRuNO-based chromophores. CAM-B3LYP is a powerful method for electronic system with long range charge transfer effect. By contrast, the pseudo centro-symmetric π-electronic structure of A is better described by the more traditional B3LYP method. In this case, the absorption maximum is found equal to 276 nm (Table 3), which leads to an energy difference of 2900 cm−1versus the experiment. The resulting discrepancy is significant, but still acceptable.54
| Compound | DFT method | transition | λ max (f) | Compositiona | Character |
|---|---|---|---|---|---|
| a Orbital 60(61) is the HOMO(LUMO) in A, 124(125) is the HOMO(LUMO) in C, 175(176) is the HOMO(LUMO) in AC. | |||||
| A | CAM-B3LYP | 1 → 2 | 261 nm (0.540) | 89% 60 → 61 | Fluorene → fluorene |
| B3LYP | 1 → 2 | 276 nm (0.535) | 90% 60 → 61 | Fluorene → fluorene | |
| C | CAM-B3LYP | 1 → 7 | 335 nm (0.044) | 67% 124 → 125 | Terpy → RuNO |
| 1 → 8 | 330 nm (0.028) | 76% 124 → 126 | Terpy → RuNO | ||
| 1 → 9 | 321 nm (0.038) | 71% 123 → 126 | Bipy → RuNO | ||
| AC ⊥ | CAM-B3LYP | 1 → 9 | 335 nm (0.045) | 70% 172 → 176 | Terpy → RuNO |
| 1 → 10 | 330 nm (0.040) | 78% 172 → 177 | Terpy → RuNO | ||
| 1 → 11 | 320 nm (0.036) | 78% 171 → 177 | Bipy → RuNO | ||
| ⋯ | |||||
| 1 → 26 | 264 nm (0.888) | 79% 175 → 187 | Fluorene → fluorene | ||
| AC ‖ | CAM-B3LYP | 1 → 9 | 335 nm (0.047) | 64% 172 → 176 | Terpy → RuNO |
| 1 → 10 | 329 nm (0.038) | 69% 172 → 177 | Terpy → RuNO | ||
| 1 → 11 | 320 nm (0.036) | 86% 171 → 177 | Bipy → RuNO | ||
| ⋯ | |||||
| 1 → 27 | 261 nm (0.880) | 73% 175 → 187 | Fluorene → fluorene | ||
The examination of the data gathered in Table 3 indicates that the UV-visible spectrum of AC arises from the sum of those of A and C. It confirms that A is not engaged in charge transfer transition towards C, which is expected from an antenna. The orbital of interest indicated in Table 3 are visualized in Fig. 5. It clearly appears that both A and C fragment keep their character in the resulting AC complex. Consequently, the possibility for the energy collected by A (blue arrows in Fig. 5) to be transferred to C (red arrows) can be investigated by fluorescence in the next section.
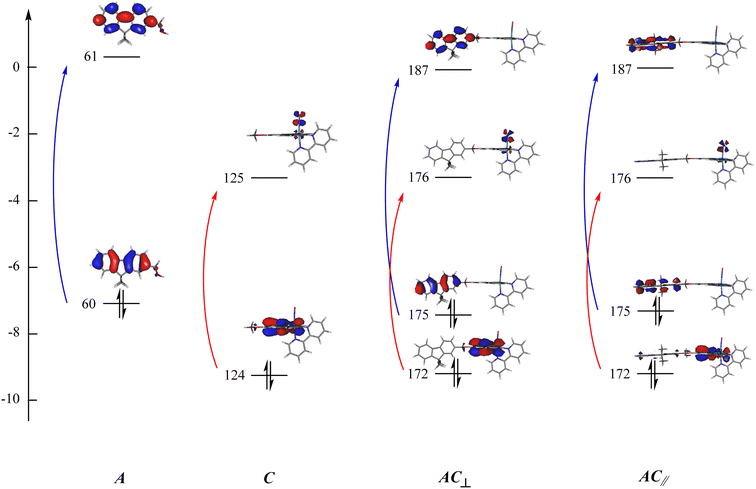 | ||
| Fig. 5 Orbitals of interest in the electronic transitions of A, C, and AC. The orbitals are numbered according to Table 3: (blue) transitions restricted to the antenna; (red) transitions centered on the complex. Orbitals 60(61), 124(125), 175(176) are the HOMO(LUMO) in A, C, and AC, respectively. | ||
Fluorescence is a prerequisite for an antenna, when the possibility of energy transfer has to be considered. The quenching of fluorescence then becomes a means for measuring the efficiency of the energy transfer between the donor (A) and the acceptor (C). Thus, eqn (12) relates the decrease of intensity and lifetime of the fluorescent species A embedded in the resulting complex AC to EFRET. Firstly, the absolute quantum yield and the lifetime of fluorescence of A were measured in acetonitrile. They are equal to 0.387 and 3.6 ns respectively. However, due to low intensity of the fluorescence of AC, it was impossible to measure the absolute quantum yield of AC on our equipment (Quantaurus QY), to estimate its value. Three experiments were carried out at constant concentration: (i) the fluorescence of A, (ii) the fluorescence of A in the presence of an equivalent amount of C, and (iii) the fluorescence of A, once chemically linked to C within the resulting AC species. The results are presented in Fig. 6.
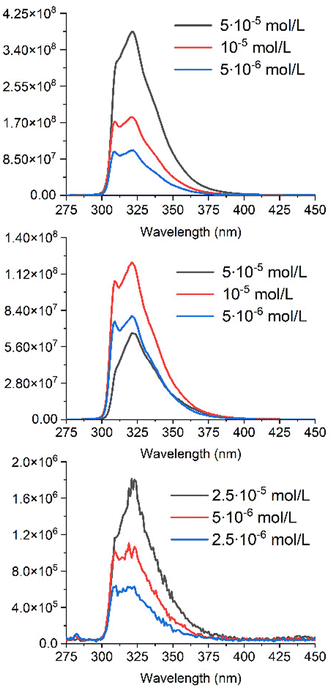 | ||
| Fig. 6 Graphs of fluorescence intensities for A (top), A+C (middle) and AC (bottom) in acetonitrile, recorded at 3 different concentrations. | ||
The emission of the antenna (A) is observed between 300 and 380 nm, which overlaps well with the absorption spectrum of C (Fig. 4), and suggests an efficient FRET energy transfer in AC.
As seen in Fig. 6, the shape of the emission spectrum measured for 5 × 10⁻⁵ M solution of the A differs from those obtained at lower concentrations of the antenna. This fact can be explained by the presence of a pronounced inner filter effect due to a small Stokes shift of the antenna. The fluorescence intensity of the antenna solutions is higher than that of solutions of the same concentration in the presence of an equal quantity of complex C (middle of Fig. 6). It also can be explained by the presence of the inner filter effect due to increasing the concentrations of the antenna and the complex, whose absorbance range overlaps with an emission range of the antenna. This double inner filter effect explains more pronounced fluorescence quenching with an increase of concentrations A and C.
Due to a strong reabsorption of the emitted light, the fluorescence measurements were performed at lower concentration on AC, to minimize the inner filter effect (bottom of Fig. 6) versus those of A and A + C. The signal is close to the background, with a drop in fluorescence intensity by more than 100 times. This hampers a precise evaluation of the resulting FRET efficiency, which however leads to EFRET > 0.99.
It was possible to measure the lifetime of fluorescence for the residual fluorescence detected for AC (Fig. 6). It is equal to 3.6 ns, which is strictly the same as for the free antenna A. This fact makes us think about the possibility of a free antenna A impurity, which either went through all stages of synthesis and purification, or, more likely, formed as a product of AC decomposition. However, we were unable to detect this potential impurity using any of the methods available to us. Regardless of the nature of the residual signal, these measurements in any case prove the efficiency of energy transfer between A and C.
3.4. NO release experiment
The photorelease phenomenon depicted in eqn (1) is likely to be related to the low energy transition of C and AC, located around 350 nm (Fig. 4 and Table 3) where the change transfer towards NO is maximum. On the other hand, the energy transition of antenna is located at 300 nm. Based on these features, the photokinetic studies of C and AC were performed in acetonitrile at 365 nm and 300 nm. The evolution of the absorbance spectra for both species at 365 nm irradiation are shown in Fig. 7. Analogous evolution of absorbance spectra at 300 nm was observed (see ESI†).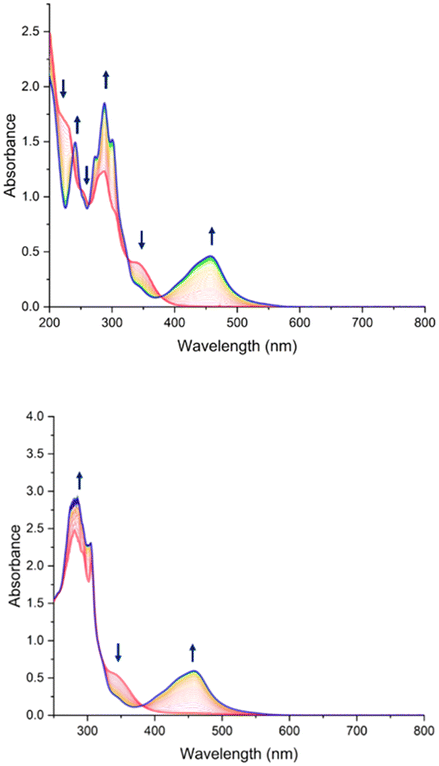 | ||
| Fig. 7 Evolution of UV-Vis spectra of C (top) and AC (bottom) in acetonitrile under 2 hours of irradiation at λ = 365 nm, with starting complex C in red and photoproduct in blue. | ||
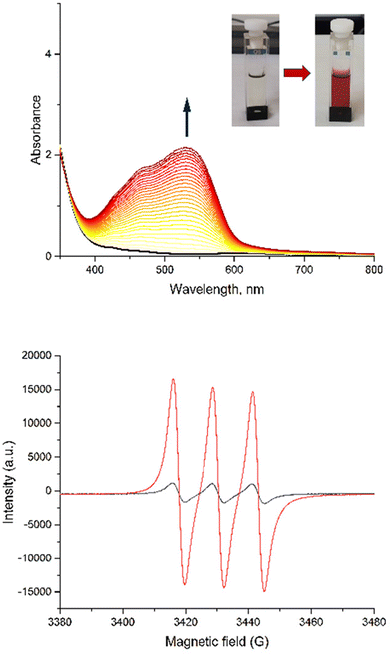
To prove the nitric oxide release during the photoreactions, the Griess test for C and AC was carried out as well as EPR measurement in the presence of iron(II)-N-methyl-D-glucamine dithiocarbamato (Fe-MGD) spin-trap for AC (Fig. 8). The Griess test is an undirect method for detecting NO˙ via its oxidation in nitrite and its consequently reaction with Griess reagent to form a pink azo dye around 540 nm.55 The method of the EPR experiment for detecting NO˙ in the presence of spin-trap was described in our previous paper. The adduct (Fe-MGD-NO) has a characteristic triplet signal with g = 2.040 and a = 1.2 × 10⁻³ cm−1.
The presence of the isosbestic points in Fig. 7 at λ = 365 nm (and figure at λ = 300 nm in ESI†) proves the applicability of the proposed A → B model developed by V. Pimienta et al.56 and described in one of our previous studies. It was used to determine the quantum yield of the photoreaction releasing NO˙. The results are given in Table 4.
| λ (nm) | Φ C | Φ AC |
|---|---|---|
| 300 | 0.05 | 0.04 |
| 365 | 0.07 | 0.07 |
The antenna A does not absorb at λ = 365 nm (Fig. 4), therefore has no influence on the evolution of AC during irradiation at this wavelength. Consequently, the quantum yields for C and AC, are the same at this wavelength (ΦC = ΦAC = 0.07). By contrast, A absorbs a fraction of the light available under irradiation at λ = 300 nm. Thus, the comparison of the quantum yields at both wavelengths provides important information about the influence of the antenna effect in the AC system. At λ = 300 nm ΦC and ΦAC are equal to 0.05 and 0.04, respectively. These values are significantly reduced versus those observed at λ = 365 nm. Meanwhile, ΦC is higher than ΦAC, in perfect agreement with theoretical expectations, in particular with expression (5). According to eqn (10),  which is equal to 0.8 from the experiment carried out at λ = 300 nm (Table 4). Interestingly, it is possible to provide an additional estimation of this value by using the quantum yield of the antenna (ΦA = 0.387), EFRET = 1, and the
  ratio equal to 1.58 at 300 nm (UV-visible spectroscopy). These data lead to
  , a value in good agreement with the 0.8 measured by NO release experiment. It is therefore possible to evaluate the relative efficiency of the AC system before synthesizing the compound itself, on the basis of the properties of the individual A and C components. These expectations can be applied at any concentration, as illustrated in Fig. 9, where the relative efficiency EA is drawn from the NO release experiment as the “experimental” curve, compared to the “theoretical” one predicted by the date based on isolated A and C species. Note that, according to eqn (12), the maximum EA value is equal to 1.26 for the present device (“experimental” curve). Nevertheless, EA > 1 is observed in any case with absorbance lower than 0.7.
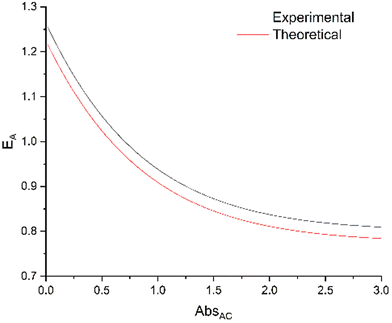 | ||
| Fig. 9 Relative efficiency EA (eqn (11)) calculated from NO release data (ΦC and ΦAC) as the “experimental” curve, compared with the values predicted from the antenna data (ΦA = 0.387) as the “theoretical” curve. | ||
3.5 Concluding remarks
Two strategies can be employed in the design of NO˙ donors based on Ru–NO complexes: (i) the “push–pull” methodology, which to date has focused most of the research efforts in our group, and (ii) the present “antenna” approach. The first strategy is exemplified by [FTRuNO]3+ (Scheme 1), in which the electron-rich fluorene unit is π-conjugated with the RuNO fragment. In [FTRuNO]3+, the donor ligand undergoes significant charge transfer towards RuNO, with the expected outcome of an enhanced NO˙ delivery. This expectation is based on the examination of the global eqn (1), in which NO+ must gain an electron during the photorelease process. However, this approach leads to unexpected observation in some cases. For instance, we have observed a surprisingly large quantum yield of NO˙ release in a complex, where the electron-rich fluorene was replaced by a strongly withdrawing nitrophenyl substituent.57 Similarly, complexes in which the double (–CH![[double bond, length as m-dash]](https://www.rsc.org/images/entities/char_e001.gif) CH–) and triples (–C
CH–) and triples (–C![[triple bond, length as m-dash]](https://www.rsc.org/images/entities/char_e002.gif) C–) bonds were introduced to increase the energy of the donor and hence the push–pull effect led to species of surprisingly reduced quantum yield.14 These unexpected results point out the fact that the push–pull strategy may not necessarily be the only promising one.
C–) bonds were introduced to increase the energy of the donor and hence the push–pull effect led to species of surprisingly reduced quantum yield.14 These unexpected results point out the fact that the push–pull strategy may not necessarily be the only promising one.
The relevance of NO˙ donors built by the “antenna” approach requires more discussion. The figure of merit of such a device is not ΦAC but EA. However, EA is concentration-dependent. There is “zero efficiency” point at which a complex with an antenna has the same efficiency as a complex without antenna. It is possible to calculate the expected relative efficiency based on the properties of the antenna and those of the starting complex (Fig. 9). The main advantage of the antenna approach appears at low concentrations, however, the high ΦA and EFRET values shift the “zero efficiency” point to higher absorbance values. Moreover, it is possible to graft more than one antenna, with the outcome of potential higher EA values.
To summarize – the antenna approach shows its advantage at low concentrations. Considering the potential pharmaceutical utilization of RuNO complexes and the toxic effect of Ru compounds at high concentrations, this fact perfectly matches to the challenge of reaching the maximum of controlled NO˙ release per time unit at lowest complex concentration possible.
4. Conclusion
A fluorene fragment A has been grafted to a ruthenium nitrosyl complex C. The resulting AC complex undergoes a photorelease process, either by direct photon absorption by the C unit, or by a photon absorption by A followed by an energy transfer to C, through a FRET mechanism. Due to the short A–C distance (<10 Å) together with a significant overlap between the fluorescence spectrum of A and the absorbance spectrum of C, the efficiency of the energy transfer (EFRET) is found higher than 99%, with a disappearance of the fluorescence of A in AC. A theoretical approach points out the fact that, the factor of merit for the antenna strategy (EA) is concentration dependent and allows to determine a range of absorbance, which must be maintained below 0.7. Owing to a nearly perfect energy transfer, the key parameter in such molecular device appears to be the quantum yield of fluorescence of the antenna (ΦA) and the possibility to be able to graft more than one antenna to the complex.5. Experimental section
5.1. Materials and equipment
4′-Chloro-2,2′:6′,2′′-terpyridine (Sigma-Aldrich) and all solvents and reagents used for synthesis and optical measurements were purchased from commercial suppliers and were used without further purification. Thin-layer chromatography (TLC) plates, Al2O3 (60 Å, neutral) and SiO2 (60 Å, neutral) for column chromatography were purchased and used as received. A,462a,473a,48 and 4a48 were synthesized according to the published procedures. The Nuclear Magnetic Resonance (NMR) spectra were recorded on a Bruker Avance III 400 MHz spectrometer, in either CDCl3 or CD3CN at 298 K. The chemical shifts (δ) and the scalar coupling constants (J) are given in ppm and Hz, respectively. Chemical shifts for 1H and 13C NMR data are given relative to the residual signal of non-deuterated solvent recorded at δ = 7.26 (CDCl3) and δ = 1.94 (CD3CN) ppm for 1H NMR and at δ = 77.16 (CDCl3) and δ = 1.32 (CD3CN) ppm for 13C NMR. NMR spectra are available in ESI.† High-resolution mass spectroscopy (HRMS) data were obtained on a Waters Xevo G2 QTOF UPLC spectrometer. On each spectrum the error (ppm) is provided as (observed mass − theoretical mass) × 106/theoretical mass.58 Infrared spectra were recorded using a diamond ATR on a PerkinElmer Frontier FT-IR spectrometer. A diode array Hewlett Packart 8454A spectrophotometer was used to obtain UV-Vis spectra and to carry out kinetic studies on the photolysis reactions. Detailed procedure of kinetic studies was described in our previous works.43,59 Data on NO˙ photorelease at 300 and 365 nm for C and AC are presented in ESI.† Fluorescence spectra were recorded on a Jobin Yvon Fluoromax 4 Spectrofluorimeter. Quantum yield of 1b was obtained on Hamamatsu Quantaurus-QY Absolute PL quantum yield spectrometer. Fluorescence lifetime studies were performed on a Horiba DeltaFlex TCSPC Lifetime Fluorometer with a Horiba DeltaDiode DD-300 diode and Horiba DPS-1 power supply unit. All optical measurements were carried out in quartz cuvettes.5.2. Synthesis of C and AC
![[thin space (1/6-em)]](https://www.rsc.org/images/entities/char_2009.gif) :
:![[thin space (1/6-em)]](https://www.rsc.org/images/entities/char_2009.gif) 1), to lead to 182.3 mg of 2b (yield: 95%). 1H NMR (400 MHz, CDCl3) δ 8.72 (ddd, J = 4.8, 1.8, 0.9 Hz, 2H), 8.65 (dt, J = 8.0, 1.1 Hz, 2H), 8.21 (s, 2H), 7.88 (td, J = 7.7, 1.8 Hz, 2H), 7.74–7.68 (m, 2H), 7.50–7.43 (m, 2H), 7.38–7.29 (m, 5H), 5.43 (s, 2H), 1.97 (dd, J = 10.6, 6.0 Hz, 4H), 1.12–0.97 (m, 12H), 0.74 (t, J = 7.1 Hz, 6H), 0.64–0.56 (m, 4H). 13C NMR (101 MHz, CDCl3) δ 167.11, 157.23, 156.19, 151.27, 151.03, 149.11, 141.25, 140.79, 136.90, 134.91, 127.21, 126.83, 126.33, 123.93, 122.96, 122.16, 121.47, 119.85, 119.84, 107.88, 70.48, 55.19, 40.46, 31.58, 29.80, 23.85, 22.67, 14.09. HRMS (ESI-TOF+) m/z: [M + H+]+. Anal. calc. for C41H46N3O: 596.3641. Found: 596.3638. Error: −0.50 ppm.
1), to lead to 182.3 mg of 2b (yield: 95%). 1H NMR (400 MHz, CDCl3) δ 8.72 (ddd, J = 4.8, 1.8, 0.9 Hz, 2H), 8.65 (dt, J = 8.0, 1.1 Hz, 2H), 8.21 (s, 2H), 7.88 (td, J = 7.7, 1.8 Hz, 2H), 7.74–7.68 (m, 2H), 7.50–7.43 (m, 2H), 7.38–7.29 (m, 5H), 5.43 (s, 2H), 1.97 (dd, J = 10.6, 6.0 Hz, 4H), 1.12–0.97 (m, 12H), 0.74 (t, J = 7.1 Hz, 6H), 0.64–0.56 (m, 4H). 13C NMR (101 MHz, CDCl3) δ 167.11, 157.23, 156.19, 151.27, 151.03, 149.11, 141.25, 140.79, 136.90, 134.91, 127.21, 126.83, 126.33, 123.93, 122.96, 122.16, 121.47, 119.85, 119.84, 107.88, 70.48, 55.19, 40.46, 31.58, 29.80, 23.85, 22.67, 14.09. HRMS (ESI-TOF+) m/z: [M + H+]+. Anal. calc. for C41H46N3O: 596.3641. Found: 596.3638. Error: −0.50 ppm.
5.2. X-ray diffraction
Data were collected on a Rigaku XtaLAB Synergy Dualflex diffractometer using a PhotonJet X-ray source (CuKα, λ = 1.54184 Å). An Oxford Cryosystems Cryostream cooling device was used to collect data at low temperature (100(2) K). Omega scans were performed for data collection. An empirical absorption correction was applied and the structures were solved by intrinsic phasing method (ShelXT).60 All non-hydrogen atoms were refined anisotropically by means of least-squares procedures on F2 with ShelXL.61 All the hydrogen atoms were refined isotropically at calculated positions using a riding model. The disorder of an alkyl chain was successfully modeled and the anisotropic displacement parameters were restrained by DELU and SIMU commands. Table for atomic coordinates, bond lengths and angles, and anisotropic displacement parameters are provide in ESI.† The structure is deposited at the Cambridge Crystallographic Data Centre (CCDC 2349350†).5.3. DFT computations
A, C, and AC were fully optimized using the Gaussian program package,62 within the framework of the Density Functional Theory (DFT). The double-ζ basis set 6-31G* was used for all atoms except the heavy ruthenium atom, for which the LANL2DZ basis set was applied to account for relativistic effects.63 To be consistent with our numerous reports on Ru–NO complexes, we have selected the hybrid functional B3PW91 for the optimization. B3PW91 has been shown to outperform other hybrid functionals (e.g. B3LYP) and pure functionals (e.g. PW91) in numerous cases of ruthenium complexes, especially when back bonding ligands (like NO) are present.64,65 The vibrational analyses were performed at the same level to verify that the stationary points correspond to minima on the potential energy surfaces. The UV-visible electronic spectra were then computed at the CAM-B3LYP/6-31G* level, in the case of C and AC, for consistency with our previous investigation of [FTRuNO]3+.16 This long-range corrected hybrid functional is well suited for studying molecules with delocalized excited states.66 In the case of A, where no charge transfer takes place, the spectrum was also computed at the B3LYP/6-31*G level, which led to a better accuracy with the experimental UV-visible data. Solvent effects were included by using the polarizable continuum model (PCM) implemented in Gaussian09 for acetonitrile (ε = 35.688). Molecular orbitals were plotted with GABEDIT 2.4.8.67Conflicts of interest
There are no conflicts to declare.Acknowledgements
V. M. acknowledges that this project has received funding through the MSCA4Ukraine project, which is funded by the European Union.References
- L. J. Ignarro, Nitric Oxide Biology and Pathobiology, Academic Press, San Diego, 2000 Search PubMed.
- B. Bonavida, Nitric Oxide and Cancer: Prognosis, Prevention and Therapy, Springer, New-York, 2010 Search PubMed.
- A. W. Carpenter and M. H. Schoenfisch, Chem. Soc. Rev., 2012, 41, 3742–3752 RSC.
- P. C. Ford, Nitric Oxide, 2013, 34, 56–64 CrossRef CAS PubMed.
- S. Muntazir Andrabi, N. Shree Sharma, A. Karan, S. M. Shatil Shahriar, B. Cordon, B. Ma and J. Xie, Adv. Sci., 2023, 10, 2303259 CrossRef PubMed.
- P. G. Lacroix, I. Malfant, P. Labra-Vásquez, N. Fárfan and G. Ramos, Dalton Trans., 2022, 51, 14833–14841 RSC.
- I. Stepanenko, M. Zalibera, D. Schaniel, J. Tesler and V. B. Arion, Dalton Trans., 2022, 51, 5367–5393 RSC.
- E. Tfouni, D. R. Truzzi, A. Tavare, A. J. Gomes, L. E. Figueiredo and D. W. Franco, Nitric Oxide, 2021, 26, 38–53 CrossRef PubMed.
- M. A. Evans, P.-J. Huang, Y. Iwamoto, K. N. Ibsen, E. M. Chan, Y. Hitomi, P. C. Ford and S. Mitragotri, Chem. Sci., 2018, 9, 3729–3741 RSC.
- H.-J. Xiang, M. Guo and J.-G. Liu, Eur. J. Inorg. Chem., 2017, 1586–1597 CrossRef CAS.
- N. L. Fry and P. K. Mascharak, Acc. Chem. Res., 2011, 44, 289–298 CrossRef CAS PubMed.
- M. J. Rose and P. K. Mascharak, Curr. Opin. Chem. Biol., 2008, 12, 238–244 CrossRef CAS PubMed.
- M. J. Rose and P. K. Mascharak, Coord. Chem. Rev., 2008, 252, 2093–2114 CrossRef CAS PubMed.
- V. Bukhanko, A. F. León-Rojas, P. G. Lacroix, M. Tassé, G. Ramos-Ortiz, R. M. Barba-Barba, N. Farfán, R. Santillan and I. Malfant, Eur. J. Inorg. Chem., 2021, 1670–1684 CrossRef CAS.
- M. Roose, I. Sasaki, V. Bukhanko, S. Mallet-Ladeira, R. M. Barba-Barba, G. Ramos-Ortiz, A. Enriquez-Cabrera, N. Farfán, P. G. Lacroix and I. Malfant, Polyhedron, 2018, 151, 100–111 CrossRef CAS.
- A. Enriquez-Cabrera, I. Sasaki, V. Bukhanko, M. Tassé, S. Mallet-Ladeira, P. G. Lacroix, R. M. Barba-Barba, G. Ramos, N. Farfán, Z. Voitenko and I. Malfant, Eur. J. Inorg. Chem., 2017, 1446–1456 CrossRef CAS.
- G. Bao, J. Lumin., 2020, 228, 117622 CrossRef CAS.
- O. Planas, E. Boix-Garriga, B. Rodríguez-Amigo, J. Torra, R. Bresolí-Obach, C. Flors, C. Viappiani, M. Agut, R. Ruiz-González and S. Nonell, Photochemistry, 2015, 42, 233–278 CAS.
- T. A. Shell and D. S. Lawrence, Acc. Chem. Res., 2015, 48, 2866–2874 CrossRef CAS PubMed.
- V. Garg, G. Kodis, P. A. Liddell, Y. Terazono, T. A. Moore, A. L. Moore and D. Gust, J. Phys. Chem. B, 2013, 117, 11299–11130 CrossRef CAS PubMed.
- Y. Huang, F. Qiu, R. Chen, D. Yan and X. Zhu, J. Mater. Chem. B, 2020, 8, 3772–3788 RSC; W. Yang, J. Jo, H. Oh, H. Lee, W. J. Chung and J. Seo, J. Org. Chem., 2020, 85, 1392–1400 CrossRef CAS PubMed.
- U. Pischel, F. Huang and W. M. Nau, Photochem. Photobiol. Sci., 2004, 3, 305–310 CrossRef CAS PubMed.
- S. R. Wecksler, J. Hutchinson and P. C. Ford, Inorg. Chem., 2006, 45, 1192–1200 CrossRef CAS PubMed.
- F. Hauke, A. Hirsch, S. Atalick and D. Guldi, Eur. J. Org. Chem., 2005, 1741–1751 CrossRef CAS.
- V. Lioret, Y. Rousselin and R. A. Decréau, Dyes Pigm., 2020, 183, 108696 CrossRef CAS.
- P. C. Ford, Acc. Chem. Res., 2008, 41, 190–200 CrossRef CAS PubMed.
- Q. Zheng, A. Bonoiu, T. Ohulchanskyy, G. S. He and P. N. Prasad, Mol. Pharmacol., 2008, 5, 389–398 CrossRef CAS PubMed.
- S. R. Wecksler, A. Mikhailovsky, D. Korystov, F. Buller, R. Kannan, L.-S. Tan and P. C. Ford, Inorg. Chem., 2007, 46, 395–402 CrossRef CAS PubMed.
- S. R. Wecksler, A. Mikhailovsky, D. Korystov and P. C. Ford, J. Am. Chem. Soc., 2006, 128, 3831–3837 CrossRef CAS PubMed.
- B. W. Van der Meer, Förster Theory, in FRET – Förster Resonance Energy Transfer, ed. I. Medintz and N. Hildebrandt, Wiley, 2013, ch. 3 Search PubMed.
- W. R. Algar, N. Hildebrandt, S. S. Vogel and I. L. Medintz, Nat. Methods, 2019, 16, 815–829 CrossRef CAS PubMed.
- B. W. Van der Meer, D. M. Van der Meer and S. S. Vogel, Optimizing the Orientation Factor Kappa-Squared for More Accurate FRET Measurements, in FRET – Förster Resonance Energy Transfer, ed. I. Medintz and N. Hildebrandt, Wiley, 2013 Search PubMed.
- M. Linlin, Y. Fan and Z. Jie, J. Mol. Struct., 2014, 1077, 87–100 CrossRef PubMed.
- W. Russ Algar, N. Hildebrandt, S. S. Vogel and I. L. Medintz, Nat. Methods, 2019, 16, 815–829 CrossRef PubMed.
- S. Hartmann, D. Weidlich and D. Klostermeier, in Methods in Enzymology, ed. M. Spies and Y. R. Chemla, 2016, vol. 581, pp. 317–351 Search PubMed.
- T. Hirano, K. Ueda, M. Mukaida, H. Nagao and T. Oi, J. Chem. Soc., Dalton Trans., 2001, 2341–2345 RSC.
- S. Ferlay, H. W. Schmalle, G. Francese, H. Stoeckli-Evans, M. Imlau, D. Schaniel and Th. Woike, Inorg. Chem., 2004, 43, 3500–3506 CrossRef CAS PubMed.
- K. Karidi, A. Garoufis, A. Tsipis, N. Hadjiliadis, H. den Dulk and J. Reedijk, Dalton Trans., 2005, 1176–1187 RSC.
- J. Akl, Ch. Billot, P. G. Lacroix, I. Sasaki, S. Mallet-Ladeira, I. Malfant, R. Arcos-Ramos, M. Romero and N. Farfan, New J. Chem., 2013, 37, 3518–3527 RSC.
- J. Akl, I. Sasaki, P. G. Lacroix, I. Malfant, S. Mallet-Ladeira, P. Vicendo, N. Farfán and R. Santillan, Dalton Trans., 2014, 45, 12721–12733 RSC.
- A. Enriquez-Cabrera, P. G. Lacroix, I. Sasaki, S. Malet-Ladeira, N. Farfan, R. M. Barba-Barba, G. Ramos-Ortiz and I. Malfant, Eur. J. Inorg. Chem., 2018, 531–543 CrossRef CAS.
- I. Sasaki, S. Amabilino, S. Mallet-Ladeira, M. Tassé, A. Sournia-Saquet, P. G. Lacroix and I. Malfant, New J. Chem., 2019, 43, 11241–11250 RSC.
- P. Labra-Vázquez, V. Mudrak, M. Tassé, S. Mallet-Ladeira, A. Sournia-Saquet, J.-P. Malval, P. G. Lacroix and I. Malfant, Inorg. Chem., 2023, 62, 20349–20363 CrossRef PubMed.
- Y. Yuan, I. Thomé, S. Hwan Kim, D. Chen, A. Beyer, J. Bonnamour, E. Zuidema, S. Chang and C. Bolm, Adv. Synth. Catal., 2010, 352, 2892–2898 CrossRef CAS.
- R. Manoharan and S. K. Dogra, J. Photochem. Photobiol., A, 1988, 43, 81–90 CrossRef CAS.
- W. S. Huang, C. W. Lin, J. T. Lin, J. H. Huang, C. W. Chu, Y. H. Wu and H. C. Lin, Org. Electron., 2009, 10, 594–606 CrossRef CAS.
- E. C. Constable, K. Harris, C. E. Housecroft, M. Neuburger and J. A. Zampese, CrystEngComm, 2010, 12, 2949–2961 RSC.
- M. Yagi, S. Tajima, M. Komi and H. Yamazaki, Dalton Trans., 2011, 40, 3802–3804 RSC.
- M. Roose, M. Tassé, P. G. Lacroix and I. Malfant, New J. Chem., 2019, 43, 755–767 RSC.
- V. Bukhanko, P. G. Lacroix, I. Sasaki, M. Tassé, S. Mallet-Ladeira, Z. Voitenko and I. Malfant, Inorg. Chim. Acta, 2018, 482, 195–205 CrossRef CAS.
- Y. Juarez-Martinez, P. Labra-Vázquez, A. Enríquez-Cabrera, A. F. Leon-Rojas, D. Martínez-Bourget, P. G. Lacroix, M. Tassé, S. Mallet-Ladeira, N. Farfán, R. Santillan, G. Ramos-Ortiz, J.-P. Malval and I. Malfant, Chem. – Eur. J., 2022, 28, e202201692 CrossRef CAS PubMed , 1–14.
- A. Streitwieser and C. Heathcock, Introduction to Organic Chemistry, McMillan Publishing Cie, New-York, 1985 Search PubMed.
- J. Chao, R. C. Wilhoit and B. J. Zwolinski, J. Phys. Chem. Ref. Data, 1973, 2, 427–437 CrossRef CAS.
- A. D. Laurent and D. Jacquemin, Int. J. Quantum Chem., 2013, 113, 2019–2039 CrossRef CAS.
- D. Tsikas, J. Chromatogr. B: Anal. Technol. Biomed. Life Sci., 2007, 851, 51–70 CrossRef CAS PubMed.
- V. Pimienta, D. Lavabre and J. C. Micheau. (https://cinet.chim.cnrs.fr/), together with examples and notice.
- S. Amabilino, M. Tasse, P. G. Lacroix, S. Mallet-Ladeira, V. Pimienta, J. Akl, I. Sasaki and I. Malfant, New J. Chem., 2017, 41, 7371–7383 RSC.
- N. L. Stock, J. Chem. Educ., 2017, 94, 1978–1982 CrossRef CAS.
- P. Labra-Vázquez, M. Bocé, M. Tassé, S. Mallet-Ladeira, P. G. Lacroix, N. Farfán and I. Malfant, Dalton Trans., 2020, 49, 3138–3154 RSC.
- G. M. Sheldrick, Acta Crystallogr., Sect. A: Found. Adv., 2015, 71, 3–8 CrossRef PubMed.
- G. M. Sheldrick, Acta Crystallogr., Sect. C: Struct. Chem., 2015, 71, 3–8 Search PubMed.
- M. J. Frisch, G. W. Trucks, H. B. Schlegel, G. E. Scuseria, M. A. Robb, J. R. Cheeseman, G. Scalmani, V. Barone, B. Mennucci, G. A. Petersson, H. Nakatsuji, M. Caricato, X. Li, H. P. Hratchian, A. F. Izmaylov, J. Bloino, G. Zheng, J. L. Sonnenberg, M. Hada, M. Ehara, K. Toyota, R. Fukuda, J. Hasegawa, M. Ishida, T. Nakajima, Y. Honda, O. Kitao, H. Nakai, T. Vreven, J. A. Montgomery Jr., J. E. Peralta, F. Ogliaro, M. Bearpark, J. J. Heyd, E. Brothers, K. N. Kudin, V. N. Staroverov, R. Kobayashi, J. Normand, K. Raghavachari, A. Rendell, J. C. Burant, S. S. Iyengar, J. Tomasi, M. Cossi, N. Rega, J. M. Millam, M. Klene, J. E. Knox, J. B. Cross, V. Bakken, C. Adamo, J. Jaramillo, R. Gomperts, R. E. Stratmann, O. Yazyev, A. J. Austin, R. Cammi, C. Pomelli, J. W. Ochterski, R. L. Martin, K. Morokuma, V. G. Zakrzewski, G. A. Voth, P. Salvador, J. J. Dannenberg, S. Dapprich, A. D. Daniels, Ö. Farkas, J. B. Foresman, J. V. Ortiz, J. Cioslowski and D. J. Fox, Gaussian 09, Revision E.01, Gaussian, Inc., Wallingford CT, 2009 Search PubMed.
- (a) P. J. Hay and W. R. Wadt, J. Chem. Phys., 1985, 82, 270–283 CrossRef CAS; (b) W. R. Wadt and P. J. Hay, J. Chem. Phys., 1985, 82, 284–298 CrossRef CAS; (c) P. J. Hay and W. R. Wadt, J. Chem. Phys., 1985, 82, 299–310 CrossRef CAS.
- M. J. Rose and P. K. Mascharak, Inorg. Chem., 2009, 48, 6904–6917 CrossRef CAS PubMed.
- P. Hirva, M. Haukka and M. Jaconen, J. Mol. Model., 2008, 14, 171–181 CrossRef CAS PubMed.
- D. Jacquemin, E. A. Perpète, G. E. Scuseria, I. Ciofini and C. Adamo, J. Chem. Theory Comput., 2008, 4, 123–135 CrossRef CAS PubMed.
- https://sites.Google.com/site/allouchear/Home/gabedit .
Footnote |
| † Electronic supplementary information (ESI) available. CCDC 2349350. For ESI and crystallographic data in CIF or other electronic format see DOI: https://doi.org/10.1039/d4dt01154f |
| This journal is © The Royal Society of Chemistry 2024 |

