 Open Access Article
Creative Commons Attribution 3.0 Unported Licence
Unravelling co-catalyst integration methods in Ti-based metal–organic gels for photocatalytic H2 production†‡
Maite
Perfecto-Irigaray
 a,
Garikoitz
Beobide
 *ab,
Oscar
Castillo
 ab,
Michael G.
Allan
cd,
Moritz F.
Kühnel
 *ce,
Antonio
Luque
 ab,
Harishchandra
Singh
 f,
Ashok Kumar
Yadav
 g and
Sonia
Pérez-Yáñez
 ab
ab
aDepartment of Organic and Inorganic Chemistry, University of the Basque Country, UPV/EHU, P.O. 644, Bilbao E-48080, Spain. E-mail: garikoitz.beobide@ehu.eus
bBCMaterials, Basque Center for Materials, Applications and Nanostructures, UPV/EHU Science Park, Leioa 48940, Spain
cDepartment of Chemistry, Faculty of Science and Engineering, Swansea University, Singleton Park, SA2 8PP Swansea, UK
dNorth Campus Research Complex, University of Michigan, Ann Arbor, MI 48109, USA
eInstitute of Chemistry, University of Hohenheim, 70593 Stuttgart, Germany. E-mail: moritz.kuehnel@uni-hohenheim.de
fNano and Molecular Systems Research Unit, University of Oulu, Oulu FIN-90014, Finland
gSynchrotron SOLEIL, Beamline SIRIUS, Saint-Aubin, F-91192, Gif sur Yvette, France
First published on 11th May 2024
Abstract
The synthesis, characterization and photocatalytic hydrogen evolution reaction (HER) performance of a series of metal–organic gels (MOGs) constructed from titanium(IV)-oxo clusters and dicarboxylato linkers (benzene-1,4-dicarboxylato and 2-aminobenzene-1,4-dicarboxylato) are described. All the MOGs exhibit a microstructure comprised of metal–organic nanoparticles intertwined into a highly meso-/macroporous structure, as demonstrated by cryogenic transmission electron microscopy and gas adsorption isotherms. Comprehensive chemical characterization enabled the estimation of the complex formula for these defective materials, which exhibit low crystallinity and linker vacancies. To gain deeper insights into the local structure, X-ray absorption fine structure (XAFS) spectroscopy experiments were performed and compared to that of the analogous crystalline metal–organic framework. Additionally, the ultraviolet–visible absorption properties and optical band gaps were determined from diffuse reflectance spectroscopy data. The MOGs were studied as light absorbers for the sacrificial photocatalytic HER under simulated solar light irradiation using a platinum co-catalyst by either (1) in situ photodeposition or (2) ex situ doping process, through a post-synthetic metalation of the MOG structure. The chemical analysis of the metalation, along with high-angle annular dark-field scanning transmission electron microscopy, revealed that although the in situ addition of the co-catalyst led to greater HER rates (227 vs. 110 μmolH2 gMOG−1 h−1 for in situ and ex situ, respectively), the ex situ modification provided a finer distribution of platinum nanoparticles along the porous microstructure and, as a result, it led to a more efficient utilization of the co-catalyst (45 vs. 110 mmolH2 gPt−1 h−1).
1. Introduction
Metal–organic frameworks (MOFs) have garnered significant attention due to their unique hybrid organic–inorganic nanoporous structure, characterised by a large surface-area-to-volume ratio and a versatile chemical and electronic structure that can be controlled through the assembly of specific building blocks.1 Consequently, they have been extensively investigated as multifunctional materials with diverse applications, including gas storage and separation, sensing, supercapacitors, drug delivery, catalysis, agrochemistry, and environmental remediation.2–6 In recent years, the application of MOFs as photocatalysts for solar hydrogen production has become an intense field of research7–9 due to the increasing environmental concerns about global warming and the urgent need for green energy vectors.10,11 In this context, the majority of research efforts have been directed towards Ti(IV)-based MOFs, and particularly, towards the MIL-125(Ti) MOF family. This focus is justified not only by the inherent photocatalytic activity and large surface area of these MOFs, but also by their exceptional chemical and thermal stability.12,13 This stability is achieved through the strong coordination bond formed by the combination of a group IV oxidation-state metal ion with the hard donor atoms of carboxylate-based ligands.14 In addition, the high charge of a 4+ metal cation necessitates a higher ligand-to-metal ratio for charge balancing, leading to increased connectivity of the inorganic clusters within the framework and thereby enhanced overall stability.In comparison with conventional inorganic semiconductors, where photoexcitation typically leads to the separation of electrons and holes on metal cation and oxygen anion sites, respectively, MOFs exhibit a predominant ligand-to-metal charge transfer (LMCT) mechanism.15,16 This characteristic contributes to significantly lower charge recombination rates and longer charge lifetimes, rendering them highly suitable for photocatalytic applications. It is worth noting that while certain Ti(IV)-MOFs can facilitate the photocatalytic hydrogen evolution reaction (HER) in conjunction with the complementary oxygen evolution reaction (OER) for water splitting, the use of sacrificial agents leads to an enhancement in hydrogen production rates.17–20 Moreover, various strategies have been investigated to modify titanium-based MOFs with the objective of fine-tuning their photocatalytic HER performance. The formation of heterostructures consisting of MOF crystals with attached co-catalyst nanoparticles (e.g., Pt, TiO2, RuOx, CoOx, and CdS) is a widely explored strategy that seeks to improve hydrogen production by expediting the transfer of photogenerated electrons and holes.17,21,22 Ligand functionalization has also been investigated as a potential approach for achieving better use of the visible region of the solar spectrum.23 Another noteworthy approach has involved the engineering of defects in the parent MIL-125(Ti) MOF. This method has revealed that ligand vacancies within the MOF structure can alter the bandgap and create accessible active sites, resulting in enhanced hydrogen production capability.18,20
Recently, Ti(IV)-based metal–organic gels (MOGs) have been introduced as a promising photocatalytic material for the carbon dioxide reduction reaction (CO2RR).24,25 MOGs can exhibit a rather similar chemical nature to that of MOFs, but consist of meso-/macroporous microstructures constructed from partially sintered metal–organic nanoparticles.26–28 The larger pores in MOGs allow for more efficient diffusion of reagents and products compared to the narrower channels found in the coordination structure of MOFs. Furthermore, the rapid and non-selective polymerization reaction that occurs during MOG formation offers the possibility of incorporating diverse co-ligands and creating a defective structure.24,25 This not only affects the photocatalytic performance, as mentioned earlier, but also provides an opportunity for post-synthetic modification of the pristine catalyst.29
Herein, we describe the synthesis, comprehensive characterization, and HER performance of a series of MOGs related to the MIL-125 MOF that are constructed by the assembly of Ti-oxo clusters and dicarboxylato linkers (benzene-1,4-dicarboxylato and 2-aminobenzene-1,4-dicarboxylato). The influence of the type of ligand on the light absorption properties and HER performance under solar light illumination is analysed. Furthermore, to enhance the hydrogen production, the defective sites and highly porous structure of the MOGs were utilised to anchor platinum as co-catalyst. As previously reported, the metalation with platinum is commonly afforded through two strategies: (1) in situ metalation, where the Pt nanoparticle or an alternative source of photoreducible platinum compound is added into the HER media; and (2) ex situ metalation, where the catalyst is doped or modified during its preparation or through a post-synthetic reaction.17,19,21,23,30 Despite the fact that many studies have employed either one strategy or another, there is a lack of comparative studies in the field. Therefore, this study evaluates the two approaches for incorporating the co-catalyst into the porous surface of the MOG in terms of material performance and characteristics.
2. Experimental section
2.1. Synthesis
All reagents were used as commercially obtained (see details in section S1 of the ESI‡).![[thin space (1/6-em)]](https://www.rsc.org/images/entities/char_2009.gif) :
:![[thin space (1/6-em)]](https://www.rsc.org/images/entities/char_2009.gif) linker molar ratio of 1
linker molar ratio of 1![[thin space (1/6-em)]](https://www.rsc.org/images/entities/char_2009.gif) :
:![[thin space (1/6-em)]](https://www.rsc.org/images/entities/char_2009.gif) 0.75, based on the ideal ratio found in MIL-125 and MIL-125-NH2.31 The sample codes and ligand quantities used are listed in Table 1. The mixture was transferred to a closed vessel, then placed in a preheated oven and maintained at 80 °C for 6 h.
0.75, based on the ideal ratio found in MIL-125 and MIL-125-NH2.31 The sample codes and ligand quantities used are listed in Table 1. The mixture was transferred to a closed vessel, then placed in a preheated oven and maintained at 80 °C for 6 h.
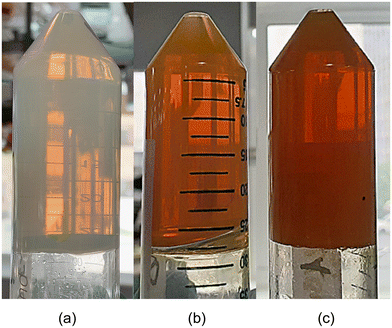
The polymerization of the metal–organic framework resulted in well-formed translucent metallogels, which turned yellow-orange upon the incorporation of the NH2BDC ligand (Fig. 1). The remaining reagents were removed by exchanging the solvent trapped in the gels with a mixture of butan-2-ol/DMF (1.6![[thin space (1/6-em)]](https://www.rsc.org/images/entities/char_2009.gif) :
:![[thin space (1/6-em)]](https://www.rsc.org/images/entities/char_2009.gif) 1), followed by a mixture of butan-2-ol/DMF/ethanol (1
1), followed by a mixture of butan-2-ol/DMF/ethanol (1![[thin space (1/6-em)]](https://www.rsc.org/images/entities/char_2009.gif) :
:![[thin space (1/6-em)]](https://www.rsc.org/images/entities/char_2009.gif) 1
1![[thin space (1/6-em)]](https://www.rsc.org/images/entities/char_2009.gif) :
:![[thin space (1/6-em)]](https://www.rsc.org/images/entities/char_2009.gif) 1), and finally, three exchanges of absolute ethanol to obtain alcogels. Additionally, the gels were conditioned in deionised water (3 times) to obtain hydrogels for the HER experiments. It should be noted that all solvent exchange processes were conducted with the material in a gel state (Fig. S1‡).
1), and finally, three exchanges of absolute ethanol to obtain alcogels. Additionally, the gels were conditioned in deionised water (3 times) to obtain hydrogels for the HER experiments. It should be noted that all solvent exchange processes were conducted with the material in a gel state (Fig. S1‡).
2.2. Characterization
It should be noted that MOGs cannot be directly used for certain characterization studies because ca. 95% of their content corresponds to the solvent trapped within the metal–organic solid network. Evaporation of the solvent by heating is the easiest drying method, but it promotes the collapse of the meso-/macroporous structure of the MOG to give xerogels with the same chemical composition but no porosity. Therefore, xerogels (dried at 150 °C for 2 h) were used here for routine chemical characterization. Additionally, for investigating the porosity or microstructure of the material, CO2-supercritical drying of the MOGs was performed in an E3100 critical point dryer from Quorum Technologies, in which liquid CO2 replaced the solvent inside the pores. The removal of CO2 at its critical point (74 bar and 31 °C) and its replacement for air yields aerogels, which retain most of the porosity (ca. 5% shrinkage). Otherwise, for cryogenic transmission electron microscopy and in all HER experiments, hydrogels were used without any drying (see Fig. S1‡).XAFS measurements at the L3 absorption edge of Pt (11![[thin space (1/6-em)]](https://www.rsc.org/images/entities/char_2009.gif) 564 eV) were carried out at the SIRIUS beamline of Synchrotron SOLEIL, France.38,39 The fluorescence from the sample was measured using a four-element silicon drift detector (SDD, Bruker XFlash QUAD 5040) connected with four-channel xMAP DXP electronics provided by XIA. XAFS data were corrected for non-linearity prior to their analysis.40
564 eV) were carried out at the SIRIUS beamline of Synchrotron SOLEIL, France.38,39 The fluorescence from the sample was measured using a four-element silicon drift detector (SDD, Bruker XFlash QUAD 5040) connected with four-channel xMAP DXP electronics provided by XIA. XAFS data were corrected for non-linearity prior to their analysis.40
X-ray absorption spectroscopy analysis was conducted utilizing the Athena and Artemis subroutines within the Demeter package, which facilitated data processing and analysis.41 The standard data analysis procedure includes background subtraction and Fourier transform to derive the χ(R) versus R spectra from the absorption spectra using ATHENA software, and generation of the theoretical extended X-ray absorption fine structure (EXAFS) spectra starting from an assumed crystallographic structure and finally fitting of experimental data with the theoretical spectra using ARTEMIS software. For the Fourier transforms, a k-range of 3–10 Å−1 was employed at the Ti K-edge and Pt L3-edge. In fitting the data at the Ti K-edge and Pt L3-edge, R-ranges of 1.0–3.0 Å and 1.2–3.5 Å were utilised, respectively. During the fitting process, the coordination numbers, bond lengths, and disorder factors were treated as variables.
2.3. Hydrogen evolution reaction under simulated solar irradiation
Solar-light-driven H2 production experiments were conducted using a home-made reactor set-up (see section S10 of the ESI‡). Each of the prepared MOGs (neat and Pt(IV)-doped hydrogels) was placed in a glass vial (Chromacol 10-SV, Fisher) to obtain 5 mg of MOG network (Table S5‡) along with 2 mL of 0.1 M aq. triethanolamine (TEOA) solution (pH adjusted to 7 with 2 M HCl) acting as electron donor. Non-doped samples were tested with and without the addition of the Pt-based co-catalyst to the HER media. In the former case, 12.3 μL of 20.9 mM hexachloroplatinic acid solution was added (H2PtCl6, 1 wt% of Pt with respect to the MOG network, in situ experiments). The vials were capped with rubber septa, sonicated for 20 min and purged for 10 min with N2 gas prior to irradiation. Then the vials were placed in a thermostat-controlled custom built quartz water bath (25 °C) under continuous stirring and irradiation using a solar-light simulator equipped with an AM 1.5G filter, at an intensity of 1 sun (100 mW cm−2). The sample headspace was constantly purged with N2 at a flow rate of 5 mL min−1, controlled by a mass flow controller. The H2 evolution was monitored using a gas chromatograph equipped with a barrier-discharge ionization detector (BID) and a molecular sieve column. Gas samples were programmed to auto-inject into the GC via a multiport stream selector valve directing the selected sample purge gas stream through a 2 mL sample loop before injection. The H2 evolution rates were calculated from the measured H2 concentration in the purge gas and the purge gas flow rate. Cumulative H2 production was calculated from the H2 evolution rate and the time elapsed since the previous measurement, assuming a constant rate between time points. Each sample was measured in triplicate and the results are given as the mean value together with the standard deviation. The MOG samples were recovered by decantation after the HER and washed successively with water and ethanol for further physicochemical characterization. Additionally, the same experiments were performed using a UV filter to exclusively irradiate the system with visible light (λ > 400 nm).3. Results and discussion
3.1. Chemical characterization
The chemical formula of the Ti(IV)/BDC/NH2BDC MOGs (Table 2) was estimated by chemical analysis, combining 1H-NMR and TGA measurements (see ESI sections S3 and S4‡). It should be noted that the ESI-MS analysis data reported in previous works24,25 indicate that under the employed synthetic conditions for the Ti/carboxylate systems, Ti8O8-type clusters are the predominant species. Consequently, the formula of each MOG has been normalised to octanuclear Ti-clusters. Prepared MOGs exhibit the presence of 2–3 dicarboxylato linkers, as well as a set of formate (produced from DMF decomposition during the synthesis procedure42) and OH−/H2O pairs completing the coordination sphere to compensate for the linker vacancies (see section S5‡ for further details).43,44| Sample | Formula |
|---|---|
| B100 | Ti8O8(OH)4(BDC)3.33(HCOO)1.14(H2O)4.2(OH)4.2 |
| B50A50 | Ti8O8(OH)4(BDC)1.01(NH2BDC)1.16(HCOO)1.32(H2O)6.34(OH)6.34 |
| A100 | Ti8O8(OH)4(NH2BDC)2.96(HCOO)0.94(H2O)5.14(OH)5.14 |
Fig. 2 displays the comparison between the experimental PXRD patterns of the prepared materials and the simulated patterns for reference MIL-125 and MIL-125-NH2 titanium(IV)-MOFs. All samples lack crystallinity but exhibit a broad peak at 2θ = 6–7°, which fits well with the position of the highest intensity reflection observed in the MIL-125 family (with Miller index: (1 0 1); 2θ = 6.8°). Considering the spacing set by this reflection (ca. 13 Å), it originates from the interplanar distance established by BDC and NH2BDC linkers between the titanium clusters.45 Therefore, the appearance of this broad peak seems to be partially related to the interconnection of clusters through the organic linkers.
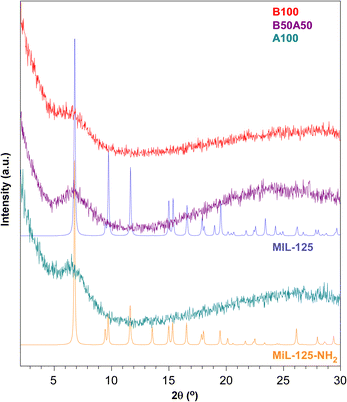 | ||
| Fig. 2 PXRD patterns of B100, B50A50 and A100 in comparison with the simulated PXRD patterns of MIL-125 and MIL-125-NH2. | ||
The chemical characterization of the samples was completed by X-ray photoelectron spectroscopy (XPS). The complete survey spectrum for B100 is shown in Fig. 3a, while Fig. 3b–d shows he high-resolution spectra of each observed element with component deconvolution. Through this analysis, it was possible to identify the distinct 2p peaks of titanium(IV), namely 2p3/2 and 2p1/2, at binding energies of 458.9 and 464.6 eV, respectively. Additionally, three satellite peaks were observed, which align well with the literature data for MOFs containing Ti8O8-type clusters exhibiting a hexacoordinated TiO6 environment.18 The expected C 1s and O 1s peaks of the organic ligands are also observed. The two C 1s peaks at 288.4 eV and 284.6 eV are related precisely to O–C![[double bond, length as m-dash]](https://www.rsc.org/images/entities/char_e001.gif) O and C–C/C–H groups, respectively,46 while the peak observed at around 531 eV can be attributed to the presence of two oxygen 1s environments. Their deconvoluted peaks are located at 528 and 532 eV, respectively, and they may correspond to the contributions from Ti/carboxylate and Ti/oxide/hydroxide ensembles, as can be extracted from previous analysis in the literature.47
O and C–C/C–H groups, respectively,46 while the peak observed at around 531 eV can be attributed to the presence of two oxygen 1s environments. Their deconvoluted peaks are located at 528 and 532 eV, respectively, and they may correspond to the contributions from Ti/carboxylate and Ti/oxide/hydroxide ensembles, as can be extracted from previous analysis in the literature.47
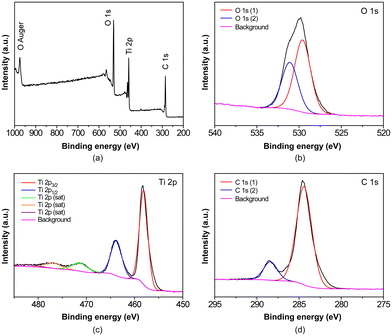 | ||
| Fig. 3 (a) XPS full spectrum and high-resolution spectra for (b) O 1s, (c) Ti 2p and (d) C 1s peaks of the B100 sample, where sat refers to characteristic satellite peaks. | ||
3.2. Microstructural characterization
The microstructure of the obtained materials was investigated using cryogenic transmission electron microscopy (cryoTEM) performed on hydrogels, as shown in Fig. 4. This technique enables the freezing of the system in its wet gel state,48 thereby preventing potential microstructural alterations because of solvent evacuation. Accordingly, the cryoTEM micrographs reveal the microstructure of the pristine MOGs, which consist of metal–organic nanoparticles that are smaller than 5 nm. These nanoparticles are intertwined within a meso- and macroporous microstructured network (as shown below), resulting in a substantial external surface area for the material.To obtain further microstructural details, N2 adsorption measurements were conducted at 77 K on supercritically dried aerogels, as mentioned before, to avoid the porous structure collapsing due to conventional solvent removal. Fig. 5 shows the isotherms for each sample, and Table 3 provides a summary of the extracted adsorption data. All samples exhibit type II/IV isotherms according to the IUPAC classification.49 They exhibit a narrow hysteresis loop at relatively high pressure (p/p° > 0.8), which is characteristic of materials with a combined contribution of mesopores and macropores. This observation is consistent with the microstructural features observed in the cryoTEM images. The BET surface area values range from 408 to 604 m2 g−1. These surface areas can be considered relatively high compared to other aerogel systems,50 owing to the small particle size and light-weight nature of titanium. The total pore volumes range from 0.926 to 1.706 cm3 g−1 for pores smaller than 50 nm (i.e., micro-/mesopores). According to the data obtained from t-plot analysis, the microporosity contributes only minimally to the total surface area and pore volume of the materials. This can be attributed to the lack of crystallinity in the materials. Additional SEM measurements were also conducted on the prepared aerogels (see Fig. S9‡), revealing a certain degree of agglomeration (aggregates: 15–20 nm) of the pristine metal–organic nanoparticles observed by cryoTEM during the supercritical drying process. This observation highlights the importance of directly measuring the hydrogel to truly understand the microstructure of the employed materials during the HER experiments, wherever possible.
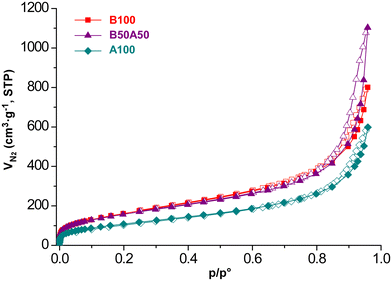 | ||
| Fig. 5 Nitrogen adsorption isotherms (77 K) for supercritically dried Ti/BDC/NH2BDC-based MOGs. Closed symbols for adsorption curves and open symbols for desorption curves. | ||
| Sample | S BET (m2 g−1) | S micro (m2 g−1) | S ext (m2 g−1) | V micro (cm3 g−1) | V meso (cm3 g−1) |
|---|---|---|---|---|---|
| a S BET stands for BET specific surface area. Micropore surface area (Smicro) and volume (Vmicro) are estimated from the t-plot calculation. External surface area is calculated by subtracting the microporous contribution from the total area (Sext = SBET − Smicro) and Vmeso is obtained by subtracting the contribution of micropore volume to the pore volume for pores ≤50 nm. | |||||
| B100 | 604 | 42 | 562 | 0.012 | 1.226 |
| B50A50 | 580 | 60 | 520 | 0.023 | 1.683 |
| A100 | 408 | 8 | 400 | 0 | 0.926 |
3.3. Optical properties
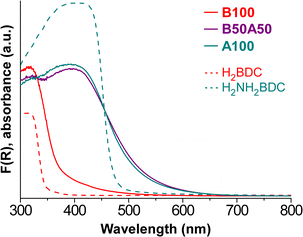
UV–vis diffuse reflectance spectroscopy (DRS) was carried out on the samples to analyse their optical properties before conducting the light-induced HER experiments. The Kubelka–Munk function36,37 was employed to process the data and represent the UV–vis absorbance spectra (Fig. 6). It can be noted that the sample containing the BDC linker exhibits slight absorption in the range of 400–450 nm, followed by a significant increase in the UV region, at around 370 nm. On the other hand, the inclusion of the NH2BDC chromophore linker in B50A50 and A100 samples enables the material to begin absorbing in the 600–550 nm range, with a sharp rise at 500 nm. Comparing the obtained UV–vis DRS data with the literature data for the chemically analogous but crystalline MOFs, MIL-125 and MIL-125-NH2, some small differences in absorption behaviour can be observed. Specifically, MIL-125 and MIL-125-NH2 exhibit sharper absorption edges at 350 nm and 500 nm, respectively,51 similar to the spectra of the respective neat organic ligands (dashed lines in Fig. 6). Note that differences between MOF and MOG materials can likely be attributed to the crystalline order of the former.23 Additionally, the greater presence of defects in MOG systems, as mentioned earlier, seems to play a crucial role in the absorption properties of the materials and broadens their absorption range. This aspect will be further observed when analyzing the HER results in a subsequent section. The optical band gaps of the MOGs were determined from the DRS data using the Tauc method (Fig. S12‡), with the results shown in Table 4.| Sample | E g (eV) | |
|---|---|---|
| Direct | Indirect | |
| B100 | 3.50 | 3.07 |
| B50A50 | 2.55 | 2.01 |
| A100 | 2.58 | 2.09 |
3.4 Platinum-doped MOGs
The platinum content of the post-synthetically modified MOGs was determined using X-ray fluorescence spectroscopy. Table 5 shows the platinum content obtained for each doped MOG sample. Pt@B100 exhibited the smallest amount of platinum (wtPt/wtMOG: 0.1%), whereas the incorporation of NH2BDC into the network led to an increase in the doping content (0.5% and 0.6% in B50A50 and A100, respectively). It seems that the presence of the amino group facilitates the incorporation of platinum into the metal–organic network. Previous studies conducted with MOFs have identified the amino group as the primary adsorptive binding site for the uptake of Pd(II) and Pt(IV).52 In any case, these Pt loadings represent only half of the targeted ratio established during the doping process, which was set at 1% (wtPt/wtMOG).| Sample | Relative Ti content (wtM%) | Relative Pt content (wtM%) | Pt content in MOG (wtMOG%) |
|---|---|---|---|
| Pt@B100 | 99.60 | 0.40 | 0.1 |
| Pt@B50A50 | 98.48 | 1.52 | 0.5 |
| Pt@A100 | 98.04 | 1.96 | 0.6 |
As a representative case, the PXRD analysis of Pt@B100 reveals a similar diffraction pattern to that of B100, without any additional peak (Fig. 7a). Furthermore, the microstructure of the gel remains unchanged after platinum doping, as evidenced by the results of high-angle annular dark-field scanning transmission electron microscopy (HAADF-TEM, Fig. 7c). The elemental mapping analysis shows a uniform and homogeneous distribution of platinum throughout the metal–organic porous microstructure (Fig. 7d). Moreover, the N2 adsorption isotherm (Fig. 7b) shape and the derived data, including the specific surface area (SBET = 617 m2 g−1) and total pore volume (VT = 1.73 cm3 g−1 at p/p° = 0.96), are comparable to that of the parent sample described earlier. Similarly, DRS-UV–vis was also carried out on Pt@B100 samples, showing absorption spectra similar to those of neat B100 (Fig. S11‡). These findings indicate that the introduction of platinum does not significantly alter the porous structure and absorption properties of pristine MOGs.
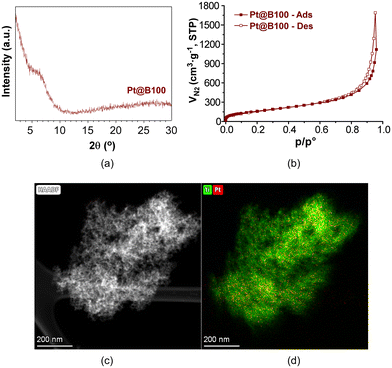 | ||
| Fig. 7 (a) PXRD, (b) N2 adsorption isotherm, (c) HAADF-TEM micrograph and (d) Ti and Pt element mapping of Pt@B100 aerogel. | ||
3.5. X-ray absorption fine structure spectroscopy
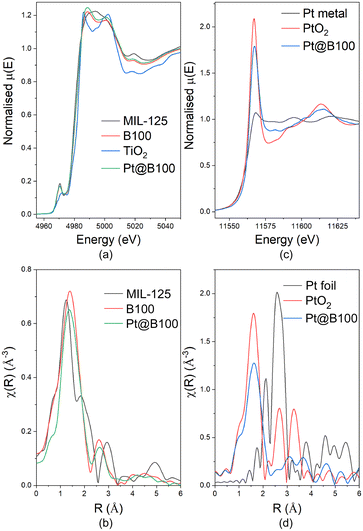
To further assess the local structure of the MOGs before and after the doping process, X-ray absorption fine structure spectroscopy (XAFS, a combination of XANES and EXAFS) of B100 and Pt@B100 was carried out at the Ti K-edge and Pt L3-edge (Fig. 8). For comparative purposes, Ti K-edge XAS measurements were also performed on a MIL-125 MOF reference (prepared as a polycrystalline sample through a previously reported synthesis procedure53) and on a TiO2 standard, while comparative measurements on PtO2 and metallic Pt foil were performed for the Pt L3-edge.The XANES results at the Ti K-edge indicate that the Ti oxidation state in all three metal–organic samples is +4, as evidenced by the main absorption edge at 4980 eV that coincides with the TiO2 standard (Fig. 8a). However, a closer examination reveals that both B100 and Pt@B100 show similar XANES fingerprint spectra in the energy range of 4985–5015 eV, whereas the MOF reference shows some slight variations that suggest deviations in the local structure of the MOGs. Despite that, all of them exhibit rather similar distorted coordination geometry, as inferred from the consistent intensity of the single and sharp pre-edge peak (4970 eV). It is worth noting that, in contrast to MIL-125-type MOFs, in the inorganic titanium(IV) oxide, the pre-edge peak appears split into three minor peaks.54
The fast damping of k2-weighted EXAFS spectral oscillations obtained after bare atom background subtraction at the Ti K-edge and the Pt L3-edge as shown in Fig. S10‡ indicates lack of long-range ordering. The Fourier transform spectra (Fig. 8b and d) support the existence of short-range ordering in the samples. This is also evident from the low amplitude of the second coordination peak observed for both B100 and Pt@B100. The fitting results are given in the ESI (Fig. S10 and Table S4‡). Specifically, in MIL-125 the first peak (1.23 Å) and second peak (2.0 Å) correspond to Ti–O interactions in the first coordination shell (mean-fitted Ti–O distance: 1.83 Å), that implies the O atoms from μ-O/μ-OH and carboxylate groups, respectively. The linked Ti⋯Ti environment is evidenced as a shoulder that corresponds to the Ti⋯Ti distance of 2.59 Å.20,55 In B100 and Pt@B100 the contributions of Ti–O interactions appear at relatively larger bond lengths (1.88 Å) and the second coordination peak ascribable to Ti⋯Ti contacts has a very small amplitude and it appears at somewhat higher values. Previous works have ascribed these displacements from the reference MOF structure to ligand vacancies replaced by either OH−/H2O ensembles or monocarboxylic co-ligands (RCOO−),20 but other structural defects or distortions in the titanium-oxo cluster can also cause these observed changes. Note that the similar shape of the Fourier transform EXAFS spectra of B100 and Pt@B100 indicates that the post-synthetic metalation has not meaningfully altered the metal–organic structure.
Fig. 8c and d compares the Pt L3-edge XANES spectrum and the Fourier transform EXAFS spectrum of Pt@B100 with those provided by platinum(IV) oxide and metallic Pt. The XANES spectrum of Pt@B100 shows similarities to platinum(IV) oxide, suggesting the presence of Pt ions in a +4 oxidation state. However, a slightly lower intensity of the white line peak at 11![[thin space (1/6-em)]](https://www.rsc.org/images/entities/char_2009.gif) 567 eV also indicates the coexistence of a small amount of metallic Pt.56 This might suggest that part of the incorporated platinum has been reduced during the post-synthetic metalation reaction, even though it could not be detected by PXRD and XPS due to the low concentration of this element. The fitting was done assuming two coordination environments: first a Pt–O and second a Pt⋯Pt environment. The Pt–O and Pt⋯Pt scattering paths were taken from the crystal structure of PtO2 and Pt, respectively (Fig. S10 and Table S4‡). The Fourier transform EXAFS spectrum suggests a mixture of Pt–O and Pt–Pt bonding with the major component similar to metal oxide and a very small contribution from metallic Pt.
567 eV also indicates the coexistence of a small amount of metallic Pt.56 This might suggest that part of the incorporated platinum has been reduced during the post-synthetic metalation reaction, even though it could not be detected by PXRD and XPS due to the low concentration of this element. The fitting was done assuming two coordination environments: first a Pt–O and second a Pt⋯Pt environment. The Pt–O and Pt⋯Pt scattering paths were taken from the crystal structure of PtO2 and Pt, respectively (Fig. S10 and Table S4‡). The Fourier transform EXAFS spectrum suggests a mixture of Pt–O and Pt–Pt bonding with the major component similar to metal oxide and a very small contribution from metallic Pt.
3.6 Photocatalytic hydrogen production performance
Photocatalytic H2 production experiments were conducted under simulated solar irradiation using prepared metal–organic hydrogels as catalysts. An aqueous solution containing 0.1 M triethanolamine (TEOA) at pH = 7.0 as a sacrificial electron donor was employed. The experiments were conducted for a duration of 16 h. Fig. 9a shows the cumulative hydrogen production over the course of the reaction for pristine gels, both with and without the addition of H2PtCl6 (1% wtPt/wtMOG) as co-catalyst.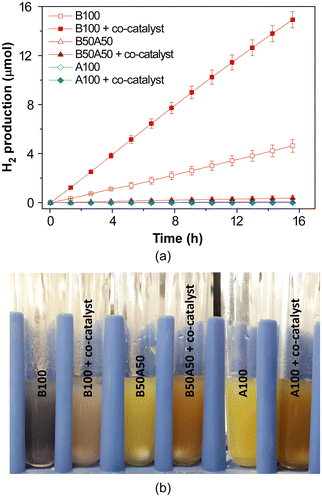 | ||
| Fig. 9 (a) Photocatalytic H2 generation in neat MOGs with and without 1% wtPt/wtMOG of H2PtCl6 as co-catalyst and (b) appearance of gels after HER experiments. | ||
The B100 sample without Pt as co-catalyst achieved a production of 4.6 ± 0.5 μmol of H2 after the 16-h irradiation, exhibiting an average activity of 56 ± 5 μmolH2 gMOG−1 h−1. The addition of H2PtCl6 facilitated an increase in H2 production to 15 ± 1 μmol, accompanied by an enhanced activity of 227 ± 11 μmolH2 gMOG−1 h−1. Blank experiments performed under current reaction conditions, in the absence of MOG but using H2PtCl6 or Pt nanoparticles, did not produce any measurable amount of H2.
Interestingly, the MOG containing NH2BDC as the linker (A100) did not yield hydrogen, while the gel based on a mixture of both bridging ligands (B50A50) produced a rather small amount of hydrogen, in both cases irrespective of the addition of the co-catalyst. Therefore, the inclusion of the amino-functionalised linker appears to impede photocatalytic hydrogen production under the specific experimental conditions employed in this study, despite the enhanced light absorption properties of the materials in the visible region.
In this context, it is important to consider that the photocatalytic mechanism in these types of metal–organic assemblies typically occurs through a ligand-to-metal charge transfer (LMCT) process. In this process, an electron from the highest occupied molecular orbital (HOMO), consisting of π-type orbitals of the ligand, is promoted to the metal-centred lowest unoccupied molecular orbital (LUMO), which comprises empty d orbitals of the metal.57 This phenomenon leads to spatial separation of the photoinduced charges (holes, h+, and electrons, e−), thereby prolonging their average lifetime and enabling the progression of the corresponding oxidation and reduction photoreactions. Consequently, there is an eventual reduction of Ti(IV) to Ti(III), as demonstrated in previous studies by electron paramagnetic resonance measurements.8 Additionally, the formation of Ti(III) is indicated by a change in the colour of the sample (note that light absorption induced d–d transitions in octahedral titanium(III) complexes, t2g1 eg0, that typically result in a blue-violet coloration).58
Accordingly, B100 samples without the addition of the co-catalyst (Fig. 9b) are characterised by an intense blue colour during and after light irradiation. This colour is attributed to the accumulation of Ti(III) species, which indicates that the photoreduction of water (i.e., the HER) is less favourable compared to the complementary TEOA photooxidation half-reaction. However, the blue colour gradually disappears in the post-irradiated samples as Ti(III) reverts back to Ti(IV) once the reaction concludes. In contrast, the A100 and B50A50 samples did not exhibit any noticeable colour change, which seems to indicate that eventual formation of Ti(III) is not occurring. This observation and their scarce HER performance suggest that (1) the ligand-to-metal charge transfer (LMCT) may not be active in these materials, (2) the HOMO is too high to accomplish the oxidation or (3) the lifetime of the h+/e− pair in the amino-functionalised samples is insufficient to interact with the hole scavenger (TEOA, electron donor in the photooxidation half-reaction). However, if the former two explanations were true, it would result in a performance half-way between B100 and A100 for the sample containing both ligands (B50A50), which contradicts the experimental findings. Additionally, previous studies have demonstrated that Ti-oxocluster/NH2BDC ensembles exhibit the necessary potential to carry out the oxygen evolution reaction (OER) and oxidation of sacrificial agents.18 Therefore, it is more likely that the inclusion of amino-functionalised linkers in the material leads to a reduction in the pair lifetime or promotes the recombination of electron–hole pairs.
In the case of B100 with the co-catalyst, the colour of the catalyst after irradiation shifts slightly towards a brownish hue instead of blue, indicating the formation of colloidal Pt(0) as a result of co-catalyst reduction during the photocatalytic process.59 Furthermore, this change in colour, along with the observed enhancement in hydrogen production, suggests that platinum facilitates the transfer of photoelectrons, thereby preventing the cumulative formation of Ti(III). Based on previous studies, a mechanism can be inferred, in which Ti-based metal–organic frameworks and Pt-based co-catalysts form a heterostructure that allows the spatial separation of photocharges.19 Specifically, upon light irradiation of the metal–organic entity, photoelectrons migrate to Pt, leading to the hydrogen evolution reaction (HER). The complementary oxidation reaction of the sacrificial agent is led by the holes remaining in the metal–organic network. It is worth noting that the efficiency of the co-catalyst relies on its proper contact with the catalyst to facilitate electron transfer, implying that colloidal Pt is likely deposited onto the MOG. The formation of Pt(0) was confirmed by PXRD of the MOG after the HER experiment (Fig. S14‡).
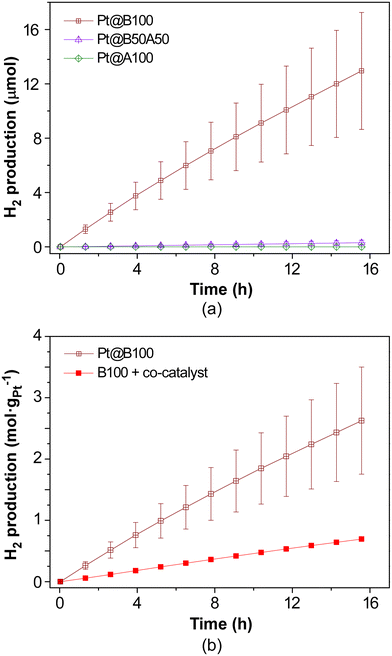
When Pt(IV)-doped samples are tested (Fig. 10a), a similar trend is observed. The Pt@B100 samples demonstrate hydrogen production comparable to that of B100 with the co-catalyst, albeit slightly lower, while Pt@B50A50 and Pt@A100 exhibit poor hydrogen production. Their coloration during and after the HER experiments is also comparable to that of neat gels when using the co-catalyst, as the presence of platinum helps in transferring the photoelectrons and prevents their accumulation in the titanium-oxo cluster. Specifically, during the investigated reaction time, Pt@B100 generates 13 ± 4 μmol of H2, with a mean activity value of 110 μmolH2 gMOG−1 h−1. The higher standard deviation in this case may be attributed to an uneven distribution of platinum within the doped-MOG, which can be crucial when working with small catalyst samples (approximately 5 mg). While this result indicates that the in situ addition of platinum offers a more controllable procedure, the reproducibility of Pt-doped samples (ex situ procedure) could be enhanced by scaling up the experiments. It should be mentioned, as previously discussed, that the average amount of Pt in the doped Pt@B100 sample is 0.1% (wtPt/wtMOG), which is ten times lower than the amount of platinum added in situ in experiments using H2PtCl6 as co-catalyst. This suggests that the in situ addition of the co-catalyst results in a significant waste of platinum, as not all of the added Pt comes into contact with the photocatalyst and thus does not contribute to the photoelectron transfer and HER. Indeed, when the amount of in situ incorporated platinum in the B100 sample was analysed by XRF after recovering and cleaning the sample, it was found to be 0.5% (wtPt/wtMOG), which is meaningfully higher than that in Pt@B100 (0.1%), but lower than the in situ incorporated value (1%). This can explain the better performance in terms of activity of the in situ added co-catalyst (mean values of 227 and 110 μmolH2 gMOG−1 h−1 for B100 with the co-catalyst and Pt@B100, respectively). It also indicates that the in situ doping process using light irradiation is more efficient.
However, when estimating the HER activity per unit mass of Pt incorporated into the MOG (Fig. 10b), Pt@B100 demonstrates significantly improved performance (45 and 110 mmolH2 gPt−1 h−1 for B100 with the co-catalyst and Pt@B100, respectively). Therefore, the functionalization of the MOG through post-synthetic modification appears to offer a more efficient utilization of Pt compared to its in situ addition to the reaction media, although a smaller amount is incorporated. This observation could be attributed to either (1) a less uniform distribution of platinum within the MOG in the in situ addition process or (2) an excess of platinum being present (i.e., more than what is required to handle the photogenerated charges). In this regard, the HAADF-TEM images obtained after the reaction on the MOG with the in situ added co-catalyst reveal that platinum accumulates in particles of larger size (5.4 ± 0.5 nm; Fig. 11) compared to Pt@B100 (1.6 ± 0.3 nm; Fig. 7). Thus, the pre-HER post-synthetic modification of the MOG appears to result in a finer distribution of Pt, which accounts for the enhanced activity per Pt content for Pt@B100.
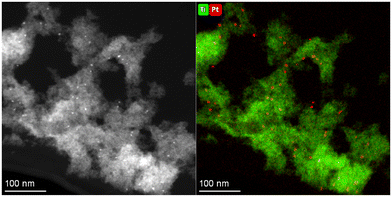 | ||
| Fig. 11 HAADF-TEM micrograph and Ti and Pt element mapping taken on B100 after HER experiment using H2PtCl6 as co-catalyst. | ||
To conclude the photocatalytic HER experiments, a final series of tests were conducted using UV filters for B100 (with and without H2PtCl6 as co-catalyst, 1% wPt/wMOG), as well as Pt@B100 photocatalytic materials. In these experiments, a UV filter was employed to exclusively irradiate the system with visible light (λ > 400 nm) emitted by the solar simulator. After 16 h of irradiation, HER yields exhibited a similar trend as that mentioned above (showing H2 production of 9.1 μmol, 23.2 μmol and 14.5 μmol for B100, B100 with the co-catalyst, and Pt@B100, respectively), but surprisingly, the hydrogen production activity surpassed that achieved when utilizing the full emission spectra provided by the lamp (representing the overall solar spectrum) in all three cases (Fig. 12).
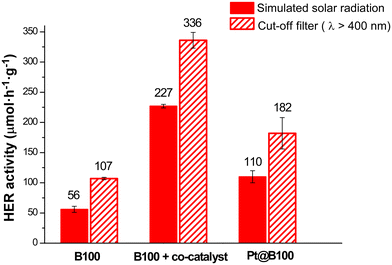 | ||
| Fig. 12 Photocatalytic HER activity per MOG mass for neat and doped BDC-based MOGs under simulated solar light or visible (400 nm cut-off filter) irradiation. | ||
At this point, it is worth considering that the absorption of UV light is attributed to ligand–ligand transitions in the BDC and metal–metal transitions in the cluster. The absorption observed in the visible region (Fig. 6) is thus ascribed to LMCT, which, according to previous studies, governs the HER mechanism.19 The photoelectrons promoted to higher energy levels upon UV absorption do not necessarily contribute to the photoreduction process and may instead undergo other radiative or non-radiative decay pathways. In this scenario, assuming an excess of photons reaching the sample, a competitive situation may arise between the absorption of visible and UV photons in the generation of photoelectrons. This would result in a decrease in HER activity compared to a situation where only visible photons are utilised.
To conclude with the analysis, if we compare the activities achieved with the values reported in the literature for catalysts based on MIL-125 and MIL-125-NH2 (40–4000 μmol g−1 h−1), it can be noted that the values obtained in this study fall within the lower range of H2 production. However, it is worth highlighting that, specifically under visible light, only the aminated or post-modified derivatives analogous MOFs exhibit activity, while the non-aminated ones require UV irradiation to produce hydrogen.23 This observation makes it interesting that the B100 metal–organic gel, composed of Ti(IV) and the BDC linker, does not only show activity but also exhibits a slight improvement in its performance exclusively under visible light irradiation.
4. Conclusions
The synthesis and characterization of titanium-based metal–organic gels (MOGs) incorporating BDC and/or NH2-BDC ligands were successfully conducted. The chemical characterization reveals a similar local structure to that of MIL-125 MOFs, but highly defective in comparison and with no long-range ordering as a consequence of the gelation process. All the systems exhibit similar microstructure, comprised of nanoscopic metal–organic particles (<5 nm) intertwined into a highly porous structure. However, only the BDC-based system has demonstrated activity for H2 production under simulated solar irradiation when using TEOA as a hole scavenger.When platinum is introduced as a co-catalyst by either adding in situ H2PtCl6 to the HER media or ex situ, through a post-synthetic metalation of the MOG structure, the H2 production is significantly enhanced. Although the in situ addition of the co-catalyst resulted in slightly higher H2 production rates (because of a higher Pt amount), it also led to greater Pt waste compared to the ex situ modified Pt(IV)-doped MOGs. These differences appear to be attributed to the final amount of co-catalyst in contact with the metal–organic network (forming a heterostructure) and the size of co-catalyst nanoparticles. Specifically, when normalized with respect to the amount of Pt anchored to the MOG, the H2 production rate of the ex situ metalated MOG surpassed that of the in situ addition, despite presenting 20% less platinum. The smaller nanoparticle size and thus, the better distribution of Pt along the matrix in Pt-doped MOGs implies more co-catalyst/metal–organic gel contacts, resulting in a more efficient utilization of the metal. This finding bears significance for maximizing the efficiency of precious-metal co-catalysts in other photocatalytic systems.
Additionally, these materials exhibit an increase in activity when a 400 nm cut-off filter was used to eliminate UV radiation from simulated solar light irradiation. This suggests a competitive interaction between visible and UV photons in the generation of photocharges, impacting catalytic activity. In this sense, previous works on Ti-based metal–organic materials have demonstrated that these types of photocatalysts can perform either better or worse under visible irradiation with respect to UV–visible illumination depending on the defects18 and could even be active only under visible light,60 which should also be taken into account for further photocatalyst development.
Author contributions
G. B., M. P.-I., and M. K. conceived the experiments. M. P.-I., M. G. A., O. C., A. L. and S. P.-Y. conducted the synthesis, characterization, and photocatalytic experiments; M. P.-I., G. B., and S. P.-Y. analysed the results. A. K. Y. and H. S. were involved in the XAFS measurements and respective data analyses. G. B. and M. P.-I. wrote the manuscript. All authors reviewed the manuscript.Conflicts of interest
There are no conflicts to declare.Acknowledgements
The authors gratefully acknowledge the financial support from the Basque Government (IT1722-22), the University of the Basque Country, UPV/EHU (EHU-N23/51) and the Spanish Ministry of Science and Innovation (grant TED2021-129810B-C22 funded by MCIN/AEI/10.13039/501100011033 and by the European Union NextGenerationEU/PRTR, grant PID2019-108028GB-C21 funded by MCIN/AEI/10.13039/501100011033 and grant PID2022-138968NB-C22 funded by MCIN/AEI/10.13039/501100011033 and by the ERDF A way of making Europe). M. P.-I. thanks the University of the Basque Country for the fellowship PIF18/175. Technical and human support provided by SGIker (UPV/EHU, MICINN, GV/EJ, and ESF) is also acknowledged. This work was supported by EPSRC through a DTA studentship to M. G. A. (EP/R51312X/1) and a capital investment grant to M. F. K. (EP/S017925/1). Ciatto Gianluca, Manish Kumar and Subhajit Nandy are acknowledged for their assistance in XAFS data collection. The experiment at the SIRIUS beamline benefited from the SOLEIL beam time allocation no. 20220322. H. S. acknowledges the EU/Interreg Aurora/Sustainable Hydrogen Project for financial support. Open Access funding provided by the University of the Basque Country is also acknowledged.References
- Y. Cui, B. Li, H. He, W. Zhou, B. Chen and G. Qian, Acc. Chem. Res., 2016, 49, 483–493 CrossRef CAS PubMed.
- H. Furukawa, K. E. Cordova, M. O'Keeffe and O. M. Yaghi, Science, 2013, 341, 6149 CrossRef PubMed.
- W. P. Lustig, S. Mukherjee, N. D. Rudd, A. V. Desai, J. Li and S. K. Ghosh, Chem. Soc. Rev., 2017, 46, 3242–3285 RSC.
- Q. Wang and D. Astruc, Chem. Rev., 2020, 120, 1438–1511 CrossRef CAS PubMed.
- Y.-B. Huang, J. Liang, X.-S. Wang and R. Cao, Chem. Soc. Rev., 2017, 46, 126–157 RSC.
- S. Rojas, A. Rodríguez-Diéguez and P. Horcajada, ACS Appl. Mater. Interfaces, 2022, 14, 16983–17007 CrossRef CAS PubMed.
- A. Dhakshinamoorthy, A. M. Asiri and H. García, Angew. Chem., Int. Ed., 2016, 55, 5414–5445 CrossRef CAS PubMed.
- J.-D. Xiao and H.-L. Jiang, Acc. Chem. Res., 2019, 52, 356–366 CrossRef CAS PubMed.
- B. Zhu, R. Zou and Q. Xu, Adv. Energy Mater., 2018, 8, 1801193 CrossRef.
- Climate Change Conference, COP27, Egipt, (n.d.). https://www.cop27.eg/ (accessed 05 July 2023).
- European Green Deal. https://commission.europa.eu/strategy-and-policy/priorities-2019-2024/european-green-deal (accessed 05 July 2023).
- L. Jiao, Y. Wang, H.-L. Jiang and Q. Xu, Adv. Mater., 2018, 30, 1703663 CrossRef PubMed.
- S. Yuan, L. Feng, K. Wang, J. Pang, M. Bosch, C. Lollar, Y. Sun, J. Qin, X. Yang, P. Zhang, Q. Wang, L. Zou, Y. Zhang, L. Zhang, Y. Fang, J. Li and H. Zhou, Adv. Mater., 2018, 30, 1704303 CrossRef PubMed.
- S. Yuan, J.-S. Qin, C. T. Lollar and H.-C. Zhou, ACS Cent. Sci., 2018, 4, 440–450 CrossRef CAS PubMed.
- M. A. Nasalevich, M. van der Veen, F. Kapteijn and J. Gascon, CrystEngComm, 2014, 16, 4919–4926 RSC.
- N. Kolobov, M. G. Goesten and J. Gascon, Angew. Chem., Int. Ed., 2021, 60, 26038–26052 CrossRef CAS PubMed.
- S. Remiro-Buenamañana, M. Cabrero-Antonino, M. Martínez-Guanter, M. Álvaro, S. Navalón and H. García, Appl. Catal., B, 2019, 254, 677–684 CrossRef.
- M. Cabrero-Antonino, J. Albero, C. García-Vallés, M. Álvaro, S. Navalón and H. García, Chem. – Eur. J., 2020, 26, 15682–15689 CrossRef CAS PubMed.
- J. Wang, A. S. Cherevan, C. Hannecart, S. Naghdi, S. P. Nandan, T. Gupta and D. Eder, Appl. Catal., B, 2021, 283, 119626 CrossRef CAS.
- L. Pukdeejorhor, S. Wannapaiboon, J. Berger, K. Rodewald, S. Thongratkaew, S. Impeng, J. Warnan, S. Bureekaew and R. A. Fischer, J. Mater. Chem. A, 2023, 11, 9143–9151 RSC.
- Y. An, B. Xu, Y. Liu, Z. Wang, P. Wang, Y. Dai, X. Qin, X. Zhang and B. Huang, ChemistryOpen, 2017, 6, 701–705 CrossRef CAS PubMed.
- X. Zhang, Z. Chen, Y. Luo, X. Han, Q. Jiang, T. Zhou, H. Yang and J. Hu, J. Hazard. Mater., 2021, 405, 124128 CrossRef CAS PubMed.
- Y. Horiuchi, T. Toyao, M. Saito, K. Mochizuki, M. Iwata, H. Higashimura, M. Anpo and M. Matsuoka, J. Phys. Chem. C, 2012, 116, 20848–20853 CrossRef CAS.
- A. Angulo-Ibáñez, M. Perfecto-Irigaray, I. Merino-Garcia, N. Luengo, A. M. Goitandia, J. Albo, E. Aranzabe, G. Beobide, O. Castillo and S. Pérez-Yáñez, Mater. Today Energy, 2022, 30, 101178 CrossRef.
- M. Perfecto-Irigaray, I. Merino-Garcia, J. Albo, G. Beobide, O. Castillo, A. Luque and S. Pérez-Yáñez, Mater. Today Energy, 2023, 36, 101346 CrossRef CAS.
- Z. Zhuang, Z. Mai, T. Wang and D. Liu, Coord. Chem. Rev., 2020, 421, 213461 CrossRef CAS.
- D. Vallejo-Sánchez, P. Amo-Ochoa, G. Beobide, O. Castillo, M. Fröba, F. Hoffmann, A. Luque, P. Ocón and S. Pérez-Yáñez, Adv. Funct. Mater., 2017, 27, 1605448 CrossRef.
- K. Sumida, K. Liang, J. Reboul, I. A. Ibarra, S. Furukawa and P. Falcaro, Chem. Mater., 2017, 29, 2626–2645 CrossRef CAS.
- J. M. Yassin, A. M. Taddesse and M. Sánchez-Sánchez, Appl. Surf. Sci., 2022, 578, 151996 CrossRef CAS.
- H. Liu, C. Wang, C. Liu, X. Zong, Y. Wang, Z. Hu and Z. Zhang, Dalton Trans., 2023, 52, 9705–9713 RSC.
- C. Zlotea, D. Phanon, M. Mazaj, D. Heurtaux, V. Guillerm, C. Serre, P. Horcajada, T. Devic, E. Magnier, F. Cuevas, G. Férey, P. L. Llewellyn and M. Latroche, Dalton Trans., 2011, 40, 4879–4881 RSC.
- S. Brunauer, P. H. Emmett and E. Teller, J. Am. Chem. Soc., 1938, 60, 309–319 CrossRef CAS.
- J. Rouquerol, P. Llewellyn and F. Rouquerol, in Studies in Surface Science and Catalysis, ed. P. L. Llewellyn, F. Rodriquez-Reinoso, J. Rouquerol and N. Seaton, Elsevier B.V., Amsterdam, 2007, vol. 160, pp. 49–56 Search PubMed.
- B. C. Lippens and J. H. Boer, J. Catal., 1965, 4, 319–323 CrossRef CAS.
- F. Rouquerol, J. Rouquerol and K. Sing, Adsorption by powders and porous solids. Principles, methodology and applications, Elsevier, 1999 Search PubMed.
- F. Kubelka and A. Munk, Z. Technol. Phys., 1931, 12, 593–599 Search PubMed.
- P. Makuła, M. Pacia and W. Macyk, J. Phys. Chem. Lett., 2018, 9, 6814–6817 CrossRef PubMed.
- G. Ciatto, M. H. Chu, P. Fontaine, N. Aubert, H. Renevier and J. L. Deschanvres, Thin Solid Films, 2016, 617, 48–54 CrossRef CAS.
- G. Ciatto, N. Aubert, M. Lecroard, C. Engblom, P. Fontaine, J.-M. Dubuisson, Y.-M. Abiven, P.-E. Janolin, J.-M. Kiat, Y. Dumont, B. Berini, A. Fouchet and N. Keller, J. Synchrotron Radiat., 2019, 26, 1374–1387 CrossRef CAS PubMed.
- G. Ciatto, F. D'Acapito, F. Boscherini and S. Mobilio, J. Synchrotron Radiat., 2004, 11, 278–283 CrossRef CAS PubMed.
- B. Ravel and M. Newville, J. Synchrotron Radiat., 2005, 12, 537–541 CrossRef CAS PubMed.
- J. Łuczak, M. Kroczewska, M. Baluk, J. Sowik, P. Mazierski and A. Zaleska-Medynska, Adv. Colloid Interface Sci., 2023, 314, 102864 CrossRef PubMed.
- M. Taddei, G. M. Schukraft, M. E. A. Warwick, D. Tiana, M. J. McPherson, D. R. Jones and C. Petit, J. Mater. Chem. A, 2019, 7, 23781–23786 RSC.
- N. Landaluce, M. Perfecto-Irigaray, J. Albo, G. Beobide, O. Castillo, A. Irabien, A. Luque, A. S. J. Méndez, A. E. Platero-Prats and S. Pérez-Yáñez, Sci. Rep., 2022, 12, 8505 CrossRef CAS PubMed.
- A. P. Smalley, D. G. Reid, J. C. Tan and G. O. Lloyd, CrystEngComm, 2013, 15, 9368–9371 RSC.
- M. Smith, L. Scudiero, J. Espinal, J.-S. McEwen and M. Garcia-Perez, Carbon, 2016, 110, 155–171 CrossRef CAS.
- R. R. Solís, A. Gómez-Avilés, C. Belver, J. J. Rodriguez and J. Bedia, J. Environ. Chem. Eng., 2021, 9, 106230 CrossRef.
- J. P. Patterson, Y. Xu, M.-A. Moradi, N. A. J. M. Sommerdijk and H. Friedrich, Acc. Chem. Res., 2017, 50, 1495–1501 CrossRef CAS PubMed.
- M. Thommes, K. Kaneko, A. V. Neimark, J. P. Olivier, F. Rodriguez-Reinoso, J. Rouquerol and K. S. W. Sing, Pure Appl. Chem., 2015, 87, 1051–1069 CrossRef CAS.
- J. Santos-Lorenzo, R. San José-Velado, J. Albo, G. Beobide, P. Castaño, O. Castillo, A. Luque and S. Pérez-Yáñez, Microporous Mesoporous Mater., 2019, 284, 128–132 CrossRef CAS.
- C. H. Hendon, D. Tiana, M. Fontecave, C. Sanchez, L. D'Arras, C. Sassoye, L. Rozes, C. Mellot-Draznieks and A. Walsh, J. Am. Chem. Soc., 2013, 135, 10942–10945 CrossRef CAS PubMed.
- C. R. Lim, S. Lin and Y. S. Yun, J. Hazard. Mater., 2020, 387, 121689 CrossRef CAS PubMed.
- M. Dan-Hardi, C. Serre, T. Frot, L. Rozes, G. Maurin, C. Sanchez and G. Férey, J. Am. Chem. Soc., 2009, 131, 10857–10859 CrossRef CAS PubMed.
- X.-Y. Ji, Y.-Y. Wang, Y. Li, K. Sun, M. Yu and J. Tao, Nano Res., 2022, 15, 6045–6053 CrossRef CAS.
- Y. Song, Z. Li, P. Ji, M. Kaufmann, X. Feng, J. S. Chen, C. Wang and W. Lin, ACS Catal., 2019, 9, 1578–1583 CrossRef CAS.
- Y. Lei, Y. Wang, Y. Liu, C. Song, Q. Li, D. Wang and Y. Li, Angew. Chem., Int. Ed., 2020, 59, 20794–20812 CrossRef CAS PubMed.
- R. Li, W. Zhang and K. Zhou, Adv. Mater., 2018, 30, 1705512 CrossRef PubMed.
- Y. Fu, D. Sun, Y. Chen, R. Huang, Z. Ding, X. Fu and Z. Li, Angew. Chem., Int. Ed., 2012, 51, 3364–3367 CrossRef CAS PubMed.
- G. Marzun, C. Streich, S. Jendrzej, S. Barcikowski and P. Wagener, Langmuir, 2014, 30, 11928–11936 CrossRef CAS PubMed.
- A. Angulo-Ibáñez, N. Luengo, E. Aranzabe, G. Beobide, O. Castillo, A. M. Goitandia, S. Pérez-Yáñez, M. Perfecto-Irigaray and A. Villamayor, New J. Chem., 2022, 46, 16192–16202 RSC.
Footnotes |
| † Parts of this work are included in the PhD thesis of M. Perfecto-Irigaray (Title: Metal–organic porous materials for carbon dioxide valorization, water adsorption and photocatalytic hydrogen production, 2023), which is available at addi.ehu.es, the institutional digital repository of the University of the Basque Country. |
| ‡ Electronic supplementary information (ESI) available: Including data on reagents and solvents employed, characterization methodology, 1H-NMR, TGA, FTIR and SEM data, defective formula calculations, and additional XAFS, DRS and HER experimental data. See DOI: https://doi.org/10.1039/d4dt00880d |
| This journal is © The Royal Society of Chemistry 2024 |

