 Open Access Article
New series of mononuclear β-diketonate cerium(III) field induced single-molecule magnets†
Ànnia
Tubau
a,
Silvia
Gómez-Coca
 *ab,
Saskia
Speed
a,
Mercè
Font-Bardía
c and
Ramon
Vicente
 *a
*a
aDepartament de Química Inorgànica i Orgànica, Universitat de Barcelona, Martí i Franquès 1-11, 08028 Barcelona, Spain. E-mail: rvicente@ub.edu
bInstitut de Química Teòrica i Computacional, Universitat de Barcelona, Diagonal 645, 08028 Barcelona, Spain
cDepartament de Mineralogia, Cristal lografia i Dipòsits Minerals and Unitat de Difracció de R-X. Centre Científic i Tecnològic de la Universitat de Barcelona (CCiTUB), Universitat de Barcelona, Solé i Sabarís 1-3, 08028 Barcelona, Spain
First published on 8th May 2024
Abstract
Five new β-diketonate Ce3+ mononuclear complexes, [Ce(Btfa)3(H2O)2] (1), [Ce(Btfa)3(phen)] (2), [Ce(Btfa)3(bipy)] (3), [Ce(Btfa)3(terpy)] (4) and [Ce(Btfa)3(bathophen)(DMF)] (5), where Btfa− = 4,4,4-trifluoro-1-phenyl-1,3-butanedionate, phen = 1,10-phenanthroline, bipy = 2,2′-bipyridyl, terpy = 2,2′:6′,2′′-terpyridine and bathophen = 4,7-diphenyl-1,10-phenanthroline, have been synthesized and structurally characterized through X-ray diffraction of single crystals. The central Ce3+ atom displays a coordination number of 8 for 1, 2 and 3 and of 9 for 4 and 5. Under a 0 T external magnetic field, none of the given compounds exhibits single molecule magnet (SMM) behaviour. However, a small magnetic field, between 0.02 and 0.1 T, is enough for all the compounds to exhibit slow relaxation of the magnetization. A comprehensive magnetic analysis, with experimental magnetic data and ab initio calculations, was undertaken for all the complexes, and the study highlights the significance of the different spin relaxation mechanisms that must be considered for a Ce3+ lanthanide ion.
Introduction
Magnetically bistable molecules that exhibit slow relaxation of the magnetization below a critical temperature, TB, are named single molecule magnets (SMMs). The energy barrier separating the two bistable magnetic states is named the effective energy barrier (Ueff) and, for transition metal compounds, it is described by the magnetic anisotropy (D) and the square of the overall ground spin state (S): Ueff = |D|·S2 or Ueff = |D|·(S2 − 1/4) for integer and non-integer S values respectively. The first molecular system for which single-molecular magnet type behaviour was observed was the mixed valence dodecanuclear Mn12 cluster with the formula [Mn12O12(CH3COO)16(H2O)4] in 1993,1 previously reported in 1980.2 At the end of the twentieth century, efforts to obtain new SMMs with higher TB and Ueff centred on transition metal clusters.3 SMM systems show very interesting properties and could be used in many potential applications such as memory storage.3,4 After a plethora of 3d metal clusters were studied, the field of single molecule magnets moved onto lanthanide(III) ions, starting with the mononuclear Tb(III) phthalocyaninato-based double-decker complex [TbPc2]− (Pc = phthalocyanine). It showed SMM behaviour and it was isolated in 2003 by N. Ishikawa et al.5 Due to the shielding of the 4fn electrons by the filled 5s2 and 5p6 orbitals, the interaction between the lanthanide ion and the donor atoms can be considered as electrostatic in nature. Consequently, lanthanide ions have unquenched orbital angular momentum (L) that leads to strong spin–orbit coupling and therefore, intrinsic magnetic anisotropy; this makes them good candidates for SMMs. Mononuclear SMMs, also called single ion magnets (SIMs), are mononuclear systems that show slow relaxation of the magnetization.6–13 In lanthanides, the intrinsic magnetic anisotropy that the ions show is a key factor determining the magnetic properties of lanthanide(III) compounds, but the crystal field effect has relevance in the modulation of such anisotropy to tune the magnetic properties depending on the electron density of the mj ground state. Rinehart and Long14 revealed that the electron density of the mj ground state could be oblate (equatorially extended) or prolate (axially extended). For instance, in the [TbPc2]− compound, the donor atoms of the ligand are located in the axial positions leading to an axial stressed coordination environment that enhances magnetic anisotropy on the easy axis leading to a good SMM performance of this Tb3+ compound with an oblate mj ground state.5In the design of SMMs, heavy metal lanthanides such as Tb3+, Dy3+ and Er3+ ions have been extensively used because of their large magnetic and angular momentum J, where J = L + S for half-filled Ln3+ ions, and consequently large magnetic anisotropy. Indeed, a rapid overview of the literature on lanthanide-based SMMs shows that most of the scientific production on this subject is related to Dy3+, Tb3+ and Er3+ based species, with Dy3+ being the most popular.3,6–13 For instance, the mononuclear dysprosium complex [(CpiPr5)Dy(Cp*)][B(C6F5)4], where CpiPr5 = pentaisopropylcyclopentadienyl and Cp* = pentamethylcyclopentadienyl, was shown to exhibit the highest reported blocking temperature of 80 K.10,11,15 Still, the most relevant permanent magnets that are employed in industry are the ones based on light lanthanide ions, including the NdFeB and SmCo5 ferromagnets.16 In this sense, the number of reported lanthanide-based SMMs of light lanthanides such as Ce3+ or Nd3+ ions is much smaller than those mentioned above.17 Focusing on cerium(III), its electronic configuration is 4f1 with a 2F5/2 ground state and in some Ce3+ compounds magnetic relaxation can be observed because the spin–orbit effect of the 4f1 electron can create non-negligible magnetic anisotropy.
When the Ce3+ ion (2F5/2 ground state) is set in a coordination complex, the spin–orbit coupling component (J) splits into (2J + 1) ±mj states: +J, +J − 1,…, −J + 1, −J, due to the crystal field: ± 5/2, ± 3/2 and ±1/2. For Ce3+ compounds the goal would be to choose the ideal coordination environment around the lanthanide ion to yield an axial geometry that would stabilize the mj = ±5/2 Kramers doublet (KD) with an oblate 4f-shell electron density distribution as the ground state and destabilize the prolate electron distribution, mj = ±1/2 and ±3/2 states. Such systems would lead to a reduced quantum tunneling of magnetization (QTM) effect with anisotropic barriers higher in energy (reduced mj mixing) and, in principle, improve the SMM performance.14,18,19 Regarding β-diketonate systems, two series of mononuclear Ce3+ β-diketonate complexes with N-donor auxiliary ligands are found in the literature, Table S1.† First, 1,1,1-trifluoro-5,5-dimethyl-2,4-hexadione (Hfdh) led to the [Ce(fdh)3(bpy)] compound with D4d symmetry.20 Based on the 4,4,4-trifluoruro-1-(naphthalene-2-yl)butane-1,3-dionato (ntfa) β-diketonate ligand, we recently published a series of compounds: [Ce(ntfa)3(MeOH)2], [Ce(ntfa)3(5,5′-Me2bipy)] and [Ce(ntfa)3(bipy)2], with field induced SIM behavior and D2d, D2d and C2v point group symmetries, respectively.21 For these mononuclear Ce3+ β-diketonate complexes, ab initio calculations at zero field on the electron gyromagnetic ratio (g tensor) for each mj state were described. Easy axial anisotropy was found (gxx and gyy < gzz) through the calculations, which demonstrated that the effective g tensor of the ground doublet presented considerable transverse contributions (gxx and gyy) that led to the ground state wavefunction |±5/2〉 mixed with |±1/2〉 and |±3/2〉 from the other excited mj doublets.
Otherwise, the only Ce3+ compound showing SMM behavior to date is the trinuclear Zn–Ce–Zn compound prepared from an o-vanillin Schiff base based ligand.22 For this heterometallic compound, gzz yielded 4.06 from ab initio calculations; this is close to the theoretical value of 4.28 for a pure mj = ±5/2 Kramers doublet, gzz = 2gjmj.23 From the measured high-field electron paramagnetic resonance (HF-EPR) spectrum, gzz is 3.27, which is assigned to the ground state of mj = 5/2 KD with slight mixing of the mj = 1/2 pair. Nevertheless, two mononuclear Ce3+ metallocene compounds, [Ce(Cpttt)2{(C6F5-k1-F)B(C6F5)3}] and [Ce(Cpttt)2Cl], are found in the literature where the gzz axial component obtained by multiconfigurational analysis shows even higher values than the trinuclear Zn–Ce–Zn SMM compound, with values up to 4.16 and 4.22, respectively, and a ground state wavefunction of 100% |±5/2〉 for the first compound.24 The two Cpttt groups placed in the axial positions of the lanthanide cation and the low equatorial interactions of the [B(C6F5)4]− and Cl− anions, led to Ce3+ centers in an axial stressed symmetry. Furthermore, for these organometallic compounds, the EPR measurements were recorded and the experimental geff values were close to the computed ones. However, despite the calculated gzz values being near 4.28, these compounds only showed slow relaxation of the magnetization when applying an external magnetic field of 1000 Oe. The other mononuclear cerium compounds found in the literature showing slow relaxation of the magnetization under an external Hdc, according to ab initio calculations, resulted from axial symmetry but with a considerable rhombic contribution to the ground state. Their magnetic properties are compiled in Tables S1 and S2.†![[thin space (1/6-em)]](https://www.rsc.org/images/entities/char_2009.gif) 25–29 A similar result was found for the dinuclear Ce3+ compound [Ce2(RR-L)2(μ-Cl)6], where L is 1,4,7,10-tetrakis(2-pyridylmethyl)-1,4,7,10-tetraaza-cyclododecane, Table S3.†30 In addition, the natural isotopes of Ce3+ do not have nuclear spin; this results in clearer and easier to interpret EPR spectra. Interestingly, in the studies published where EPR was also measured for the Ce3+ compounds, the gxx, gyy and gzz experimental values were in good agreement with the computational experiments.22,24,25,30 At the moment, as far as we know, pure Ising type axial anisotropy (gz = 4.28) has not been found in the computational calculations nor in EPR measurements for any of the Ce3+ compounds found in the literature. It is worth noting that slow relaxation of the magnetization under relatively small Hdc fields was measured for some Ce3+ coordination complexes where multiconfigurational CASSCF calculations indicated easy plane magnetic anisotropy that led to larger contributions of the |±1/2〉 and |±3/2〉 wavefunctions in the ground state ±mj KD.25–29 Even though there was a transverse contribution to the ground state, the compounds showed similar magnetic behavior to those compounds with more axially strained coordination geometries. We attempted to compile the magnetic characteristics of the Ce3+ compounds found in the literature in Tables S1–S5.†
25–29 A similar result was found for the dinuclear Ce3+ compound [Ce2(RR-L)2(μ-Cl)6], where L is 1,4,7,10-tetrakis(2-pyridylmethyl)-1,4,7,10-tetraaza-cyclododecane, Table S3.†30 In addition, the natural isotopes of Ce3+ do not have nuclear spin; this results in clearer and easier to interpret EPR spectra. Interestingly, in the studies published where EPR was also measured for the Ce3+ compounds, the gxx, gyy and gzz experimental values were in good agreement with the computational experiments.22,24,25,30 At the moment, as far as we know, pure Ising type axial anisotropy (gz = 4.28) has not been found in the computational calculations nor in EPR measurements for any of the Ce3+ compounds found in the literature. It is worth noting that slow relaxation of the magnetization under relatively small Hdc fields was measured for some Ce3+ coordination complexes where multiconfigurational CASSCF calculations indicated easy plane magnetic anisotropy that led to larger contributions of the |±1/2〉 and |±3/2〉 wavefunctions in the ground state ±mj KD.25–29 Even though there was a transverse contribution to the ground state, the compounds showed similar magnetic behavior to those compounds with more axially strained coordination geometries. We attempted to compile the magnetic characteristics of the Ce3+ compounds found in the literature in Tables S1–S5.†
More examples of Ce3+ SMM compounds are needed to further understand their spin relaxation and so that we can control and manipulate it to be able to design compounds with better SMM performance. With the aim of increasing this limited family of compounds and providing new insights into the understanding of cerium(III) spin relaxation, five new β-diketonate Ce3+ coordination compounds are presented. The presented complexes are derived from the β-diketonate ligand Btfa− = 4,4,4-trifluoro-1-phenyl-1,3-butanedionate with polypyridyl molecules as ancillary ligands and they have the formulae [Ce(Btfa)3(H2O)2] (1), [Ce(Btfa)3(phen)] (2), [Ce(Btfa)3(bipy)] (3), [Ce(Btfa)3(terpy)] (4) and [Ce(Btfa)3(bathophen)(DMF)] (5), where phen = 1,10-phenanthroline, bipy = 2,2′-bipyridyl, terpy = 2,2′:6′,2′′-terpyridine and bathophen = bathophenanthroline. For this purpose, the nitrogen donor N,N-L and N,N,N-L auxiliary ligands could be placed in the equatorial positions of the Ce3+ metallic center while the β-diketonates could be fixed in the axial positions, thus, in this way, stressing an axial geometry. Moreover, the five compounds were structurally and magnetically characterized and a thorough investigation of the experimental magnetic data and ab initio calculations was conducted to gain deeper insights into the spin dynamics involved in the magnetization relaxation of these compounds.
Experimental section
Starting materials
4,4,4-Trifluoro-1-phenyl-1,3-butanedione (HBtfa), 2,2′-bipyridyl (bipy), 1,10-phenanthroline (phen), 2,2′:6′,2′-terpyridine (terpy) and bathophenanthroline (bathophen) were purchased from Sigma-Aldrich. Cerium(III) chloride hexahydrate was obtained from Strem Chemicals and the other chemicals used were of analytical grade.IR and elemental analyses
Infrared spectra of solid complexes were recorded on a Bruker Alpha P (platinum-ATR-cap) spectrometer. Elemental microanalyses were carried out with an Elementar Vario EN3 analyser.Magnetic measurements
Magnetic measurements were performed on solid polycrystalline samples with a Quantum Design MPMS-XL SQUID magnetometer at the Magnetic Measurements Unit of the Scientific and Technological Center (CCiTUB) of the University of Barcelona. Data were collected for powdered microcrystalline samples or for crushed polycrystalline samples of compounds 1 to 5, the purity and structural integrity of which were analyzed by powder X-ray diffraction (see Molecular structure section of the Results and discussion). The samples were mounted in a gelatin capsule. Direct current (dc) susceptibility measurements were made over the 2–300 K temperature range and under an external magnetic field of 0.3 T. Blank measurements were also recorded for the capsule and holder and their diamagnetic contributions were corrected. Pascal's constants were used to estimate the diamagnetic corrections, which were subtracted from the experimental susceptibilities to give the corrected molar magnetic susceptibilities. Alternating current (ac) susceptibility measurements were carried out by applying an oscillating ac field of 4 Oe with ac frequencies between 1 and 1500 Hz for 1, 3 and 5 and between 10 and 1500 Hz for compounds 2 and 4 at different temperatures and different dc applied fields indicated in the text.X-ray crystallography
Crystals of 1–5 were mounted in air on a D8VENTURE (Bruker) diffractometer with a CMOS detector. Crystallographic data, conditions required for intensity data collection and some features of the structure refinements are listed in Tables S6 and S7.† All the structures were refined by the least-squares method. Intensities were collected with multilayer monochromated Mo-Kα radiation. Lorentz polarization and absorption corrections were made for all samples. The structures were solved by direct methods, using the SHELXS-97 computer program31 and refined by the full-matrix least-squares method, using the SHELXL-2018 computer program.32 The non-hydrogen atoms were located in successive difference Fourier transformations and refined with anisotropic thermal parameters on F2. For hydrogen atoms, isotropic temperature factors were assigned to be 1.2 or 1.5 times the respective parent.Powder X-ray diffraction (PXRD) measurements (see Fig. S1–S5†) were used to check the bulk phase purity. The powder patterns were recorded on a Bruker D8 Advance diffractometer (Bruker AXS, Madison, WI, USA) with a LynxEye detector in Bragg–Brentano θ/θ geometry, with the sample dispersed thinly on a zero-background Si sample holder, λ(CuKα) = 1.54060 Å, scanning from 2θ = 5° to 50°, with a step size of 0.02°.
Computational details
Ab initio calculations were performed using crystallographic structures and Orca software, version 5.0.3. The def2-TZVP basis set was used.33 NEVPT2 calculations did not include dynamic correlations as it was previously demonstrated for Ce complexes that this was not essential due to the large ionic character of the Ln–O and Ln–N bonds.34 The selected active space was (1,7), considering the seven doublets. The SINGLE_ANISO module, as implemented in Orca, was employed.35To evaluate the vibrational frequencies, the experimental geometries were optimized with Gaussian09,36 the B3LYP functional37 and using the Stuttgart pseudo/basis set38 for Ce and a TZV basis set39 for lighter atoms.
Results and discussion
General syntheses
Deprotonation of the β-diketone 4,4,4-trifluoro-1-phenyl-1,3-butanedione (HBtfa; Scheme 1a) in a basic medium and further addition of cerium(III) chloride led to the precipitation of the neutral [Ce(Btfa)3(H2O)2] (1) aqua complex. Compound 1 was used as the precursor in subsequent reactions. Compounds 2–5 were obtained through the displacement of the H2O molecules of 1 by different polypyridyl ligands. The nitrogen containing molecules used for this family of cerium(III) compounds were: 1,10-phenanthroline (phen; Scheme 1b), 2,2′-bipyridyl (bipy; Scheme 1c), 2,2′;6′,2′′-terpyridine (terpy; Scheme 1d) and bathophenanthroline (bathophen; Scheme 1e). The reaction of precursor compound 1 with chelating N,N-L and N,N,N-L ligands in a 1![[thin space (1/6-em)]](https://www.rsc.org/images/entities/char_2009.gif) :
:![[thin space (1/6-em)]](https://www.rsc.org/images/entities/char_2009.gif) 1 ratio and in an ethanolic solution (DMF/ethanol in the case of complex 5) led to the mononuclear Ce3+ coordination complexes [Ce(Btfa)3(phen)] (2), [Ce(Btfa)3(bipy)] (3), [Ce(Btfa)3(terpy)] (4) and [Ce(Btfa)3(bathophen)(DMF)] (5).
1 ratio and in an ethanolic solution (DMF/ethanol in the case of complex 5) led to the mononuclear Ce3+ coordination complexes [Ce(Btfa)3(phen)] (2), [Ce(Btfa)3(bipy)] (3), [Ce(Btfa)3(terpy)] (4) and [Ce(Btfa)3(bathophen)(DMF)] (5).
In the case of compounds 3a and 3, after the reaction of precursor 1 with the 2,2′-bipyridyl (bipy) ligand in ethanol as a solvent, structure determination by single crystal X-ray diffraction by using one chosen crystal from the bulk product indicated that the compound was [Ce(Btfa)3(bipy)(EtOH)], 3a. Powder X-ray diffraction (PXRD) of the whole powder sample, Fig. S3,† indicates the presence of two phases. After various recrystallization processes of the product, the PXRD spectra were still the same. At that point, by choosing another single crystal of the bulk compound, SCXRD afforded a different structure with the formula [Ce(Btfa)3(bipy)] (3).
Complex 3 can be isolated by removing all the coordinated EtOH molecules present in the bulk product from [Ce(Btfa)3(bipy)(EtOH)] (3a). We found two different ways to do so. First, by leaving the obtained product in the open air for 3 months. The second method was to keep sample 3a in the oven for 1 h at 100 °C, Fig. S3e.† Moreover, TGA measurements were performed on a freshly prepared sample, which probably predominantly contained compound 3a. As can be observed in Fig. S6,† at around 100 °C there is a weight decrease corresponding to the loss of 4.9% of the sample content. This percentage corresponds to one EtOH molecule; the decrease of the curve starts at 29.56 °C and finishes at 175.17 °C. Then complex 3 was isolated as can be seen by PXRD, Fig. S1.†
Molecular structures of the compounds
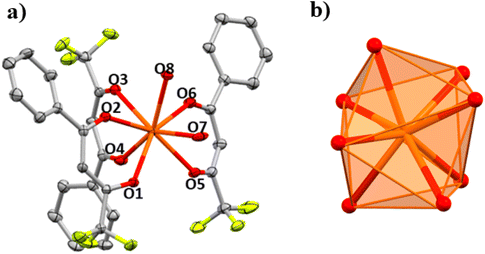
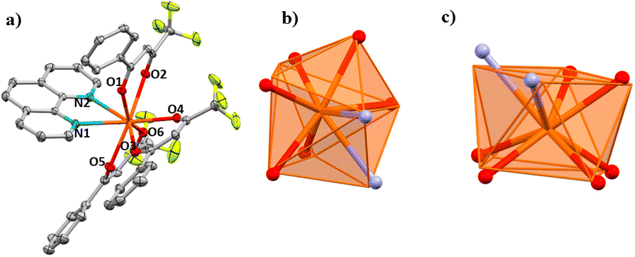
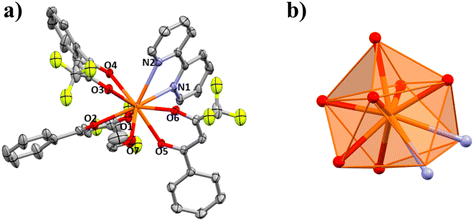
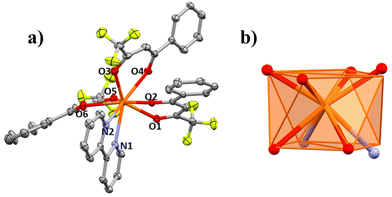
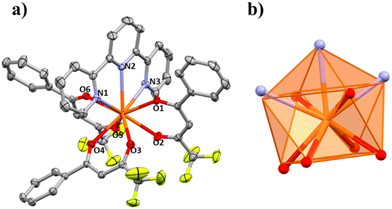
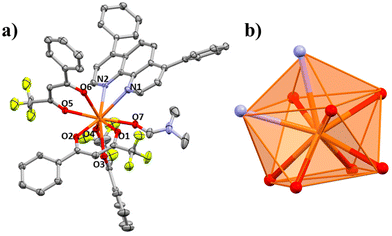
The structures of compounds 1–5 and 3a are presented here. A partially labelled plot of the Ce3+ mononuclear complexes, coordination polyhedra and intermolecular interaction arrangements are presented in Fig. 1–8 and Fig. S7–S10.† Crystallographic data are collected in Tables S6 and S7.† Selected bond lengths of compounds 1–5 are listed in Table 1.| 1 | 1 r.t. | 2 | 3a | 3b | 5 | 6 | |
|---|---|---|---|---|---|---|---|
| Ce–O1 | 2.455(3) | 2.438(7) | 2.453(2) | 2.443(3) | 2.421(2) | 2.450(2) | 2.448(3) |
| Ce–O2 | 2.427(4) | 2.474(6) | 2.467(2) | 2.481(2) | 2.467(1) | 2.454(2) | 2.461(3) |
| Ce–O3 | 2.505(3) | 2.522(6) | 2.425(2) | 2.460(3) | 2.405(2) | 2.531(2) | 2.511(4) |
| Ce–O4 | 2.390(3) | 2.379(7) | 2.419(1) | 2.496(3) | 2.459(2) | 2.490(2) | 2.470(3) |
| Ce–O5 | 2.471(3) | 2.422(7) | 2.434(2) | 2.464(3) | 2.417(2) | 2.428(2) | 2.476(3) |
| Ce–O6 | 2.402(4) | 2.473(7) | 2.416(2) | 2.490(2) | 2.446(2) | 2.461(2) | 2.479(3) |
| Ce–O7 | 2.535(4) | 2.509(7) | — | 2.570(3) | — | — | 2.541(3) |
| Ce–O8 | 2.520(3) | 2.553(7) | — | — | — | — | |
| Ce–N1 | — | 2.659(2) | 2.713(3) | 2.660(2) | 2.688(3) | 2.701(4) | |
| Ce–N2 | — | 2.697(2) | 2.730(3) | 2.668(2) | 2.717(2) | 2.701(4) | |
| Ce–N3 | — | — | — | — | 2.680(3) | — |
Molecules of 1 are arranged in space through hydrogen bonds forming an infinite 1D chain in the [1 0 0] direction, Fig. S7.† The atoms contributing to these intermolecular interactions are the hydrogens from the two water molecules coordinated to the cerium(III) atoms. On one hand, the H atoms from O8 interact with O1 and O5 from two different β-diketonates of the neighbouring coordination complex with donor (D)⋯acceptor (A) distances of 2.777 and 2.761 Å. On the other hand, the H atoms from the other O7 water molecule are connected through H-bonding with the O3 and F34 atoms from the nearby complex with D–A distances of 2.868 and 3.026 Å respectively. The shortest Ce–Ce intermolecular distance is 6.105 Å.
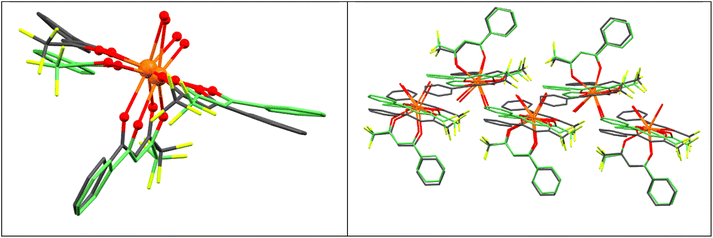
PXRD for 1 was measured at 294 K, and the resulting spectrum was compared with the calculated one for the single crystal measured at 100 K to verify that the entire polycrystalline product was the same as the structure obtained by single crystal X-ray diffraction, Fig. S1.† However, the spectra do not match very well. Not even after several recrystallizations of the product. Then, one single crystal was measured by XRD at room temperature (300 K). The calculated spectrum for this new structure determination matches the spectrum of the powder one measured at 294 K, Fig. S1.† Comparing the crystallographic data for compound 1 at 100 K and at room temperature (Table S6†), we can see that, on decreasing the temperature, there is a slight structural change. The crystal system and space group are still the same (orthorhombic, α = β = γ = 90° and P212121), but the cell parameters change from a = 10.854, b = 13.219 and c = 23.317 Å at room temperature to a = 10.809, b = 14.77 and c = 21.079 Å at 100 K. The structure at room temperature (294 K) shows Ce–O distances and angles that are slightly different from those measured at 100 K, Table 1. At room temperature, the coordination polyhedral geometry is still close to an ideal triangular dodecahedron (TDD-8, D2d) with a CShM value of 0.327, whereas the CShM value for 1 at 100 K is 0.416.
In Fig. 2 the structures obtained at 300 K and 100 K are superimposed. The slight difference between the distances and angles is enough to change the cell parameters when cooling the single crystal resulting in different powder XRD patterns.
The CeN2O6 disposition for 2 is intermediate between different coordination polyhedra. The lowest CShM values for 2 correspond to the triangular dodecahedron (TDD-8, D2d) and square antiprism (SAPR-8, D4d) geometries with CShM values of 1.700 and 1.835, respectively, Fig. 3b and c. The PXRD spectrum of the powder sample of 2 compared to the one calculated for the single crystal structure matchs perfectly indicating the purity of the bulk product, Fig. S2.†
The [Ce(Btfa)3(phen)] molecules are arranged in the crystal lattice through π–π stacking interactions between the ring formed by C5–C10 from one Btfa− ligand (Cg3) and the three rings with delocalized electron density from the phen ligand (Cg9). The intermolecular distance between the two centroids (Cg3⋯Cg9) is 3.921 Å and the interaction grows along the [0 0 1] base vector as an infinite 1D chain Fig. S8.† The shortest Ce–Ce intermolecular distance is 8.806 Å.
![[1 with combining macron]](https://www.rsc.org/images/entities/char_0031_0304.gif) space group, Fig. 4a. The structure of 3a consists of mononuclear molecules in which each Ce3+ ion is nonacoordinated with a CeN2O7 coordination environment formed by six O atoms from the three deprotonated β-diketonate ligands with Ce–O distances in the 2.496–2.443 Å range, two N atoms from the bipy ancillary ligand with Ce–N distances of 2.713 and 2.730 Å and the O atom from the ethanol molecule with a Ce–O distance of 2.570 Å. The fluorine atoms from the –CF3 group of the substituted β-diketone molecule show disorder. The CeN2O7 nine coordination polyhedron has a coordination geometry close to that of a tricapped trigonal prism (TCTPR-9, D3h), Fig. 4b, with a CShM value of 0.562.
space group, Fig. 4a. The structure of 3a consists of mononuclear molecules in which each Ce3+ ion is nonacoordinated with a CeN2O7 coordination environment formed by six O atoms from the three deprotonated β-diketonate ligands with Ce–O distances in the 2.496–2.443 Å range, two N atoms from the bipy ancillary ligand with Ce–N distances of 2.713 and 2.730 Å and the O atom from the ethanol molecule with a Ce–O distance of 2.570 Å. The fluorine atoms from the –CF3 group of the substituted β-diketone molecule show disorder. The CeN2O7 nine coordination polyhedron has a coordination geometry close to that of a tricapped trigonal prism (TCTPR-9, D3h), Fig. 4b, with a CShM value of 0.562.
Powder X-ray diffraction was performed and the result was compared with the calculated PXRD spectrum of the single crystal structure of 3a, but the spectra did not properly match, Fig. S3b.† As mentioned before, this is because, after the reaction of the [Ce(Btfa)3(H2O)2] precursor with bipy, a mixture of structures [Ce(Btfa)3(bipy)(EtOH)] (3a) and [Ce(Btfa)3(bipy)] (3) crystallizes. Unlike 3, compound 3a cannot be isolated.
The intermolecular interactions to consider for both structures, 3a and 3, are the π–π stacking interactions between the rings from the bipy ligands with Cg1–Cg2 distances of 3.687 Å for 3a and of 3.999 Å for 3. Moreover, other weak intermolecular interactions such as π–H build up a three-dimensional supramolecular structure, see Fig. S9a and S9b.† The shortest Ce–Ce intermolecular distance is 8.647 Å.
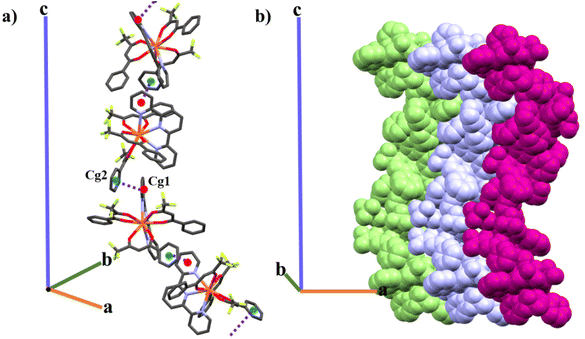
Each asymmetric unit is formed by one mononuclear entity. For 4, the asymmetric unit grows in space forming a laevorotatory 43-helical chain through the c axis (left-handed chain) and, therefore, homo-chiral packing of helices in the crystal is induced. The helix is formed around the crystallographic 43 screw axis via the π–π stacking interaction between two different rings with delocalized electron density, one from the terpy ligand (Cg1) and the other from one Btfa− β-diketone molecule (Cg2) with an intermolecular distance of 3.767 Å, Fig. 7a. The helices align themselves along the a and b axis through weak Van der Waals interactions, resulting in the formation of a chiral crystal structure, Fig. 7b. The shortest Ce⋯Ce intermolecular distance is 10.563 Å.
The enantiomeric pair for this Sohncke space group is P41 in which the helix would be dextrorotatory. To find a crystal with the enantiomeric P41 Sohncke space group, a second single crystal was measured. For this second measurement, the same P43 space group was found. Though both crystals presented the same chirality, we cannot assert that the final product is purely chiral and neglect the idea that it could be a racemic mixture. The powder XRD results presented in Fig. S4† support one single phase for the whole powder product of 4.
Magnetic properties
Static magnetic properties
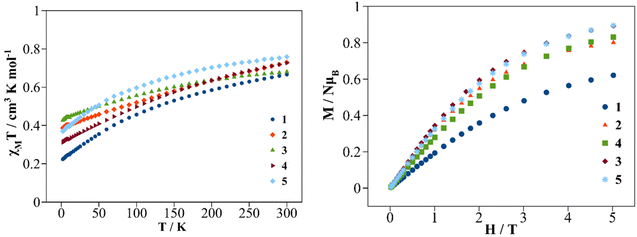
Direct current (dc) magnetic susceptibility and magnetization measurements were performed on polycrystalline samples of compounds 1–5. Since compound 3a was not isolated as a pure compound, the magnetic study was not performed for this sample. The χMT vs. T plots in the 2–300 K temperature range under a dc magnetic field of 0.3 T are shown in Fig. 9 (left). At room temperature (300 K) the χMT values for compounds 1–5 are 0.67, 0.73, 0.68, 0.73 and 0.76 cm3 mol−1 K respectively. These χMT values are close to the calculated value for an isolated Ce3+ cation in the ground state, 2F5/2 (S = 1/2, L = 3, J = 5/2, gJ = 6/7), which is 0.8 cm3 mol−1 K.8 On cooling the samples, the χMT values decrease gradually due to the progressive thermal depopulation of the mj states to finite values at 2 K of 0.23, 0.40, 0.44, 0.32 and 0.38 cm3 mol−1 K for compounds 1–5 respectively. Other mononuclear Ce3+ coordination compounds show similar χMT vs. T curves.21,42,43 The field dependence of the magnetization (M) recorded at 2 K is depicted in Fig. 9 (right). On increasing the external magnetic field up to 5 T, the magnetization values increase to 0.62, 0.84, 0.89, 0.83 and 0.89 NAμB for 1–5 respectively without stabilization of the M values, showing no evidence of saturation of the magnetization (gJ·J). Similar behavior is found for other Ce3+ compounds showing significant magnetic anisotropy.17,21,30Dynamic magnetic properties
No frequency dependence of the out-of-phase magnetic susceptibility component (χM′′) was found under a 0 T external magnetic dc field for complexes 1–5 (Fig. S11†), suggesting the lack of a pure axial Ising type geometry, which sets mj = ±5/2 as the ground doublet, and makes the reorientation of the magnetization occur through the fast quantum tunneling of magnetization (QTM) mechanism preventing the SMM behavior.23 Nevertheless, by applying a small direct current (dc) magnetic field (Hdc), the QTM was suppressed enough so that all the above compounds showed slow relaxation of the magnetization.To decide which external dc magnetic field was optimal for each compound, ac measurements were performed at a constant temperature of 2.5 K for 1, 3 and 5, of 3.5 K for 2, and of 2 K for 4 at oscillating frequencies between 1 and 1488 Hz and under different Hdc fields. The measurements of χM′ and χM′′ with frequency (v) plots, at a constant temperature, are depicted in Fig. S12† for samples 1–5. When applying low Hdc (0.002–0.01 T), χM′′ shows maximum values at higher frequencies. On increasing Hdc, the peaks increase in intensity, reaching their maximum values and shifting to the 96–177 Hz frequency zone, then staying constant until higher Hdc is applied. Then χM′′ shifts again to higher frequencies, diminishing its intensity. The optimal Hdc was 0.1 T for 1 and 3, 0.05 T for 2 and 0.02 T for 4 and 5, Fig. S13.† Given the shorter Ce⋯Ce intermolecular distance of 6.105 Å, compound 1 might require a greater external Hdc. The shortest Ce⋯Ce intermolecular distances found for structures 2–5 are 8.806, 8.647, 10.563 and 10.770 Å respectively.
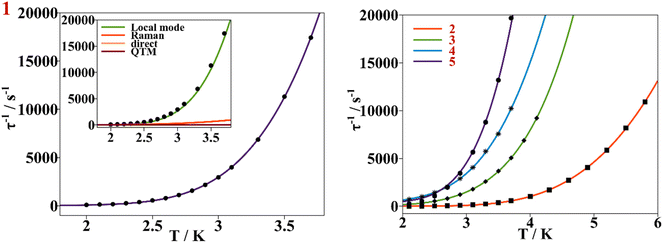
This behavior is represented as τ−1 based on the Hdc plots, Fig. 10. At low magnetic fields, τ−1 values decrease, corresponding to suppression of the QTM mechanism by the external magnetic field. After 0.3 T for 1–3 and 5, the τ−1 values remain almost constant, accounting for the predominancy of Raman and other thermally dependent relaxation processes. For compound 4, the constant trend at intermediate Hdc is rather poor and it is not as well differentiated as for the other compounds. When surpassing the specific Hdc, this constant tendency is broken, and τ−1 values increase exponentially following the H4 power law, showing that the direct process is taking place at higher magnetic fields. (τ−1 = AH4T for relaxation of the magnetization through a direct process.)
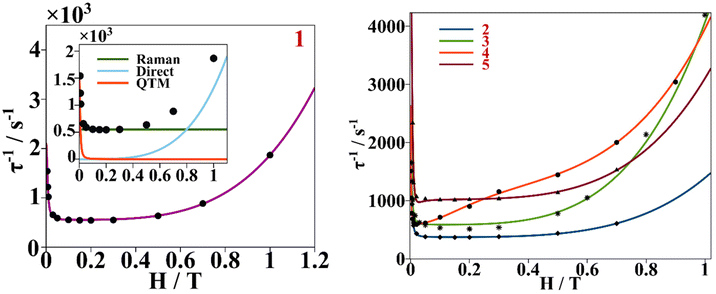 | ||
| Fig. 10 Left, dependence of τ−1 on a static magnetic field (black dots) for compound 1, continuous purple line accounts for the fitting using field dependent eqn (3). Inset shows the contribution of Raman, direct and QTM mechanisms to τ−1vs. H for compound 1. Right, dependence of τ−1 on a static magnetic field for compounds 2–5. The continuous blue, green, orange and red lines correspond to the fitting of the experimental magnetic data (discrete dots) of compounds 2 to 5 respectively with eqn (3). | ||
Under the chosen dc external magnetic field, dynamic measurements were performed under an oscillating ac field of 4 × 10⁻⁴ T in the 1–1488 Hz frequency range for 1, 3 and 5, and of 10–1488 Hz for 2 and 4. Maximum values of the out of phase magnetic susceptibility component can be seen below 5 K for 1–5, Fig. S14.† All the samples show slow relaxation of the magnetization over a similar temperature range; compound 2 is the one for which the χM′′ dependence extends to higher temperature (5.7 K).
The χM′′ vs. oscillating frequency plots at different temperatures are depicted in Fig. 11 and χM′ vs. ν plots at different temperatures are found in Fig. S15.† For complexes 1–5, the χM′′ peaks shift progressively to higher frequencies as the temperature increases, demonstrating the thermal dependence of magnetization relaxation. Therefore, we could assume that the QTM relaxation process would be considerably reduced after the application of an external dc field.3 When comparing compounds 1–5, 2 shows χM′′ dependence on T at lower frequencies, whereas 3 shows a dependence at higher ones.
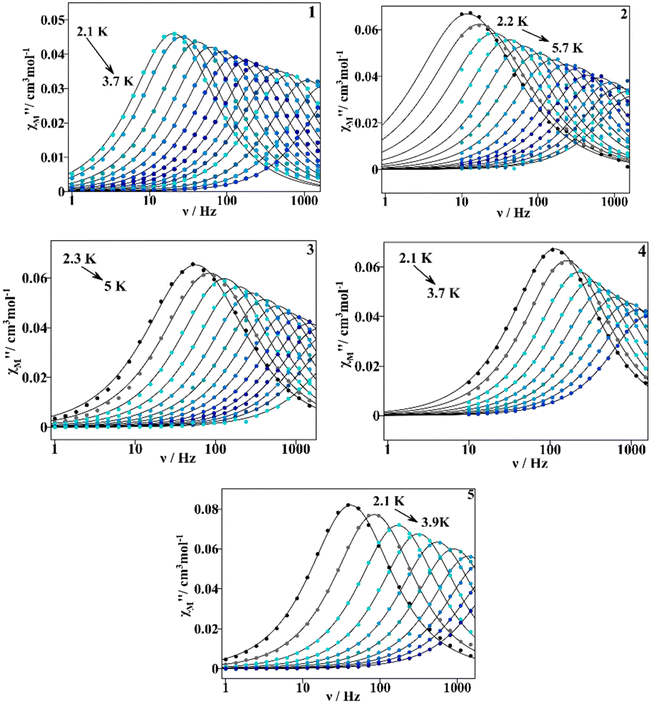 | ||
| Fig. 11 χ M′′ vs. frequency plots for compounds 1–5 measured at an oscillating ac field of 4 × 10⁻⁴ T, and at a Hdc of 0.1 T for 1–3, and of 0.02 T for 4 and 5. The continuous lines correspond to the fitting with eqn (S1).† | ||
The Cole–Cole plots for 1–5 (Fig. 12) are not perfectly symmetrical semicircles. The curves could be fitted using the generalized Debye model described with the Casimir–Du Pré function (eqn (S1)†)44 from which the relaxation times for magnetization can be extracted. The resulting parameters obtained from the fitting are presented in Tables S8–S12.† The distribution of relaxation times (α) is narrow for the presented compounds mostly for 1, 4 and 5 in which α values are 0.077–0.0041, 0.0529–0.0031 and 0.05–0.0118 respectively while for 2 and 3α values are over a slightly wider range of 0.1804–0.0018 and 0.1335–0.0146 respectively.
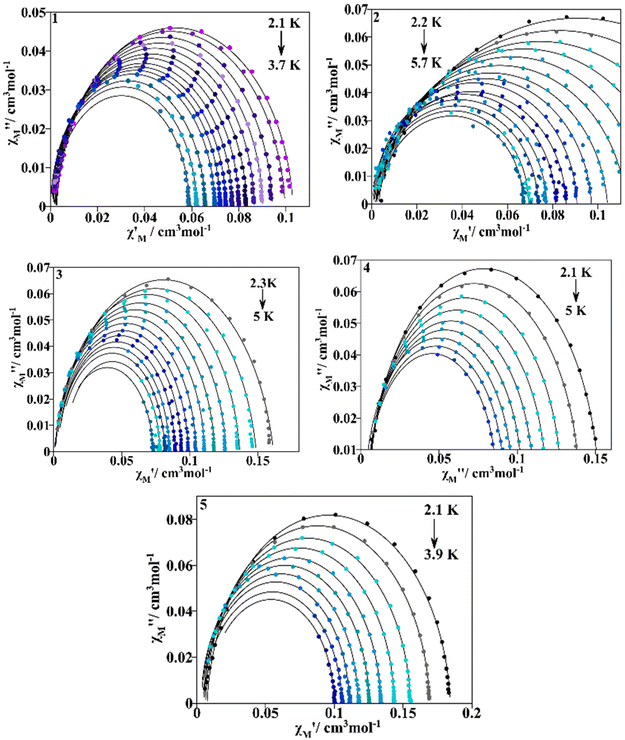 | ||
| Fig. 12 Cole–Cole plots for compounds 1–5. The continuous black lines refer to the fitting with the generalized Debye model. | ||
For a spin system, magnetization relaxation can occur through different relaxation mechanisms. The dependence of τ on temperature (T) and the applied external magnetic field (H) is expressed in eqn (1).
 | (1) |
The first term is the field dependent direct process, which involves one phonon, the second term refers to the Raman process that occurs through a virtual state involving two phonons. Here it is represented as a field dependent term using the Brons–Van Vleck equation, which has a coefficient field dependence and exponential dependence on temperature. The d parameter represents zero-field relaxation, e is related to the paramagnetic center concentration and the f parameter reports the effect of the external field on suppressing spin relaxation. The third term of eqn (1) describes the fast QTM and, finally, the last term relates to the so called thermally assisted relaxation process, the Orbach process. It follows the Arrhenius law and experimentally, when the Orbach process takes place, a linear trend of log(τ) with temperature is expected. This spin–lattice mechanism involves two phonons, and relaxation occurs through an effective energy barrier from the ground state ±mj through a real excited state. Normally, the Orbach process takes place at a higher temperature range since the system needs enough energy to surpass the whole energy barrier between the ±mj ground states.45,46
For the title compounds a linear slope appears to be followed in the higher temperature range. We fit the experimental τ values of 1–5 using the Arrhenius law, and the values obtained for the activation energy barrier are in the range of 12.2–19.8 cm−1 with τ0 values between 10−7 and 10−8 s, Table S13 and Fig. S16.† This linear trend could indicate that the relaxation of magnetization is taking place through an over-barrier Orbach mechanism for 1–5 or a thermally assisted tunneling process through the first ±mj excited state. Nevertheless, for all the cerium(III) compounds found in the literature where ab initio calculations were performed, the energy differences between the ±mj ground Kramers doublet (KD) and the first excited ±mj KD are in the range of 258–339 cm−1 for mononuclear Ce3+–β-diketonate complexes,20,21 220–787 cm−1 for other Ce3+–mononuclear compounds,23–28,47,48 303–348 cm−1 for Ce3+–polynuclear compounds30,49 and 180–303 cm−1 for Ce3+–heterometallic compounds.29,34,50,51 Interestingly, the activation energy barrier calculated from experimental data (ΔEexp), with the Arrhenius law, considering an Orbach mechanism, led to very similar values for all the previous Ce3+ compounds. The maximum value reported is 38 cm−1,28 but the ΔEexp values for the vast majority of published Ce3+ complexes lie in the 20–30 cm−1 range and it appears that there is no difference between compounds presenting easy axial or easy plane symmetry.20,21,26,27,29,43,47,50,52,53 Besides, ab initio calculations (see the Computational results section) of the former cerium(III) systems result in an energy difference between the ground and first excited mj states much higher in energy (151.9–372.6 cm−1, see Table S14†) than the energy barrier obtained from experimental data using the Arrhenius law that describes the Orbach process.
The lack of a linear trend in the log(τ) vs. T plots throughout the temperature range could be explained by considering the presence of other magnetization relaxation mechanisms occurring at the same time as the Orbach process or taking into consideration that the Orbach process is not taking place at all, as a comparison of experimental data with ab initio calculations appears to indicate. Furthermore, hyperfine interactions between the electronic spin and the nuclear spin of a lanthanide ion can split the electronic doublet into different manifolds making new pathways for magnetization that could explain the linear trend with temperature. But the natural isotopes of cerium do not possess nuclear spin. Another proposed spin–lattice relaxation mechanism is the local mode, and it is referred to as a thermally dependent process, which considers that spin relaxation goes through a higher energy state that is a local vibration from the same mj ground state following eqn (2). Then Δloc can be extracted and is referred to as the local mode energy (cm−1).54 Δloc could be experimentally assigned from vibrational spectroscopic techniques.55,56
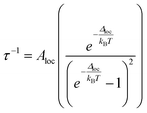 | (2) |
With the above exposed considerations, we tried to fit the magnetic data with the thermally dependent components of eqn (1) but by adding the local mode function instead of the Orbach one. Given that the temperature ranges over which there is a magnetic response for 1–5 are small and the risk of over-parametrization when many parameters are used in the equation, we first proceed to fit the dependence of τ−1 on the magnetic field so in this way we can extract the parameters from the equations that are field dependent: dTn, e and f for Raman, B1 and B2 for the QTM and a for the direct process (eqn (3)) and then the parameters corresponding to these equations can be fixed in the temperature dependent function.
The Cole–Cole plots of the field dependent experimental magnetic data measured at a constant temperature were fitted using the generalized Debye model, Fig. S17 and Tables S15–S19.† The field dependent magnetic data could be fitted following eqn (3), for all the compounds, Fig. 10. In the τ−1vs H plot, the different tendencies from the predominant QTM, Raman and direct mechanisms are well differentiated, first, each part is fitted independently with the corresponding mechanism and the fitted parameters are used as the starting point for the whole set. The obtained parameters from the field dependent fitting of compounds 1–5 are compiled in Table 2. The inset in Fig. 10 and Fig. S18† show the contributions of each relaxation mechanism to magnetization relaxation along the magnetic fields of compounds 1–5.
 | (3) |

| Compound | Raman | Direct | QTM | |||
|---|---|---|---|---|---|---|
| dTn (s−1) | e (T−2) | f (T−2) | a (s−1 T−4) | B 1 (s−1) | B 2 (T−2) | |
| 1 | 549.21 | 82.78 | 22![[thin space (1/6-em)]](https://www.rsc.org/images/entities/char_2009.gif) 760.23 760.23 |
526.71 | 1549.17 | 22![[thin space (1/6-em)]](https://www.rsc.org/images/entities/char_2009.gif) 760.21 760.21 |
| 2 | 370.07 | 214.49 | 77![[thin space (1/6-em)]](https://www.rsc.org/images/entities/char_2009.gif) 778.39 778.39 |
291.57 | 1691.25 | 77![[thin space (1/6-em)]](https://www.rsc.org/images/entities/char_2009.gif) 778.40 778.40 |
| 3 | 575.89 | 1279.27 | 87![[thin space (1/6-em)]](https://www.rsc.org/images/entities/char_2009.gif) 007.58 007.58 |
1394.18 | 2054.14 | 87![[thin space (1/6-em)]](https://www.rsc.org/images/entities/char_2009.gif) 010.40 010.40 |
| 4 | 585.82 | 23.25 | 15.40 | 1270.65 | 2055.59 | 556![[thin space (1/6-em)]](https://www.rsc.org/images/entities/char_2009.gif) 254.6 254.6 |
| 5 | 197.48 | 14![[thin space (1/6-em)]](https://www.rsc.org/images/entities/char_2009.gif) 891.10 891.10 |
3561.34 | 832.12 | 5754.71 | 42![[thin space (1/6-em)]](https://www.rsc.org/images/entities/char_2009.gif) 402.08 402.08 |
Then the temperature dependent experimental magnetic data were fitted with eqn (4) and the parameters n from the Raman process and c and ω from the local mode spin relaxation mechanism were obtained for 1–5. The τ−1 dependence on T plots are depicted in Fig. 13 and the obtained parameters from the best fit are compiled in Table 3. The contribution of each relaxation mechanism to τ−1 with temperature is shown in the inset of Fig. 13 and in Fig. S19.†
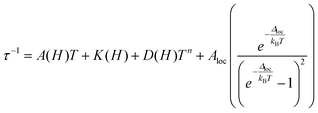 | (4) |

| Compound | Raman | Local mode | |
|---|---|---|---|
| n | C (s−1) | ω (cm−1)/(K) | |
| 1 | 4.82 | 4.03 × 10⁷ | 19.95/28.71 |
| 2 | 7.20 | 1.7 × 10⁷ | 20.89/30.07 |
| 3 | 8.27 | 3.16 × 10⁵ | 11.55/16.61 |
| 4 | 2.40 | 3.05 × 10⁶ | 15.42/22.19 |
| 5 | 6.16 | 1.20 × 10⁷ | 17.70/25.47 |
When looking at the dependence of τ−1 on the field, for all the compounds under low external bias dc magnetic fields, the QTM mechanism is the one dominating magnetization relaxation. Under high external dc fields for 1 and 3 the direct process is the dominant one while for 2, 4 and 5 the Raman process is still relevant, Fig. 10 and Fig. S18.†
From the global fit the obtained local mode energy values for the different compounds are in the range of 11.55–20.90 cm−1 (16.61–30.07 K). With this approach, the spin relaxation of compound 1 appears to be governed by the local mode mechanism, Fig. 13 inset. While for 2, 4 and 5 spin relaxation over the temperature range is best described by both the Raman and local mode mechanisms, Fig. S19.† In fact for compound 4 it is well discerned that the Raman mechanism prevails in the lower temperature range while the local mode mechanism plays an important role in the higher temperature range, Fig. S19(4).† Moreover, compound 3 shows a smaller contribution of the local mode (ω), which is the smallest of the presented compounds with a value of 11.55 cm−1 (16.61 K), but there is a higher contribution from the n parameter from the Raman process (n = 8.2) and the direct mechanism (it has the highest A(H) value). This suggests that for 3, spin relaxation is mostly taking place through the Raman and direct processes.
Additionally, the temperature dependence of τ could also be fitted with only the Raman term as the ln(τ) vs. ln(T) plots lead to straight lines for the magnetic data for all compounds, Fig. S20.† A fitting of these plots taking into account just Raman relaxation of the magnetization mechanism described by the ln(τ) = −n·ln(T) + ln(C) equation leads to good values of n and C, which are n = 8.9 and C = 5.9 for 1, n = 7.0 and C = 17.8 for 2, n = 5.7 and C = 0.3 for 3, n = 4.7 and C = 0.0519 for 4 and n = 7.5 and C = 0.9 for 5. This leads us to consider that the Raman process may actually be the relevant mechanism for the magnetic relaxation of these cerium(III) compounds. However, a fitting of temperature dependent data with eqn (3) without considering the local mode but taking into account the contribution of all the field dependence terms, leads to unsuccessful fitting of the data, Fig. S21.† Therefore, two different approaches are presented to explain the spin dynamics of 1–4.
The first is that, when considering the contributions of QTM and direct processes to magnetic relaxation, this would lead to overparametrization, so the parameters for those mechanisms are first obtained from the field dependent magnetic data and fixed in the temperature dependent fitting. In this approach, the local mode has to be considered to obtain a good fitting of magnetization relaxation times with temperature since only considering the Raman process leads to unsuccessful fitting. The second approach is just to consider the Raman relaxation mechanism and neglect the contribution that direct and QTM mechanisms may have on spin relaxation; this also leads to reasonable results. Still the contributions of the QTM and direct mechanisms to spin relaxation should not be overlooked, especially the direct mechanism, if an external magnetic field is applied to measure the alternating current magnetic susceptibility.
The existence of multiple potential explanations to describe the spin dynamics phenomenon of compounds 1–5, once again, highlights the need for continued investigation into the magnetic behavior, at the molecular level, of Ce(III) coordination compounds.
Geometry optimization and calculation of the DFT vibrational frequencies were performed for 1, 2 and 4. The analysis of the frequencies shows a large amount of low energy vibrational frequencies (Table S20†) that can contribute to spin relaxation through the local-mode process; however, a spin–phonon calculation of these frequencies to verify their contribution is out of the scope of this paper.
Computational results
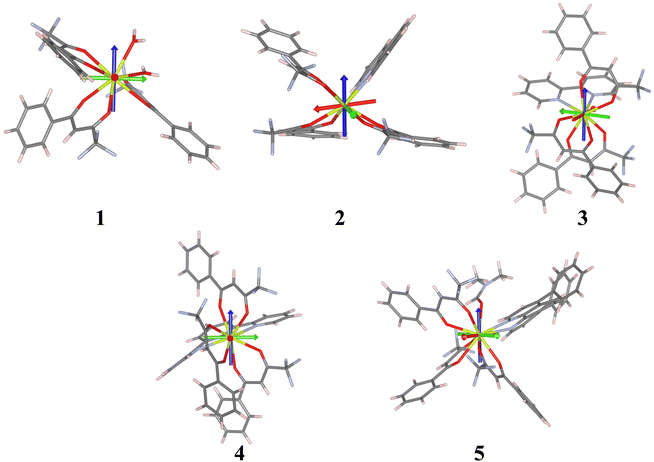
Ab initio calculations were performed on the crystallographic structures, see the Computational details section. CASSCF calculations incorporating spin–orbit effects via the RASSI approach were conducted to delve into the magnetic characteristics of compounds 1–5. Cerium(III) complexes exhibit a 4f1 and a 2F5/2 ground state. The simulated magnetic susceptibility and magnetization profiles are similar to the experimentally observed curves, see Fig. S22 and S23,† indicating good agreement between theoretical predictions and actual experimental results.Except compound 1, the remaining systems studied show a large gz component, see Table 4, indicating large axial anisotropy. The values are similar to those for other previously reported Ce systems (see Tables S1–S5†); however, for a perfectly axial Ce3+ complex the value should be 4.19 (30/7). Compounds 2–4 with values in the range of 3.3–3.8 are consistent with an mJ = ±5/2 ground state with a contribution from mJ = ±3/2 states. The orientation of the calculated gz is quite different for the compounds (see Fig. 14). The coordination numbers are also different, eight for 1–3, and nine for 4 and 5. In the case of an mJ = ±5/2 ground state an oblate f electron density, with a perpendicular gz orientation, is expected. The gz tensor would be oriented in a way that the metal–ligand electrostatic repulsion would be reduced. It can be achieved by (i) the alignment of gz with the shortest Ce–O distances, in a way that the f electron density disc stays perpendicular to that direction or (ii) the location of the f electron density disc in the plane containing the longest Ce–L distances. In this family of compounds in general gz is located in a way that it is not pointing to any ligand and the electron density disc tries to avoid all the ligands. This happens for 1, 2, 4 and 5. However, for 3 it is mainly oriented with one of the Ce–O bonds (Ce1–O5) and with the f electron density disc oriented close to the Ce–N bonds. In the case of 4gz is oriented in a way that the f electron density disc avoids most of the ligands but is in the same plane as some of the Ce–N bonds of the terpyridine ligand.
| Compound | g x | g y | g z | Wavefunction |
|---|---|---|---|---|
| 1 | 0.563 | 1.391 | 2.392 | 0.28| ± 5/2〉 + 0.42| ± 3/2〉 + 0.30| ± 1/2〉 |
| 2 | 0.108 | 0.481 | 3.754 | 0.90| ± 5/2〉 + 0.005| ± 3/2〉 + 0.09| ± 1/2〉 |
| 3 | 0.460 | 0.940 | 3.600 | 0.87| ± 5/2〉 + 0.04| ± 3/2〉 + 0.09| ± 1/2〉 |
| 4 | 0.775 | 1.255 | 3.379 | 0.89| ± 5/2〉 + 0.08| ± 3/2〉 + 0.03| ± 1/2〉 |
| 5 | 0.501 | 1.500 | 3.350 | 0.82| ± 5/2〉 + 0.04| ± 3/2〉 + 0.14| ± 1/2〉 |
The analysis of the decomposition of the RASSI wavefunction of the ground Kramers doublet can be found in Table 4. It shows, as expected, a different contribution for 1, where a large mixture of the three components is observed; this correlates with smaller gz and larger gx and gy components. For the other compounds a larger contribution from the wave function |±5/2〉 (80–90%) mixed with |±1/2〉 and |±3/2〉 from the other excited mj doublets is found; this also explains the larger anisotropy of these Ce complexes.
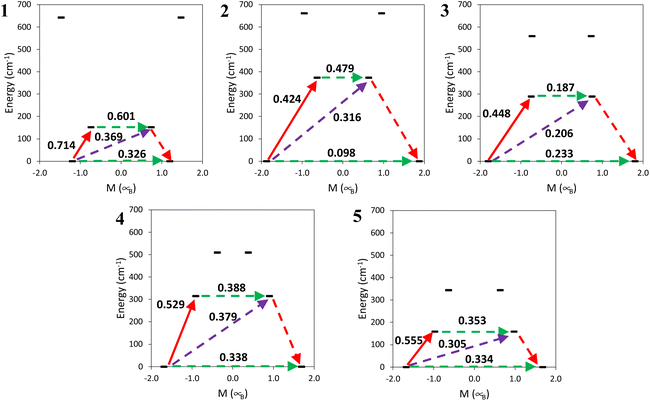
The energy of the Kramers doublet and transition probabilities between the states were calculated, see Fig. 15. The first excited Kramers doublet is around 150 cm−1 in 1 and 5 and around 300 cm−1 or more for the other complexes, see also Table S14.† In all the cases, as commented on before, the energy difference is much larger than the energy barrier that can be obtained from the fit of the dependence of relaxation times on temperature with the Arrhenius equation, 12–20 cm−1. All the complexes show a large tunnelling probability in the ground state, with complex 2 having the smallest one, of 0.1. This agrees with the necessity to apply an external dc field to show an out-of-phase magnetic susceptibility signal (χM′′). Besides 2 having the smallest tunnelling probability in this family of compounds the optimal field needed is not the smallest one. This is probably also related to the shorter Ce⋯Ce distance in 2 in comparison with 4 and 5.
Conclusions
As a continuation of our interest in the less studied lanthanide(III) SIM compounds derived from Ce3+ ions,21 in this paper we have presented five new β-diketonate–Ce3+ coordination compounds with the aim of providing new insights into understanding the cerium spin relaxation. The five structurally characterized new Ce3+ complexes are derived from the β-diketone HBtfa = 4,4,4-trifluoro-1-phenyl-1,3-butanedione with polypyridyl molecules as ancillary ligands: [Ce(Btfa)3(H2O)2] (1), [Ce(Btfa)3(phen)] (2), [Ce(Btfa)3(bipy)] (3), [Ce(Btfa)3(terpy)] (4) and [Ce(Btfa)3(bathophen)(DMF)] (5), where phen = 1,10-phenanthroline, bipy = 2,2′-bipyridine, terpy = 2,2′:6′,2′′-terpyridine and bathophen = 4,7-diphenyl-1,10-phenanthroline. In the new reported compounds, Ce3+ displays a coordination number of 8 for 1, 2 and 3 and a coordination number of 9 for 4 and 5. Moreover, the five compounds have been magnetically characterized and a meticulous study has been carried out to further understand the spin dynamics in the magnetization relaxation of these new field induced SMM compounds. Furthermore, ab initio calculations were performed for the former compounds. For all the compounds, the Orbach mechanism was disregarded in light of the published literature and the obtained ab initio results. The local mode mechanism was used instead. The calculations also show the axiality of the compounds and corroborate the presence of low energy vibrational modes that could contribute to spin relaxation through the local mode. Finally, a compilation of the cerium(III) coordination complexes found in the literature before 2023 and showing slow magnetization relaxation is given in Tables S1–S5.† From the published experimental data and ab initio calculations, we can infer that the stabilization of mj with the highest value as the ground state does not imply the presence of SMM behavior for the previously magnetically studied Ce3+ coordination compounds.Conflicts of interest
There are no conflicts to declare.Acknowledgements
À. T., S. S. and R. V. acknowledge financial support from the Ministerio de Ciencia, Innovación y Universidades (Spain), Project PGC2018-094031-B-100. S. G.-C. acknowledges financial support from the Ministerio de Ciencia, Innovación y Universidades (Spain), Projects PID2021-122464NB-I00, TED2021-129593B-I00 and Maria de Maeztu CEX2021-001202-M. S. G.-C. acknowledges the CSUC and BSC supercomputer centers for computational resources.References
- R. Sessoli, D. Gatteschi, A. Caneschi and M. A. Novak, Magnetic bistability in metal-ion cluster, Nature, 1993, 365, 141–143 CrossRef CAS.
- T. Lis, Preparation, Structure, and Magnetic Properties of a Dodeeanuelear Mixed-Valence Manganese Carboxylate, Acta Crystallogr., Sect. B: Struct. Crystallogr. Cryst. Chem., 1980, 36, 2042–2046 CrossRef.
- A. Zabala-Lekuona, J. M. Seco and E. Colacio, Single-Molecule Magnets: From Mn12-ac to dysprosium metallocenes, a travel in time, Coord. Chem. Rev., 2021, 441, 213984 CrossRef CAS.
- (a) M. Mannini, F. Pineider, P. Sainctavit, C. Danieli, E. Otero, C. Sciancalepore, A. M. Talarico, M.-A. Arrio, A. Cornia, D. Gatteschi and R. Sessoli, Magnetic memory of a single-molecule quantum magnet wired to a gold surface, Nat. Mater., 2009, 8, 194–197 CrossRef CAS PubMed; (b) M. Urdampilleta, S. Klyatskaya, J. P. Cleuziou, M. Ruben and W. Wernsdorfer, Supramolecular spin valves, Nat. Mater., 2011, 10, 502–506 CrossRef CAS PubMed; (c) S. G. McAdams, A.-M. Ariciu, A. K. Kostopoulos, J. P. S. Walsh and F. Tuna, Molecular single-ion magnets based on lanthanides and actinides: Design considerations and new advances in the context of quantum technologies, Coord. Chem. Rev., 2017, 346, 216–239 CrossRef CAS.
- N. Ishikawa, M. Sugita, T. Ishikawa, S.-Y. Koshihara and Y. Kaizu, Lanthanide Double-Decker Complexes Functioning as Magnets at the Single-Molecular Level, J. Am. Chem. Soc., 2003, 125, 8694–8695 CrossRef CAS PubMed.
- J. J. Le Roy, I. Korobkov and M. Murugesu, A sandwich complex with axial symmetry for harnessing the anisotropy in a prolate erbium(III) ion, Chem. Commun., 2014, 50, 1602–1604 RSC.
- (a) D. N. Woodruff, R. E. P. Winpenny and R. A. Layfield, Lanthanide Single-Molecule Magnets, Chem. Rev., 2013, 113, 5110–5148 CrossRef CAS PubMed; (b) M. Jeletic, P.-H. Lin, J. J. Le Roy, I. Korobkov, S. I. Gorelsky and M. Murugesu, An Organometallic Sandwich Lanthanide Single-Ion Magnet with an Unusual Multiple Relaxation Mechanism, J. Am. Chem. Soc., 2011, 133, 19286–19289 CrossRef CAS PubMed.
- The Rare Earth Elements: Fundamentals and Applications, ed. D. A. Atwood, John Wiley & Sons Ltd, 2005 Search PubMed.
- J. Tang and P. Zhang, Lanthanide Single Molecule Magnets, Springer Berlin Heidelberg, Berlin, Heidelberg, 2015 Search PubMed.
- F. S. Guo, B. M. Day, Y. C. Chen, M. L. Tong, A. Mansikkamäki and R. A. Layfield, A Dysprosium Metallocene Single-Molecule Magnet Functioning at the Axial Limit, Angew. Chem., Int. Ed., 2017, 56, 11445–11449 CrossRef CAS PubMed.
- C. A. P. Goodwin, F. Ortu, D. Reta, N. F. Chilton and D. P. Mills, Molecular magnetic hysteresis at 60 kelvin in dysprosocenium, Nature, 2017, 548, 439–442 CrossRef CAS PubMed.
- S.-D. Jiang, B.-W. Wang, H.-L. Sun, Z.-M. Wang and S. Gao, An Organometallic Single-Ion Magnet, J. Am. Chem. Soc., 2011, 133, 4730–4733 CrossRef CAS PubMed.
- J. Y. Ge, L. Cui, J. Li, F. Yu, Y. Song, Y. Q. Zhang, J. L. Zuo and M. Kurmoo, Modulating Single-Molecule Magnetic Behavior of a Dinuclear Erbium(III) Complex by Solvent Exchange, Inorg. Chem., 2017, 56, 336–343 CrossRef CAS PubMed.
- J. Rinehart and J. Long, Exploiting single-ion anisotropy in the design of f-element single-molecule magnets, Chem. Sci., 2011, 2, 2078–2085 RSC.
- F.-S. Guo, B. M. Day, Y.-C. Chen, M.-L. Tong, A. Mansikkamäki and R. A. Layfield, Magnetic hysteresis up to 80 kelvin in a dysprosium metallocene single-molecule magnet, Science, 2018, 362, 1400–1403 CrossRef CAS PubMed.
- (a) J. F. Herbst, R2Fe14B materials: Intrinsic properties and technological aspects, Rev. Mod. Phys., 1991, 63, 819–898 CrossRef CAS; (b) Y. Li, X. L. Zhang, R. Qiu and Y. S. Kang, Synthesis and investigation of SmCo5 magnetic nanoparticles, Colloids Surf., A, 2008, 313–314, 621–624 CrossRef; (c) P. K. Deheri, V. Swaminathan, S. D. Bhame, Z. Liu and R. V. Ramanujan, Sol−Gel Based Chemical Synthesis of Nd2Fe14B Hard Magnetic Nanoparticles, Chem. Mater., 2010, 22, 6509–6517 CrossRef CAS.
- (a) F. Pointillart, O. Cador, B. Le Guennic and L. Ouahab, Uncommon lanthanide ions in purely 4f Single Molecule Magnets, Coord. Chem. Rev., 2017, 346, 150–175 CrossRef CAS; (b) A. Borah and R. Murugavel, Magnetic Relaxation in Single-Ion Magnets Formed by Less-Studied Lanthanide Ions Ce(III), Nd(III), Gd(III), Ho(III), Tm(II/III) and Yb(III), Coord. Chem. Rev., 2022, 453, 214288 CrossRef CAS.
- S. T. Liddle and J. van Slageren, Improving f-element single molecule magnets, Chem. Soc. Rev., 2015, 44, 6655–6669 RSC.
- J.-L. Liu, Y.-C. Chen and M.-L. Tong, Symmetry strategies for high performance lanthanide-based single-molecule magnets, Chem. Soc. Rev., 2018, 47, 2431–2453 RSC.
- M.-X. Xu, Y.-S. Meng, J. Xiong, B.-W. Wang, S.-D. Jiang and S. Gao, Magnetic anisotropy investigation on light lanthanide complexes, Dalton Trans., 2018, 47, 1966–1971 RSC.
- F. A. Mautner, F. Bierbaumer, R. C. Fischer, À. Tubau, S. Speed, E. Ruiz, S. S. Massoud, R. Vicente and S. Gómez-Coca, Insights into the Spin Dynamics of Mononuclear Cerium(III) Single-Molecule Magnets, Inorg. Chem., 2022, 61, 11124–11136 CrossRef CAS PubMed.
- S. Hino, M. Maeda, K. Yamashita, Y. Kataoka, M. Nakano, T. Yamamura, H. Nojiri, M. Kofu, O. Yamamuro and T. Kajiwara, Linear trinuclear Zn(II)-Ce(III)-Zn(II) complex which behaves as a single-molecule magnet, Dalton Trans., 2013, 42, 2683–2686 RSC.
- S. K. Singh, T. Gupta, L. Ungur and G. Rajaraman, Magnetic Relaxation in Single-Electron Single-Ion Cerium(III) Magnets: Insights from Ab Initio Calculations, Chem. – Eur. J., 2015, 21, 13812–13819 CrossRef CAS PubMed.
- J. Liu, D. Reta, J. A. Cleghorn, Y. X. Yeoh, F. Ortu, C. A. P. Goodwin, N. F. Chilton and D. P. Mills, Light lanthanide Metallocenium cations exhibiting weak equatorial anion Interactions, Chem. – Eur. J., 2019, 25, 7749–7758 CrossRef CAS PubMed.
- E. Rousset, M. Piccardo, M.-E. Boulon, R. W. Gable, A. Soncini, L. Sorace and C. Boskovic, Slow magnetic relaxation in Lanthanoid Crown Ether Complexes: interlay of Raman and Anomalous Phonon Bottleneck Process, Chem. – Eur. J., 2018, 24, 14768–14785 CrossRef CAS PubMed.
- A. Upadhyay, K. R. Vignesh, C. Das, S. K. Singh, G. Rajaraman and M. Shanmugam, Influence of the ligand field on the slow relaxation of magnetization of unsymmetrical monomeric lanthanide complexes: synthesis and theoretical studies, Inorg. Chem., 2017, 56, 14260–14276 CrossRef CAS PubMed.
- E. Regincós-Martí, A. B. Canaj, T. Sharma, A. Celmina, C. Wilson, G. Rajaraman and M. Murrie, Importance on an Axial LnIII-F Bond across the lanthanide series and Single-Molecule Magnet Behavior in the Ce and Nd analogues, Inorg. Chem., 2022, 61, 9906–9917 CrossRef PubMed.
- J.-D. Leng, Q.-Y. Hua, W.-T. Liu, Z.-X. Tao, N.-W. Tan, Y.-F. Wang and W.-Q. Lin, Slow magnetic relaxation of mononuclear complexes based on uncommon Kramers lanthanoide ions CeIII, SmIII and YbII, Dalton Trans., 2022, 51, 12661–12669 RSC.
- N. Ahmed and K. U. Ansaria, Zero-field slow magnetic relaxation behavior of Zn2Dy in a family of trinuclear near-linear Zn2Ln complexes: synthesis, experimental and theoretical investigations, Dalton Trans., 2022, 51, 8766–8776 RSC.
- J. Mayans, L. Tesi, M. Briganti, M.-E. Boulon, M. Font-Bardía, A. Escuer and L. Sorace, Single-ion anisotropy and Intramolecular interactions in Ce3+ and Nd3+ dimers, Inorg. Chem., 2021, 60, 8692–8703 CrossRef CAS PubMed.
- G. M. Sheldrick, A short history of SHELX, Acta Crystallogr., Sect. A: Fundam. Crystallogr., 2008, 64, 112–122 CrossRef CAS PubMed.
- G. M. Sheldrick, Crystal structure refinement with SHELXL, Acta Crystallogr., Sect. C: Cryst. Struct. Commun., 2015, 71, 3–8 CrossRef PubMed.
- (a) M. Dolg, H. Stoll and H. Preuss, Energy–adjusted ab initio pseudopotentials for the rare earth elements, J. Chem. Phys., 1989, 90, 1730–1734 CrossRef CAS; (b) M. Dolg, H. Stoll, A. Savin and H. Preuss, Energy-adjusted pseudopotentials for the rare earth elements, Theor. Chim. Acta, 1989, 75, 173–194 CrossRef CAS; (c) M. Dolg, H. Stoll and H. Preuss, A combination of quasirelativistic pseudopotential and ligand field calculations for lanthanoid compounds, Theor. Chim. Acta, 1993, 85, 441–450 CrossRef CAS; (d) F. Weigend and R. Ahlrichs, Balanced basis sets of split valence, triple zeta valence and quadruple zeta valence quality for H to Rn: Design and assessment of accuracy, Phys. Chem. Chem. Phys., 2005, 7, 3297–3305 RSC; (e) F. Weigend, Accurate Coulomb-fitting basis sets for H to Rn, Phys. Chem. Chem. Phys., 2006, 8, 1057–1065 RSC; (f) A. Hellweg, C. Hattig, S. Hofener and W. Klopper, Optimized accurate auxiliary basis sets for RI-MP2 and RI-CC2 calculations for the atoms Rb to Rn, Theor. Chem. Acc., 2007, 117, 587–597 Search PubMed; (g) J. Chmela and M. E. Harding, Optimized auxiliary basis sets for density fitted post-Hartree–Fock calculations of lanthanide containing molecules, Mol. Phys., 2018, 116, 1523–1538 CrossRef CAS.
- S. K. Singh, T. Gupta, L. Ungur and G. Rajaraman, Magnetic Relaxation in Single-Electron Single-Ion Cerium(III) Magnets: Insights from Ab Initio Calculations, Chem. – Eur. J., 2015, 21, 13812–13819 CrossRef CAS PubMed.
- (a) L. F. Chibotaru, L. Ungur and A. Soncini, The Origin of Nonmagnetic Kramers Doublets in the Ground State of Dysprosium Triangles: Evidence for a Toroidal Magnetic Moment, Angew. Chem., Int. Ed., 2008, 47, 4126–4129 CrossRef CAS PubMed; (b) L. F. Chibotaru, L. Ungur, C. Aronica, H. Elmoll, G. Pilet and D. Luneau, Structure, Magnetism, and Theoretical Study of a Mixed-Valence CoII3CoIII4 Heptanuclear Wheel: Lack of SMM Behavior despite Negative Magnetic Anisotropy, J. Am. Chem. Soc., 2008, 130, 12445–12455 CrossRef CAS PubMed.
- M. J. Frisch, G. W. Trucks, H. B. Schlegel, G. E. Scuseria, M. A. Robb, J. R. Cheeseman, G. Scalmani, V. Barone, B. Mennucci, G. A. Petersson, H. Nakatsuji, M. Caricato, X. Li, H. P. Hratchian, A. F. Izmaylov, J. Bloino, G. Zheng, J. L. Sonnenberg, M. Hada, M. Ehara, K. Toyota, R. Fukuda, J. Hasegawa, M. Ishida, T. Nakajima, Y. Honda, O. Kitao, H. Nakai, T. Vreven, J. A. J. Montgomery, J. E. Peralta, F. Ogliaro, M. Bearpark, J. J. Heyd, E. Brothers, K. N. Kudin, V. N. Staroverov, R. Kobayashi, J. Normand, K. Raghavachari, A. Rendell, J. C. Burant, S. S. Iyengar, J. Tomasi, M. Cossi, N. Rega, N. J. Millam, M. Klene, J. E. Knox, J. B. Cross, V. Bakken, C. Adamo, J. Jaramillo, R. Gomperts, R. E. Stratmann, O. Yazyev, A. J. Austin, R. Cammi, C. Pomelli, J. W. Ochterski, R. L. Martin, K. Morokuma, V. G. Zakrzewski, G. A. Voth, P. Salvador, J. J. Dannenberg, S. Dapprich, A. D. Daniels, Ö. Farkas, J. B. Foresman, J. V. Ortiz, J. Cioslowski and D. J. Fox, Gaussian 09 (Revision D.01), Wallingford, CT, 2016 Search PubMed.
- A. D. Becke, Density–functional Thermochemistry. III. The Role of Exact Exchange, J. Chem. Phys., 1993, 98, 5648–5652 CrossRef CAS.
- M. Dolg, H. Stoll and H. Preuss, Energy-Adjusted Ab Initio Pseudopotentials for the Rare Earth Elements, J. Chem. Phys., 1989, 90, 1730–1734 CrossRef CAS.
- A. Schäfer, H. Horn and R. Ahlrichs, Fully Optimized Contracted Gaussian Basis Sets for Atoms Li to Kr, J. Chem. Phys., 1994, 100, 5829–5835 CrossRef.
- (a) M. Llunell, D. Casanova, J. Cirera, P. Alemany and S. Alvarez, Shape Program., version 2, Universitat de Barcelona, Barcelona, Spain, 2010 Search PubMed; (b) P. Alemany, D. Casanova, S. Alvarez, C. Dryzum and D. Avnir, Continuous Symmetry Measures: A New Tool in Quantum Chemistry, Rev. Comput. Chem., 2017, 30, 289–352 CAS.
- (a) C. Dryzum and D. Avnir, On the abundance of chiral crystals, Chem. Commun., 2012, 48, 5874–5876 RSC; (b) K. Chulvi, A. M. Costero, L. E. Ochando and P. Gaviña, Racemic Triarylmethanol Derivative Crystallizes as a Chiral Crystal Structure with Enantiomeric Disorder, in the Sohncke Space Group P21, Cryst. Growth Des., 2015, 15, 3452–3456 CrossRef CAS; (c) M. Nespolo, M. I. Aroyo and B. Souvignier, Crystallographic shelves: space-group hierarchy explained, J. Appl. Crystallogr., 2018, 51, 1481–1491 CrossRef CAS.
- A. Ben Khélifa, M. S. Belkhiria, G. Huang, S. Freslon, O. Guillou and K. Bernot, Single-molecule magnet behavior in polynuclear assembly of trivalent cerium ions with polyoxomolybdates, Dalton Trans., 2015, 44, 16458–16464 RSC.
- C. Takehara, P. L. Then, Y. Kataoka, M. Nakano, T. Yamamura and T. Kajiwara, Slow magnetic relaxation of light lanthanide-based linear LnZn2 trinuclear complexes, Dalton Trans., 2015, 44, 18276–18283 RSC.
- H. B. G. Casimir, D. Bijl and F. K. Du Pré, Measurememts on paramagnetic relaxation in chromium potassium alum, Physica, 1941, 8, 449–460 CrossRef CAS.
- C. E. Jackson, I. P. Moseley, R. Martinez, S. Sung and J. M. Zadrozny, A reaction-coordinate perspective of magnetic relaxation, Chem. Soc. Rev., 2021, 50, 6684–6699 RSC.
- D. Aravena and E. Ruiz, Spin dynamics in single-molecule magnets and molecular qubits, Dalton Trans., 2020, 49, 9916–9928 RSC.
- J. J. Le Roy, I. Korobkov, J. E. Kim, E. J. Schelter and M. Murugesu, Structural and magnetic conformation of cerocene [Ce(COT′′)2]− exhibiting a uniconfigurational f1 ground state and slow-magnetic relaxation, Dalton Trans., 2014, 43, 2737–2740 RSC.
- S. K. Gupta, S. Shanmugan, T. Rajeshkumar, A. Borah, M. Damjanović, M. Schulze, W. Wernsdorfer, G. Rajaraman and R. Murugavel, A single-ion single-electron cerrous magnets, Dalton Trans., 2019, 48, 15928–15938 RSC.
- (a) M. V. Marinho, D. O. Reis, W. X. C. Oliveira, L. F. Marques, H. O. Stumpf, M. Déniz, J. Pasán, C. Ruiz-Pérez, J. Cano, F. Lloret and M. Julve, Photoluminescent and Slow Magnetic Relaxation Studies on Lanthanide(III)-2,5-pyrazinedicarboxylate Frameworks, Inorg. Chem., 2017, 56, 2108–2123 CrossRef CAS PubMed; (b) A. López, C. Cruz, V. Paredes-García, V. Veiga, F. Lloret, J. Torres and R. Chiozzone, Field-induced magnetic relaxation in heteropolynuclear LnIII/ZnII metal organic frameworks: cerium and dysprosium cases, New J. Chem., 2023, 47, 21781–21789 RSC.
- Q.-W. Li, R.-C. Wan, Y.-C. Chen, J.-L. Liu, L.-F. Wang, J.-H. Jia, N. F. Chilton and M.-L. Tong, Unprecedent hexagonal bipyramidal single-ion magnets based on metallacrows, Chem. Commun., 2016, 52, 13365–13368 RSC.
- E. Pilichos, M. Font-Bardia, A. Escuer and J. Mayans, Structural and magnetic studies of mononuclear lanthanide complexes derived from N-rich chiral Schiff bases, Dalton Trans., 2021, 50, 1746–1753 RSC.
- S. Hiro, M. Maeda, Y. Kataoka, M. Nakano, T. Yamamura and T. Kajiwara, SMM behavior observed in Ce(III)Zn(II)2 linear trinuclear complex, Chem. Lett., 2013, 42, 1276–1278 CrossRef.
- H. Wada, S. Ooka, T. Yamamura and T. Kajiwara, Light lanthanide Complexes with crown ether and its aza derivative which show slow magnetic relaxation behaviors, Inorg. Chem., 2017, 56, 147–155 CrossRef CAS PubMed.
- (a) P. G. Klemens, Phys. Rev., 1961, 122, 443 CrossRef CAS; (b) D. W. Feldman, J. G. Castle and J. Murphy, spin relaxation of atomic hydrogen in CaF2-evidence for local mode, Phys. Rev., 1965, 138, A1208–A1216 CrossRef; (c) Y. Zhou, B. E. Bowler, G. R. Eaton and S. S. Eaton, Electron Spin Lattice Relaxation Rates for S = 12 Molecular Species in Glassy Matrices or Magnetically Dilute Solids at Temperatures between 10 and 300 K, J. Magn. Reson., 1999, 139, 165–174 CrossRef CAS PubMed.
- C. B. Harris, R. M. Shelby and P. A. Cornelius, Effects of Energy Exchange on Vibrational Dephasing Times in Raman Scattering, Phys. Rev. Lett., 1977, 38, 1415–1419 CrossRef CAS.
- N. V. Vugman and M. Rothier Amaral Jr., Influence of localized anharmonic vibrations on electron paramagnetic resonance spectroscopy, Phys. Rev. B, 1990, 42, 9837–9872 CrossRef PubMed.
Footnote |
| † Electronic supplementary information (ESI) available: Thermogravimetric curves, elemental analysis and IR data, SCXRD and PXRD data, excitation spectra, emission spectra at 77 K, ac magnetic data. CCDC 2261969–2261974 and 2341701. For ESI and crystallographic data in CIF or other electronic formats see DOI: https://doi.org/10.1039/d4dt00848k |
| This journal is © The Royal Society of Chemistry 2024 |


