 Open Access Article
The dehydration mechanism of Na and K birnessites: a comprehensive multitechnique study†
E.
André
*a,
D.
Cornu
 *a,
L.
Pérez Ramírez
bc,
P.
Durand
d,
J.-J.
Gallet
bc,
F.
Bournel
bc,
F.
Rochet
bc,
C.
Ruby
a,
C.
Carteret
a and
R.
Coustel
 *a
*a
aUniversité de Lorraine, CNRS, LCPME, F-54000 Nancy, France
bSorbonne Université, CNRS (UMR 7614), Laboratoire de Chimie Physique Matière et Rayonnement, 75252 Paris Cedex 05, France
cSynchrotron SOLEIL, L'Orme des Merisiers, F-91192 Gif-sur-Yvette, France
dUniversité de Lorraine, CNRS, CRM2, F-54000 Nancy, France
First published on 10th May 2024
Abstract
The structural, spectroscopic and electronic properties of Na and K birnessites were investigated from ambient conditions (birA) to complete dehydration, and the involved mechanisms were scrutinized. Density Functional Theory (DFT) simulations were employed to derive structural models for lamellar A0.33MnO2·xH2O (A = Na+ or K+, x = 0 or 0.66), subsequently compared with the experimental results obtained for Na0.30MnO2·0.75H2O and K0.22MnO2·0.77H2O materials. Thermal analysis (TGA-DSC), X-ray diffraction (XRD), Fourier Transform Infrared (FTIR) spectroscopy, and Near Ambient Pressure X-ray Photoemission Spectroscopy (NAP-XPS) measurements were conducted for both birnessites. Dehydration under vacuum, annealing, or controlled relative humidity were considered. Results indicated that complete birnessite dehydration was a two-stage process. In the first stage, water removal from the interlayer of fully hydrated birnessite (birA) down to a molar H2O/A ratio of ∼2 (birB) led to the progressive shrinkage of the interlayer distance (3% for Na birnessite, 1% for K birnessite). In the second stage, water-free (birC) domains with a shorter interlayer distance (20% for Na birnessite, 10% for K birnessite) appeared and coexisted with birB domains. Then, birB was essentially transformed into birC when complete dehydration was achieved. The vibrational properties of birA were consistent with strong intermolecular interactions among water molecules, whereas partially dehydrated birnessite (birB) showed a distinct feature, with 3 (for Na-bir) and 2 (for K-bir) vibrations that were reproduced by DFT calculations for organized water into the interlayer (x = 0.66). The study also demonstrated that the electronic structure of Na birnessite depends on the interlayer water content. The external Na+ electronic level (Na 2p) was slightly destabilized (+0.3 eV binding energy) under near ambient conditions (birA) compared to drier conditions (birB and birC).
Introduction
Birnessite stands out as one of the most abundant manganese oxides in the environment.1 It is prevalent in soils, sediments, oceanic nodules, and desert varnishes. The reactivity2–4 of this mineral plays a crucial role in controlling the chemistry of both water and soil, and it is suspected to be involved in biogeochemical cycles, such as those of nitrogen5 and iron.6 Additionally, birnessite is under investigation for its applications in energy storage7 and dihydrogen production.8Birnessite is a lamellar oxide with a structure that can exhibit triclinic or hexagonal symmetries. The layers consist of MnO6 octahedra with a negative charge dependent on the relative proportions of Mn(IV), Mn(III), and Mn(II), as well as the presence of vacancies. Cations (Na+, K+, Cs+, Ca2+, Pb2+, HO3+) in the interlayer space compensate for the layers’ charge, and their hydration can vary with temperature and water pressure conditions.
Water content significantly influences birnessite's structural stability9 and its properties for various applications.10 The interlayer is filled with one or two monolayers of water in addition to the cations, resulting in a variation in the interlayer distance from about 7 Å to 10 Å.1,11 In the latter case, the material is designated as buserite, and its dehydration under ambient conditions leads to the formation of birnessite. Recent experimental research has indicated that this transformation is not reversible at room temperature (RT) in the presence of water vapor up to the water dew point.12 The hydration of birnessite and the organization of water within this mineral are subjects of ongoing dynamic research. Three water configurations in birnessite's interlayer space are commonly considered: type I, where H2O forms two hydrogen bonds with two adjacent layers; type II, where H2O forms two hydrogen bonds with the same layer; and type III, where H2O forms one intermolecular hydrogen bond and one hydrogen bond with a layer.7,9 Molecular dynamics simulations have shown that water organization varies with water quantity and the nature of cations in the interlayer space, affecting ion exchange mechanisms.7 Simulations also predict birnessite samples to exhibit geometric water frustration, facilitating redox catalysis by lowering the Marcus reorganization energy of electron transfer.8 Finally, the capacitive behavior of birnessite originates from the intercalation of cations into a hydrated interlayer, wherein the existence of structural water results in an expanded separation between the cation and the oxide.13 Beyond the phenomena occurring within the layers, water adsorption on basal surfaces becomes significant for relative humidity (RH) of a small percentage, leading to the formation of water films on the external surfaces of crystallites.12
Complete dehydration of birnessites can be achieved through thermal treatments (>100 °C), accompanied by a reduction in the interlayer distance to ∼5 Å.8,14–17 At higher temperatures (>300 °C), oxygen atom departure leads to the transformation of this lamellar phase into tunnel phases.17 However, the process leading to dehydrated birnessite remains poorly understood. Evolution of the interlayer distance of birnessite obtained under acidic conditions was tracked by X-ray diffraction for RH in the range of 0–98% (at RT). Nevertheless, a distance of 6.9 Å measured at RH = 0% suggests incomplete dehydration.12 Infrared spectroscopy measurements on birnessites heated in the range of 25–140 °C indicated that the solid's dehydration temperature is directly related to the hydration energy of interlayer cations.12,18
This work aims to detail the mechanisms leading to the complete dehydration of Na and K birnessites. Both sodic and potassic triclinic birnessites (Na-bir and K-bir, respectively) were prepared under ambient conditions and their chemical compositions were determined by elemental and thermal analyses. Their structures were characterized by X-ray diffraction (XRD) during their progressive drying under vacuum and/or thermal treatment. Fourier transform infrared (FTIR) spectroscopy measurements were conducted to probe the water structure and cation environment during this process. To decipher experimental results, Density Functional Theory (DFT) simulations were utilized to generate models of birnessites: A0.33MnO2·xH2O (A = Na+ or K+, x = 0 or 0.66). Despite the prior molecular dynamics studies on hydrated birnessites7,8,12,19 as well as one DFT study of hydrated birnessite,19 a comprehensive description of hydrated or water-free birnessite at the DFT level of theory is still missing. Lastly, special attention was given to the evolution of the electronic structure of Na-bir. X-ray photoemission spectroscopy (XPS) is the primary method for characterizing the electronic structure of materials, but it has long been limited to studying materials under ultra-high vacuum (UHV) conditions, where they are dehydrated. Recent experimental developments now allow the probing of samples under environmental conditions, enabling the study of clay hydration.20,21 To the best of our knowledge, Near Ambient Pressure XPS (NAP-XPS) experiments on birnessite under water vapor are reported here for the first time for Na-bir in the RH range of 0–31%.
The results of thermal, structural, and spectroscopic analyses evidence that birnessite prepared under ambient conditions (RH ∼ 50%) undergoes dehydration in two successive stages. In the first stage, the gradual loss of water from the interlayer space results in a material where each cation is hydrated by two water molecules. The second stage abruptly leads to the complete dehydration of birnessite.
Materials and methods
Chemicals
All chemicals were purchased from Sigma-Aldrich. Manganese(II) chloride tetrahydrate (MnCl2·4H2O, ACS reagent, ≥98%) was used as the Mn2+ supplier, sodium permanganate monohydrate (NaMnO4·H2O, ACS reagent, ≥97%) or potassium permanganate (KMnO4, ACS reagent, ≥99.0%) was used as the MnO4− supplier and sodium hydroxide (NaOH, BioXtra, ≥98%, pellets anhydrous) or potassium hydroxide (KOH, ACS reagent, ≥85%, pellets) was used to provide the alkaline medium. Double distilled water (DDW, 18.2 MΩ cm) was used for all the experiments.Synthesis of birnessite
The triclinic sodic birnessite was obtained following the alkaline method of synthesis proposed by Boumaiza et al.22 in which 125 mL of NaOH (8.8 mol L−1) is added dropwise for 2 h to a mixture of 250 mL of NaMnO4 (or KMnO4, 0.1 mol L−1) and 125 mL of MnCl2 (0.6 mol L−1). The mixture is then kept under stirring for an additional 30 min, aged at 60 °C for 14 h, washed until the supernatant pH is 9–10 and dried at 60 °C for 16 h. The triclinic potassic birnessite was obtained by following the same method,22 using KOH and KMnO4.Birnessite characterization
The system studied can be modelled using the global formula A0.33+[Mn0.664+Mn0.333+O2]0.33−xH2O (A = Na, K; x = 0, 0.66), which crystallizes in a triclinic cell (a ≠ b ≠ c; α ≠ β ≠ γ). Since partial occupations are not possible in quantum calculations, a bigger system must be constructed. The smallest supercell that could be constructed without partial occupation is three times bigger and corresponds to the global formula A+[Mn24+Mn13+O6]−yH2O (y = 0, 2). Drits et al.29,30 proposed a vacancy free model for synthetic Na birnessite. In this model, the experimental data are explained by a regular distribution of the metallic cations in the layers, with Mn3+ forming rows of distorted octahedra, separated by rows of Mn4+ octahedra. This regular distribution of species in the sheets induces a regular distribution of the species in the interlayer domain as well. The smallest supercell able to model this distribution is a single layer triple cell of dimension (3a × b × c), where  defines the periodicity of the Mn3+ rows and
  is the direction colinear to these rows. But in this system, there is only one independent alkali metal cation enforcing the perfect alignment of the cation in the interlayer domain. To allow A+–A+ relaxation and a more realistic organization of the water molecules around the cations, a bigger system is necessary. For this reason, the modelled system corresponds to a supercell of dimension (3a × 2b × c), which is 6 times bigger than the original triclinic cell.
FTIR spectra in the far infrared region were collected on birnessite with a Thermo Nicolet 8700 spectrometer, equipped with a silicon beamsplitter and a DTGS-PE detector with a 4 cm−1 resolution. Each spectrum corresponds to 1 min accumulation. Measurements were performed at RT in transmission mode on birnessite thin films that were prepared by making slurries of the Mn oxide in water deposited on a polyethylene window and dried at RT. Measurements were performed in air and under vacuum (down to 10−5 mbar).
Na-bir hydration was carried out in the NAP-XPS reaction/analysis chamber. The sample temperature was regulated from 1 to 20 °C using a Peltier cooler. Water vapor (double-distilled water (DDW, 18.2 MΩ cm) purified by about 10 pump and thaw cycles) is introduced via leak valves into the analysis/reaction chamber. The chamber is itself pumped out via the differential pumping of the analyzer nozzle and the windowless beamline entrance (for more details, see ref. 32). Varying the opening of the leak valve allows to get the desired pressure. NAP-XPS measurements were performed at least 10 min after the pressure steady state was reached.
Na-bir was deposited from water suspension on a gold coated silicon substrate. Because of its low electrical conductivity, Na-bir charges positively under X-ray photon irradiation. According to the procedure detailed in ref. 21, the gold substrate was biased positively (+30 V) with respect to the analyzer in order to attract more efficiently negatively charged species and hence reduce charging more efficiently. One should also note that biasing the sample positively washes out the gas phase core level contribution in the NAP-XPS spectra.21 To avoid material alteration under irradiation, each NAP-XPS spectrum was acquired on a different spot (see the ESI†). In all cases, the photoemission spectra were referenced using the C 1s peak of hydrocarbon contamination set at 284.6 eV. For all XPS spectra, a Shirley background was subtracted from the photoemission peaks.
NAP-XPS measurements were performed on the Na-bir sample at 293 K under UHV, 0.1 or 2 mbar of water (RH = 0.0%, 0.4% or 9%, respectively; Psat(293 K) = 23 mbar). Finally, measurements were performed at a high RH of 31% (274 K and 2 mbar of water, Psat(274 K) = 6.4 mbar).
Results and discussion
DFT simulation
 direction) are shortened, while those in the perpendicular direction are lengthened. This effect is particularly important in the model, since it describes a perfectly ordered situation where Mn(III)O6 octahedra are infinitely aligned. Nonetheless, this model reveals the influence of the alkali metal cation on the sheet. The difference between a and b crystal parameters is larger for Na+ than for K+, which can be explained by the larger polarizing effect of Na+.
| a | b | c | α | β | γ | d 001 | |
|---|---|---|---|---|---|---|---|
| Na-bir 2H2O | 2.936 | 2.874 | 7.040 | 92.0 | 101.1 | 119.3 | 6.880 |
| Na-bir 0H2O | 2.921 | 2.831 | 5.672 | 89.7 | 102.5 | 119.0 | 5.470 |
| K-bir 2H2O | 2.928 | 2.881 | 7.231 | 90.8 | 103.6 | 119.2 | 6.980 |
| K-bir 0H2O | 2.925 | 2.833 | 6.459 | 90.0 | 100.2 | 119.0 | 6.290 |
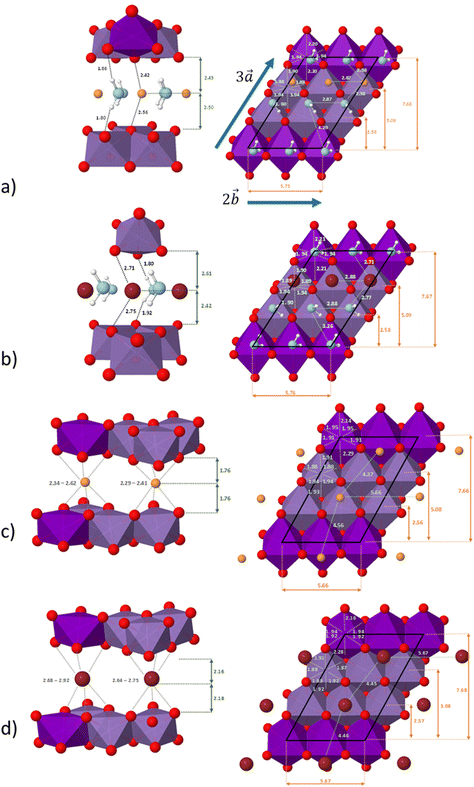
The distribution of the interlayer species with respect to the sheet as well as the local environment of the interlayer cations are shown in Fig. 1a and b for Na-bir 2H2O and K-bir 2H2O. Both hydrated compounds show an interlayer distance (d001, Mn plane to Mn plane distance) close to 6.9 Å, while the Shannon diameters of Na+ and K+ are significantly different (2.04 Å and 2.76 Å respectively). Interestingly, the calculated Olayer–A+ distances (2.42 Å and 2.71 Å for Na-bir and K-bir, respectively) are slightly longer than expected from Shannon radii (2.32 Å and 2.68 Å, respectively). It appears therefore that the interlayer spacing in hydrated birnessites is not driven by cation sizes. The water content as well as sheet–sheet repulsion and sheet–cation attraction should play a major role in controlling the value of d001. For both compounds, alkali metal cations and water molecules form alternating chains parallel to the  direction. Interlayer cations are not directly on top of the Mn(III)O6 octahedra, but instead they balance the negative charges of the sheet by forming chains of positive charges in between the negative charge chains. Both cations possess a coordination number of 6: they are solvated by 4 water molecules (at roughly 2.40 Å and 2.75 Å for Na+ and K+, respectively) and they interact preferentially with two of the layer's oxygen atoms. For both systems, the plane formed by the water molecules is exactly in the middle of the interlayer domain. This is again an argument for the control of the interlayer distance by the water molecules, the two hydrogen bonds with the layer's oxygens (1.8–1.9 Å) fixing the span, while the cation moves towards one layer to maximize the coulombic interaction.
The distribution of the interlayer species with respect to the sheet as well as the local environment of the interlayer cations is shown in Fig. 1c and d for Na-bir 0H2O and K-bir 0H2O, respectively. For both dehydrated compounds, the distribution of interlayer cations is modified: the cation chains in hydrated materials are replaced by a more uniform distribution, in which the two non-equivalent cations have a distinct local environment. One of them occupies a prismatic site directly over a Mn(III)O6 octahedron, while the second cation occupies a prismatic site formed only by Mn(IV)O6 octahedra. In all cases, the cations do not occupy the center of the site (as shown by the dispersion of the A+–O distances), but this deviation is more sensible for sites involving Mn(IV)O6 octahedra and also more sensible for Na+ than K+ (probably due to the size difference between the two cations). This deviation from an ideal case can also be seen through the dispersion of the cation–cation distances along the  direction (4.37 Å and 4.56 Å for Na-bir, when it is 4.45 Å and 4.46 Å for K-bir).
Finally, for both Na+ and K+, the interlayer cations form a plane at an equal distance from each sheet, meaning that in a dehydrated system, the structure of the material is controlled by the balance between sheet–sheet repulsion and sheet–cation attraction.
| %W(A) | %W(Mn) | n(A)/n(Mn) | %W(H2O) | n(H2O)/n(A) | Formula | |
|---|---|---|---|---|---|---|
| Na-bir | 6.7 ± 0.1 | 54 ± 3% | 0.30 ± 0.02 | 13 ± 1% | 2.5 ± 0.3 | Na0.30MnO2·0.75H2O |
| K-bir | 8.2 ± 0.1 | 54 ± 3% | 0.22 ± 0.02 | 13 ± 1% | 3.5 ± 0.3 | K0.22MnO2·0.77H2O |
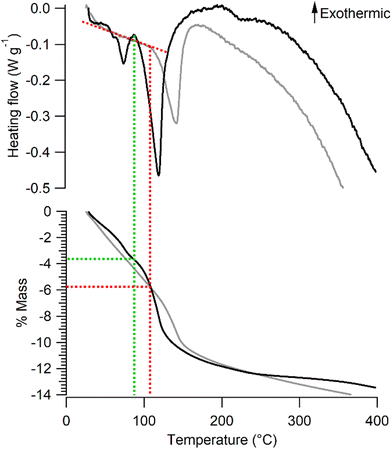
The mass loss of Na-bir and K-bir under dynamic conditions (annealing under an N2 flow) involves two stages. The mass of Na-bir decreases with temperature above RT, showing a subtle first leap at 73 °C and a more pronounced second one at 118 °C. These distinct endothermic events are clearly observed in heat flow measurements (see Fig. 2). Similarly, the mass of K-bir gradually decreases with temperature above RT and exhibits a marked leap at 141 °C. It seems reasonable to attribute these mass losses to two types of water molecules in Na-bir and K-bir. Then, both types would appear more strongly bound to the K-bir solid than to the Na-bir one. From our dynamic thermogravimetric measurements, the remaining water content at the end of the first stage (90 °C for Na-bir and 105 °C for K-bir) can be tentatively derived. It comes that the first stage ends when Na-bir (K-bir) has lost 3.7 ± 0.1% (5.8 ± 0.1%, respectively) of its mass, i.e. when the n(H2O)/n(A) molar ratio is close to 2 (1.8 ± 0.4 and 1.9 ± 0.5, respectively). Then, the second stage corresponds to the loss of two H2O molecules strongly bonded to an interlayer cation.
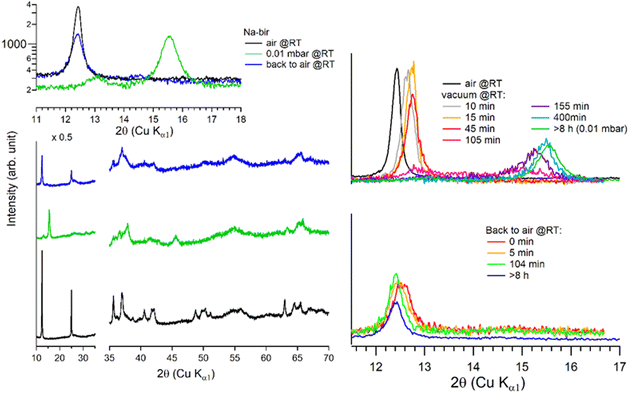 | ||
| Fig. 3 Successive XRD patterns of Na-bir under air, vacuum (0.01 mbar) and back to air (left) at RT. Successive low angle range XRD patterns of Na-bir for increasing pumping times (right) at RT. | ||
The evolution of the diffractograms during vacuum treatment is particularly informative (see Fig. 3, right). In the initial stage, the (001) peak gradually shifts by +0.31°, indicating that the water loss is accompanied by a reduction of the interfoliar distance d001 from 7.11 Å to 6.94 Å. In the second stage, the intensity of the peak at 12.7° decreases, while a new peak appears at ∼15°. The simultaneous presence of these two diffraction peaks suggests the coexistence of two types of domains: hydrated and dehydrated. The first stage involves a 3% decrease in d001, while the second stage leads to a total contraction of 20%. Finally, when birnessite is exposed to air again, the (001) peak returns to its initial position within a few minutes, indicating that rehydration is facile under these conditions.
It is worth noting that after more than 8 hours at 0.01 mbar, the Na-bir diffractogram exhibits a weak component at 12.9° (6.9 Å), suggesting the residual presence of hydrated domains. To force dehydration, diffractograms were measured for a sample held under vacuum at increasing temperatures of up to 200 °C (see Fig. 4). The (001) peak slightly shifts to a higher angle of up to 15.6° (d001 = 5.7 Å), and notably, a new peak grows with temperature at 16.4° (5.4 Å). Upon return to air, the material's diffractogram shows broader and weaker peaks at the same position as before dehydration, suggesting that the dehydration/hydration cycle leads to less crystalline birnessite. Additional peaks at 14.7° and 26.5° also show that annealing leads to the appearance of new phases, the identification of which is beyond the scope of this work.
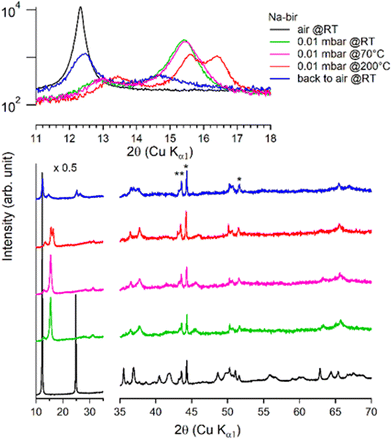 | ||
| Fig. 4 Successive XRD patterns of Na-bir under air, vacuum (0.01 mbar at RT, 70 °C, and 200 °C) and back to air. * corresponds to experimental artefacts (aluminum sample holder). | ||
Under vacuum (>8 h at 0.01 mbar, at RT), the behavior of K-bir is significantly different (Fig. 5): the interlayer distance d001 decreases by only 1% (7.10 Å to 7.03 Å). A thermal treatment (>100 °C) is necessary to observe a more substantial reduction in d001, which reaches 10% (6.44 Å) at 400 °C (see Table 3). Back to air at RT for 4 days, the material exhibits a diffractogram different from that of the initial K-bir: the peak at low angles does not return to its initial position, and additional peaks are observed, notably at 28°, 32°, and 40°, due to the formation of additional phases, the identification of which is beyond the scope of this work. It appears that thermal treatment leads to alteration in K-bir.
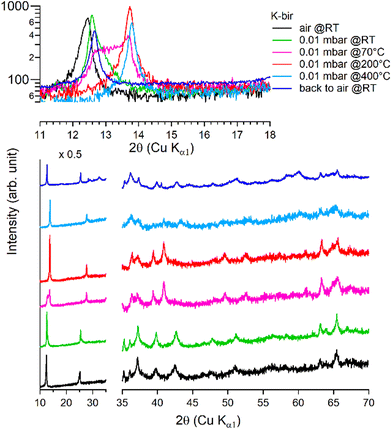 | ||
| Fig. 5 Successive XRD patterns of K-bir under air, vacuum (0.01 mbar at RT, 70 °C, 200 °C, and 400 °C) and back to air. | ||
| Na-bir | 2θ (°) | d 001 (Å) | Δd/d (%) | |
|---|---|---|---|---|
| Air@RT | 12.433 | 7.11 | Na-birA | |
| 0.2 mbar (t = 15 min)@RT | 12.759 | 6.93 | 3% | Na-birB |
| 0.01 mbar (t > 8 h)@RT | 15.544 | 5.70 | 20% | Na-birC |
| back to air@RT | 12.416 | 7.12 | 0% | Na-birA |
| Air @RT | 12.320 | 7.18 | Na-birA | |
| 0.01 mbar (t > 8 h)@RT | 15.438 | 5.74 | 20% | Na-birC |
| 0.01 mbar@200 °C | 15.591 | 5.68 | 21% | |
| Back to air @RT | 12.429 | 7.12 | 1% | |
| K-bir | 2θ (°) | d 001 (Å) | Δd/d (%) | |
|---|---|---|---|---|
| Air@RT | 12.465 | 7.10 | K-birA | |
| 0.01 mbar (t > 8 h)@RT | 12.582 | 7.03 | 1% | K-birB |
| 0.01 mbar@200 °C | 13.738 | 6.44 | 9% | K-birC |
| 0.01 mbar@400 °C | 13.789 | 6.42 | 10% | |
| Back to air@RT | 12.661 | 6.99 | 2% |
From these results, our understanding is that the steps leading to the complete dehydration of both Na-bir and K-bir are similar, even though they occur under different pressure and temperature conditions. In the first step, the “ambient” material (denoted as birA) gradually experiences a decrease in interlayer distance by a few percentage points, leading to a partially dehydrated material (denoted as birB). In the second stage, a lamellar species with a 10 to 20% smaller interlayer distance (denoted as birC) coexists with birB and becomes predominant as dehydration progresses. It is observed that for Na-bir, both steps occur successively at RT for a vacuum limit of 0.01 mbar. In contrast, for K-bir, the second step was only observed for a temperature higher than RT (at 0.01 mbar) in agreement with the TGA-DSC measurements indicating that water is strongly bonded to K-bir.
Results from numerical simulations contribute to a better understanding of the structure of these materials. The calculated interlayer distances for structures with 2 water molecules per cation (Na-bir 2H2O: 6.88 Å, K-bir 2H2O: 6.98 Å) align well with those measured for Na-birB (6.93 Å) and K-birB (7.03 Å). Furthermore, simulations anticipate a reduction in d001 of 20% and 10% for Na-bir and K-bir, respectively, during complete dehydration to birC. This suggests that materials under ambient conditions (birA, d001 = 7.1 Å) present more than 2 water molecules per cation. In this case, d001 is not primarily dependent on the cation but is mainly influenced by the water excess in the interlayer space.
Finally, it should be noted that thermal analyses were performed under dynamic conditions while XRD patterns were recorded under static conditions of temperature. Nevertheless, both experiments showed that birnessite under ambient conditions (birA) completely dehydrates (birC) according to a two-stage process. Both also suggested that the partially dehydrated birnessite with ∼2 water molecules per interlayer cation (birB) plays a special role, as an intermediate product.
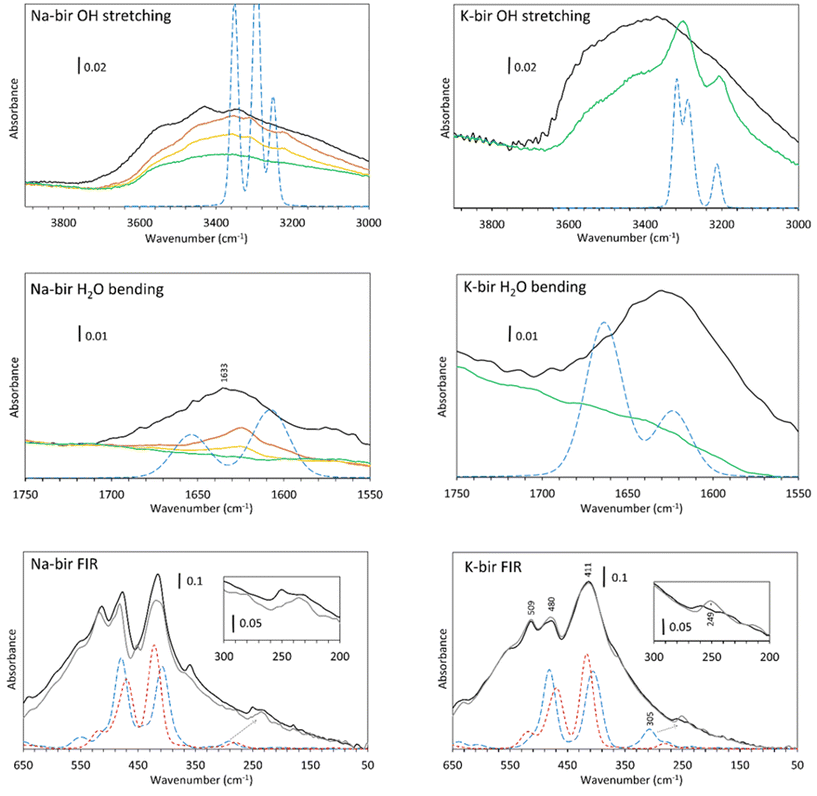
In the OH stretching region (Fig. 6, top), a broad absorption band is observed from 2400 to 3700 cm−1 for both specimens observed in air (black line), which is in agreement with the spectra obtained by Ling et al.,36 Luo et al.,37 Johnson et al.9 and our previous results.22 According to Johnson et al., these are the symmetric (ν1) and antisymmetric (ν3) stretching vibrations of water. It should be noted that pure liquid H2O presents a broad and unstructured absorption band centered at 3380 cm−1, which is close to the OH stretch band of K-bir in air.38 The difference between Na-bir and K-bir is the presence of additional peaks in Na-bir at 3345 and 3430 cm−1 in agreement with the results of Ling et al.36 as well as Johnson et al.9
Upon dehydration, two phenomena are observed while reaching the vacuum. Firstly, the broad stretching band from 3000 to 3700 cm−1 decreases gradually and more narrow bands emerge. For Na-bir, the peaks are at 3220, 3310 and 3360 cm−1. For K-bir, they are at 3200 and 3300 cm−1. This is an indication of an organization of the water in the interlayer space. Those bands are then removed for prolonged vacuum times under about 0.01 mbar for Na-bir (Fig. 6, top) and 10−5 mbar for K-bir (see ESI Fig. S1†). Interestingly, these peaks can be reproduced by the DFT results with two water molecules per cation (see Fig. 6, top). The same scaling factor of 0.92 was applied for both Na-bir and K-bir as a correction for the anharmonicity of these vibrations. As anharmonicity of OH stretching increases with the H bond intensity,39 the low scaling factor used here accounts for strong interactions between water molecules and the layers (this scaling factor was not used for the water bending and the low frequency peaks). The calculated peaks at high wavenumbers (3353 and 3295 cm−1 for Na-bir, 3319 and 3288 cm−1 for K-bir) correspond to antisymmetric H2O stretching while those at low wavenumbers (3249 cm−1 for Na-bir and 3210 cm−1 for K-bir) correspond to the symmetric ones. The distinct environments for the 2 water molecules induce a splitting of the antisymmetric modes. This splitting is larger for Na-bir than for K-bir, explaining the extra band observed experimentally.
From these results, dehydration of the birnessite is again a two-step process. Water molecules in birA, exposed to air, present a broad OH stretching absorption band, which suggests strong intermolecular interactions among water molecules. After a short time under vacuum, the vibrational properties of birnessites correspond to ordered water and can be attributed to birB, with 2 water molecules connected to a cation and bonded to adjacent sheets. Complete dehydration requires harsher conditions to produce birC, especially for K-bir. Upon rehydration (ESI Fig. S2†), for K-bir under RH = 2%, two bands at 3202 and 3300 cm−1 appear, in agreement with what is observed by Johnson et al.9 who claimed that “K birnessite showed the most dramatic rehydration capacity”. The rehydration of Na-bir is not easy and a relative humidity of 30% is necessary to get a spectrum similar to the one obtained in air (see ESI Fig. S2†).
Mn–O vibrations (Fig. 6, bottom) are responsible for the most intense absorption bands at 415, 478 and 511 cm−1 in both samples.22 Those vibrations are essentially unchanged through dehydration. However, it is known that some vibrations below 500 cm−1 are related to the hydrated cation. This was observed through Raman spectra40 as well as in our Raman analysis (ESI Fig. S3†), and it was discovered recently that sodium40 and potassium41 generate a Raman band at about 280 cm−1. In our spectra, the vibration around 250 cm−1 is strongly modified through dehydration. It is therefore likely that these bands are not related to the layers but more likely to a vibration of the inserted cations, with or without water molecules. Calculations indicate that a large vibrational band is expected at slightly higher wavenumbers, which is drastically affected by hydration. This band is linked to the coupling of the vibration of the water molecules with some oxygens in the layers (see displacement vectors associated with the corresponding normal mode in ESI Fig. S4†).
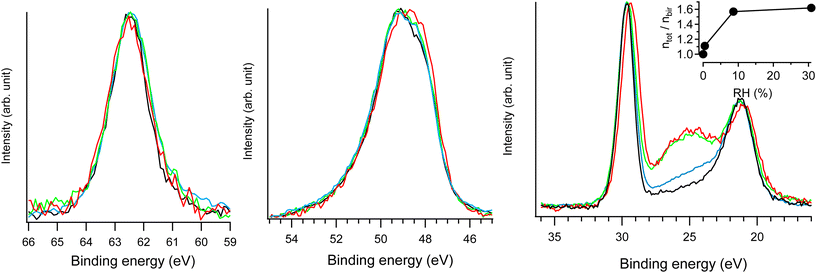 | ||
| Fig. 7 Na 2s (left), Mn 3p (middle) and Na 2p & O 2s (right) NAP-XPS spectra of Na-bir (hν = 420 eV) at RH = 0.0 (black; 293 K, UHV), RH = 0.4% (blue; 293 K, 0.1 mbar water), RH = 9% (green; 293 K, 2 mbar water), and RH = 31% (red; 274 K, 2 mbar water). In each spectral region, the intensities were normalized by the maximum (unnormalized spectra are presented in Fig. S7†). ntot/nbirvs. RH derived from NAP-XPS measurements is given in the inset, with ntot and nbir as the amount of oxygen in hydrated and water free Na-bir (under UHV@RT), respectively. | ||
The main evolution in the NAP-XPS spectra for RH in the range of 0.4–31% corresponds to the appearance of an O 2s contribution at 25 eV binding energy. It is important to note that to suppress the gas phase contribution to photoemission spectra, a +30 V potential was applied to the birnessite sample holder with respect to the analyzer entrance.20,21 Therefore, the O 2s enhancement arises solely from water uptake in the solid phase (i.e., water insertion into the interlayer region). The evolution of oxygen content can be assessed from photoemission measurements using the following equation:
| ntot/nbir = (AO 2s/ANa 2p)hydratedbir/(AO 2s/ANa 2p)bir | (1) |
Considering dehydrated birnessite with the formula [MnO2][0.30Na+], the ntot/nbir ratio of ∼1.6 estimated for RH > 9% corresponds to hydrated birnessite with the formula Na0.30MnO2·1.2H2O. Such water content is significantly higher than that estimated for birnessite under ambient conditions (Na0.30MnO2·0.75H2O). This result may be explained by the formation of a water film on the external solid's surface during hydration. This assumption is supported by previously reported volumetric water adsorption measurements on birnessite.12 Moreover, NAP-XPS measurements evidenced similar water adsorption films on LDH.20 Because the depth probed by XPS (the mean free path of electrons with 400 eV kinetic energy is ∼10 Å) is of the same order of magnitude as d001 (∼7 Å), a nanometric-thick water film on birnessite should significantly contribute to the O 2s signal.
As RH increases from 9 to 31%, the ntot/nbir ratio evolves from 1.57 to 1.62, indicating a slight increase in the amount of water in/on the material. Simultaneously, the Na 2p peak shifts by 0.3 eV towards lower binding energies, while the position of the Na 2s component remains unchanged. As detailed in the ESI,† radiolysis effects can be ruled out as the cause of the Na 2p shift. Rather, this evolution corresponds to the modification of the Na+ environment. Hydration primarily affects the less bound electronic levels of the Na+ ion. Similar behavior was observed for Cl− ions in the interlayer space of hydrated LDH20: during hydration, Cl 3p levels shifted by 0.3 eV towards higher binding energies, while the position of the Cl 2p level remained essentially unchanged. Results from XRD and FTIR allow for an interpretation of the evolution of the Na+ electronic structure. Increasing RH reinforces the interlayer water content and Na-birB evolves to Na-birA. Accordingly, d001 increases (see the XRD section) and intermolecular interactions between water molecules tend to get stronger (see the FTIR section). Then, the destabilization of the Na 2p levels observed for RH = 31% can be attributed to a less organized Na+ hydration sphere when the molar Na/H2O ratio exceeds 2.
Conclusion
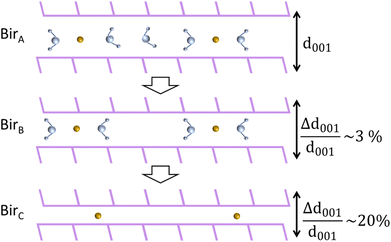
This study investigates the dehydration mechanisms of Na and K birnessites, characterized by over 2 water molecules per interlayer cation (H2O/Na = 2.5 and H2O/K = 3.5), under ambient conditions (birA). Thermal, structural, vibrational, and electronic analyses, conducted down to RH = 0%, collectively evidence a two-stage dehydration process, as depicted in Fig. 8.Thermal analysis reveals that the first stage ends (birB) for water content corresponding to a molar ratio of H2O/A of ∼2 (A = Na+ or K+).
During the first stage (birA → birB), the interlayer distance is progressively reduced (1–3%) with water loss, reaching a value essentially imposed by the remaining H2O molecules forming hydrogen bonds with adjacent sheets, regardless of the nature of the interlayer cation (Na+ or K+). Further dehydration leads to the appearance of completely dehydrated (birC) domains, with an interlayer distance 10 to 20% shorter than that of birA. During this second stage, both birB and birC domains coexist, with the birC amount increasing and tending to dominate when dehydration is complete.
The vibration properties of birA are consistent with strong intermolecular interactions among water molecules. Partially dehydrated birnessites show a distinct feature with 3 (for Na-bir) and 2 (for K-bir) vibrations for the OH stretching modes that are reproduced by DFT calculations performed on birB models. Vibrations at low wavenumbers are also affected by the disappearance of the water molecules.
NAP-XPS enables the investigation of H2O intercalation into Na-bir during hydration (RH > 0.4%) and the formation of a nanometer-thick water layer on the external surface of birnessite (RH > 9%). The electronic structure of interlayer cations is minimally affected when dehydrated Na-birC is exposed to water vapor up to RH = 9%. Notably, at RH = 31%, the highest occupied Na+ level (Na 2p) exhibits a slight shift, while the deeper level (Na 2s) remains unchanged. Enhanced intermolecular interactions among interlayer water molecules lead to the weakening of the cation hydration sphere in Na-birA, subsequently destabilizing their external level.
Author contributions
R.C., D.C., and E.A. wrote the manuscript. L.P.R., F.R., J.J.G. and F.B. contributed to the NAP-XPS experiments. C.C contributed to the FTIR experiments. P.D. performed XRD measurements. C.R. contributed to the synthesis of birnessite materials. All authors have given approval to the final version of the manuscript.Conflicts of interest
There are no conflicts of interest to declare.Acknowledgements
The DFT calculations were possible thanks to High Performance Computing resources provided by the EXPLOR center hosted by the University of Lorraine. The authors greatly acknowledge Lionel Richaudeau and the Plateforme PhotoNS of the L2CM Laboratory, University of Lorraine, for thermal analysis. The authors thank the PMD2X X-ray diffraction facility of the Laboratory Crystallographie, Resonance Magnetique et Modelisations (CRM2), University of Lorraine, for X-ray diffraction measurements (https://crm2.univ-lorraine.fr/lab/fr/services/pmd2x). FTIR spectrometric measurements were performed at the spectroscopy and microscopy service facility of SMI LCPME (University of Lorraine-CNRS; https://www.lcpme.ul.cnrs.fr/equipements/smi/). The authors would like to thank Romain Chevigny for the preliminary FTIR measurements and Marc-André Maupoix for his assistance with the initial ANP-XPS data analysis.L. P. R. thanks the Ecole Doctorale ED388 and Sorbonne Université for her PhD grant.
The NAP-XPS experiment, managed by the LCPMR team (Sorbonne Université), was funded by the Ile-de-France Region (Photoemission Environnementale en Ile-de-France, SESAME no. 090003524), the Agence Nationale de la Recherche (Surfaces under Ambient Pressure with Electron Spectroscopy, ANR-08-BLAN-0096), and Université Pierre et Marie Curie (now Sorbonne Universite). Synchrotron SOLEIL supported the integration of the setup to the TEMPO beamline. Some of the experiments were carried out with the approval of synchrotron SOLEIL (proposal number: 20170457).
References
- J. E. Post, Proc. Natl. Acad. Sci. U. S. A., 1999, 96, 3447 CrossRef CAS PubMed.
- M. Zaied, E. Chutet, S. Peulon, N. Bellakhal, B. Desmazières, M. Dachraoui and A. Chaussé, Appl. Catal., B, 2011, 107, 42–51 CrossRef CAS.
- M. J. Scott and J. J. Morgan, Environ. Sci. Technol., 1995, 29, 1898–1905 CrossRef CAS PubMed.
- M. Shi, Q. Li, Q. Wang, X. Yan, B. Li, L. Feng, C. Wu, R. Qiu, H. Zhang, Z. Yang, W. Yang, Q. Liao and L. Chai, J. Environ. Sci., 2024, 139, 496–515 CrossRef PubMed.
- H. Boumaiza, R. Coustel, C. Despas, C. Ruby and L. Bergaoui, J. Solid State Chem., 2018, 258, 543–550 CrossRef CAS.
- A. Doggaz, R. Coustel, P. Durand, F. Humbert and C. Ruby, Materials, 2020, 13, 3777 CrossRef CAS PubMed.
- S. Park and K. D. Kwon, ACS Earth Space Chem., 2021, 5, 3159–3169 CrossRef CAS.
- R. K. Bhullar, M. J. Zdilla, M. L. Klein and R. C. Remsing, J. Mater. Chem. A, 2021, 9, 6924–6932 RSC.
- E. A. Johnson and J. E. Post, Am. Mineral., 2006, 91, 609–618 CrossRef CAS.
- P. Chomkhuntod, N. Ma, S. Kosasang, S. Duangdangchote, N. Phattharasupakun, C. Jangsan and M. Sawangphruk, ACS Appl. Energy Mater., 2020, 3, 1402–1409 CrossRef CAS.
- K. Kuma, A. Usui, W. Paplawsky, B. Gedulin and G. Arrhenius, Mineral. Mag., 1994, 58, 425–447 CrossRef CAS PubMed.
- W. Cheng, J. Lindholm, M. Holmboe, N. T. Luong, A. Shchukarev, E. S. Ilton, K. Hanna and J.-F. Boily, Langmuir, 2021, 37, 666–674 CrossRef CAS PubMed.
- S. Boyd, K. Ganeshan, W.-Y. Tsai, T. Wu, S. Saeed, D. Jiang, N. Balke, A. C. T. van Duin and V. Augustyn, Nat. Mater., 2021, 20, 1689–1694 CrossRef CAS PubMed.
- S. Ching, D. J. Petrovay, M. L. Jorgensen and S. L. Suib, Inorg. Chem., 1997, 36, 883–890 CrossRef CAS.
- R. Chen, P. Zavalij and M. S. Whittingham, Chem. Mater., 1996, 8, 1275–1280 CrossRef CAS.
- S. Bach, J. P. Pereira-Ramos and N. Baffier, J. Solid State Chem., 1995, 120, 70–73 CrossRef CAS.
- P. Le Goff, N. Baffier, S. Bach, J. P. Pereira-Ramos and R. Messina, Solid State Ionics, 1993, 61, 309–315 CrossRef CAS.
- N. T. Luong, H. Oderstad, M. Holmboe and J.-F. Boily, Phys. Chem. Chem. Phys., 2023, 25, 17352–17359 RSC.
- R. T. Cygan, J. E. Post, P. J. Heaney and J. D. Kubicki, Am. Mineral., 2012, 97, 1505–1514 CrossRef CAS.
- R. Coustel, A. Boucly, E. André, A. Di Bitetto, F. Bournel, J.-J. Gallet, F. Rochet and C. Carteret, J. Phys. Chem. C, 2023, 127, 4144–4153 CrossRef CAS.
- A. Boucly, F. Rochet, Q. Arnoux, J.-J. Gallet, F. Bournel, H. Tissot, V. Marry, E. Dubois and L. Michot, Sci. Rep., 2018, 8, 6164 CrossRef PubMed.
- H. Boumaiza, R. Coustel, G. Medjahdi, C. Ruby and L. Bergaoui, J. Solid State Chem., 2017, 248, 18–25 CrossRef CAS.
- R. Dovesi, A. Erba, R. Orlando, C. M. Zicovich-Wilson, B. Civalleri, L. Maschio, M. Rérat, S. Casassa, J. Baima, S. Salustro and B. Kirtman, Wiley Interdiscip. Rev.: Comput. Mol. Sci., 2018, 8, e1360 Search PubMed.
- R. Dovesi, V. R. Saunders, C. Roetti, R. Orlando, C. M. Zicovich-Wilson, F. Pascale, B. Civalleri, K. Doll, N. M. Harrison, I. J. Bush, P. D'Arco, M. Llunell, M. Causà, Y. Noël, L. Maschio, A. Erba, M. Rerat and S. Casassa, CRYSTAL17 User's Manual, Torino, University of Torino., 2017 Search PubMed.
- A. D. Becke, J. Chem. Phys., 1993, 98, 5648–5652 CrossRef CAS.
- C. Lee, W. Yang and R. G. Parr, Phys. Rev. B: Condens. Matter Mater. Phys., 1988, 37, 785–789 CrossRef CAS PubMed.
- S. Grimme, J. Antony, S. Ehrlich and H. Krieg, J. Chem. Phys., 2010, 132, 154104 CrossRef PubMed.
- D. Vilela Oliveira, J. Laun, M. F. Peintinger and T. Bredow, J. Comput. Chem., 2019, 40, 2364–2376 CrossRef CAS PubMed.
- V. A. Drits, E. Silvester, A. I. Gorshkov and A. Manceau, Am. Mineral., 1997, 82, 946–961 CAS.
- B. Lanson, V. A. Drits, Q. Feng and A. Manceau, Am. Mineral., 2002, 87, 1662–1671 CrossRef CAS.
- F. Polack, M. Silly, C. Chauvet, B. Lagarde, N. Bergeard, M. Izquierdo, O. Chubar, D. Krizmancic, M. Ribbens, J.-P. Duval, C. Basset, S. Kubsky, F. Sirotti, R. Garrett, I. Gentle, K. Nugent and S. Wilkins, TEMPO: a New Insertion Device Beamline at SOLEIL for Time Resolved Photoelectron Spectroscopy Experiments on Solids and Interfaces, Melbourne (Australia), 2010, pp. 185–188 Search PubMed.
- H. Liu, A. Zakhtser, A. Naitabdi, F. Rochet, F. Bournel, C. Salzemann, C. Petit, J.-J. Gallet and W. Jie, ACS Catal., 2019, 9, 10212–10225 CrossRef CAS.
- S. Hirano, R. Narita and S. Naka, Mater. Res. Bull., 1984, 19, 1229–1235 CrossRef CAS.
- Y. Maréchal, J. Mol. Struct., 1994, 322, 105–111 CrossRef.
- L. Yan, Clays Clay Miner., 1996, 44, 749–756 CrossRef CAS.
- F. T. Ling, J. E. Post, P. J. Heaney, J. D. Kubicki and C. M. Santelli, Spectrochim. Acta, Part A, 2017, 178, 32–46 CrossRef CAS PubMed.
- J. Luo, A. Huang, S. H. Park, S. L. Suib and C.-L. O'Young, Chem. Mater., 1998, 10, 1561–1568 CrossRef CAS.
- Y. Maréchal, J. Chem. Phys., 1991, 95, 5565–5573 CrossRef.
- C. Carteret, J. Phys. Chem. C, 2009, 113, 13300–13308 CrossRef CAS.
- J. E. Post, D. A. McKeown and P. J. Heaney, Am. Mineral., 2021, 106, 351–366 CrossRef.
- P. Scheitenberger, H. Euchner and M. Lindén, J. Mater. Chem. A, 2021, 9, 18466–18476 RSC.
- H. Boumaiza, A. Renard, M. Rakotomalala Robinson, G. Kervern, L. Vidal, C. Ruby, L. Bergaoui and R. Coustel, J. Solid State Chem., 2019, 272, 234–243 CrossRef CAS.
Footnote |
| † Electronic supplementary information (ESI) available. See DOI: https://doi.org/10.1039/d4dt00588k |
| This journal is © The Royal Society of Chemistry 2024 |

