 Open Access Article
Modulating anti-inflammatory and anticancer properties by designing a family of metal-complexes based on 5-nitropicolinic acid†
Amalia
García-García
 *a,
Marta
Medina-O'donnell
b,
Sara
Rojas
 a,
Mariola
Cano-Morenilla
 b,
Juan
Morales
c,
María Mar
Quesada-Moreno
 c,
Juan
Sainz
bdef,
Iñigo J.
Vitorica-Yrezabal
 a,
Antonio
Rodríguez-Diéguez
 a,
Amparo
Navarro
 *c and
Fernando J.
Reyes-Zurita
*b
aDepartment of Inorganic Chemistry, Faculty of Sciences, University of Granada, Av. Fuentenueva S/N, 18071 Granada, Spain. E-mail: amaliagar@ugr.es
bDepartment of Biochemistry and Molecular Biology I, Faculty of Sciences, University of Granada, Av. Fuentenueva S/N, 18071 Granada, Spain. E-mail: ferjes@ugr.es
cDepartment of Physical and Analytical Chemistry, Faculty of Experimental Sciences, University of Jaén, Campus Las Lagunillas, 23071 Jaén, Spain. E-mail: anavarro@ujaen.es
dGenomic Oncology Area, Centre for Genomics and Oncological Research (GENYO), Pfizer-University of Granada-Andalusian Regional Government, Av. de la Ilustración 114, 18016, Granada, Spain
eInstituto de Investigación Biosanitaria Ibs. Granada, Av. de Madrid 15, 18012, Granada, Spain
fConsortium for Biomedical Research in Epidemiology and Public Health (CIBERESP), Madrid, Spain
First published on 26th April 2024
Abstract
A new family of six complexes based on 5-nitropicolinic acid (5-npic) and transition metals has been obtained: [M(5-npic)2]n (MII = Mn (1) and Cd (2)), [Cu(5-npic)2]n (3), and [M(5-npic)2(H2O)2] (MII = Co (4), Ni (5), and Zn (6)), which display 1D, 2D, and mononuclear structures, respectively, thanks to different coordination modes of 5-npic. After their physicochemical characterization by single-crystal X-ray diffraction (SCXRD), elemental analyses (EA), and spectroscopic techniques, quantum chemical calculations using Time-Dependent Density Functional Theory (TD-DFT) were performed to further study the luminescence properties of compounds 2 and 6. The potential anticancer activity of all complexes was tested against three tumor cell lines, B16-F10, HT29, and HepG2, which are models widely used for studying melanoma, colon cancer, and liver cancer, respectively. The best results were found for compounds 2 and 4 against B16-F10 (IC50 = 26.94 and 45.10 μg mL−1, respectively). In addition, anti-inflammatory studies using RAW 264.7 cells exhibited promising activity for 2, 3, and 6 (IC50 NO = 5.38, 24.10, and 17.63 μg mL−1, respectively). This multidisciplinary study points to complex 2, based on CdII, as a promising anticancer and anti-inflammatory material.
Introduction
Over the past few decades, interest in medicinal inorganic chemistry has substantially increased, with emphasis on the development of therapeutic and diagnostic metallodrugs. Metal-containing contrast agents and drugs are administered daily to diagnose and treat a variety of conditions, including infectious diseases, mental disorders, and cancer.1 One of the most well-known metallodrugs, cisplatin, is widely used to treat many types of cancers. However, due to its dose-dependent toxicity, less toxic analogues, such as carboplatin, oxaliplatin, or lobaplatin, have been developed.2 Although there has been significant progress in the fight against cancer in recent years, the disease remains as a leading cause of death worldwide. To overcome drug resistance and the side effects of conventional treatments, new medications are required.3Chronic inflammation is closely associated with cancer because inflammatory cells and mediators (i.e., cytokines or prostaglandins) are present in several tumor tissues.4 While further research is required to fully understand the link between cancer and inflammation, non-steroidal anti-inflammatory drugs (NSAIDs) and selective cyclooxygenase (COX) blockers are common agents administered parallelly to cancer treatment. Nevertheless, the risks of long-term NSAID administration are still unclear.5 In view of this scenario, combining anticancer and anti-inflammatory properties in a single formulation may help to combat this fatal disease while improving patients’ well-being. Furthermore, the design of multifunctional materials with therapeutic and luminescence properties with large Stokes shifts represents an interesting field to be developed for applications such as drugs or fluorescent sensors of pH, polarity, etc., in the cellular microenvironment using bioimaging techniques, since it would provide high-contrast images and avoid undesirable reabsorption processes.6,7
Combining metal ions with active pharmaceutical agents or biomolecules as ligands is a common approach in medicinal inorganic chemistry to achieve biocompatibility and modulate multiple targets simultaneously.8 In this work, 5-nitropicolinate (5-npic) was used as a linker because of its similarity to picolinic acid, a metabolic product of L-tryptophan catabolism known for its neuroprotective, immunological, and anti-proliferative effects in the body.9 In fact, chromium picolinate is widely used as a nutritional supplement for type 2 diabetes patients since chromium is essential for proper carbohydrate and lipid metabolism.10 Further, FeIII, NiII, CuII, ZnII, and AgI picolinate-based compounds have demonstrated antimicrobial activity.11,12
Among all picolinic derivatives, the nitro-substituted metal complexes have received far less attention in the search for novel metal complexes; only four compounds based on 5-npic reported by us13,69 and some examples focused on 4-nitropicolinic acid and 4-nitropyridine-2-carboxylic-1-oxide acid14,15 have been published. Additionally, the luminescence of the picolinic skeleton has been studied through lanthanide complexes, showing an intense emission.16,17 However, no previous in depth studies on the luminescence properties of 5-npic or any other nitro-substituted derivative and their coordination compounds have been described.
Here, novel multifunctional coordination compounds have been synthesized using the 5-npic ligand and a range of transition metals, giving rise to six complexes with the general formulae [M(5-npic)2]n (MII = Mn (1) and Cd (2)), [Cu(5-npic)2]n (3), and [M(5-npic)2(H2O)2] (MII = Co (4), Ni (5), and Zn (6)). A comprehensive structural and photophysical characterization was performed using single-crystal X-ray diffraction (SCXRD), elemental analysis (EA), and a variety of spectroscopic techniques (Fourier-transform infrared–FTIR, UV-Vis and fluorescence spectroscopy). To shed light on the origin of the luminescence properties of complexes 2 and 6, quantum chemical calculations using the Time-Dependent Density Functional Theory (TD-DFT) methodology have been carried out. The in vitro anticancer activity of all complexes was studied against three tumor cell lines (melanoma B16-F10, colorectal adenocarcinoma HT29, and hepatocellular carcinoma HepG2). The mechanism of action of the two most effective complexes against B16-F10 (complexes 2 and 4) was subsequently investigated by means of apoptosis, cell cycle arrest, and mitochondrial membrane potential. Finally, the anti-inflammatory activity of each complex was quantified by measuring the final nitrite concentration after incubation of lipopolysaccharide (LPS)-induced RAW 264.7 macrophages.
Results and discussion
Structural description
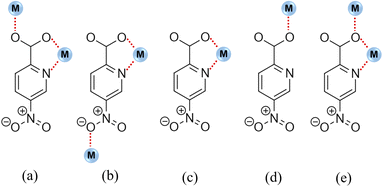
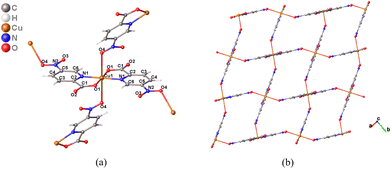
5-npic ligand displays a variety of coordination modes, as shown in Fig. 1. However, only coordination modes a (compounds 1 and 2), b (compound 3), and c (compounds 4–6) are found in this work.The complexes could be classified into three groups based on their crystalline structures due to the coordination modes and the different metal centers: compounds 1–2 are 1D structures, compound 3 is a bidimensional framework, and compounds 4–6 are described as mononuclear complexes.
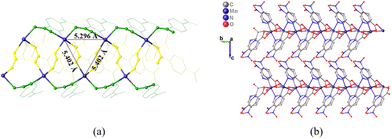
The monodimensional structure is imposed by the coordination mode μ2-κ2N1,O2;κO1 (Fig. 1a) of the ligand, which coordinates to a metal ion by the O1 atom of the carboxylate group and also establishes a chelating ring between the O2 atom, the N1 atom from the pyridine ring, and a second metal center. In addition, a 2-fold rotation axis creates two independent ligand molecules, named A and B. While ligand A is perpendicular to the b axis and imposes an intermetallic Mn⋯Mn/Cd⋯Cd distance of 5.4020(16)/5.3800(11) Å, ligand B is parallel to the b axis and creates an intermetallic distance of 5.2960(5)/5.4093(6) Å. The chain is made up of ligands A and B arranged in triangles (Fig. 2) and propagates along the b axis, giving rise to 1D polymers. Table S1† provides details of selected bond lengths and angles of all complexes.
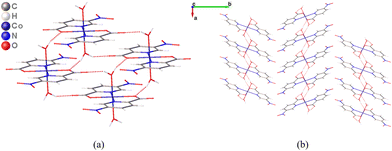
The mononuclear units are linked together via O–H⋯O hydrogen bonds thanks to the coordinated water molecules, whose bond distances are shown in Table S2.† Finally, the glide planes lead to a zigzag pattern of the monomers in the supramolecular structure (Fig. 4).
Infrared (IR) spectroscopy
Fig. S1† displays the IR spectra of each compound and 5-npic, and the main bands are compared in Table S3.† In the ligand spectrum, the characteristic aromatic C–H bond bands are visible at 3090–3078 cm−1, remaining almost constant in the complexes’ spectra. Since it is challenging to correlate the tension bands of the C![[double bond, length as m-dash]](https://www.rsc.org/images/entities/char_e001.gif) O, N–O, and C
O, N–O, and C![[double bond, length as m-dash]](https://www.rsc.org/images/entities/char_e001.gif) C bonds, an approximation has been made. The first band at 1728–1699 cm−1 due to the stretching vibrations of the C
C bonds, an approximation has been made. The first band at 1728–1699 cm−1 due to the stretching vibrations of the C![[double bond, length as m-dash]](https://www.rsc.org/images/entities/char_e001.gif) O bond of the carboxylic acid shifts to 1670–1629 cm−1 in the complexes’ spectra. Additionally, the peak at 1288 cm−1 from the C–N bond of the pyridine ring shifts to 1346–1267 cm−1 in the spectra of the complexes. This suggests that the nitrogen atom of the pyridine ring and the carboxylic group of the ligand are both responsible for the coordination with the metal atom.30
O bond of the carboxylic acid shifts to 1670–1629 cm−1 in the complexes’ spectra. Additionally, the peak at 1288 cm−1 from the C–N bond of the pyridine ring shifts to 1346–1267 cm−1 in the spectra of the complexes. This suggests that the nitrogen atom of the pyridine ring and the carboxylic group of the ligand are both responsible for the coordination with the metal atom.30
The peaks attributed to the N–O bond vibration remain constant with the exception of complex 3, which exhibits a band displacement due to the asymmetric and symmetric vibration of the N–O bond with respect to the ligand's spectrum. This fact supports the coordination of CuII through the nitro group.
The broad band that appears around 3200 cm−1 in the spectra of complexes 4–6 indicates the presence of water molecules in those structures.
Photophysical properties
Complexes based on d10 metal ions are of great interest for their luminescence properties and potential applications in cell bioimaging. A few luminescent CdII and ZnII complexes have been published with bioimaging application and interesting in vitro antiproliferative activities against cancerous cell lines.31–33 Thus, photophysical studies were carried out for complexes 2 and 6, containing CdII and ZnII, respectively.Absorption spectra of 2, 6, and 5-npic ligand were explored in solution (Fig. S2†). All three showed similar spectral profiles, with a strong band at 209 nm and two weaker bands around 283 and 248 nm. The large Stokes shift around 17![[thin space (1/6-em)]](https://www.rsc.org/images/entities/char_2009.gif) 046 cm−1 opens the possibility of exploring the application of these novel compounds as fluorescent drugs and for their cellular localization using bioimaging techniques. Following that, fluorescence emission spectra in solid samples (Fig. 5) displayed a sharp profile with a prominent peak at 485 nm (2.56 eV). The similarity between the three spectral profiles indicates that the luminescence properties of the ligand remain almost intact after complexation. The slight decrease in the emission intensity could be due to additional energy loss pathways such as magnetic perturbations, redox activity or electronic energy transfer.34
046 cm−1 opens the possibility of exploring the application of these novel compounds as fluorescent drugs and for their cellular localization using bioimaging techniques. Following that, fluorescence emission spectra in solid samples (Fig. 5) displayed a sharp profile with a prominent peak at 485 nm (2.56 eV). The similarity between the three spectral profiles indicates that the luminescence properties of the ligand remain almost intact after complexation. The slight decrease in the emission intensity could be due to additional energy loss pathways such as magnetic perturbations, redox activity or electronic energy transfer.34
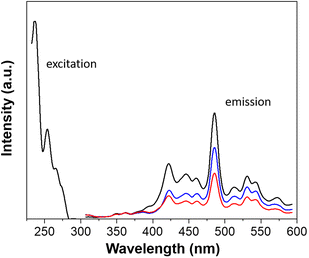 | ||
| Fig. 5 Excitation and fluorescence emission spectra in solid samples of the 5-npic ligand (black), compound 2 (blue), and 6 (red). | ||
To determine which electronic transitions are responsible for the photophysical properties, the molecular geometries in the ground state were optimized and the vertical electronic transitions were computed for 2, 6, and 5-npic as described in the Theoretical Calculation section using DFT and TD-DFT methodologies, respectively. First, the molecular geometry of 5-npic was optimized considering three conformations depending on the orientation of the carboxylic group (Fig. S3†). Table S4† lists the relative energies for the three conformers, showing that conformer 3 is the most stable both in the gas phase and in solution.
In order to facilitate the assignment of the electronic transitions, Fig. S4† shows the experimental absorption spectrum of 5-npic in water solution along with the vertical electronic transitions calculated at the TD-CAM-B3LYP/6-31G** level of theory. The band in the absorption spectrum at 283 nm could be assigned to the S0 → S4 electronic transitions calculated at 249 nm (f = 0.25) being HOMO−1 → LUMO with 88% contribution (Fig. S5†). The other two bands at 248 and 209 nm could be assigned to S0 → S6 (calculated at 226 nm) and S0 → S10 (186 nm) transitions, respectively. Some selected electronic transitions with significant oscillator strengths are listed in Table S5.†
The fluorescence emission of the ligand was calculated in the gas phase and in water solution. Although the excited states S4, S6, and S10 were predicted to be the most populated during the absorption process, the molecule relaxes to the excited state S1 and a Kasha-type emission occurs from it. As shown in Table S6,† the calculated emission is predicted at 610 nm in the gas phase and at 523 nm in water solution, the latter being closer to the experimental observation.
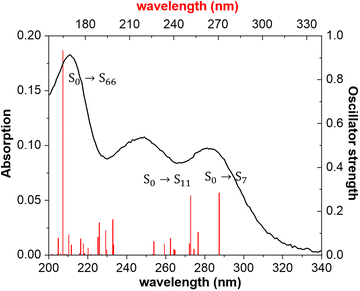
For complex 6, the molecular geometry of an isolated monomer was optimized in water solution. Fig. 6 shows the experimental absorption spectrum in water solution along with the theoretical vertical electronic transitions. According to the TD-DFT calculations (Table S7†), the lowest energy transition appearing at 283 nm could be assigned to the S0 → S7 electronic transitions calculated at 271 nm with the contributions of HOMO−8 → LUMO (43%) and HOMO−4 → LUMO (41%). The other two bands at 249 and 214 nm in the absorption spectrum could be assigned to the transitions predicted at 251 nm (S0 → S11) and 165 nm (S0 → S66).
On the other hand, the vertical electronic transitions were also computed using the ONIOM method (Table S8†). In this method, the experimental bands in the absorption spectrum could be assigned to the transitions calculated at 271 nm (S0 → S9), 242 nm (S0 → S15), and 186 nm (S0 → S43). Thus, the ONIOM method only improves the results for the most intense band observed at 214 nm with respect to the individual complex calculations.
Regarding the fluorescence emission, even though it is predicted that the most populated states during the absorption process would be S15, S24, and S43, the molecule relaxes to lower excited states and the emission occurs from the S1/S2 states. Table 1 shows that the band at 485 nm is predicted at 439 nm (ΔE = 0.27 eV) using the ONIOM method and at 566 nm in the gas phase and water solution (ΔE = 0.37 eV) if the monomer is modelled.
| Phase | eV (nm) (λexpemis) | eV (nm) (λcalcvert–emis) | Transition | f | % Contribution |
|---|---|---|---|---|---|
| Monomer CAM-B3LYP-D3 | |||||
| Gas | 2.56 (485) | 2.19 (566) | S1 → S0 | 0.00 | LUMO → HOMO (82%) |
| Water | 2.56 (485) | 2.19 (566) | S1 → S0 | 0.00 | LUMO → HOMO−2 (88%) |
| ONIOM(CAM-B3LYP-D3:PM6) | |||||
| Gas | 2.56 (485) | 2.83 (439) | S2 → S0 | 0.00 | LUMO → HOMO−1 (40%) |
| LUMO+1 → HOMO (40%) | |||||
The molecular orbitals involved in the electronic transition S2 → S0 are shown in Fig. 7. As can be seen, the LUMO+1 orbital is delocalized on a ligand molecule, whereas the HOMO is located on the carboxylate group of the other ligand (with 40% contribution). On the other hand, the LUMO delocalizes on a ligand molecule, while HOMO−1 resides on the carboxylate group of the same ligand (40% contribution). The electron density of these molecular orbitals exhibits no contribution of the ZnII atom, which is consistent with the similarity between the experimental emission spectrum of the free ligand and the complex 6.
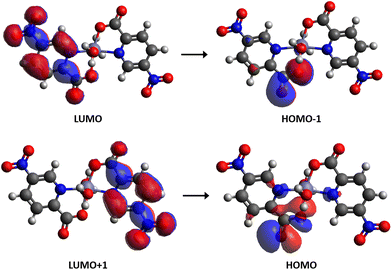 | ||
| Fig. 7 Representation of the molecular orbitals (isocontour plots 0.02 a.u.) involved in the electronic transition S2 → S0 calculated at the ONIOM(CAM-B3LYP-D3:PM6) level of theory for complex 6. | ||
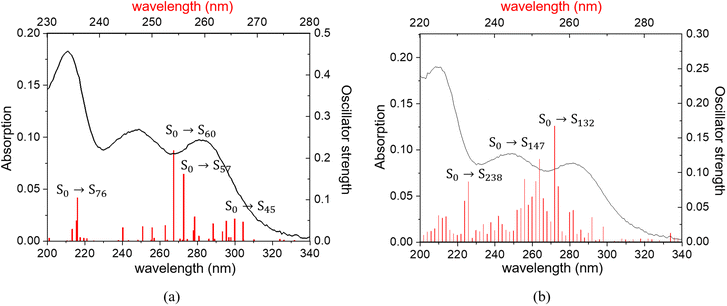
For complex 2, Fig. 8 shows the experimental absorption spectra along with the theoretical vertical electronic transitions for the fragments, whereas Table S9† lists the vertical electronic transitions calculated for both models, f1Cd and f4Cd. Both models yield very similar results. For f1Cd, the most intense transitions calculated around 266 (S0 → S45), 256 (S0 → S57) and 254 (S0 → S60), and 236 nm (S0 → S76) correspond to the experimental bands observed at 283, 249, and 214 nm, respectively. In the case of model f4Cd, the main transitions are predicted at 256 (S0 → S132), 252 (S0 → S147), and 233 nm (S0 → S238).
Finally, the calculated emission for f1Cd and f4Cd fragments are summarized in Table 2. As for the free ligand and compound 6, a Kasha-type emission occurs from the first excited state S1. As can be observed, both models acceptably predict the experimental maximum at 485 nm. However, when calculating the transition S1 → S0, model f1Cd is slightly closer to the experimental result, with 71% contribution from LUMO to HOMO−2. The LUMO is delocalized in a 5-npic molecule, while HOMO−2 is centered on its carboxyl group (Fig. 9), without the participation of the CdII atom. This is consistent with the similarity between the experimental emission spectrum of the free ligand and that of complex 2.
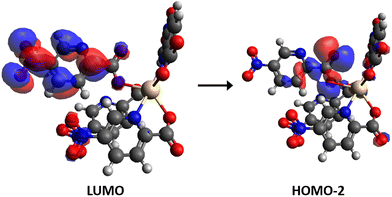 | ||
| Fig. 9 Representation of the molecular orbitals (isocontour plots 0.02 a.u.) involved in the electronic transition S1 → S0 for the fragment f1Cd of complex 2. | ||
| Fragment | eV (nm) (λexpemis) | eV (nm) (λcalcvert–emis) | Transition | f | % Contribution |
|---|---|---|---|---|---|
| f1Cd | 2.56 (485) | 2.49 (499) | S1 → S0 | 0.01 | LUMO → HOMO−2 (71%) |
| f4Cd | 2.56 (485) | 2.89 (429) | S1 → S0 | 0.01 | LUMO+1 → HOMO−2 (44%) |
Cytotoxicity in cancer cell lines
Significant antitumoral effects have been reported by several metal complexes (CuII, RuII, ReI, OsII, IrIII, PtIV, and lanthanides) based on picolinic acid derivatives.35–45 Furthermore, we have previously shown that the nitro group could improve the anticancer properties of an organic ligand.46 For all of these reasons, the cytotoxic activity of complexes 1–6 and free 5-npic ligand against three cancer cell lines (B16-F10-murine melanoma cells, HT29-colon-cancer cells, and HepG2-hepatoma cells) was determined using 3-(4,5-dimethylthiazol-2-yl)-2,5-diphenyltetrazolium bromide (MTT) assay. Table 3 shows how most of the compounds are able to inhibit cell growth after 72 h with values between 5.55–78.47 μg mL−1 for IC20, 26.94–86.55 μg mL−1 for IC50, and 76.17–100.94 μg mL−1 for IC80. In particular, 66% of the products were more cytotoxic than the free ligand at IC50 in B16-F10 and HT29 cells; however, the complexes did not enhance the cytotoxicity of the ligand in HepG2 cells. Compared to commercial drugs like cisplatin, which presents IC50 values ranging from 23 μM (in B16-F10 cells)47 to 45.6 μM (in HepG2 cells),48 the compounds here reported have slightly lower cytotoxic potential. However, this fact should not necessarily be a hindrance since high-cytotoxic drugs could produce a large number of side effects that restrict their dosage and, hence, their efficacy. In clinical practice, the toxicity profile of cisplatin includes nausea and vomiting, renal dysfunction, neurotoxicity, and ototoxicity.49| Cell line | Compound | IC20 (μg mL−1) | IC50 (μg mL−1) | IC80 (μg mL−1) |
|---|---|---|---|---|
| a Cells were treated with the complexes for 72 h at doses ranging from 0 to 100 μg mL−1. Each point represents the mean value ± SD of at least two independent experiments performed in triplicate. b N/A = not available. | ||||
| B16-F10 | 5-npic | 49.61 ± 2.04 | 66.89 ± 3.07 | 88.29 ± 3.15 |
| 1 | 118.83 ± 32.50 | N/Ab | N/Ab | |
| 2 | 5.55 ± 2.81 | 26.94 ± 3.53 | 76.17 ± 3.83 | |
| 3 | 37.01 ± 2.03 | 48.91 ± 3.53 | N/Ab | |
| 4 | 19.56 ± 2.99 | 45.10 ± 3.84 | 80.48 ± 2.43 | |
| 5 | 39.22 ± 9.39 | 74.64 ± 4.38 | 101.09 ± 0.76 | |
| 6 | 41.48 ± 6.08 | 64.22 ± 4.07 | 91.47 ± 12.01 | |
| HT29 | 5-npic | 37.12 ± 3.80 | 60.56 ± 3.68 | 110.53 ± 3.67 |
| 1 | 42.85 ± 5.63 | 42.29 ± 1.93 | N/Ab | |
| 2 | 37.60 ± 4.55 | 61.96 ± 3.46 | 95.46 ± 2.37 | |
| 3 | 39.62 ± 3.10 | 64.60 ± 3.26 | 103.37 ± 0.60 | |
| 4 | 39.95 ± 2.94 | 53.33 ± 2.24 | N/Ab | |
| 5 | 34.27 ± 3.74 | 51.39 ± 1.07 | 91.25 ± 6.62 | |
| 6 | 40.23 ± 1.02 | 48.55 ± 0.80 | N/Ab | |
| HepG2 | 5-npic | 12.14 ± 5.89 | 48.87 ± 11.33 | 106.74 ± 8.94 |
| 1 | 78.47 ± 1.58 | 83.37 ± 2.25 | 105.60 ± 10.00 | |
| 2 | 26.25 ± 6.41 | 66.32 ± 4.48 | 103.01 ± 5.27 | |
| 3 | 72.39 ± 3.92 | 86.55 ± 4.49 | 100.94 ± 0.87 | |
| 4 | 41.76 ± 13.33 | 76.77 ± 7.03 | 102.29 ± 0.94 | |
| 5 | 17.62 ± 9.42 | 62.72 ± 5.17 | 112.77 ± 5.35 | |
| 6 | 33.54 ± 8.24 | 72.96 ± 2.84 | 106.70 ± 2.05 | |
Among all the complexes, compounds 2 and 4 exhibited the highest antitumoral activity, particularly against the B16-F10 cell line, with IC50 values of 26.94 ± 4.91 and 45.10 ± 3.84 μg mL−1 for 2 and 4, respectively (Fig. S6†).
To shed light on the mechanism of action of the complexes, their chemical stabilities were investigated by measuring their crystallinity retention after 72 h in phosphate-buffered saline (PBS) solution using powder X-ray diffraction (PXRD). As shown in Fig. S7,† all compounds, except 4, nearly maintained their crystallinity, although the characteristic peaks of NaCl from PBS at 31.6 and 45.3° were slightly evident. On the other hand, given that the most toxic heavy metals for humans are mercury, lead, chromium, cadmium, and arsenic,50 it seems reasonable to think that compound 2 should exhibit a high antitumoral effect. Furthermore, CdII has the largest ionic radius and thus, the longest coordination bonds. This, combined with the fact that CdII is a soft Lewis acid, makes its complexes less stable.51 In the case of CoII, it is an essential metal for the organism, but at higher concentrations it causes toxicity.52 Moreover, complex 4 exhibited low stability after 72 h as it degrades completely. This feature may increase the toxicity and thus, the antitumoral activity of this compound.
Due to the results, compounds 2 and 4 were selected to investigate their apoptotic potential effect, cell cycle distribution, and mitochondrial membrane potential effect in the B16-F10 cell line.
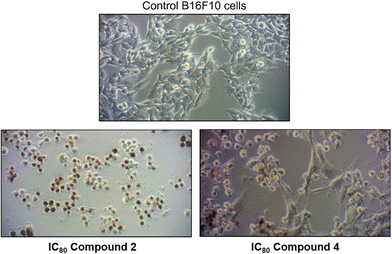
Furthermore, after 72 h of incubation with 2 and 4 at IC80, phase-contrast light microscopy cell images (Fig. 11) demonstrated the characteristics apoptotic morphological changes triggered in B16-F10 cells, such as cell shrinkage, loss of normal cell architecture, disruption of cell-membrane integrity, etc. It is noteworthy that compound 2 exhibits a high total apoptosis value at IC80 (93.95%), suggesting the potential of this complex as a promising anticancer drug.
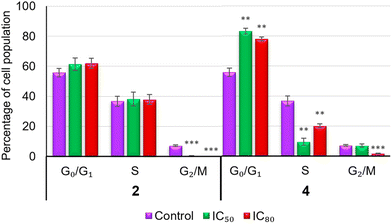
Conversely, the percentages of cells in phase S decreased by 3.8 and 1.8 times at IC50 and IC80, respectively (9.60 ± 2.31% at IC50 and 20.22 ± 1.33% at IC80). The changes in the G2/M phase for this product were less significant. On the other hand, treatment with complex 2 did not present significant changes in any phases of the cell cycle compared to the control, except a slight decrease in the G2/M phase. According to these results, the treatment with compound 4 in B16-F10 cancer cells resulted in cell cycle arrest in the G0/G1 phase, which could indicate a cytostatic or differentiation process.
Anti-inflammatory studies
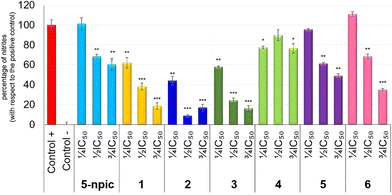
Firstly, sub-cytotoxic concentrations were established to ensure that the anti-inflammatory effects were caused by an inflammatory process rather than the cytotoxicity of compounds 1–6 against macrophage/monocyte murine RAW 264.7 cells (Table S10†). Based on these results, the ¾ IC50, ½ IC50, and ¼ IC50 values were used for the determination of the anti-inflammatory response.In the inflammatory process, RAW 264.7 macrophages play an important role producing inflammation mediators such as nitric oxide (NO), which is generated by the enzyme nitric-oxide synthase (iNOS). Lipopolysaccharide (LPS)-induced RAW 264.7 can activate iNOS, and the resulting NO could be easily oxidized to nitrite. Therefore, the anti-inflammatory activity of complexes 1–6 in LPS-induced RAW 264.7 was investigated by measuring the nitrite concentration (see Experimental section for further details). According to the results shown in Fig. 14, most of the coordination compounds considerably reduced the NO production, with a percentage of NO inhibition between 65 and 83% at ½ IC50 and ¾ IC50. When tested at ½ IC50, 2 showed the highest NO inhibition (91%), followed by 3 (75.5%), 1 (61.6%), and 6 (31.42%). Additionally, complex 2 exhibited the highest inhibition (56%) at the lowest concentration of ¼ IC50 (5.42 μg mL−1), demonstrating its potential in inflammatory processes.
In order to complete the study of the anti-inflammatory potential of the compounds, the concentration that reduces NO production to 50% (IC50 NO) was calculated after 48 h of treatment (Table 4). The results indicate that compounds 2, 3, and 6 had IC50 NO values lower than that of the ligand (5.38 ± 0.04, 24.10 ± 1.74, and 17.63 ± 0.07 μg mL−1 for compounds 2, 3, and 6, respectively). Among them, compound 2 showed the lowest IC50 NO value, which made it 5.4-fold more effective than the free ligand.
| Compound | IC50 NO (μg mL−1) | IC50 of ligand/IC50 of compound |
|---|---|---|
| 5-npic | 30.36 ± 2.41 | 1 |
| 1 | 40.98 ± 5.85 | 0.74 |
| 2 | 5.38 ± 0.04 | 5.64 |
| 3 | 24.10 ± 1.74 | 1.26 |
| 4 | 65.76 ± 4.60 | 0.46 |
| 5 | 32.52 ± 2.12 | 0.93 |
| 6 | 17.63 ± 0.07 | 1.72 |
Experimental
Synthesis of metal complexes
All reagents were purchased from Sigma-Aldrich and used as received without additional purification.Compounds 1–6 were obtained by a solvothermal route through the following procedure: 0.03 mmol of corresponding metal salt (MnCl2·4H2O (1), CdSO4 (2), CuSO4·5H2O (3), Co(NO3)2·6H2O (4), NiCl2·6H2O (5), and Zn(NO3)2·6H2O (6)) were dissolved in a mixture of 0.5 mL of N,N-dimethylformamide (DMF) and 0.5 mL of distilled water, with the exception of 2 for which only 1 mL of H2O instead was used. Separately, 0.06 mmol of 5-npic ligand were dissolved in a hot mixture of 0.5 mL of DMF and 0.5 mL of H2O to prevent its precipitation. Then, the metal salts were added to the ligand solution in glass vessels, which were then closed and introduced in an oven at 95 °C. One hour later, crystalline powders precipitated, and after a total reaction time of 24 h crystals of different colors (yellow (1), white (2), dark blue (3), orange (4), light green (5), and white (6)) were obtained by filtration, washed with distilled water and dried under an air atmosphere. Elemental analyses of all obtained materials were performed (Table S11†).
Physicochemical characterization
Elemental analyses were performed on a THERMO SCIENTIFIC analyzer model Flash 2000. The Fourier-transform infrared (FTIR) spectra were measured on a BRUKER TENSOR 27 FT-IR and OPUS was used as the data collection program. UV-Vis absorption measurements were carried out at 298 K on a Cary100 UV-Vis spectrophotometer (Agilent Technologies, CA, USA) using a scan rate of 600 nm min−1. The UV absorption spectra were acquired at 0.06 mM in water and 0.03 mM in diethyl ether (spectrum not shown) for 5-npic, and 0.02 mM in distilled water for metal complexes. The fluorescence spectra in solid state at room temperature were obtained on a Varian Cary-Eclipse spectrofluorometer equipped with a xenon lamp, Czerny–Turner monochromators, and a photomultiplier tube R-928. The powder X-ray diffraction (PXRD) patterns were collected on a BRUKER D8 DISCOVER diffractometer equipped with a PILATUS3R 100K-A detector and using CuKα radiation (λ = 1.5406 Å).Single-crystal X-ray diffraction (SCRXD)
Single crystals of each compound were used for data collection. Diffraction intensities were recorded on a Bruker APEX-II CCD with a photon detector equipped with graphite monochromated MoKα radiation (λ = 0.71073 Å). The data reduction was performed with APEX2 software53 and corrected for absorption using SADABS.54 Crystal structures were solved by direct methods and refined by full-matrix least-squares with SHELXL-201955 using the OLEX2 crystallographic package.56 The main refinement parameters of all compounds are summarized in Table S12.† CCDC numbers 2295415–2295420 contain the supplementary crystallographic data for this article.†Theoretical calculations
Full geometry optimizations of the ground and excited states were performed with the Gaussian 16 program package (revision A.03)57 using the hybrid exchange–correlation functional CAM-B3LYP.58 The 6-31G** basis set was used for C, N, O, and H atoms and LANL2DZ59 for Cd (complex 2) and Zn (6) atoms. The vibrational frequencies were computed to check the absence of imaginary frequencies. The molecular geometries from SCRXD were taken as the starting point for geometry optimization in the ground state. The effect of the solvent was considered using the polarizable continuum model (PCM).60 The vertical electronic transitions and geometry optimization of the excited electronic states were computed using time-dependent DFT calculations at the same level of theory. The fluorescence emission energy in solution from the first excited state was calculated at the same level of theory using Eem(Sn) = ESn(GSn) − ES0(GSn), where ESn(GSn) is the energy of the Sn state at its equilibrium geometry (GSn), in the state-specific solvation approach61 and ES0(GSn) corresponds to the energy of the S0 state at the Sn state geometry (GSn) and with the static solvation from the excited state.62Two different approaches were used to simulate the crystallographic structure of 2 and 6 in order to interpret their photophysical properties. The D3 version of Grimme's dispersion correction (GD3zero damping) was included in the calculation.63
In the case of complex 2, two finite fragments were selected considering one and four Cd metallic atoms, called f1Cd and f4Cd, respectively (Fig. S9†). The molecular geometries of these fragments were optimized in the ground state S0 and first excited state S1. The positions of some atoms were fixed to their corresponding crystallographic coordinates (Fig. S10†) to avoid large deformations of the fragment that lead to a departure from the original structure, while all other atoms of the fragment were allowed to relax during optimization. TD-DFT calculations were also performed for the f1Cd fragment (120 states) and f4Cd fragment (400 states).
The crystallographic structure of complex 6 was simulated using a two-layer ONIOM approach64–66 building a model cluster containing 11 units from the SCXRD data. The central active molecule was treated with CAM-B3LYP-D3 (high level) and both S0 and S1 electronic state geometries were fully optimized (Fig. S11†). The central molecule was surrounded by 10 molecules (low level) treated semi-empirically using PM667 to alleviate the computational cost and with their molecular geometries frozen. The TD-DFT calculations were performed and 100 electronic transitions were computed. The vertical electronic transition for the emission was again calculated using Eem(Sn) = ESn(GSn) − ES0(GSn).
Cell culture and drug preparation
The anticancer properties were studied in three tumor cell lines: mouse melanoma cells B16-F10 (ATCC no. CRL-6475), human colorectal adenocarcinoma cell line HT29 (ECACC no. 9172201; ATCC no. HTB-38), and human hepatocarcinoma cell line HepG2 (ECACC no. 85011430). These cells were cultured in Dulbecco's Modified Eagle Medium (DMEM) supplemented with 2 mM glutamine, 10% heat-inactivated fetal bovine serum (FBS), 10![[thin space (1/6-em)]](https://www.rsc.org/images/entities/char_2009.gif) 000 units per mL of penicillin, and 10 mg mL−1 of streptomycin. Then, they were incubated at 37 °C under 5% CO2 atmosphere and 95% humidity.
000 units per mL of penicillin, and 10 mg mL−1 of streptomycin. Then, they were incubated at 37 °C under 5% CO2 atmosphere and 95% humidity.
Anti-inflammatory activities were studied in the monocyte/macrophage murine RAW 264.7 cell line (ATCC no. TIB-71). They were cultured in Roswell Park Memorial Institute 1640 (RPMI 1640) medium supplemented with 10% heat-inactivated fetal calf serum (FCS), 0.5 μg mL−1 gentamicin, being incubated at 37 °C under 5% CO2 atmosphere and 95% humidity. All cells were grown to 80–90% of confluence in sterile cell culture flasks. Subconfluent monolayer cells were used in all experiments. The cells lines were provided by the cell bank of the University of Granada, Spain.
Compounds 1–6 and the 5-npic ligand were dissolved before use at 0.5 mg mL−1 in dimethyl sulfoxide (DMSO). A stock solution was frozen and stored at −20 °C. Prior to all the experiments, this solution was diluted in the corresponding cell-culture medium.
Cell viability assay
The cell proliferation effect of each product in B16-F10, HT29, HepG2, and RAW 264.7 cells was quantified using the MTT assay (Sigma, MO, USA), which is based on the ability of living cells to cleave the tetrazolium ring, thus producing formazan, which absorbs at 570 nm. For this colorimetric assay, 5 × 10³ B16-F10 cells, 6 × 10³ HT29 cells, 15 × 103 HepG2 cells, and 6 × 10³ RAW 264.7 cells were grown on a 96-well plate and incubated with increasing concentrations of ligand and compounds (0–100 μg mL−1). After 72 h, 100 μL of MTT solution (0.5 mg mL−1) in 50% PBS and 50% medium was added to each well. Finally, after 1.5 h of incubation, formazan was resuspended in 100 μL of DMSO, and each concentration was tested in triplicate. Relative cell viability, concerning untreated control cells, was measured by absorbance at 570 nm on an ELISA plate reader (Tecan Sunrise MR20-301, TECAN, Grödig, Austria). The concentrations at which these compounds inhibit the growth of 20, 50, and 80% of the cell population (IC20, IC50, and IC80, respectively) were calculated.Coordination compounds that showed high cytotoxicity for carcinogenic cell lines were further studied in apoptosis, cell cycle, and mitochondrial membrane potential tests.
Apoptosis analysis thought annexin V-FICT/PI flow cytometry
Apoptosis was analyzed with flow cytometry using a FACS flow cytometer (Coulter Corporation, Hialeah, FL, USA). Since best cytotoxic results were achieved with the B16-F10 cell line, for this assay, 5 × 10⁴ B16-F10 cells were grown in 24-well plates with 1.5 mL of medium and incubated for 24 h. After this time, cells were treated with the selected complexes 2, 4, and the ligand 5-npic in triplicate for 72 h at IC50 and IC80, calculated previously. The cells were collected and resuspended in binding buffer (10 mM HEPES/NaOH, pH 7.4, 140 mM NaCl, 2.5 mM CaCl2). Annexin V-FITC conjugate (1 μg mL−1) was then added and incubated for 15 min at room temperature in darkness. Just before analysis by flow cytometry, cells were stained with 5 μL of 1 mg mL−1 PI. In each experiment, approximately 10 × 103 cells were analyzed and the experiment was repeated twice.Cell cycle analysis
The cell cycle was studied using PI staining by flow cytometry. This method was used to quantify the amount of DNA in the different phases of the cell cycle (G0/G1, S, and G2/M) using a FACS at 488 nm in an Epics XL flow cytometer. DNA content is directly proportional to the PI fluorescence. For this assay, 5 × 10⁴ B16-F10 cells were plated in 24-well plates with 1.5 mL of medium and incubated for 24 h. Cells were treated with compounds 2, 4, and 5-npic in triplicate for 72 h, at their respective IC50 and IC80. After treatment, the cells were washed twice with PBS, trypsinized and resuspended in TBS 1× (10 mM Tris and 150 mM NaCl). Then, Vindelov buffer (100 mM Tris, 100 mM NaCl, 10 mg mL−1 RNase, and 1 mg mL−1 PI, at pH 8) was added. Cells were stored on ice, and just before measurement, were stained with 10 mL of 1 mg mL−1 PI solution. In each experiment, approximately 10 × 103 cells were analyzed and the experiment was repeated twice.Analysis of the mitochondrial-membrane potential (MMP)
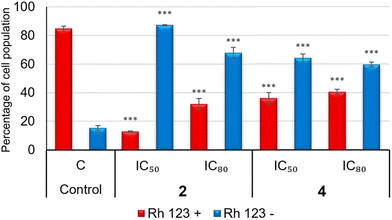
Oxidative damage of the mitochondrial membrane caused by changes in its potential was studied by flow cytometry using dihydrorhodamine (DHR), which is oxidized to a fluorescent product, rhodamine (Rh123). Rh123 is a membrane-permeable, fluorescent cationic dye that is selectively taken up by the mitochondria and its fluorescence is proportional to the MMP. A negative Rh123 staining suggests an intrinsic apoptotic activation pathway, whereas a positive Rh123 staining means an extrinsic apoptotic pathway. Thus, the formation of Rh123 can be monitored by fluorescence spectroscopy using excitation and emission wavelengths of 500 and 536 nm, respectively. For this analysis, 5 × 10⁴ B16-F10 cells were grown in 24-well plates with 1.5 mL of medium and incubated for 24 h. Cells were treated in triplicate with compounds 2, 4 and 5-npic for 72 h at their respective IC50 and IC80. After treatment, the culture medium was renewed with fresh medium by adding 0.5 μL of DHR, obtaining a final concentration of 5 μg mL−1. Cells were then incubated for 1 h at 37 °C under a 5% CO2 atmosphere and 95% humidity, and subsequently washed and resuspended in PBS with 5 μg mL−1 PI. The fluorescence intensity was measured using a FACScan flow cytometer.Determination of NO production
RAW 264.7 cells are one of the most widely used models for studying inflammation in vitro. These cells produce the highest release of NO during the inflammatory response when stimulated by bacterial LPS. For the determination of NO production, the concentration of nitrites in the culture medium, used as an indicator, was evaluated according to the Griess reaction.68 RAW 264.7 cells were plated at 6 × 10⁴ cells per well in 24-well cell culture plates and supplemented with 10 μg mL−1 LPS. After 24 h, cells were incubated for 48 h with complexes 1–6 and 5-npic ligand at ¾ IC50, ½ IC50, and ¼ IC50 values, previously calculated. The supernatants were collected to determine their nitrite concentration and/or stored at −80 °C for further use. The Griess reaction was performed taking 150 μL of supernatant test samples or sodium nitrite standard (0–120 μM) and mixed with 25 μL of Griess reagent A (0.1% N-(1-naphthyl)-ethylenediaminedihydrochloride) and 25 μL of Griess reagent B (1% sulfanilamide in 5% of phosphoric acid), in a 96-well plate. After 15 min of incubation at room temperature, the absorbance was measured at 540 nm in an ELISA plate reader (Tecan Sunrise MR20-301, TECAN, Austria). The absorbance was referred to the nitrite standard curve to determine the concentration of nitrite in the supernatant of each experimental sample. The percentage of NO production was determined, assigning 100% to the increase between the negative control (untreated cells) and positive control (cells only treated with 10 μg mL−1 of LPS).Conclusions
In the present work, six different organometallic compounds based on MnII, CdII, CuII, CoII, NiII, and ZnII and the ligand 5-nitropicolinate were synthesized. They could be classified into three different groups according to their structures thanks to the diverse coordination modes of the 5-npic ligand. Single-crystal X-ray diffraction and FTIR analyses revealed that complexes 1 and 2, with the formula [M(5-npic)2]n, are monodimensional polymers along the b crystallographic axis; complex 3, due to the Jahn–Teller distortion, forms a 2D polymer where the nitro group also coordinates to CuII; finally, complexes 4–6 are made up of mononuclear entities joined to one another by hydrogen bonds.Complexes based on CdII and ZnII have shown luminescence properties which would open the possibility of studying their localization in the cellular environment and monitoring their activity as drugs using bioimaging techniques. This advantage would be enhanced by the large Stokes shift observed for these compounds between the absorption and the emission spectra. The electronic transitions responsible for the photophysical properties were assigned by performing TD-DFT calculations. The analysis of the molecular orbitals involved in these transitions allowed us to conclude that the metallic centers do not participate in those transitions. This result, along with the similarity observed between the emission spectra of the ligand and those of compounds 2 and 6, leads to the conclusion that the participation of the ligand–metal charge transfer processes would not be very significant or almost nil which would be an advantage in avoiding quenching of luminescence.
In addition, the anticancer properties of these compounds were analyzed against three cancer cell lines (B16-F10 murine melanoma cells, HT29 colon-cancer cells, and HepG2 hepatoma cells), highlighting the cytotoxic effect of compounds 2 and 4 in B16-F10, which improved the activity of 5-npic (2.5 and 1.5-fold better than that of the ligand for 2 and 4, respectively). The apoptotic mechanism was demonstrated for both compounds with total apoptosis rates of 27.33 and 36.67% at IC50 and 58.40 and 93.95% at IC80 for 2 and 4, respectively. Cell cycle analysis showed an arrest in the G0/G1 phase in response to the treatment for 4, which could indicate a possible cytostatic or differentiation process. Finally, the MMP analysis suggested a potential activation of the intrinsic pathway during apoptosis of B16-F10 cancer cells caused by 2 and 4. Considering these results, we hypothesize that the activation of apoptosis in response to compounds 2 and 4 might be mediated by the induction of cellular stress or genotoxicity, which would activate proteins such as p53 or p21. This mechanism would explain why compound 4 caused the cell cycle arrest in the G0/G1 phase. This initial process would be followed by changes in the expression of Bcl-2 family proteins, thereby leading to the disorganization of mitochondria and the loss of the MMP. Finally, the release of mitochondrial factors like cytochrome C or Apaf-1 would result in the formation of the apoptosome and the activation of caspase 9, culminating in the activation of caspase 3 and then, triggering the observed apoptotic phenomenon. Even though this is a very plausible mechanism of action for these compounds, additional studies are still warranted to draw definitive conclusions.
Regarding the anti-inflammatory potential, most of the compounds produced an inhibition of NO production under the assay conditions. Among them, compounds 2, 3, and 6 showed the highest inhibition values, being 1.25 to 5.6-fold more effective than the free ligand. Furthermore, complex 2 presented the lowest IC50 NO concentration (5.38 ± 0.04 μg mL−1).
Out of all the substances studied, the compound 2 ([Cd(5-npic)2]n) had the strongest effect as anticancer and anti-inflammatory agent. In summary, the new synthesized complexes, highlighting compound 2 with both proapoptotic and anti-inflammatory properties, may offer a novel and effective approach to treat chronic inflammatory diseases, and tumorigenic and carcinogenic traits.
Author contributions
A. G.-G. performed the experiments and wrote the manuscript; M. M.-O., M. C.-M., and J. S. performed the biological experiments; J. M., M. M. Q.-M., and A. N. performed the theoretical calculations; I. J. V.-Y. carried out the single-crystal X-ray diffraction measurement and refinement; S. R., A. R.-D., and F. J. R.-Z. designed and supervised the study. All authors discussed the results, commented on the manuscript, and approved the final version.Conflicts of interest
There are no conflicts to declare.Acknowledgements
This work has been funded by Junta de Andalucía (FQM-394, P21_00386, BIO-157, PAIDI-FQM-337, ProyExcel_00386, and BFQM-650-ugr20) and TED2021-132440B-I00 funded by MCIN/AEI/10.13039/501100011033. The authors also thank Universidad de Jaén, FEDER_UJA_2020 (project 2021/00627/001) for supporting the research described in this article. M. M. Q.-M. and S. R thank Ministerio de Ciencia e Innovación for Ramón y Cajal contracts (the publication is part of the grants RYC2021-034288-I and RYC2021-032522-I, funded by MCIN/AEI/10.13039/501100011033 and by the European Union “Next Generation-EU”/“PRTR”). A. G.-G. also thanks the Ministerio de Universidades and Next-Generation funds for a Margarita Salas contract. Funding for open access charge: Universidad de Granada / CBUA.References
- K. D. Mjos and C. Orvig, Chem. Rev., 2014, 114, 4540–4563 CrossRef CAS PubMed.
- S. Dasari and P. B. Tchounwou, Eur. J. Pharmacol., 2014, 740, 364–378 CrossRef CAS PubMed.
- J. Liu, H. Lai, Z. Xiong, B. Chen and T. Chen, Chem. Commun., 2019, 55, 9904–9914 RSC.
- A. Mantovani, P. Allavena, A. Sica and F. Balkwill, Nature, 2008, 454, 436–444 CrossRef CAS PubMed.
- L. L. Munn, Wiley Interdiscip. Rev.: Syst. Biol. Med., 2017, 9, 1–13 Search PubMed.
- J. Perego, C. X. Bezuidenhout, I. Villa, F. Cova, R. Crapanzano, I. Frank, F. Pagano, N. Kratochwill, E. Auffray, S. Bracco, A. Vedda, C. Dujardin, P. E. Sozzani, F. Meinardi, A. Comotti and A. Monguzzi, Nat. Commun., 2022, 13, 1–10 Search PubMed.
- H. Ji, X. Wang, P. Wang, Y. Gong, Y. Wang, C. Liu, G. Ji, X. Wang and M. Wang, J. Nanobiotechnol., 2022, 20, 1–13 CrossRef PubMed.
- K. H. Thompson and C. Orvig, Dalton Trans., 2006, 761–764 RSC.
- R. S. Grant, S. E. Coggan and G. A. Smythe, Int. J. Tryptophan Res., 2009, 2, 71–79 CAS.
- C. L. Broadhurst and P. Domenico, Diabetes Technol. Ther., 2006, 8, 677–687 CrossRef CAS PubMed.
- R. Abarca, G. Gomez, C. Velasquez, M. A. Paez, M. Gulppi, A. Arrieta and M. I. Azocar, Chin. J. Chem., 2012, 30, 1631–1635 CrossRef CAS.
- M. Kalinowska, M. Borawska, R. Świsłocka, J. Piekut and W. Lewandowski, J. Mol. Struct., 2007, 834–836, 419–425 CrossRef CAS.
- Á. Raya-Barón, I. Oyarzabal, F. M. Arrabal-Campos, J. M. Seco, A. Rodríguez-Diéguez and I. Fernández, Inorg. Chem., 2017, 56, 8768–8775 CrossRef PubMed.
- E. C. Constable, C. E. Housecroft, B. M. Kariuki and A. Mahmood, Supramol. Chem., 2006, 18, 299–303 CrossRef CAS.
- E. Matsumura, M. Ariga and T. Ohfuji, Bull. Chem. Soc. Jpn., 1970, 43, 3210–3214 CrossRef CAS.
- G. Świderski, M. Kalinowska, J. Malejko and W. Lewandowski, Vib. Spectrosc., 2016, 87, 81–87 CrossRef.
- V. F. Zolin, L. N. Puntus, V. I. Tsaryuk, V. A. Kudryashova, J. Legendziewicz, P. Gawryszewska and R. Szostak, J. Alloys Compd., 2004, 380, 279–284 CrossRef CAS.
- H.-J. Xu and L. Xu, Inorg. Chim. Acta, 2013, 394, 140–145 CrossRef CAS.
- L. Mao, S. J. Rettig, R. C. Thompson, J. Trotter and S. Xia, Can. J. Chem., 1996, 74, 2413–2423 CrossRef CAS.
- D. Dobrzyńska, L. B. Jerzykiewicz, J. Jezierska and M. Duczmal, Cryst. Growth Des., 2005, 5, 1945–1951 CrossRef.
- Y. F. Huang, Z. W. Shi, Y. Liu, H. Xiao and X. H. Yin, Russ. J. Coord. Chem., 2015, 41, 325–333 CrossRef CAS.
- M. A. Halcrow, Chem. Soc. Rev., 2013, 42, 1784–1795 RSC.
- M. A. Halcrow, Dalton Trans., 2003, 4375–4384 RSC.
- H. Ma, Y. Xu, Q. Meng, L. Zhang, R. Wang and D. Sun, Z. Anorg. Allg. Chem., 2014, 640, 1408–1412 CrossRef CAS.
- B. Zurowska and A. Kochel, J. Mol. Struct., 2008, 877, 100–104 CrossRef CAS.
- R. Pandey, D. Singh, N. Thakur and K. K. Raj, ACS Omega, 2021, 6, 13240–13259 CrossRef CAS PubMed.
- W. Wei, Z. Liu, R. Wei, C. Liang, X.-Z. Feng and G.-C. Han, J. Mol. Struct., 2021, 1228, 1–11 CrossRef.
- K. K. Gangu, S. Maddila, S. B. Mukkamala and S. B. Jonnalagadda, Inorg. Chim. Acta, 2018, 482, 830–837 CrossRef CAS.
- A. T. Çolak, F. Çolak, O. Z. Yesilel, D. Akduman, F. Yilmaz and M. Tümer, Inorg. Chim. Acta, 2010, 363, 2149–2162 CrossRef.
- A. Suvitha, S. Periandy and M. Govindarajan, Asian J. Phys., 2014, 23, 1069–1078 Search PubMed.
- N. Kumar, Roopa, V. Bhalla and M. Kumar, Coord. Chem. Rev., 2021, 427, 1–14 CrossRef.
- J. Li, R. Liu, J. Jiang, X. Liang, G. Huang, D. Yang, H. Chen, L. Pan and Z. Ma, J. Inorg. Biochem., 2020, 210, 1–13 Search PubMed.
- Z. Saedi, E. Hoveizi, M. Roushani, S. Massahi, M. Hadian and K. Salehi, J. Mol. Struct., 2019, 1176, 207–216 CrossRef CAS.
- S. Bibi, S. Mohamad, N. S. A. Manan, J. Ahmad, M. A. Kamboh, S. M. Khor, B. M. Yamin and S. N. A. Halim, J. Mol. Struct., 2017, 1141, 31–38 CrossRef CAS.
- L. E. Mihajlović-Lalić, J. Poljarević and S. Grgurić-Šipka, Inorg. Chim. Acta, 2021, 527, 1–18 CrossRef.
- A. Joshi, R. Gupta, K. Vaghasiya, R. K. Verma, D. Sharma and M. Singh, ACS Appl. Bio Mater., 2020, 3, 4025–4035 CrossRef CAS PubMed.
- D. Xu, Y. Xu, N. Cheng, X. Zhou, Y. Shi and Q. He, J. Coord. Chem., 2010, 63, 2360–2369 CrossRef CAS.
- I. Ivanović, S. Grgurić-Šipka, N. Gligorijević, S. Radulović, A. Roller, Ž. L. Tešić and B. K. Keppler, J. Serb. Chem. Soc., 2011, 76, 53–61 CrossRef.
- N. Gligorijević, S. Aranđelović, L. Filipović, K. Jakovljević, R. Janković, S. Grgurić-Šipka, I. Ivanović, S. Radulović and Ž. L. Tešić, J. Inorg. Biochem., 2012, 108, 53–61 CrossRef PubMed.
- S. Abdolmaleki, A. Aslani, A. Aliabadi, S. Khazayel, S. M. Amininasab, Z. Izadi, M. Ghadermazi, E. Motieiyan, D. Marabello and V. H. N. Rodrigues, J. Coord. Chem., 2022, 75, 147–161 CrossRef CAS.
- M. L. Matlou, F. P. Malan, S. Nkadimeng, L. McGaw, V. J. Tembu and A.-L. E. Manicum, J. Biol. Inorg. Chem., 2023, 28, 29–41 CrossRef CAS PubMed.
- A. F. A. Peacock, S. Parsons and P. J. Sadler, J. Am. Chem. Soc., 2007, 129, 3348–3357 CrossRef CAS PubMed.
- S. H. van Rijt, A. F. A. Peacock, R. D. L. Johnstone, S. Parsons and P. J. Sadler, Inorg. Chem., 2009, 48, 1753–1762 CrossRef CAS PubMed.
- H. Hao, X. Liu, X. Ge, Y. Zhao, X. Tian, T. Ren, Y. Wang, C. Zhao and Z. Liu, J. Inorg. Biochem., 2019, 192, 52–61 CrossRef CAS PubMed.
- M. J. Macazaga, J. Rodríguez, A. G. Quiroga, S. Peregina, A. Carnero, C. Navarro-Ranninger and R. M. Medina, Eur. J. Inorg. Chem., 2008, 2008, 4762–4769 CrossRef.
- B. Fernández, I. Fernández, J. Cepeda, M. Medina-O'Donnell, E. E. Rufino-Palomares, Á. Raya-Barón, S. Gómez-Ruiz, A. Pérez-Jiménez, J. A. Lupiáñez, F. J. Reyes-Zurita and A. Rodríguez-Diéguez, Cryst. Growth Des., 2018, 18, 969–978 CrossRef.
- K.-F. Chang, H.-C. Lai, S.-C. Lee, X.-F. Huang, Y.-C. Huang, T.-E. Chou, C.-Y. Hsiao and N.-M. Tsai, J. Cell. Mol. Med., 2023, 27, 1423–1435 CrossRef CAS PubMed.
- Z.-F. Zeng, Q.-P. Huang, J.-H. Cai, G.-J. Zheng, Q.-C. Huang, Z.-L. Liu, Z.-L. Chen and Y.-H. Wei, Molecules, 2021, 26(13), 1–18 CrossRef PubMed.
- L. K. Dillard, L. Lopez-Perez, R. X. Martinez, A. M. Fullerton, S. Chadha and C. M. McMahon, Cancer Epidemiol., 2022, 79, 1–10 Search PubMed.
- M. Balali-Mood, K. Naseri, Z. Tahergorabi, M. R. Khazdair and M. Sadeghi, Front. Pharmacol., 2021, 12, 1–19 Search PubMed.
- A. Sigel, H. Sigel and R. K. O. Sigel, Cadmium: From toxicity to essentiality, Springer, 2013, vol. 11 Search PubMed.
- S. Mahey, R. Kumar, M. Sharma, V. Kumar and R. Bhardwaj, SN Appl. Sci., 2020, 2, 1–12 Search PubMed.
- Bruker AXS Inc., 2004.
- G. M. Sheldrick, SADABS, Program for Empirical Absorption Correction of Area Detector Data, University of Gottingen, Germany, 2010 Search PubMed.
- G. M. Sheldrick, Acta Crystallogr., Sect. C: Struct. Chem., 2015, 71, 3–8 Search PubMed.
- O. V. Dolomanov, L. J. Bourhis, R. J. Gildea, J. A. K. Howard and H. Puschmann, J. Appl. Crystallogr., 2009, 42, 339–341 CrossRef CAS.
- M. J. Frisch, G. W. Trucks, H. B. Schlegel, G. E. Scuseria, M. A. Robb, J. R. Cheeseman, G. Scalmani, V. Barone, G. A. Petersson, H. Nakatsuji and X. Li, Gaussian16, Gaussian Inc., Wallingford, USA, 2016 Search PubMed.
- T. Yanai, D. P. Tew and N. C. Handy, Chem. Phys. Lett., 2004, 393, 51–57 CrossRef CAS.
- T. H. Dunning Jr. and P. J. Hay, Modern Theoretical Chemistry, Plenum Press, New York, 1977 Search PubMed.
- J. Tomasi, B. Mennucci and R. Cammi, Chem. Rev., 2005, 105, 2999–3093 CrossRef CAS PubMed.
- R. Improta, V. Barone, G. Scalmani and M. J. Frisch, J. Chem. Phys., 2006, 125, 1–9 CrossRef PubMed.
- G. Scalmani, M. J. Frisch, B. Mennucci, J. Tomasi, R. Cammi and V. Barone, J. Chem. Phys., 2006, 124, 1–15 CrossRef PubMed.
- S. Grimme, J. Antony, S. Ehrlich and H. Krieg, J. Chem. Phys., 2010, 132, 154104 CrossRef PubMed.
- S. Dapprich, I. Komáromi, K. S. Byun, K. Morokuma and M. J. Frisch, J. Mol. Struct.: THEOCHEM, 1999, 461–462, 1–21 CrossRef CAS.
- T. Vreven, K. Morokuma, Ö. Farkas, H. B. Schlegel and M. J. Frisch, J. Comput. Chem., 2003, 24, 760–769 CrossRef CAS PubMed.
- H. Lin and D. G. Truhlar, Theor. Chem. Acc., 2007, 117, 185–199 Search PubMed.
- J. J. P. Stewart, J. Mol. Model., 2007, 13, 1173–1213 CrossRef CAS PubMed.
- N. S. Bryan and M. B. Grisham, Free Radicals Biol. Med., 2007, 43, 645–657 CrossRef CAS PubMed.
- A. García-García, P. Cristobal-Cueto, T. Hidalgo, I. J. Vitórica-Yrezábal, A. Rodríguez-Diéguez, P. Horcajada and S. Rojas, Potential antiprostatic performance of novel lanthanide-complexes based on 5-nitropicolinic acid, J. Biol. Inorg. Chem., 2024 DOI:10.1007/s00775-024-02054-0.
Footnote |
| † Electronic supplementary information (ESI) available: Selected bond lengths and angles of crystal structures, FTIR spectra, photophysical properties, cytotoxicity in cancer cell lines, chemical stability in solution, cytotoxic mechanism (apoptosis), anti-inflammatory studies, elemental analysis, single-crystal X-ray crystallographic data, and theoretical calculations. CCDC 2295415–2295420. For ESI and crystallographic data in CIF or other electronic format see DOI: https://doi.org/10.1039/d4dt00265b |
| This journal is © The Royal Society of Chemistry 2024 |

