 Open Access Article
Crystal structure and properties of perovskite-type rubidium niobate, a high-pressure phase of RbNbO3†
Ayako
Yamamoto
 *a,
Kimitoshi
Murase
a,
Takeru
Sato
a,
Kazumasa
Sugiyama
b,
Toru
Kawamata
b,
Yoshiyuki
Inaguma
 c,
Jun-ichi
Yamaura
 d,
Kazuki
Shitara
 e,
Rie
Yokoi
e and
Hiroki
Moriwake
 ef
ef
aGraduate School of Engineering and Science, Shibaura Institute of Technology, 307 Fukasaku, Minuma, Saitama, 337-8570, Japan. E-mail: ayako@shibaura-it.ac.jp
bInstitute for Materials Research, Tohoku University, 2-1 Katahira, Aoba, Sendai, 980, Japan
cDepartment of Chemistry, Faculty of Science, Gakushuin University, 1-5-1 Mejiro, Toshima-ku, Tokyo 171-8588, Japan
dInstitute for Solid State Physics, University of Tokyo, Kashiwa, Chiba, 277-8581, Japan
eNanostructures Research Laboratory, Japan Fine Ceramics Center, 2-4-1 Mutsuno, Atsuta, Nagoya, 456-8587, Japan
fInternational Research Frontiers Initiative (IRFI), MDX Research Center for Element Strategy (MDXES), Tokyo Institute of Technology, SE-6, 4259 Nagatsuta-cho, Midori-ku, Yokohama, Kanagawa, 226-8501 Japan
First published on 1st April 2024
Abstract
We synthesized a perovskite-type RbNbO3 at 1173 K and 4 GPa from non-perovskite RbNbO3 and investigated its crystal structure and properties towards ferroelectric material design. Single-crystal X-ray diffraction analysis revealed an orthorhombic cell in the perovskite-type structure (space group Amm2, no. 38) with a = 3.9937(2) Å, b = 5.8217(3) Å, and c = 5.8647(2) Å. This non-centrosymmetric space group is the same as the ferroelectric BaTiO3 and KNbO3 but with enhanced distortion. Structural transition from orthorhombic to two successive tetragonal phases (Tetra1 at 493 K, Tetra2 at 573 K) was observed, maintaining the perovskite framework before reverting to the triclinic ambient phase at 693 K, with no structural changes between 4 and 300 K. The first transition is similar to that of KNbO3, whereas the second to Tetra2, marked by c-axis elongation and a significant cp/ap ratio jump (from 1.07 to 1.43), is unique. This distortion suggests a transition similar to that of PbVO3, where an octahedron's oxygen separates along the c-axis, forming a pyramid. Ab initio calculations simulating negative pressure like thermal expansion predicted this phase transition (cp/ap = 1.47 at −1.2 GPa), aligning with experimental findings. Thermal analysis revealed two endothermic peaks, with the second transition entailing a greater enthalpy change and volume alteration. Strong second harmonic generation signals were observed across Ortho, Tetra1, and Tetra2 phases, similar to BaTiO3 and KNbO3. Permittivity increased during the first transition, although the second transition's effects were limited by thermal expansion-induced bulk sample collapse. Perovskite-type RbNbO3 emerges as a promising ferroelectric material.
Introduction
Perovskite-type ferroelectrics, such as BaTiO3, are widely recognized as displacement-type ferroelectrics.1 These compounds were extensively explored in the 1960s and 1970s, particularly within the soft-phonon mode theory framework.2 A characteristic feature of these materials is the occurrence of ferroelectric transitions in tandem with crystal tructural transitions. Elements such as Ti(IV) and Nb(V), which possess d0 electronic configurations, are especially promising for designing new ferroelectric materials.Alkali metal niobates, ANbO3 (where A = Li, Na, and K), are classic examples of ferroelectrics or anti-ferroelectrics.1 Their structural stability and distortion types can be explained using the tolerance factor (t = (rA + rO)/√2(rB + rO)) in ABO3, assuming a perovskite structure. LiNbO3 with t = 0.80 adopts its original LiNbO3-type structure, while KNbO3 with t = 1.05 maintains a perovskite structure. Conversely, RbNbO3 with t = 1.07 deviates from the perovskite structure and forms a pseudo-one-dimensional structure3 due to the larger Rb ion size.
High-pressure synthesis methods have been instrumental in discovering new functional materials. In ABO3 compounds, simple and dense structures, such as the LiNbO3 and perovskite types, are stabilized at high pressures based on the ionic radii of A and B. For instance, ferroelectric LiSbO3![[thin space (1/6-em)]](https://www.rsc.org/images/entities/char_2009.gif) 4 was stabilized as a LiNbO3-type at 7.7 GPa, and ferroelectric PbVO3
4 was stabilized as a LiNbO3-type at 7.7 GPa, and ferroelectric PbVO3![[thin space (1/6-em)]](https://www.rsc.org/images/entities/char_2009.gif) 5 as a highly distorted perovskite-type was achieved at 4–6 GPa. The high-pressure approach is particularly advantageous for suppressing low vapor-pressure element volatilization, such as Na, K, Rb, Hg, Tl, and Pb, due to the synthesis in a closed cell.
5 as a highly distorted perovskite-type was achieved at 4–6 GPa. The high-pressure approach is particularly advantageous for suppressing low vapor-pressure element volatilization, such as Na, K, Rb, Hg, Tl, and Pb, due to the synthesis in a closed cell.
An initial brief report on the high-pressure synthesis of perovskite RbNbO3 dates back to 1972.6 Over the decades, theoretical calculations have predicted the structural stability and ferroelectric properties of RbNbO3, assuming a perovskite structure.7 Recently, Fukuda and Yamaura reported on the structural transition of perovskite-type RbNbO3 from the orthorhombic to the tetragonal phase at 493 K and its dielectric properties below 300 K.8 In our study, we present our detailed findings from independent studies on the crystal structure and phase transitions over a broad temperature range (4–1100 K), along with thermal properties measured using thermogravimetry (TG), differential thermal analysis (DTA), and differential scanning calorimetry (DSC), optical properties measured using second harmonic generation (SHG), and dielectric properties. We also discuss ab initio calculations related to phonon dispersion and phase stability. These theoretical calculations explain our experimental results well.
Experimental and theoretical methods
Synthesis and characterization
Ambient pressure phase (APP) RbNbO3 was synthesized from dried Rb2CO3 (99.9%, Kojundo Chemical Co.) and Nb2O5 (99.99%, Kojundo Chemical Co.) with a ca. 5% excess of Rb to maintain stoichiometry. The mixture was sintered in a box furnace at 1073 K in air for 10 hours. The APP was then assembled in a gold cell (3.6 mm in diameter and 6 mm in height) with a heater (carbon tube) and an insulator (boron nitride tube), and the pressure medium (pyrophyllite) all within a glove box to prevent reaction with water. A 180-ton cubic-anvil-type press (Try Eng. Co.) was used for high-pressure synthesis. Polycrystalline samples were treated at 1173 K for 0.5 hours at 4 GPa and as single crystals at 1223 K for 0.2 hours, then cooled to 1173 K for 1 hour at 4 GPa. Both were rapidly quenched to 300 K within several seconds. Characterization was performed using powder XRD (SmartLab, Rigaku) with Cu Kα1 radiation, scanning electron microscopy and energy dispersive analysis (SEM-EDX) (JCM-6000 NeoScope, JEOL).Structure analyses
Single crystal XRD measurements (Mo Kα) were conducted using an XtaLAB Synergy-S diffractometer (Rigaku). Data collection, cell parameter refinement, and data reduction were conducted using the CrysAlis PRO software.9 The phase structure was identified using SHELXT,10 and refinement was performed using SHELXL-14.11 The crystallographic parameters are provided in Table S1.†Powder XRD (Cu Kα) measurements at 300–1100 K were carried out using a Bragg–Brentano diffractometer equipped with a furnace (Ultima, Rigaku) using a Pt sample holder (also serving as a heater). Measurements at 4–300 K were performed using a Bragg–Brentano diffractometer (SmartLab, Rigaku) with Cu Kα1 radiation on a Cu plate connected to a cold head. Lattice parameters were determined using the whole pattern profile fitting method. Diffraction patterns at 373 K (orthorhombic phase), 533 K (tetragonal phase), and 643 K (tetragonal phase) were analyzed using the Rietveld method using the Z-Rietveld software.12
Thermochemical and physical properties
TG, DTA, and DSC were conducted using an integrated thermal property measurement system (ThermoPlus, Rigaku) with a nitrogen gas flow for TG-DTA. The enthalpy change determination for phase transitions was calibrated using a tin standard. The SHG measurements, confirming non-centrosymmetric symmetry and evaluating temperature-dependent polarity, were performed using a modified Kurtz NLO system with λ = 1064 nm (YAG laser) in a temperature range of 300–850 K. Details are provided in the referenced materials.4 The dielectric properties of the sintered sample (a sliced disk, 3 mm in diameter and 1.5 mm in thickness) were measured using a precision inductance, capacitance, and resistance (LCR) meter (4284A; Agilent, Palo Alto, CA) at frequencies of 10, 50, 100, 200 and 500 kHz and 1 MHz in a temperature range of 300–750 K. Gold electrodes were applied to both sides of the sample using a direct-current sputtering method.Theoretical calculation
All theoretical calculations in this study were performed using the projector augurated wave (PAW)13 method based on density functional theory (DFT)14,15 implemented in VASP code.16,17 All calculations were performed within the generalized gradient approximation parameterized for solids (GGA-PBE_sol).18 For the PAW potentials, 2s and 2p electrons for O, 4p, 4d, and 5s electrons for Nb, 3s, 3p, and 4s electrons for K, and 4s, 4p, and 5s electrons for Rb were explicitly treated as valence electrons. A plane-wave cut-off energy of 550 eV was used. The convergence of the total energies was less than 0.016 eV f.u.−1 compared to the cut-off energy of 1000 eV. Numerical integration was carried out using a 0.25 Å−1k point mesh within Brillouin zones. The energy convergence with respect to the number of k points was better than that of the cut-off energy. The relaxation procedure was terminated when all residual forces on atoms were smaller than 0.01 eV Å−1. Phonon dispersion calculations were performed using the phonopy code19,20 with a 2 × 2 × 2 supercell.Results
High-pressure synthesis and characterization
The complex triclinic APP of RbNbO3 was transformed into a denser orthorhombic perovskite-type structure at a high pressure of 4 GPa, as illustrated in Fig. 1(a). The diffraction pattern confirms that RbNbO3 is isomorphic with KNbO3, as shown in Fig. 1(b), exhibiting a BaTiO3-type distortion. The perovskite phase was not obtained below 2 GPa. In the early stage of the synthesis, a precursor APP-RbNbO3 was synthesized with slightly off-stoichiometry (Rb deficient), and this induced a small amount of a secondary phase, Rb1−xNbO3 (x ∼ 0.4) with a tetragonal tungsten bronze (TTB)-type structure. Using a stoichiometric APP-RbNbO3 that began with an Rb-excess composition, RbNbO3 impurity phases were eliminated. Separately from this study, we isolated a single-phase of Rb1-xNbO3 (x ∼ 0.4) with TTB-type structure, which will be reported elsewhere.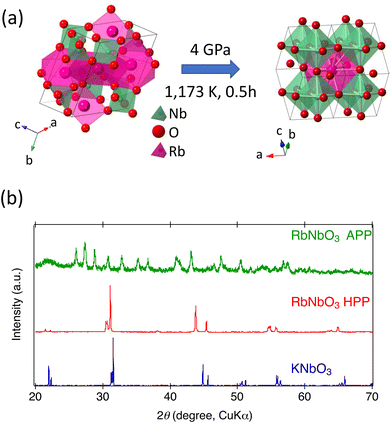 | ||
| Fig. 1 (a) Crystal structure models of the ambient-pressure phase (APP) and high-pressure phase (HPP) of RbNbO3; (b) powder XRD of APP and HPP of RbNbO3 and KNbO3. | ||
The lattice parameters of RbNbO3 were determined as a = 3.9937(2) Å, b = 5.8217(3) Å, and c = 5.8647(2) Å, and volume v = 136.35(2) Å3 by single-crystal analysis; consistent with the lattice parameters determined by Fukuda and Yamaura8 (a = 3.99152(2) Å, b = 5.82230(3) Å, and c = 5.86394(3) Å). These values are larger than those of KNbO3, reflecting the larger ionic size of Rb. The density change from 4.362 g cm−3 to 5.514 g cm−3 represents a significant volume reduction of 26%, much higher than typical volume reductions in metal complex oxide phase transitions. The orthorhombicity and Nb displacement exceed those of KNbO3, suggesting a higher dielectric polarization.
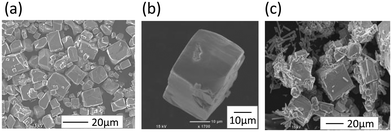
SEM images in Fig. 2(a–c) show the automorphic grain of HPP-RbNbO3. Most single crystals measured 10–30 μm on the edge length, as shown in Fig. 2(a and b). Most powders and crystals show cubic shapes, but an exception occurs in the case of the Rb-deficient precursor, as seen in Fig. 2(c). The rod-shaped automorphic grain of TTB-Rb1−xNbO3 (x ∼ 0.4) was confirmed based on both XRD and SEM images. EDX analysis of flat crystal surfaces of RbNbO3 revealed an Rb![[thin space (1/6-em)]](https://www.rsc.org/images/entities/char_2009.gif) :
:![[thin space (1/6-em)]](https://www.rsc.org/images/entities/char_2009.gif) Nb ratio of 50.6(4)
Nb ratio of 50.6(4)![[thin space (1/6-em)]](https://www.rsc.org/images/entities/char_2009.gif) :
:![[thin space (1/6-em)]](https://www.rsc.org/images/entities/char_2009.gif) 49.4(4), close to the expected stoichiometry.
49.4(4), close to the expected stoichiometry.
Atomic positions and displacement parameters in HPP-RbNbO3 were refined using a single-crystal XRD analysis and are listed in Tables 1 and S2.† Bond distances and angles were compared with those of KNbO3 and APP-RbNbO3 and are summarized in Table 2. Fig. 3(a) and (b) illustrate the Nb and Rb coordinations in RbNbO3, respectively. Although cell parameters of RbNbO3 are longer than those of KNbO3, the shortest Nb–O bond is shorter in RbNbO3. The Nb–O bond angles in RbNbO3 deviate more from the ideal 90° than those in KNbO3. A greater Nb shift in the ab plane occurring along the polar axis c than in KNbO3 was confirmed, resulting in two shorter Nb–O2 bonds and two longer Nb–O2 bonds. The findings suggest a greater polarization in RbNbO3 than that of KNbO3.
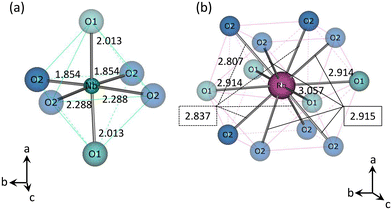 | ||
| Fig. 3 Structure models of (a) Nb–O and (b) Rb–O coordination in RbNbO3. Numbers between atoms indicates the distance in Å. | ||
| Atom | Site | Occ. | x | y | z | U iso (Å2) |
|---|---|---|---|---|---|---|
| Nb | 2b | 1 | 1/2 | 0 | 0.50570(9) | 0.00383(14) |
| Rb | 2a | 1 | 0.0 | 0 | 0.02736(6) | 0.0062(2) |
| O1 | 2a | 1 | 0.0 | 0 | 0.5487(6) | 0.0065(6) |
| O2 | 4e | 1 | 1/2 | 0.2411(5) | 0.2992(5) | 0.0060(4) |
| RbNbO3 (HPP) | KNbO3 | RbNbO3 (APP) | |
|---|---|---|---|
| Nb–O2 (Å) | 1.854(3) × 2 | 1.867(2) × 2 | Nb1–O, 1.794(5), 1.890(5), 1.948(6), 2.059(4), 2.073(6) |
| Nb–O1 (Å) | 2.013(5) × 2 | 1.9968(3) × 2 | Nb2–O, 1.766(7), 1.912(5),1.996(4), 2.049(5), 2.093(3) |
| Nb–O2 (Å) | 2.288(3) × 2 | 2.178(2) × 2 | — |
| O1–Nb–O2 (°) | 84.60(8)/94.69(7) | 85.74(5)/94.58(6) | — |
| O2–Nb–O2 (°) | 89.580(19) | 89.67(3) | — |
| BVS (Rb/K) | +2.22 | +1.78 | +0.93(Rb1)/+1.20(Rb2)/+1.13(Rb3) |
| BVS (Nb) | +4.57 | +4.63 | +4.88(Nb1)/+4.87(Nb2) |
| BVS (O1) | −2.21 | −2.14 | −2.03(O1)/−1.28(O2)/−2.12(O3) |
| BVS (O2) | −2.29 | −2.13 | −2.28(O4)/−2.15(O5)/−2.40(O6) |
| t (given) | 1.07 | 1.05 | n/a |
| t (obs.) | 1.00 | 1.00 | n/a |
The Bond Valence Sum (BVS) calculated21 for each site, based on the distances in Table 2, indicated that if a cation's BVS exceeds its formal valence, the lattice experiences compression from nearby anions or forms multiple bonds. The BVS value of Rb in HPP-RbNbO3 is exceptionally high at +2.22, indicating significant compressibility with the 12 coordination. In contrast, the BVS for Rb in APP ranged from +0.93–1.20, closer to the formal valence of +1.0. The BVSs of Nb and O1/O2 in HPP are +4.57 and −2.21/−2.29, despite having formal valences +5.0 and −2.0, respectively, suggesting dipole formation.
The t was calculated using both Shannon's ionic radii22 and observed experimental distances. The given t for RbNbO3 is slightly larger than for KNbO3. However, once stabilized under high pressure, both the observed t values for the Rb and K variants are 1.00, implying that Rb's ionic radius compacts significantly under high pressure, fitting well within the perovskite structure.
Structural phase transitions depending on temperature
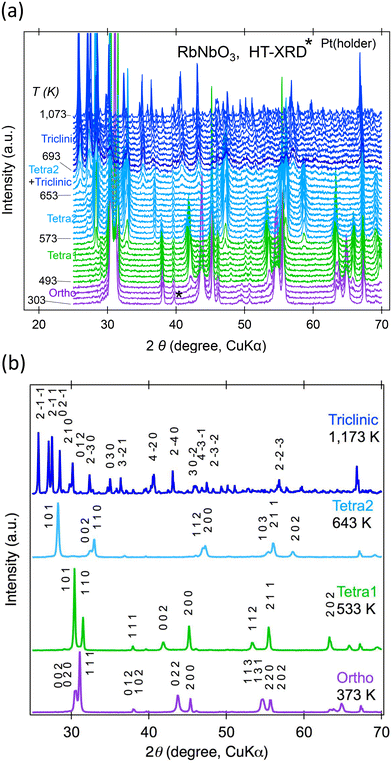
Powder XRD was used to explore temperature-dependent crystal structure changes in RbNbO3 from 300–1100 K. Fig. 4(a) displays the second run's diffraction pattern variation with temperature. At least four phases were identified: an orthorhombic (Ortho) phase, two tetragonal (Tetra1 and Tetra2) phases, and a triclinic phase, as shown in Fig. 4(b). There is likely to be another intermediate phase between Tetra2 and triclinic that is likely a derivative of the triclinic phase. The highest temperature phase reverted to the ambient stable phase above 693 K.The temperature dependences of the lattice parameters of HPP-RbNbO3 are plotted in Fig. 5. The ortho-to-Tetra1 transition occurred at 493 K, almost the same temperature as in KNbO3.23 Note that the transition to another tetragonal phase, Tetra2, at 573 K involved lattice parameter c elongation, distinct from the tetra–cubic transition in KNbO3.23 A wide temperature range with coexisting Tetra1–Tetra2 phases was observed. In this range, c elongated, and the cp/ap ratio (ap and cp are taken from a basic perovskite cell) increased from 1.07 to 1.43, with cell volume expansion. As later discussed, the SHG was confirmed up to 650 K, proving that the Ortho, Tetra1, and Tetra2 phases are non-centrosymmetric. The space group of both the Tetra1 and Tetra2 phases was estimated as P4mm due to the reflection conditions and appearance of the SHG signal. The Rietveld analyses of powder XRD at 373 K, 533 K, and 643 K were performed, and reasonable parameters are shown in Fig. S2.† Local coordination around Nb in Tetra2 will be discussed later.
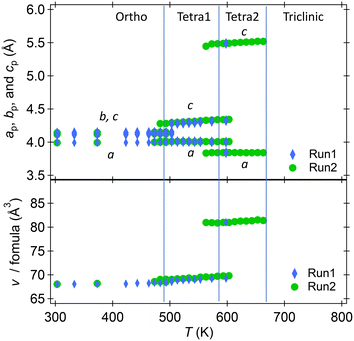 | ||
| Fig. 5 Temperature dependence of lattice parameters of RbNbO3 at 300–670 K. a, b, c, and v taken from a basic perovskite cell. | ||
Powder XRD measurements at 4–300 K revealed no structural changes, unlike the transition to a rhombohedral phase below 220 K in KNbO3.24 This aligns with our predictions that the most stable phase, i.e., the lowest energy, of RbNbO3 is the orthorhombic cell, as shown in Table 3, while that of KNbO3 is a rhombohedral cell. The temperature dependences of the diffraction patterns are shown in Fig. S1.† The lattice parameters shrunk according to the regular thermal reduction with decreasing temperature. One possible reason why no phase transition occurred is that Rb substitution functions as chemical pressure. The orthorhombic phase is stable at lower temperatures, as observed in KNbO3 under external (physical) pressure.25
| RbNbO3 | RbNbO3![[thin space (1/6-em)]](https://www.rsc.org/images/entities/char_2009.gif) 7 7 |
KNbO3 | BaTiO3 | |
|---|---|---|---|---|
| Space group | Energy (meV) | Energy (meV) | Energy (meV) | Energy (meV) |
Pm![[3 with combining macron]](https://www.rsc.org/images/entities/char_0033_0304.gif) m m |
0 | 0 | 0 | 0 |
| P4mm | −61.76 | −46.5 | −22.4 | −20.4 |
| Amm2 | −70.11 | −57.0 | −27.9 | −22.5 |
| R3m | −70.08 | −58.6 | −28.9 | −27.1 |
Optical and dielectric properties
SHG signals of RbNbO3, along with KNbO3 and BaTiO3, were measured at room temperature to confirm optical polarity. The detection of these signals provides insight into whether the structure possesses non-centrosymmetric symmetry. A distinct peak with a relatively high intensity of 750 (normalized to α-SiO2) was observed in RbNbO3, as depicted in Fig. 6. This intensity is comparable with that of KNbO3 (I/ISiO2 = 762) and slightly lower than that of BaTiO3 (I/ISiO2 = 1289). Given the structural distortion type common to RbNbO3, KNbO3, and BaTiO3—typical ferroelectrics—RbNbO3 is anticipated to be ferroelectric. However, inverse polarization in the P–E loop remains to be confirmed.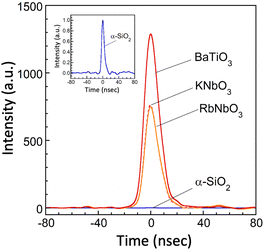 | ||
| Fig. 6 The second harmonic generation (SHG) signals of perovskite-type RbNbO3, KNbO3 and BaTiO3. The relative intensities were calibrated based on that of α-SiO2. | ||
The SHG intensity in relation to temperature was measured using a powdered sample, as shown in Fig. S2.† The intensity vs. temperature graph displays kinks around 500 K and 600 K in both the heating and cooling processes, with notable hysteresis. The decreasing intensity in the first run might be attributable to domain reformation. These kinks likely correspond to phase transitions from the Ortho to Tetra1 and from the Tetra1 to Tetra2 phases, respectively. This suggests that the Tetra2 structure maintains non-centrosymmetric symmetry similar to the orthorhombic and Tetra1 phases. Further investigation is necessary to clarify the reversibility and hysteresis of these transitions.
The dielectric constant of a disk-shaped bulk of HPP-RbNbO3 with gold electrodes was measured. The permittivity at 350 K was ca. 50 (f = 1 MHz), comparable to the value (76 at 200 K, f = 1 MHz) reported by Fukuda et al.8 It gradually increased, showing a sharp rise at the ortho-to-Tetra1 transition temperature, as plotted in Fig. S3.† With further temperature increases, samples collapsed at the Tetra1-to-Tetra2 transition, likely due to significant volumetric expansion. This collapse might be attributable to stress application during measurement, as the samples were fixed with clips. The packing density is about 75% for this measurement. The permittivity at room temperature was 60 at 1 kHz, markedly lower than that of KNbO3. However, we expect the intrinsic value to exceed that of KNbO3, considering the stronger distortion in the Tetra2 phase of RbNbO3 (cp/ap = 1.43) compared with the tetragonal phase of KNbO3 (cp/ap = 1.04). A bulk sample with higher density or a larger single crystal is required for accurate evaluation. The precise determination of this value is of significant interest for developing high-performance electronic devices.
Thermal analysis
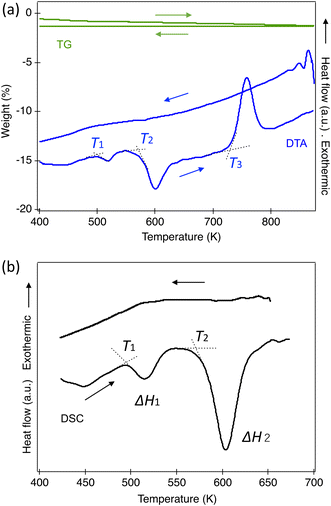
TG and DTA measurements were conducted from 300 K to 1073 K, as shown in Fig. 7(a). Within our instrument's resolution, there were no significant changes in weight in either the heating or cooling cycles. In the DTA, two endothermic peaks and one exothermic peak were observed in the heating process, corresponding to the phase transitions from Ortho to Tetra1 and Tetra1 to Tetra2, and the last for the transition to the triclinic ambient phase. No peaks were found during the cooling process since the transitions did not reverse at ambient pressure once heated to 800 K. To assess the reversibility in the perovskite phase, several phases were quenched from specific temperatures. The orthorhombic phase returns from Tetra1 after being heated at 523 K; however, it does not entirely return from Tetra2. Our quench trial to a pure Tetra2 phase has not succeeded because the phase stability appears to be sensitive to the cooling process at ambient pressure.Fig. 7(b) illustrates the DSC curves in the heating and cooling processes. The first peak, associated with the ortho–Tetra1 transition above 497 K, showed an enthalpy change (ΔH) of 457 J mol−1, comparable with the O–T transition in KNbO3. In contrast, the second peak above 582 K, corresponding to the Tetra1–Tetra2 transition, indicated a ΔH of 3350 J mol−1, approximately seven times larger than the first transition. This aligns with the observed substantial volume change and is significantly higher than the tetragonal-to-cubic transition in KNbO3,26 as listed in Table 4. No reversible thermal peaks corresponding to these phase transitions were observed.
![[thin space (1/6-em)]](https://www.rsc.org/images/entities/char_2009.gif) 23 determined by DSC
23 determined by DSC
| Phase transition | RbNbO3 transition temp. (K) | RbNbO3 enthalpy (J mol−1) | KNbO3 transition temp. (K) | KNbO3 enthalpy (J mol−1) |
|---|---|---|---|---|
| Rhomb–Ortho | — | — | 260.4 | 72.47 |
| Ortho–Tetra1 | 497 | 457 | 489 | 317.71 |
| Tetra1−Tetra2 | 582 | 3,350 | — | — |
| Tetra–Cubic | — | — | 702 | 506.89 |
| Tetra2−Triclinic | 693 (DTA) | — | — | — |
Phonon dispersion by ab initio calculation
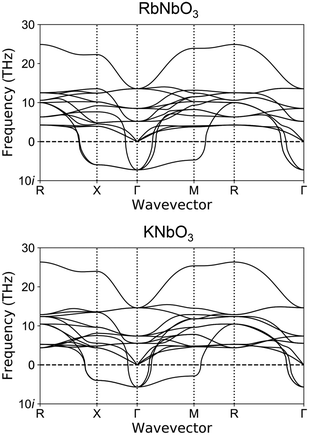
The calculation results for phonon dispersion for virtual cubic perovskite-type RbNbO3 and KNbO3 are shown in Fig. 8. These two compounds showed quite similar phonon dispersion, especially for the soft-mode (imaginary frequency phonon mode). The similar characteristic of the soft-mode phonon around the Γ point, which indicates the potential for displacement-type ferroelectric phase transition, was confirmed. The ferroelectric phase transition of KNbO3 has been confirmed experimentally.23 Our phonon dispersion calculations suggest the possibility of ferroelectric phase transition in perovskite-type RbNbO3.Our experimentally obtained orthorhombic perovskite-type RbNbO3 at high pressure was consistent with our first-principles calculations. The calculated relative energies of RbNbO3 depending on symmetries are listed in Table 3. These data indicate the most stable symmetry for RbNbO3 at the lowest temperature is Amm2. The energy gap between P4mm and Pm![[3 with combining macron]](https://www.rsc.org/images/entities/char_0033_0304.gif) m is significantly larger than those in KNbO3 and BaTiO3, corroborating that no cubic phase appeared experimentally.
m is significantly larger than those in KNbO3 and BaTiO3, corroborating that no cubic phase appeared experimentally.
Discussion
Stabilization of perovskite-type RbNbO3
In ANbO3, where the alkali metal and niobium maintain a 1![[thin space (1/6-em)]](https://www.rsc.org/images/entities/char_2009.gif) :
:![[thin space (1/6-em)]](https://www.rsc.org/images/entities/char_2009.gif) 1 ratio, A = Na and K form perovskite-type structures, while Li, the ion with the smallest radius, forms a LiNbO3-type structure. However, Rb and Cs form unique low symmetry and porous structures because large ions cannot be placed within the perovskite structure. In APP-RbNbO3, Nb–O forms a distorted octahedron 5 + 1 coordination, connecting pseudo one-dimensionally and lacking a three-dimensional network, making it highly hydroscopic and unstable. This study achieved a denser perovskite-type structure in RbNbO3 through a phase transition induced by applying high pressure. The observed 26% volume reduction during this transition is notably large, likely due to the high compressibility of alkali metal ions. It was discovered that the transition to a perovskite phase can occur at 4 GPa, lower than the previously reported 6.5–9 GPa (ref. 6) and 6 GPa (ref. 8) values. Additionally, when reheated under ambient pressure, perovskite HPP reverted to APP above 693 K without decomposition. Our preliminary experiments indicated that the (Rb1−xKx)NbO3 (x = 0–1) solid solution, isotypic to RbNbO3, can also be achieved at 4 GPa, maintaining the same orthorhombic pristine structure with lattice constants according to Vegard's law.27
1 ratio, A = Na and K form perovskite-type structures, while Li, the ion with the smallest radius, forms a LiNbO3-type structure. However, Rb and Cs form unique low symmetry and porous structures because large ions cannot be placed within the perovskite structure. In APP-RbNbO3, Nb–O forms a distorted octahedron 5 + 1 coordination, connecting pseudo one-dimensionally and lacking a three-dimensional network, making it highly hydroscopic and unstable. This study achieved a denser perovskite-type structure in RbNbO3 through a phase transition induced by applying high pressure. The observed 26% volume reduction during this transition is notably large, likely due to the high compressibility of alkali metal ions. It was discovered that the transition to a perovskite phase can occur at 4 GPa, lower than the previously reported 6.5–9 GPa (ref. 6) and 6 GPa (ref. 8) values. Additionally, when reheated under ambient pressure, perovskite HPP reverted to APP above 693 K without decomposition. Our preliminary experiments indicated that the (Rb1−xKx)NbO3 (x = 0–1) solid solution, isotypic to RbNbO3, can also be achieved at 4 GPa, maintaining the same orthorhombic pristine structure with lattice constants according to Vegard's law.27
Of further interest in perovskite RbNbO3 is the feasibility of stabilizing the high-temperature and high-pressure (HTHP) phase as a thin film. PbVO3![[thin space (1/6-em)]](https://www.rsc.org/images/entities/char_2009.gif) 5 was first obtained as an HTHP phase at 4–6 GPa, and then it was obtained as a thin film28 using the pulsed laser deposition method. As an analogy, we expected that perovskite RbNbO3 could be stabilized as a thin film if we choose substrates with suitable lattice parameters such as KTaO3 (a = 3.989 Å).
5 was first obtained as an HTHP phase at 4–6 GPa, and then it was obtained as a thin film28 using the pulsed laser deposition method. As an analogy, we expected that perovskite RbNbO3 could be stabilized as a thin film if we choose substrates with suitable lattice parameters such as KTaO3 (a = 3.989 Å).
Tetragonal to tetragonal phase transition
The first structural phase transition of RbNbO3 from orthorhombic to tetragonal mirrors that of KNbO3.23 However, the second transition, unlike KNbO3's transition to cubic, remains tetragonal but with a significant change in axial ratio.The cp/ap ratio increased from 1.07 to 1.43, and the volume expanded by 12%. A similarly strong distortion was reported in tetragonal perovskite PbVO3 (cp/ap = 1.22)5 and BiCoO3 (cp/ap = 1.27)29 that led one tetrahedral oxygen to separate along the c-axis and form a pyramid. Using high-temperature XRD data and Rietveld analysis, as shown in Fig. S4,† we determined the preliminary structural parameters as presented in Table S3.† This transition notably includes one Nb–O bond lengthening from 2.2 Å to 3.0 Å, effectively forming a pyramidal five-coordination as illustrated in Fig. 9.
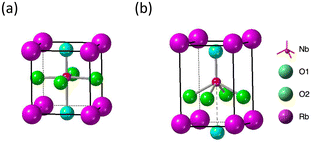 | ||
| Fig. 9 Structure models of Nb–O coordination in RbNbO3. (a) Tetra1 (cp/ap = 1.07), and (b) Tetra2 (cp/ap = 1.43) phases. | ||
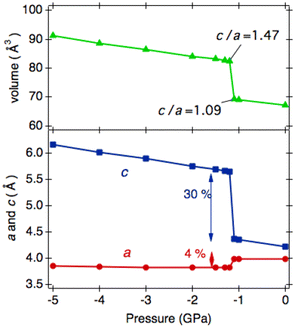
Such an elongation extent for c has yet to be reported in the ANbO3 series. However, our previous theoretical calculations predicted a tetragonal–tetragonal phase transition by applying negative pressure in an A′TiO3 (A′ = Ca, Sr, Ba, and Pb) series. The cp/ap ratio of the second tetragonal cell exceeds 1.2, maintaining the space group P4mm,29 which contrasts with the cubic cell with Pm![[3 with combining macron]](https://www.rsc.org/images/entities/char_0033_0304.gif) m space group appearing at higher temperatures. For example, in CaTiO3, tetra–tetra phase transition occurs at −4.2 GPa.29 Inspired by such phase transitions, we calculated the phase stability of HPP-RbNbO3 by applying negative pressure. We found a similar phase transition at −1.2 GPa, as plotted in Fig. 10. The tetragonal phase caused by thermal expansion simulates the lattice expansion under negative pressure. A comparison of experimental lattice parameters and calculated ones assuming negative pressure is provided in Table 5. This suggests the possibility of stabilizing the tetragonal phase with a high cp/ap ratio, which is expected to have high permittivity as a thin film by manipulating the lattice size with a suitable substrate.
m space group appearing at higher temperatures. For example, in CaTiO3, tetra–tetra phase transition occurs at −4.2 GPa.29 Inspired by such phase transitions, we calculated the phase stability of HPP-RbNbO3 by applying negative pressure. We found a similar phase transition at −1.2 GPa, as plotted in Fig. 10. The tetragonal phase caused by thermal expansion simulates the lattice expansion under negative pressure. A comparison of experimental lattice parameters and calculated ones assuming negative pressure is provided in Table 5. This suggests the possibility of stabilizing the tetragonal phase with a high cp/ap ratio, which is expected to have high permittivity as a thin film by manipulating the lattice size with a suitable substrate.
| Phase, Temp. (K) | Exp. lattice parameters, a (Å), c (Å), and v (Å3) | Press. (GPa) | Cal. lattice parameters, a (Å), c (Å), and v (Å3) |
|---|---|---|---|
| Tetra1, 533 | a = 4.0080(14) | 0.0 | a = 3.992 |
| c = 4.3073(15) | c = 4.223 | ||
| v = 69.10(2) | v = 69.22 | ||
| Tetra2, 643 | a = 3.8249(12) | –1.2 | a = 3.819 |
| c = 5.4723(19) | c = 5.650 | ||
| v = 80.06(2) | v = 82.45 |
Dielectric polarization of RbNbO3
In this study, obtaining samples with high packing density was challenging, hindering the estimation of the intrinsic dielectric constant and relative permittivity. Nevertheless, given the strong lattice strain, values equal to or greater than those of KNbO3 are anticipated. The dielectric polarization of ortho-RbNbO3, estimated from its Born effective charge,30 was 0.33 C m−2, closely aligning with KNbO3's 0.32 C m−1.31 The dielectric polarizations of the Tetra1 and Tetra2 phases were roughly estimated to be 0.4 and 0.6 C m−2, respectively, comparable with the significant polarization of LiNbO3 and LiTaO3 (0.71 and 0.50 C m−2, respectively).32 Theoretical calculations under assumed negative pressure also support these findings, maintaining high polarization in Tetra2 even when a bond is broken. Further experiments are planned to measure the dielectric constant and demonstrate high polarization accurately.Conclusions
We have explored the crystal structures and properties of perovskite-type RbNbO3 synthesized under a high pressure of 4 GPa. The crystal structure, refined at 300 K using single-crystal XRD analysis, was identified as an orthorhombic perovskite (space group Amm2, no. 38) with lattice parameters a = 3.9937(2) Å, b = 5.8217(3) Å, and c = 5.8647(2) Å. This structure shares the distortion type seen in KNbO3. Temperature-dependent XRD studies revealed a series of phase transitions: the structure transforms from orthorhombic to tetragonal at 493 K, undergoes another tetragonal transition at 573 K while retaining the perovskite framework, and eventually shifts to the triclinic ambient phase of RbNbO3 at 693 K. Remarkably, no structural changes were observed down to 4 K. The first transition mirrors that of KNbO3, but the second transition presents a unique behavior, notably in the elongation of the c-axis and the significant increase in the cp/ap ratio from 1.07 to 1.43. Thermal analysis revealed these structural transitions could explain the enthalpy changes. Interestingly, the increase in the lattice parameters in the second transition is an analogy of the theoretical calculation assuming negative pressure. A strong SHG signal, comparable with that of KNbO3, was observed. Further investigation is required to evaluate the permittivity of RbNbO3 accurately and fully understand its potential in ferroelectric applications.Author contributions
AY: conceptualization, investigation, formal analysis, writing – original draft, and writing – review and editing; KM: data curation and formal analysis; TS: data curation and formal analysis; KS: structural refinement and writing – review and editing; TK: data curation and formal analysis; YI: data curation, formal analysis, and writing – review and editing; JY: data curation and writing – review and editing; KS: theoretical calculation and analysis; RY: theoretical calculation and analysis; HM: investigation, theoretical calculation and analysis, and writing – review and editing.Conflicts of interest
There are no conflicts to declare.Acknowledgements
This study was supported by the Kazuchika Okura Memorial Foundation's research grant in 2022–2023 and Innovative Science and Technology Initiative for Security grant number JPJ004596, ATLA, Japan. This study was also supported by the GRIMT program (202212-RDKGE-0018) at the Institute for Materials Research, Tohoku University, and a Joint Research Program (202306-MCBXG-0079) at the Institute of Solid State Physics, University of Tokyo. Powder XRD measurements were performed at Techno-plaza at Shibaura Institute of Technology.References
- M. Itoh, Y. Hamasaki, H. Takashima, R. Yokoi, A. Taguchi and H. Moriwake, Dalton Trans., 2022, 51, 2610–2630 CAS.
- G. Shirane, B. C. Frazer, V. J. Minkiewicz, J. A. Leake and A. Linz, Phys. Rev. Lett., 1967, 19, 234 Search PubMed.
- M. Serafin and R. Hoppe, Naturwissenschaften, 1979, 66, 50–51 CAS.
- Y. Inaguma, A. Aimi, D. Mori, T. Katsumata, M. Ohtake, M. Nakayama and M. Yonemura, Inorg. Chem., 2018, 57, 15462–15473 CAS.
- R. V. Shpanchenko, V. V. Chernaya, A. A. Tsirlin, P. S. Chizhov, D. E. Sklovsky, E. V. Antipov, E. P. Khlybov, V. Pomjakushin, A. M. Balagurov, J. E. Medvedeva, E. E. Kaul and C. Geibel, Chem. Mater., 2004, 16, 3267–3273 CAS.
- J. A. Kafalas , Proc. 5th Mater. Res. Symp. Gaithersburg Md. U. S. Oct. 18–21 1971 NBS Spec Publ No 364 287 1972, 1972, 287–292.
- A. I. Lebedev, Phys. Solid State, 2015, 57, 331–336 CAS.
- M. Fukuda and K. Yamaura, J. Ceram. Soc. Jpn., 2023, 131, 126–129 CAS.
- Rigaku OD, CrysAlis Rigaku Corp. Oxf. Engl Search PubMed.
- G. M. Sheldrick, Acta Crystallogr., Sect. A: Found. Adv., 2015, 71, 3–8 Search PubMed.
- G. M. Sheldrick, Acta Crystallogr., Sect. C: Struct. Chem., 2015, 71, 3–8 Search PubMed.
- R. Oishi-Tomiyasu, M. Yonemura, T. Morishima, A. Horikawa, S. Torii, T. Ishigaki and T. Kamiyama, J. Appl. Crystallogr., 2012, 45, 299–308 CAS.
- P. E. Blöchl, Phys. Rev. B: Condens. Matter Mater. Phys., 1994, 50, 17953 Search PubMed.
- P. Hohenberg and W. Kohn, Phys. Rev., 1964, 136, B864 Search PubMed.
- W. Kohn and L. J. Sham, Phys. Rev., 1963, 136, A1133 Search PubMed.
- G. Kresse and J. Furthmüller, Phys. Rev. B: Condens. Matter Mater. Phys., 1996, 54, 11169 CAS.
- G. Kresse and D. Joubert, Phys. Rev. B: Condens. Matter Mater. Phys., 1999, 59, 1758 CAS.
- J. Furthmüller, A. Ruzsinszky, G. I. Csonka, O. A. Vydrov, L. A. Constantin, X. Zhou and K. Burke, Phys. Rev. Lett., 2008, 100, 136406 Search PubMed.
- A. Togo, L. Chaput, T. Tadano and I. Tanaka, J. Phys.: Condens. Matter, 2023, 35, 353001 CAS.
- A. Togo, J. Phys. Soc. Jpn., 2023, 92, 012001 Search PubMed.
- I. D. Brown, The Chemical Bond in Inorganic Chemistry: The Bond Valence Model, Oxford University Press, 2002 Search PubMed.
- R. D. Shannon, Acta Crystallogr., Sect. A: Cryst. Phys., Diffr., Theor. Gen. Crystallogr., 1976, 32, 751–767 Search PubMed.
- S. L. Skjærvø, K. Høydalsvik, A. B. Blichfeld, M.-A. Einarsrud and T. Grande, R. Soc. Open Sci., 2018, 5, 180368 Search PubMed.
- G. Shirane, R. Newnham and R. Pepinsky, Phys. Rev., 1954, 96, 581 CAS.
- Y. Kobayashi, S. Endo, K. Deguchi, L. C. Ming and G. Zou, Solid State Commun., 2001, 120, 515–517 CAS.
- J. You, G. Li, S. Zhang, X. Zhang, J. Luo, M. Rao and Z. Peng, J. Alloys Compd., 2021, 882, 160641 CAS.
- A. R. Denton and N. W. Ashcroft, Phys. Rev. A, 1991, 43, 3161 CAS.
- L. W. Martin, Q. Zhan, Y. Suzuki, R. Ramesh, M. Chi, N. Browning, T. Mizoguchi and J. Kreisel, Appl. Phys. Lett., 2007, 90, 062903 Search PubMed.
- A. A. Belik, S. Iikubo, K. Kodama, N. Igawa, S. Shamoto, S. Niitaka, M. Azuma, Y. Shimakawa, M. Takano, F. Izumi and E. Takayama-Muromachi, Chem. Mater., 2006, 18, 798–803 CAS.
- X. Gonze and C. Lee, Phys. Rev. B: Condens. Matter Mater. Phys., 1997, 55, 10355–10368 CAS.
- K. Kakimoto, J. Crystallogr. Soc. Jpn., 2013, 55, 148–152 CAS.
- M. Minakata, The Review of Laser Engineering (in Japanese), 2004, 32, 175–180 Search PubMed.
Footnote |
| † Electronic supplementary information (ESI) available. CCDC 2327355. For ESI and crystallographic data in CIF or other electronic format see DOI: https://doi.org/10.1039/d4dt00190g |
| This journal is © The Royal Society of Chemistry 2024 |

