
 Open Access Article
 This Open Access Article is licensed under a Creative Commons Attribution-Non Commercial 3.0 Unported Licence
Unravelling the 6sp ← 6s absorption spectra of Bi(III) complexes†
Charlene
Harriswangler
 ,
Fátima
Lucio-Martínez
,
Aurora
Rodríguez-Rodríguez
,
David
Esteban-Gómez
and
Carlos
Platas-Iglesias
*
,
Fátima
Lucio-Martínez
,
Aurora
Rodríguez-Rodríguez
,
David
Esteban-Gómez
and
Carlos
Platas-Iglesias
*
Universidade da Coruña, Centro de Interdisciplinar de Química e Bioloxía (CICA) and Departamento de Química, Facultade de Ciencias, 15071, A Coruña, Galicia, Spain. E-mail: carlos.platas.iglesias@udc.es
First published on 20th December 2023
Abstract
We report a spectroscopic and computational study that investigates the absorption spectra of Bi(III) complexes, which often show an absorption band in the UV region (∼270–350 nm) due to 6sp ← 6s transitions. We investigated the spectra of three simple complexes, [BiCl5]2−, [BiCl6]3− and [Bi(DMSO)8]3+, which show absorption maxima at 334, 326 and 279 nm due to 3P1 ← 1S0 transitions. Theoretical calculations based on quasi-degenerate N-electron valence perturbation theory to second order (QD-NEVPT2) provide an accurate description of the absorption spectra when employing CAS(2,9) wave functions. We next investigated the absorption spectra of the [Bi(NOTA)] complex (H3NOTA = 1,4,7-triazacyclononane-1,4,7-triacetic acid), which forms ternary complexes [Bi(NOTA)X]− (X = Cl, Br or I) in the presence of excess halide in aqueous solutions. Halide binding has an important impact on the position of the 3P1 ← 1S0 transition, which shifts progressively to longer wavelengths from 282 nm ([Bi(NOTA)]) to 298 nm (X = Cl), 305 nm (X = Br) and 325 nm (X = I). Subsequent QD-NEVPT2 calculations indicate that this effect is related to the progressive stabilization of the spin–orbit free states associated with the 6s16p1 configuration on increasing the covalent character of the metal–ligand(s) bonds, rather than with significant differences in spin–orbit coupling (SOC). These studies provide valuable insight into the coordination chemistry of Bi(III), an ion with increasing interest in targeted alpha therapy due to the possible application of bismuth isotopes bismuth-212 (212Bi, t1/2 = 60.6 min) and bismuth-213 (213Bi, t1/2 = 45.6 min).
Introduction
The coordination chemistry of Bi(III) in aqueous solution is probably the least well-established among the heavy stable elements. The Bi(III) ion is considered as a borderline acid within Pearson's classification, and it is known to form stable complexes with polyaminocarboxylate ligands containing O and N donor atoms.1 Bi(III) compounds were introduced as remedies for gastrointestinal disorders by the late 18th century,2 and they are still in use (i.e. bismuth subsalicylate, marketed as Pepto-Bismol®). Simple bismuth salts have also been used to treat different microbial infections, including syphilis, colitis, diarrhoea and dermal wounds. More recently, Bi(III) coordination chemistry has experienced renewed interest due to the interesting decay properties of some of its radioisotopes. Indeed, both bismuth-212 (212Bi, t1/2 = 60.6 min) and bismuth-213 (213Bi, t1/2 = 45.6 min) have been highlighted as two of the most promising radioisotopes for application in targeted alpha therapy (TAT).3–5 For this purpose, the radioisotope must be coordinated by a suitable ligand that ensures stable complexation and the specific irradiation of the tumour cells. Most preclinical studies have used DTPA (diethylenetriaminepentaacetic acid) derivatives for this purpose,6 but other polyaminopolycarboxylate chelators are currently being developed for this application, as the complexes of acyclic ligands such as DTPA at times present lower stability compared with cyclic analogues such as DOTA (1,4,7,10-tetraazacyclododecane-1,4,7,10-tetraacetic acid).7–14The Bi(III) ion has a [Xe]4f145d106s2 electron configuration, shared as well with Pb(II) and Tl(I). The coordination chemistry of these metal ions is heavily impacted by the lone-pair effect,12,15–18 which refers to the reluctance of the 6s2 electrons to be ionized or participate in chemical bonding. The 6s2 lone pair is often stereochemically active, which results in an uneven distribution of the donor atoms in the inner coordination sphere.19 The absorption spectra of Bi(III) complexes often show a band in the UV region of the spectrum (∼270–350 nm) that is attributed to a 6sp ← 6s transition. The absorption spectra of Pb(II) complexes show similar features, but the position of this band is generally shifted to higher energies (ca. 210–260 nm).20 A correlation between the position of this band and the stereochemical activity of the 6s2 lone-pair was proposed for Pb(II).20
Theoretical calculations were used to analyse the absorption spectra of Bi(III) complexes, specifically based on time-dependent density functional theory (TDDFT). These studies confirmed the 6sp ← 6s character of the absorption band around 300 nm. The presence of Cl−, Br− and I− anions in the first coordination sphere shifts the main absorption band to lower energies, an effect that is enhanced as the halide anion becomes heavier.16,21 However, the results obtained with TDDFT calculations are highly dependent on the functional used, in particular on the amount of Hartree-Fock (HF) exchange. Furthermore, spin–orbit coupling (SOC) effects, which may be important for heavy atoms like Bi, were not considered so far. The limitations of TDDFT-SOC calculations for the calculation of excited states of heavy atoms have also been recently pointed out, as the perturbative SOC coupling treatment is not appropriate if its magnitude is comparable to the excited state energy gap.22
In this work, we sought to investigate the absorption spectra of a series of small Bi(III) complexes (Scheme 1), using both TDDFT calculations and wave function approaches. Thus, we investigated the octahedral [BiCl6]3− complex as a model system, and compared its absorption spectrum with that of the square pyramidal [BiCl5]2− complex. The structure of the dimethylsulfoxide (DMSO) solvate [Bi(DMSO)8]3+ was established using EXAFS, large-angle X-ray scattering, and crystallographic studies, which evidenced the formation of an eight-coordinated structure.23 Herein, we investigated the absorption spectra of this simple complex and analyzed the performance of TDDFT and calculations based on the complete active space self-consistent field (CASSCF) approach. Given the importance of Bi(III) complexes with polyaminopolycarboxylate ligands, we chose [Bi(NOTA)] as a model complex (H3NOTA = 2,2′,2′′-(1,4,7-triazacyclononane-1,4,7-triyl)triacetic acid). This simple complex was scarcely investigated, though kinetic studies demonstrated slow dissociation in 1 M HClO4.24 Bifunctional derivatives were also tested as Bi(III)-based radiopharmaceuticals.25,26 This compound is coordinatively unsaturated and binds halide anions to form ternary complexes [Bi(NOTA)X]− (X = Cl, Br or I). We show that anion binding has an important impact on the absorption spectra of the complex. This, along with the absence of chromophores in the ligand, is what makes it attractive for this computational study, which can be extended to more complex systems later on.
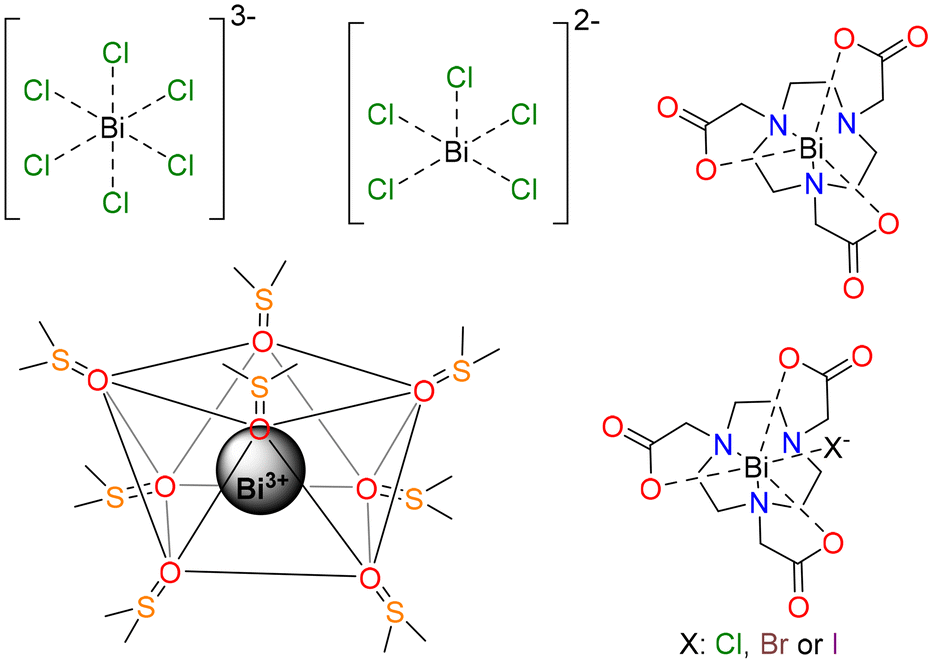 | ||
| Scheme 1 Bi(III) complexes investigated in this work. | ||
Results and discussion
Calculations on the free Bi(III) ion
The absorption spectra of Bi(III) complexes are characterised by the presence of a rather intense absorption arising from excitation from the 1S0 ground state level of the 6s2 configuration to the excited state levels of the 6s16p1 configuration. These are the 3P0, 3P1, 3P2 and 1P1 levels, which for the free Bi(III) ion have the energies shown in Table 1.27 Early computational work revealed that the theoretical treatment of the Bi(III) ion is far from being straightforward, due to the importance of both relativistic and electron correlation effects.28 Herein, initial tests were performed to assess the performance of TDDFT in comparison with NEVPT2 (N-electron valence perturbation theory to second order), which is a multireference method that incorporates electron correlation to the CASSCF wave function through perturbation theory. TDDFT calculations were carried out with the pure PBE functional and its hybrid version PBE0 (25% HF exchange). The pure TPSS functional was also tested, as it has been previously used for TDDFT calculations of Bi(III) complexes.16 The results of these calculations are summarised in Table 1.| 3P0 | 3P1 | 3P2 | 1P1 | |
|---|---|---|---|---|
| a Experimental data from ref. 27. | ||||
| PBE0 | 59![[thin space (1/6-em)]](https://www.rsc.org/images/entities/char_2009.gif) 178 178 |
66070 |
100180 |
117158 |
| PBE | 62576 |
69311 |
103220 |
113098 |
| TPSS | 61605 |
68396 |
102740 |
118567 |
| CASSCF | 67439 |
72153 |
87625 |
119111 |
| NEVPT2 | 70938 |
75899 |
96385 |
114558 |
| QD-NEVPT2 | 76124 |
79894 |
96310 |
113461 |
| Exp./cm−1 | 75539 |
79283 |
95726 |
112602 |
| Exp./nm | 132.4 | 126.1 | 104.4 | 88.8 |
TDDFT calculations were performed incorporating SOC effects, using the effective potential and mean-field approaches (SOMF(1X)). The results shown in Table 1 indicate that the functionals tested in this study provide energies of the levels associated with the 6s16p1 configuration that deviate significantly from the experimental data. The pure PBE functional gives better results than the hybrid counterpart PBE0, while the TPPS functional yields slightly worse results than PBE. The differences between experimental and calculated energies obtained with PBE are high, in particular for the 3P0 level. For this level, a deviation of ∼13000 cm−1 is obtained, which represents ca. 17%. While the purpose of this work is not to establish a benchmark for DFT methods, our results indicate that the prediction of the absorption spectra of Bi(III) compounds using DFT may be problematic.
We next explored the performance of the CASSCF method, using an active space that included the two 6s2 electrons distributed over the 6s and 6p orbitals CAS(2,4). The CASSCF method gives more accurate energies of the levels associated with the 6s16p1 configuration than any of the DFT methods. Incorporating electron correlation using NEVPT2 significantly improves the quality of the calculated results, which deviate <650–4600 cm−1 from the experimental data. In NEVPT2, SO effects are incorporated using quasi-degenerate perturbation theory, where the NEVPT2 corrections are included as improved diagonal energies, but do not alter the composition of the reference state. This limitation can be overcome by using quasi-degenerate NEVPT2 (QD-NEVPT2), in which re-mixing of the reference states is allowed. The use of QD-NEVPT2 results in a dramatic improvement of the agreement between experimental and calculated energies, with deviations <900 cm−1. Thus, we subsequently used QD-NEVPT2 to analyse the absorption spectra of Bi(III) complexes, unless otherwise indicated.
Absorption spectra of the [BiCl5]2−, [BiCl6]3− and [Bi(DMSO)8]3+ complexes
The absorption spectra of the octahedral [BiCl6]3− complex were investigated previously in non-aqueous solvents.21,29,30 In aqueous media, both the [BiCl5]2− and [BiCl6]3− species are present in solution at HCl concentrations higher than 2 M and room temperature, as demonstrated by EXAFS measurements.31 A spectrophotometric study concluded that under these conditions, the square pyramidal [BiCl5]2− complex is the main species present in solution, which is characterised by an absorption maximum at 327 nm.32 The absorption spectrum of a solution of BiCl3 (5 × 10⁻⁵ M) in 2 M HCl (Fig. 1) displays maxima at 327 nm and 231 nm, as well as an additional band at 260 nm. This feature is not observed in the spectrum of [BiCl6]3− obtained in acetonitrile solution, which shows maxima at 334 and 231 nm, in agreement with the literature data.21 This suggests that the [BiCl5]2− complex is indeed the main species present in solution. | ||
| Fig. 1 Absorption spectra of a solution of BiCl3 (5 × 10⁻⁵ M) in 2 M HCl, where the [BiCl5]2− complex is the main species in solution (green trace); a solution of BiCl3 (5 × 10⁻⁵ M) in acetonitrile in the presence of 45 equiv. of (nBu)4NCl, where the main species in solution is the octahedral [BiCl6]3− complex (blue trace); and a 5 × 10⁻⁵ M solution of [Bi(DMSO)8]3+ (red trace). | ||
The geometry of [BiCl6]3− optimized using DFT (see the computational details below) displays octahedral symmetry with Bi–Cl distances of 2.751 Å. For [BiCl5]2−, our DFT calculations afford a square-pyramidal geometry with a short axial Bi–Cl distance of 2.561 Å and Bi–Cl distances of 2.721 Å involving the basal plane. An EXAFS study provided an average Bi–Cl distance of 2.631 Å for a 2 M HCl solution of Bi(III) at 30 °C, with the fit of the data affording a coordination number of 5.3.31 The stabilization of square-pyramidal coordination over a trigonal bipyramidal geometry is likely the result of the stereochemical activity of the Bi(III) 6s2 lone pair. Indeed, square pyramidal coordination was predicted by computational studies performed on the isoelectronic [PoCl5]−.33,34 Furthermore, the 6s2 lone pair in [BiCl5]2− is polarised by a small but significant p character (2.0% according to natural bond orbital analysis), while in [BiCl6]3−, the lone pair has 100% 6s character, according to natural bond orbital (NBO) analysis. Studies performed on the Po(IV) analogue evidenced that a better match of the absorption spectral data was found with a model where the complex holds a water molecule ([PoCl5(H2O)]−).34 However, calculations performed on the [BiCl5(H2O)]2− system (using an implicit PCM solvation model) resulted in the expulsion of the water molecule from the inner-coordination sphere, with a calculated Bi⋯O distance of 2.754 Å. Thus, the lower oxidation state of the metal ion in the Bi(III) complex results in a weak interaction with the water ligand.
The absorption spectra of the [BiCl5]2− and [BiCl6]3− species were subsequently analysed using QD-NEVPT2 calculations based on a CAS(2,4) active space (two electrons distributed over the orbitals with main 6s and 6p character). These calculations predicted the lowest energy absorption of [BiCl5]2− and [BiCl6]3− at 286 and 267 nm, respectively, in sharp contrast to the experimental values of 327 and 334 nm. However, a dramatic improvement of the results was obtained when incorporating five additional (virtual) orbitals with significant 6s and 6p character into the active space, as demonstrated by Löwdin35 population analysis (Fig. 2). This provides a more balanced description of covalent interactions in the system, by incorporating additional antibonding orbitals into the active space.36 Besides, the wave function becomes more flexible, providing a more accurate treatment of electron correlation.37 In the case of transition metal complexes, this is generally achieved by incorporating a second shell of metal-based d orbitals into the active space.38 The lack of proper description of covalent interactions in [BiCl5]2− and [BiCl6]3− results in a clear overestimation of transition energies by QD-NEVPT2 calculations based on CAS(2,4) wave functions. Eight out of the nine orbitals included in the active space for [BiCl6]3− have dominant Bi character (>60%, Fig. 2), though significant contributions from Cl orbitals can be noticed. The ninth orbital, which has the largest occupation in the state-average wave function, contains ∼26% contribution of the Bi 6s orbital, and shows antibonding character with respect to the Bi–Cl interaction.
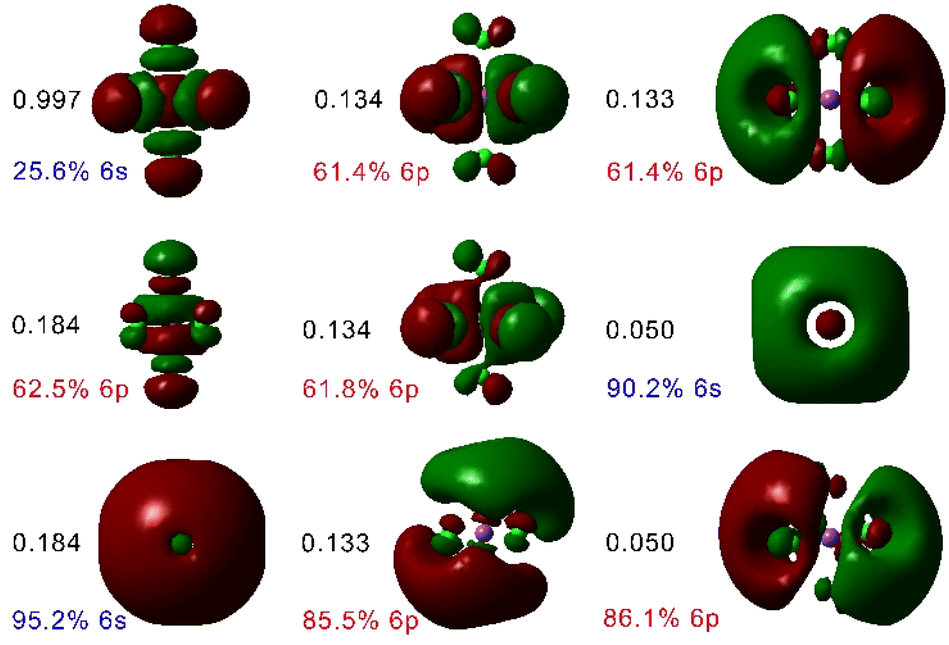 | ||
| Fig. 2 Active space orbitals used for QD-NEVPT2 calculations based on a CAS(2,9) active space for [BiCl6]3−, plotted using an isodensity surface of 0.01 a. u., their occupation numbers and the contributions from Bi(III) 6s and 6p orbitals obtained with Löwdin population analysis. | ||
The QD-NEVPT2 calculations based on CAS(2,9) wave functions predicted two absorption maxima at 315 and 215 nm for the [BiCl6]3− complex, assigned to the 3P1 ← 1S0 (or 3T1u ← 1A1g in Oh symmetry) and 1P1 ← 1S0 (1T1u ← 1A1g in Oh symmetry) transitions, respectively. The 1P1 and 3P1 states can mix orbitally, and thus the 3P1 ← 1S0 and 1P1 ← 1S0 transitions are both spin–orbit and electric dipole allowed, resulting in sizeable oscillator strengths fosc (Table 2). In contrast, the 3P0 ← 1S0 and 3P2 ← 1S0 transitions are forbidden, resulting in fosc values of zero. The calculated oscillator strengths follow the trend of experimental extinction coefficients well (Table 2).
| [BiCl6]3− (Oh) | 3P0 (3A1u) | 3P1 (3T1u) | 3P2 (3T2u + 3Eu) | 1P1 (1T1u) |
|---|---|---|---|---|
| a Calculated data obtained with QD-NEVPT2 calculations using CAS(2,9) active spaces. b Data from ref. 21. | ||||
| λ (nm) | 324.7 | 315.0(×3) | 225.6(×5) | 215.0(×3) |
| λ exp (nm) | — | 334 | — | 231 |
| Energy (cm−1) | 30797 |
31746 |
44324 |
46504 |
| 103 × fosc | 0.0 | 179.1 | 0.0 | 869.6 |
|
εa/M−1 cm−1 |
— | 9520 | — | 28600 |
| [BiCl5]2− (C4v) | 3P0 (3A2) | 3P1 (3E + 3A1) | 3P2 (B1 + 3E + 3A2 + 3B2) | 1P1 (1A1 + 1E) |
| λ (nm) | 333.4 | 326.2(×2)/315.4 | 243.7/238.6 (×2)/218.5 (×2) | 236.2/206.8(×2) |
| λ exp (nm) | — | 326 | 257 | 222 |
| Energy (cm−1) | 29998 |
30656/31707 |
41036/41908/45770 |
42343/48356 |
| 103 × fosc | 0.0 | 55.2/54.2 | 0.0/83.1/0.0 | 74.2/532.6 |
| ε/M−1 cm−1 | — | |||
The spectral data calculated for [BiCl5]2− with QD-NEVPT2 also show good agreement with the experimental spectrum. The excited free-ion 3P1 level splits into two states (3E and 3A1) in the C4v symmetry, which results in two transitions (3E ← 1A1 and 3A1 ← 1A1) at slightly different calculated wavelengths of 325 and 315 nm, in good agreement with the experimental absorption at 326 nm. These two transitions display significant fosc values, as they are both spin–orbit and electric dipole allowed. A similar situation holds for the 1P1 state, which leads to two transitions at 236 (1A1 ← 1A1) and 207 nm (1E ← 1A1), in good agreement with the experimental value (222 nm). Our calculations provide a third absorption with a high value of fosc of 83.1 × 10⁻³, which can be attributed to the 3E(3P2) ← 1A1 transition. Inspection of the composition of the SOC states shows that the sizeable intensity of the latter transition is related to the mixing of the 3E(3P2) and 3E(3P1) states, a situation that is not possible for the Oh point group due to the different symmetries of the states arising from the 3P2 and 3P1 free-ion levels. Thus, the additional feature observed at 257 nm in the absorption spectrum recorded in 2 M HCl is consistent with [BiCl5]2− being the major species present in solution.
The Bi(III) solvates in DMSO were investigated using EXAFS and large-angle X-ray scattering. These studies indicated that the Bi(III) ion is eight-coordinated in solution with Bi–O distances of 2.41 Å.23 Our DFT calculations provided an optimized structure with approximate C2 symmetry and Bi–O distances in the range of 2.440–2.512 Å (2.390–2.469 Å in the X-ray structure). The absorption spectrum of the [Bi(DMSO)8]3+ complex (5 × 10⁻⁵ M) displays a maximum at 279 nm that can be attributed to 6sp ← 6s excitation (Fig. 1). Subsequent QD-NEVPT2 calculations were thus carried out to get a more detailed analysis of the absorption spectrum. CAS(2,4) calculations did not provide virtual orbitals with significant Bi 6s and 6p character close to the active space, and thus QD-NEVPT2 calculations were performed based on the CAS(2,4) wave function. Our calculations predict three absorptions involving the SOC states arising from the 3P1 free-ion term at 260.2 (fosc = 97.3 × 10⁻³), 259.6 (fosc = 101.2 × 10⁻³) and 258.2 (fosc = 130.6 × 10⁻³), in good agreement with the experimental absorption maximum of 279 nm. Furthermore, up to nine of the twelve 6sp ← 6s absoptions have significant fosc values in the range of 16 × 10−3 to 449 × 10−3, which is a clear result of the low symmetry of the complex. The different wavelengths of the absorption maxima observed for [BiCl6]3−, [BiCl5]2− and [Bi(DMSO)8]3+ evidence that the 6sp ← 6s transitions are rather sensitive to the metal coordination environment (Fig. 1).
The energies of the 3P0 and 3P2 levels can be used to estimate the SOC constant λ using eqn (1) and (2), which can be combined to give eqn (3).34
| E(3P0) = E(3P) − 2λ | (1) |
| E(3P2) = E(3P) + λ | (2) |
| λ = (E(3P2) − E(3P0))/3 | (3) |
Our calculations provide very similar λ values for [BiCl6]3− (λ = 4500 cm−1), [BiCl5]2− (λ = 4425 cm−1) and [Bi(DMSO)8]3+ (λ = 5100 cm−1, Table 3). The same approach provides λ = 6729 cm−1 for the free Bi(III) ion, in line with the expected reduction in λ in metal complexes compared with the free ion due to covalency.34 We also note that for these complexes, the 3P0 and 3P1 levels show very similar energies and that the lowest-energy absorption is due to the 3P1 ← 1S0 transition. Thus, the higher energy of the 3P1 ← 1S0 transition calculated for [Bi(DMSO)8]3+ (260 nm) compared with [BiCl6]3− (315 nm) and [BiCl5]2− (326 nm) is not related to significant differences in the values of λ. However, we notice very significant differences in the energies of the spin–orbit free states of these complexes (Table 3). Indeed, the energies of the levels arising from the 3P and 1P states calculated for [Bi(DMSO)8]3+ are clearly higher than those of [BiCl6]3− and [BiCl5]2−. Conversely, much higher energies are obtained for the free Bi(III) ion. This reflects an important stabilization of the excited states of the 6sp configuration (3P and 1P) with respect to the 1S ground state as a result of complex formation. This effect becomes more important as the covalent character of the Bi(III)–ligand bonds increases.
| 3P | 1P | λ | |
|---|---|---|---|
| a Average values are provided for pseudo-degenerate levels, with the number of levels provided within parentheses. All calculations performed using CAS(2,9) wave functions, except for [Bi(DMSO)8]3+ (CAS(2,4)). | |||
| Bi(III) | 89564 |
110485 |
6729 |
| [BiCl6]3− | 39851(×3) |
43047(×3) |
4500 |
| [BiCl5]2− | 34147/41366(×2) |
37148/45587(×2) |
4425 |
| [Bi(DMSO)8]3+ | 46477/48479/49900 |
48216/50090/51438 |
5100 |
| [Bi(NOTA)] | 41316/45126(×2) |
45900/48777(×2) |
3625 |
| [Bi(NOTA)Cl]− | 42063(×2)/43552 |
43554(×2)/48830 |
4114 |
| [Bi(NOTA)Br]− | 40872(×2)/41342 |
41354/41910(×2) |
3715 |
| [Bi(NOTA)I]− | 34082/35720(×2) |
36483(×2)/40580 |
3762 |
Absorption spectra of [Bi(NOTA)] and [Bi(NOTA)X]− (X = Cl, Br or I) complexes
The 1H NMR spectrum of [Bi(NOTA)] recorded in D2O solution shows a singlet at 4.33 ppm due to the methylenic protons of the pendant arms and two multiplets at 3.88 and 3.60 ppm associated with the protons of the macrocyclic unit (Fig. S1, ESI†). This points to an effective C3v symmetry of the complex in solution, which is confirmed by the three signals observed in the 13C NMR spectrum (Fig. S2, ESI†).The absorption spectrum of the [Bi(NOTA)] complex displays an absorption band with a maximum at 282 nm that can be assigned to 6sp ← 6s transitions (Fig. 3). Addition of large excesses of Cl−, Br− or I−, as the corresponding potassium salts, induces significant changes in the absorption spectrum, with the maximum of the absorption band shifting to 298 (X = Cl−), 305 (X = Br−) and 325 nm (X = I−). The titrations show well-defined isosbestic points that suggest the presence of a single equilibrium in solution according to the following equation:
| [Bi(NOTA)] + X− ⇄ [Bi(NOTA)X]− (X = Cl, Br or I) | (4) |
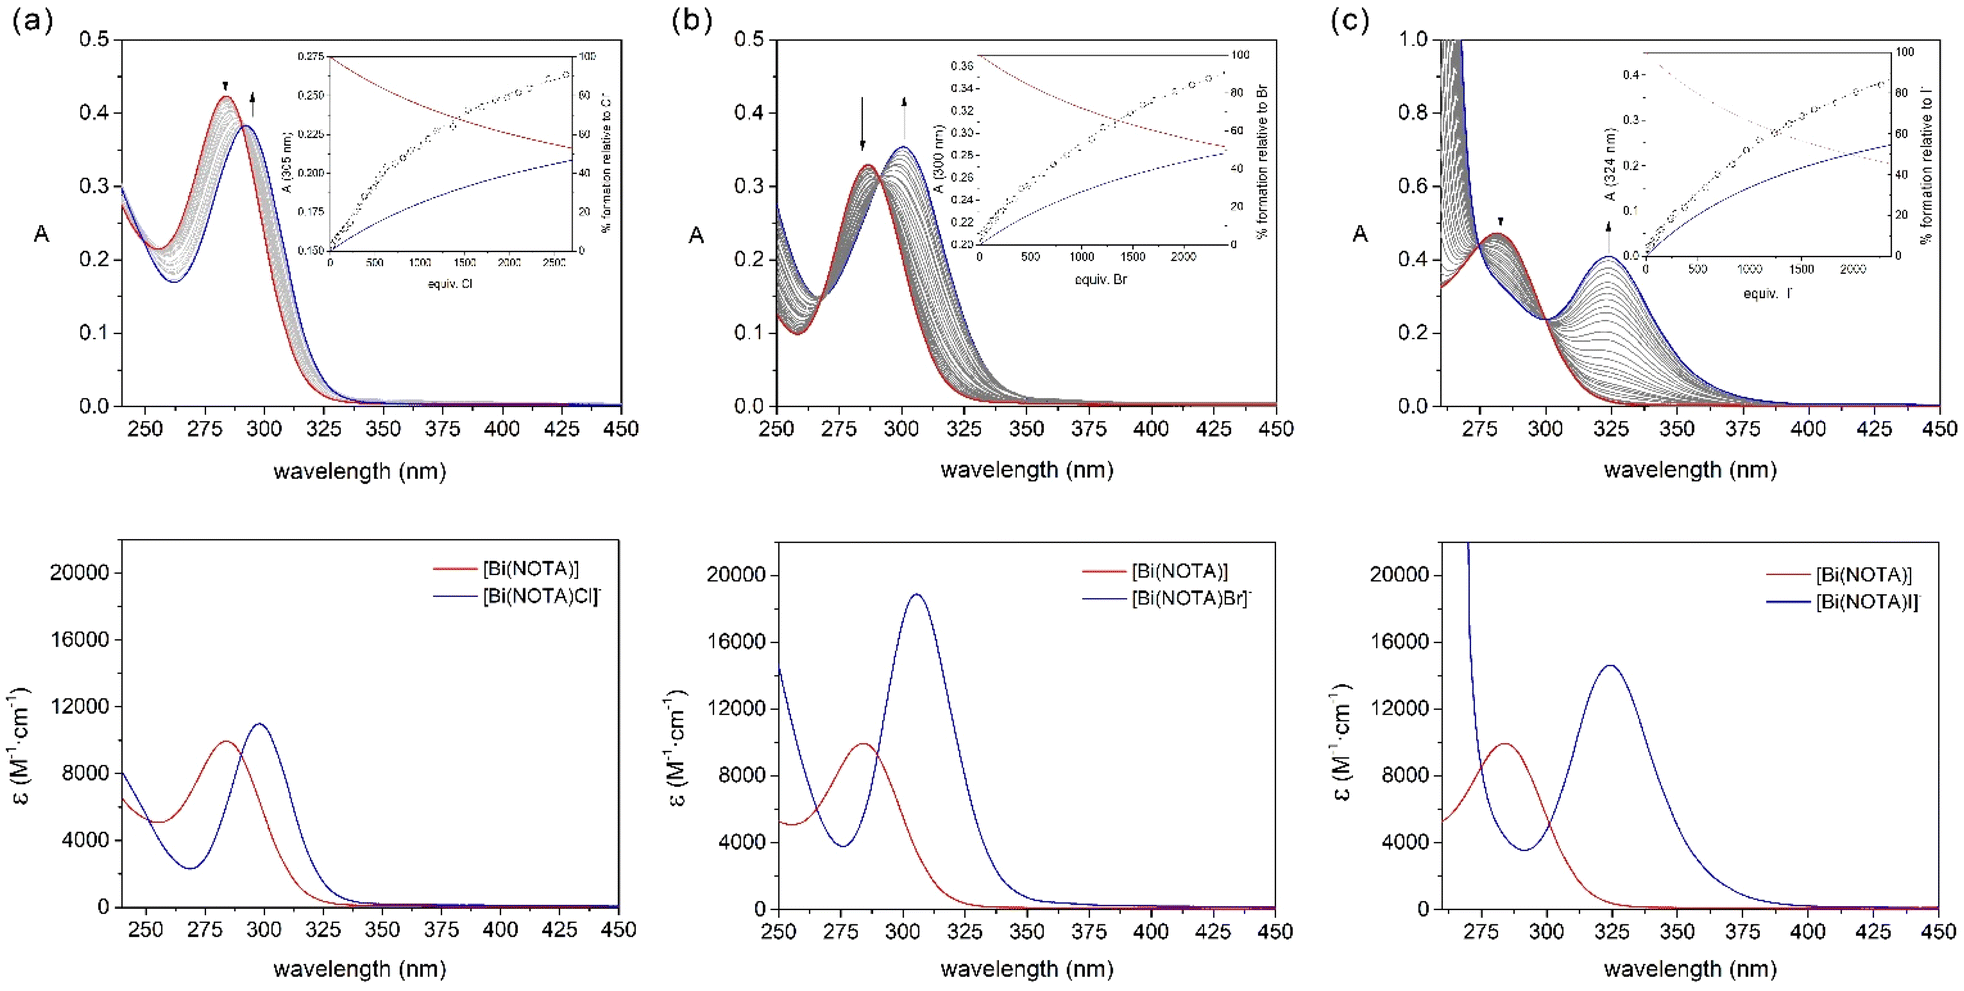 | ||
| Fig. 3 Absorption spectra recorded during the course of the titrations of [Bi(NOTA)] (5 × 10⁻⁵ M) with (a) KCl, (b) KBr and (c) KI. The insets in the upper panels show the titration profiles at selected wavelengths and the lower panels present comparisons of the spectra calculated for the [Bi(NOTA)X]− species and that of [Bi(NOTA)]. | ||
The absorption spectral data were subsequently fitted to a 1:1 binding model affording apparent association constants of K11 = 7.74(7) (X = Cl), 7.76(4) (X = Br) and 10.19(2) (X = I). These equilibrium constants point to a weak interaction of the [Bi(NOTA)] complex with the halide anions. However, they are slightly higher than those reported for [Bi(DO3A)],16 likely as a result of the lower denticity of NOTA3− compared with DO3A3−. The equilibrium constants follow the trend Cl− ∼ Br− < I−, as would be expected considering the β6 values reported for the formation of [BiX6]3− complexes.39 The fits of the data afforded the spectra of the ternary [Bi(NOTA)X]− species, which are shown in Fig. 3. The absorption spectra evidence a progressive shift of the absorption maximum to longer wavelengths as halide size increases (Cl<Br<I).
DFT calculations on [Bi(NOTA)] and [Bi(NOTA)X]− (X = Cl, Br or I) complexes and stereochemical activity of the Bi(III) 6s2 lone pair
DFT calculations provide an optimised geometry for the [Bi(NOTA)] system with a slightly distorted C3 symmetry and Bi–O and Bi–N distances of 2.378(4) and 2.481(1) Å, respectively (Table 4). The minimum energy conformation corresponds to the Λ(δδδ) [or Δ(λλλ)] isomer,40,41 with the free energy of the Δ(δδδ)/Λ(λλλ) enantiomeric pair being 8.2 kJ mol−1 higher. This conformation was observed in the solid state for NOTA3− derivatives with trivalent metal ions such as Ga(III).42,43 Complexes of Bi(III) with hexadentate ligands such as EDTA4− generally complete the metal coordination environment with water molecules or form coordination polymers with bridging carboxylate groups in the solid state.1 However, the Bi–O distances involving water molecules or carboxylate groups of neighbouring complex entities are generally long (2.63–3.19 Å) compared to those within the [Bi(EDTA)]2− unit (2.28–2.60 Å). Optimizations performed on the [Bi(NOTA)(H2O)] system resulted in a structure where the water molecule is involved in hydrogen bonds with the carboxylate groups, rather than coordinating with the metal ion. Thus, all subsequent calculations were performed on the [Bi(NOTA)] system.| Bi–O | Bi–N | Bi–X | NBO | |
|---|---|---|---|---|
| a Mean values are provided for bond distances with standard deviation within parentheses. | ||||
| [Bi(NOTA)] | 2.378(4) | 2.481(1) | — | s(96.87%)p(3.11%) |
| [Bi(NOTA)Cl]− | 2.386(2) | 2.610(2) | 2.822 | s(99.60%)p(0.39%) |
| [Bi(NOTA)Br]− | 2.366(7) | 2.685(2) | 2.995 | s(99.91%)p(0.07%) |
| [Bi(NOTA)I]− | 2.367(12) | 2.656(1) | 3.311 | s(99.74%)p(0.24%) |
The optimized geometries of the [Bi(NOTA)X]− systems indicate that anion binding provokes an important elongation of the Bi–N bonds, while the Bi–O bonds experience minor changes upon halide coordination (Table 4). The calculated Bi–O and Bi–N distances are within the range observed for seven-coordinate complexes with polyaminocarboxylate ligands.1 The Bi–X distances are within the rather broad range observed for [BiX6]3−,44,45 [Bi2X10]4−,46 [Bi3X12]3–47 and [{BiX4}n]−19,48 entities (Bi–Cl = 2.55–2.91 Å; Bi–Br = 2.68–3.18 Å; Bi–I = 2.90–3.37 Å). A ternary complex of [Bi(EDTA)]− with chloride displays a Bi–Cl distance of 2.922 Å in the solid state.1 In the latter structure, the metal ion is eight-coordinated, with the coordination sphere being completed by a bridging carboxylate group.
The analysis of the natural bond orbitals (NBOs) in [Bi(NOTA)] (Table 4) indicates that the 6s2 lone pair of Bi(III) is polarised by a significant 6p contribution (3.11%), which signals a stereochemically active lone pair and thus a hemidirected structure. This type of structure is characterized by a void in the coordination sphere along the direction to which the stereochemically active lone pair is directed, along with a shortening of the bond distances in the opposite direction. This situation parallels what was found previously for Pb(II) complexes.15,49 The studies reported before showed 6p contributions <2.53% for a rather broad series of Bi(III) complexes,12,16,50 which indicates that the lone pair is stereochemically active in [Bi(NOTA)]. Inspection of the NBOs shows that the 6s2 lone pair in [Bi(NOTA)] is indeed directed along the C3 symmetry axis of the molecule in a direction opposite to the macrocyclic unit, just on the side where a void in the coordination sphere is observed (Fig. 4). As a result, the Bi–N bonds, which are situated opposite with respect to the lone pair, are rather short. Anion coordination takes place at the C3 axis in the direction where the Bi(III) 6s2 lone pair is placed. Thus, anion coordination fills the void in the coordination sphere resulting from the stereochemical activity of the lone pair, resulting in a decreased polarisation of the lone pair with 6p contribution and holodirected structures. This is confirmed by the rather spherical distribution of donor atoms around the Bi(III) ion in Fig. 4b. We note that the 6p contribution to the Bi(III) 6s2 lone pair correlates well with the calculated Bi–N distances.
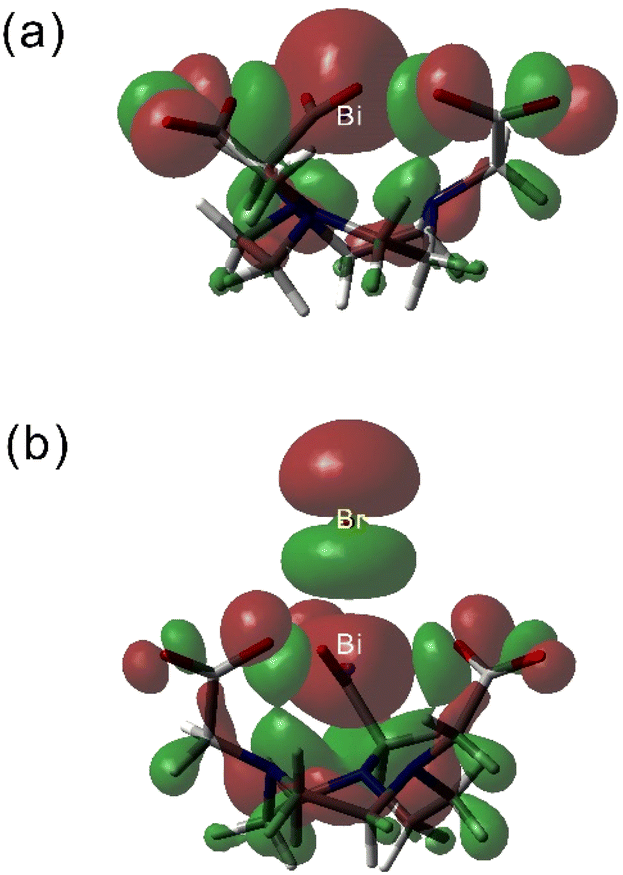 | ||
| Fig. 4 Views of the isodensity surfaces (0.02 a. u.) of the HOMOs obtained with DFT for [Bi(NOTA)] (a) and [Bi(NOTA)Br]− (b). | ||
QD-NEVPT2 calculations on the [Bi(NOTA)] and [Bi(NOTA)X]− (X = Cl, Br or I) systems
We initiated our QD-NEVPT2 calculations using a CAS(2,4) active space. As observed for the chloride complexes, these calculations provided up to five virtual orbitals with significant Bi 6s/6p character, and thus the active space was enlarged. Our QD-NEVPT2 calculations based on CAS(2,9) wave functions predict the energy of the main absorption band observed in the experimental spectra with a rather good accuracy (Table 5). For C3 symmetry, the 3P1 level splits into two states, and thus the 3P1 ← 1S0 absorption contains two contributions from 3E ← 1A and 3A ← 1A excitation, both characterized by relatively high oscillator strengths. As observed for [BiCl5]2−, the reduced symmetry allows for some mixing of the 3E(3P2) and 3E(3P1) states, resulting in calculated fosc values in the range of 17 to 79 for the 3E(3P2) ← 1A excitation. However, these transitions, as well as those involving levels arising from the 1P1 free-ion term, occur at high energies (λ < 260 nm) and could not be observed in the experimental absorption spectra.| [Bi(NOTA)] | 3P0 (3A) | 3P1 (3E + 3A) | 3P2 (3A + 3E + 3E) | 1P1 (1A + 1E) | |
|---|---|---|---|---|---|
| a Average values are provided for nearly degenerate levels, with their number indicated within parentheses. All calculations are performed using CAS(2,9) wave functions. | |||||
| λ (nm) | 274.2 | 270.0(×2); 265.7 | 217.3; 215.2(×2); 204.6(×2) | 208.6; 197.8(×2) | |
|
λ
expa (nm) |
— | 282 | — | ||
| Energy (cm−1) | 36467 |
37037; 37355 |
46009; 46472; 48881 |
47936; 50552 |
|
| 103 × fosc | 0.0 | 133.7; 118.6 | 0.0; 79.1; 0.6 | 322.6; 675.2 | |
|
εa/M−1 cm−1 |
— | 9900 | — | ||
| [Bi(NOTA)Cl]− | λ (nm) | 393.4 | 289.0(×2); 281.6 | 217.3(×2); 215(×2); 212.9 | 211.1(×2); 198.9 |
|
λ
expa (nm) |
298 | ||||
| Energy (cm−1) | 34083 |
34605; 35509 |
46030; 46542; 46976 |
47375; 50266 |
|
| 103 × fosc | 0.0 | 31.6; 9.9 | 0.0; 25.4; 0.0 | 63.7; 130.1 | |
|
εa/M−1 cm−1 |
11000 |
||||
| [Bi(NOTA)Br]− | λ (nm) | 299.7 | 301.8; 296.8(×2) | 225.6(×2); 224.4(×2); 223.6 | 222.4(×2); 220.8 |
|
λ
expa (nm) |
305 | ||||
| Energy (cm−1) | 33364 |
33134; 33697 |
44336; 44568; 44732 |
44971; 45295 |
|
| 103 × fosc | 0.0 | 25.2; 66.5 | 0.5; 16.9 | 235.7; 8.8 | |
|
εa/M−1 cm−1 |
18900 |
||||
| [Bi(NOTA)I]− | λ (nm) | 361.5 | 359.1(×2); 333.2 | 260.0; 259.2(×2); 252.8(×2) | 250.1(×2); 235.9 |
|
λ
expa (nm) |
325 | ||||
| Energy (cm−1) | 27660 |
27848; 30016 |
38465; 38572; 39562 |
39989; 42397 |
|
| 103 × fosc | 0.0 | 44.1; 8.4 | 0.0; 26.9; 0.1 | 183.9; 92.1 | |
|
εa/M−1 cm−1 |
14600 |
||||
Our calculations predict a shift of the absorption band to lower energies arising from 3E(3P1) ← 1A and 3A(3P1) ← 1A excitation upon halide binding, an effect that is enhanced when following the sequence Cl− < Br− < I−. This is in good agreement with the experimental evidence. The energies of the spin–orbit free states 3P and 1P decrease significantly following this trend (Table 3), which suggests that the shift of the absorption 3P1 ← 1S0 is related to an increased covalent character of the Bi–ligand(s) bonds. Furthermore, the values of the SOC constants λ estimated with the methodology outlined above are all very similar, with a somewhat higher value being estimated for [Bi(NOTA)Cl]− (Table 3). Additional support for the role of covalency in the position of the 3P1 ← 1S0 absorption band is provided by the plot of the energies calculated for the spin–orbit free 3P state and the position of the 3P1 ← 1S0 predicted by QD-NEVPT2 calculations (Fig. 5). Our results evidence a very good linear correlation (R2 > 0.996), which supports our hypothesis.
 | ||
| Fig. 5 Correlation between the energies predicted for the spin–orbit free 3P state and the calculated position of the 3P1 ← 1S0 transition. | ||
Recent studies evidenced that the position of 6sp ← 6s in Pb(II) complexes with ligands containing N,O donor sets shifted to longer wavelengths as the number of N atoms of the ligand increased.20 The position of the absorption maxima observed for [Bi(NOTA)] (282 nm, N3O3 donor set), [Bi(DO3A)] (299 nm, N4O3 donor set)16 and [Bi(Me2DODPA)]+ (350 nm, N6O2 donor set)51 follow this trend, which is likely related to a more important covalent character of the Bi–N bonds compared with the Bi–O counterparts. Hancock et al. tentatively suggested that the transition is observed at longer wavelengths for complexes where the Pb(II) environment is holodirected compared to where it is hemidirected.20 Further studies are certainly required to confirm this hypothesis. However, we note that hemidirected structures are favoured by the presence of hard donor atoms and low coordination numbers.15,49 Thus, the observation made by Hancock on Pb(II) complexes appears to be consistent with the results obtained here, as holodirected structures are expected to have more covalent metal–ligand interactions.
Conclusions
We conducted an experimental and theoretical study to understand the factors that affect the 6sp ← 6s spectra of Bi(III) complexes. An important outcome of this study is the deficiencies of common density functionals in predicting the energies of the excited states of the free Bi(III) ion. However, QD-NEVPT2 performed very well both for the free Bi(III) ion and different Bi(III) complexes, particularly using a CAS(2,9) active space. Our calculations performed on the [BiCl6]3− and [BiCl5]2− systems revealed the effects that decreasing complex symmetry has on the absorption spectra. A comparison of the absorption spectra of these complexes with that of [Bi(DMSO)]3+, in which harder DMSO ligands are coordinated through the O atom, suggested that the covalence of the metal–ligand bonds has an important impact on the position of the 3P1 ← 1S0 absorption band, while differences in SOC appear to have a minor effect. This was confirmed by the analysis of the absorption spectra of the [Bi(NOTA)] and [Bi(NOTA)X]− complexes. We envisage that the results reported here will help infer detailed structural information from the absorption spectra of Bi(III) complexes, thereby aiding the characterization of Bi(III) complexes for different applications, including targeted alpha therapy.Experimental and computational section
General
NOTA was purchased from Chematech (Dijon, France). All other solvents and reagents used were purchased from commercial sources, had reagent grade quality and were used as supplied. NMR spectra were recorded using a Bruker Avance 400 spectrometer at 25 °C. Elemental analyses were conducted on a Thermo Finnigan Flash EA 1112 instrument. Mass spectra were obtained with an LTQ-Orbitrap Discovery mass spectrometer in ESI positive mode. Purifications were carried out on a medium performance liquid chromatography (MPLC) Puriflash XS 420 InterChim Chromatographer equipped with a UV-DAD detector and a 20 g BGB Aquarius C18AQ reverse phase column (100 Å, spherical, 15 μm). Aqueous solutions were lyophilized in a Biobase BK-FD10 Series Vacuum Freeze Dryer.Preparation of [Bi(NOTA)]
NOTA (25.7 mg, 0.0847 mmol) was suspended in EtOH and heated to 80 °C. Bi(NO3)3·5H2O (44.3 mg, 0.0913 mmol) was then added and the mixture was refluxed for 2 hours. After solvent evaporation, the crude was dissolved in 0.5 mL of H2O and the pH was adjusted to around 7 with a diluted NaOH solution for the complex to dissolve. This solution was injected into an MPLC and purified by reverse phase using water as a mobile phase (compound eluted at 1.26 CV, 1:44 min:s, with salts eluting at the solvent front at 0.83 CV, 1:09 min:s). The fraction containing the compound of interest was lyophilized, affording a white solid (33.7 mg, 65% yield). 1H-NMR (400 MHz, D2O): δ (ppm) 4.33 (s, 6H), 3.95–3.80 (m, 6H), 3.68–3.53 (m, 6H).13C{1H}-NMR (75 MHz, D2O): δ 177.71, 63.37, 55.84. Elem. anal. found: C 23,59%; H 3,36%; N 9,07%. Calc. for [C12H18BiN3O6](NaNO3)(H2O): C 23,54%; H 3,29%; N 9,15%. MS (ESI+, %BPI): m/z 510.1072 (35), 535.0891 (100), 786.6393 (23), 1041.1903 (61), 1550.2897 (24). Calc. for [C12H19BiN3O6]+: 510.1072; [C12H18BiN3O6Na]+: 532.0892; [(C12H18BiN3O6)2(C12H19BiN3O6)Na]2+: 775.9482, [(C12H18BiN3O6)2Na]+: 1041.1891, [(C12H18BiN3O6)3Na]+: 1550.2891.
Absorption spectra
Spectroscopic measurements were performed with 4 mm path length quartz suprasil certified cells (Helma Analytics) using a double-beam JENWAY 6850 UV-vis spectrophotometer. The DMSO solvate was prepared by dissolving Bi(NO3)3·5H2O in DMSO while the [BiCl5]2− complex was prepared by dissolving BiCl3 in a 2 M HCl solution to obtain a 5 × 10⁻⁵ M concentration of the complex. The [BiCl6]3− complex was prepared by dissolving BiCl3 in acetonitrile and adding 45 equiv. of (nBu)4NCl (final concentration of the complex (5 × 10⁻⁵ M)).Spectroscopic titrations were performed with 1 cm path length quartz suprasil certified cells (Helma Analytics). Anion binding studies were carried out by using 5 × 10⁻⁵ M solutions of [Bi(NOTA)] buffered at pH 7 using MOPS, by adding aliquots of a solution containing the corresponding halide (0.25 M prepared from the potassium salt) and 5 × 10⁻⁵ M [Bi(NOTA)], to avoid dilution. The UV-vis spectra were recorded after each aliquot addition and the spectrophotometric data were analysed using HYPERQUAD.52
Computational details
The geometries of the Bi(III) complexes were optimized using Gaussian 16,53 employing the range-separated hybrid wB97XD functional,54 which incorporates empirical dispersion corrections. Relativistic effects were incorporated using the relativistic effective core potential ECP60MDF for Bi, which includes 60 electrons in the core,55 together with the associated cc-pVTZ (12s11p8d1f)/[5s4p3d1f] basis set.56 For I, we selected the relativistic effective core potential ECP28MDF and the associated cc-pVTZ-PP (27s24p11d1f)/[5s4p3d1f] basis set.57 The standard Def2-TZVPP basis set was selected for all other atoms.58 The structure of the [Bi(DMSO)8]3+ complex was optimized in the gas phase, as the incorporation of solvent effects with a polarized continuum model (PCM) prevented convergence. For all other systems, solvent effects were the integral equation formalism variant of PCM (IEF-PCM variant).59,60 Frequency calculations confirmed that the optimized geometries corresponded to actual energy minima. The size of the integration grid was set with the integral = ultrafine keyword. Natural bond orbital analysis was performed with the NBO program (version 3.1)61 available in Gaussian.Complete active space self-consistent field (CASSCF)62 calculations were performed with the ORCA program package (version 5.0.3).63,64 Relativistic effects were taken into account with the Douglas–Kroll–Hess (DKH2) method,65,66 using a finite nucleus model.67 The active space included the 6s2 electrons of Bi(III) distributed over four [CAS(2,4)] or nine [CAS(2,9)] frontier orbitals with 6s and 6p character. The state average CASSCF calculation included 6 triplet and 10 singlet roots. Dynamic correlation effects were considered using the strongly contracted implementation of N-electron valence state perturbation theory (SC-NEVPT2),68–70 employing the quasi-degenerate (QD-NEVPT2) variant,71,72 unless otherwise stated. NEVPT2 calculations employed the frozen core approximation using the default ORCA settings (see Table S9, ESI,† for details). In these calculations, we used the SARC-DKH-TZVPP73 basis set for Bi and the DKH-def2-TZVPP basis set for ligand atoms, which uses the exponents of the def2-TZVPP58 basis set and was recontracted by D. A. Pantazis for DKH2 calculations. The resolution of identity and chain of spheres (RIJCOSX)74,75 method was used to accelerate the calculations with auxiliary basis sets generated by ORCA with the AutoAux76 procedure. SOC effects were incorporated using quasi-degenerate perturbation theory (QDPT).77,78 Solvent effects were included using the SMD solvation model.79 TDDFT calculations were performed with ORCA, using the DKH method with the SARC-DKH-TZVPP73 basis set for Bi(III) and the PBE,80 PBE081 and TPSS82 functionals. Spin–orbit coupling was considered using the spin–orbit mean-field (SOMF(1X)) method.83,84
Author contributions
C. P.-I conceived and supervised the project. Theoretical calculations were performed by F. L.-M., C. H., A. R.-R., and C. P.-I. Synthesis of the complexes was carried out by C. H. Spectroscopic measurements were recorded by C. H. and analysed by D. E.-G. The manuscript was written through the contributions of all authors. All the authors gave their approval for manuscript submission.Conflicts of interest
There are no conflicts to declare.Acknowledgements
Authors D. E.-G. and C. P.-I. thank Ministerio de Ciencia e Innovación (Grants PID2019-104626GB-I00 and PID2022-138335NB-I00) and Xunta de Galicia (ED431C 2023/33) for generous financial support. C. H. thanks Ministerio de Ciencia e Innovación (Grant PRE2020-092888) for funding her PhD contract. A. R.-R. acknowledges Ministerio de Ciencia e Innovación for generous financial support (PID2019-108352RJ-I00). The authors thank Centro de Supercomputación de Galicia (CESGA) for providing the supercomputing facilities. Funding for open access provided by Universidade da Coruña/CISUG.References
- V. Stavila, R. L. Davidovich, A. Gulea and K. H. Whitmire, Coord. Chem. Rev., 2006, 250, 2782–2810 CrossRef CAS.
- G. G. Briand and N. Burford, Chem. Rev., 1999, 99, 2601–2658 CrossRef CAS PubMed.
- R. Eychenne, M. Chérel, F. Haddad, F. Guérard and J.-F. Gestin, Pharmaceutics, 2021, 13, 906 CrossRef CAS PubMed.
- S. Hassfjell and M. W. Brechbiel, Chem. Rev., 2001, 101, 2019–2036 CrossRef CAS PubMed.
- M. W. Brechbiel, Dalton Trans., 2007, 4918 RSC.
- G. Montavon, A. Le Du, J. Champion, T. Rabung and A. Morgenstern, Dalton Trans., 2012, 41, 8615 RSC.
- D. Horváth, A. Vágner, D. Szikra, G. Trencsényi, N. Demitri, N. Guidolin, A. Maiocchi, S. Ghiani, F. Travagin, G. B. Giovenzana and Z. Baranyai, Angew. Chem., Int. Ed., 2022, 61, e202207120 CrossRef PubMed.
- E. V. Matazova, B. V. Egorova, E. A. Konopkina, G. Y. Aleshin, A. D. Zubenko, A. A. Mitrofanov, K. V. Karpov, O. A. Fedorova, Y. V. Fedorov and S. N. Kalmykov, MedChemComm, 2019, 10, 1641–1645 RSC.
- J. J. Wilson, M. Ferrier, V. Radchenko, J. R. Maassen, J. W. Engle, E. R. Batista, R. L. Martin, F. M. Nortier, M. E. Fassbender, K. D. John and E. R. Birnbaum, Nucl. Med. Biol., 2015, 42, 428–438 CrossRef CAS PubMed.
- D. Horváth, F. Travagin, N. Guidolin, F. Buonsanti, G. Tircsó, I. Tóth, F. Bruchertseifer, A. Morgenstern, J. Notni, G. B. Giovenzana and Z. Baranyai, Inorg. Chem. Front., 2021, 8, 3893–3904 RSC.
- F. Lucio-Martínez, D. Esteban-Gómez, L. Valencia, D. Horváth, D. Szücs, A. Fekete, D. Szikra, G. Tircsó and C. Platas-Iglesias, Chem. Commun., 2023, 59, 3443–3446 RSC.
- D. J. Fiszbein, V. Brown, N. A. Thiele, J. J. Woods, L. Wharton, S. N. MacMillan, V. Radchenko, C. F. Ramogida and J. J. Wilson, Inorg. Chem., 2021, 60, 9199–9211 CrossRef CAS PubMed.
- H. A. Song, C. S. Kang, K. E. Baidoo, D. E. Milenic, Y. Chen, A. Dai, M. W. Brechbiel and H.-S. Chong, Bioconjugate Chem., 2011, 22, 1128–1135 CrossRef CAS PubMed.
- A. Hu, V. Brown, S. N. MacMillan, V. Radchenko, H. Yang, L. Wharton, C. F. Ramogida and J. J. Wilson, Inorg. Chem., 2022, 61, 801–806 CrossRef CAS PubMed.
- L. Shimoni-Livny, J. P. Glusker and C. W. Bock, Inorg. Chem., 1998, 37, 1853–1867 CrossRef CAS.
- R. Pujales-Paradela, A. Rodríguez-Rodríguez, A. Gayoso-Padula, I. Brandariz, L. Valencia, D. Esteban-Gómez and C. Platas-Iglesias, Dalton Trans., 2018, 47, 13830–13842 RSC.
- R. Luckay, I. Cukrowski, J. Mashishi, J. H. Reibenspies, A. H. Bond, R. D. Rogers and R. D. Hancock, J. Chem. Soc., Dalton Trans., 1997, 901–908 RSC.
- A. K. Adcock, R. J. Batrice, J. A. Bertke and K. E. Knope, Eur. J. Inorg. Chem., 2017, 1435–1445 CrossRef CAS.
- R. D. Rogers, A. H. Bond, S. Aguinaga and A. Reyes, J. Am. Chem. Soc., 1992, 114, 2967–2977 CrossRef CAS.
- J. W. Nugent, H.-S. Lee, J. H. Reibenspies and R. D. Hancock, Polyhedron, 2015, 91, 120–127 CrossRef CAS.
- W. R. Mason, Inorg. Chem., 1999, 38, 2742–2745 CrossRef CAS.
- C. Liao, J. M. Kasper, A. J. Jenkins, P. Yang, E. R. Batista, M. J. Frisch and X. Li, JACS Au, 2023, 3, 358–367 CrossRef CAS PubMed.
- J. Näslund, I. Persson and M. Sandström, Inorg. Chem., 2000, 39, 4012–4021 CrossRef PubMed.
- K. Kumar, M. Magerstadt and O. A. Gansow, J. Chem. Soc., Chem. Commun., 1989, 145–146 RSC.
- C. S. Kang, H. A. Song, D. E. Milenic, K. E. Baidoo, M. W. Brechbiel and H.-S. Chong, Nucl. Med. Biol., 2013, 40, 600–605 CrossRef CAS PubMed.
- H.-S. Chong, X. Ma, T. Le, B. Kwamena, D. E. Milenic, E. D. Brady, H. A. Song and M. W. Brechbiel, J. Med. Chem., 2008, 51, 118–125 CrossRef CAS PubMed.
- G. Boulon, J. Phys., 1971, 32, 333–347 CrossRef CAS.
- F. Réal, V. Vallet, J.-P. Flament and J. Schamps, J. Chem. Phys., 2006, 125, 174709 CrossRef PubMed.
- K. Oldenburg and A. Vogler, Z. fur Naturforsch. – B, 1993, 48, 1519–1523 CrossRef CAS.
- H. Nikol and A. Vogler, J. Am. Chem. Soc., 1991, 113, 8988–8990 CrossRef CAS.
- B. E. Etschmann, W. Liu, A. Pring, P. V. Grundler, B. Tooth, S. Borg, D. Testemale, D. Brewe and J. Brugger, Chem. Geol., 2016, 425, 37–51 CrossRef CAS.
- L. Newman and D. N. Hume, J. Am. Chem. Soc., 1957, 79, 4576–4581 CrossRef CAS.
- A. Stoïanov, J. Champion and R. Maurice, Inorg. Chem., 2019, 58, 7036–7043 CrossRef PubMed.
- N. Zhutova, F. Réal, E. Renault, V. Vallet and R. Maurice, Phys. Chem. Chem. Phys., 2023, 25, 24603–24612 RSC.
- P.-O. Löwdin, J. Chem. Phys., 1950, 18, 365–375 CrossRef.
- L. Freitag, S. Knecht, S. F. Keller, M. G. Delcey, F. Aquilante, T. B. Pedersen, R. Lindh, M. Reiher and L. González, Phys. Chem. Chem. Phys., 2015, 17, 14383–14392 RSC.
- S. K. Singh, M. Atanasov and F. Neese, J. Chem. Theory Comput., 2018, 14, 4662–4677 CrossRef CAS PubMed.
- K. Andersson and B. O. Roos, Chem. Phys. Lett., 1992, 191, 507–514 CrossRef CAS.
- S. Ahrland and I. Grenthe, Acta Chem. Scand., 1957, 11, 1111–1130 CrossRef CAS.
- E. J. Corey and J. C. Bailar, J. Am. Chem. Soc., 1959, 81, 2620–2629 CrossRef CAS.
- J. K. Beattie, Acc. Chem. Res., 1971, 4, 253–259 CrossRef CAS.
- C. J. Broan, J. P. L. Cox, A. S. Craig, R. Kataky, D. Parker, A. Harrison, A. M. Randall and G. Ferguson, J. Chem. Soc., Perkin Trans. 2, 1991, 87–99 RSC.
- P. R. W. J. Davey, C. M. Forsyth and B. M. Paterson, ChemistrySelect, 2022, 7, e202103698 CrossRef CAS.
- L. P. Battaglia, A. B. Corradi, G. Pelizzi and M. E. Vidoni, J. Chem. Soc., Dalton Trans., 1977, 1141–1144 RSC.
- M. Li and R. K. Li, CrystEngComm, 2013, 15, 4176 RSC.
- A. García-Fernández, I. Marcos-Cives, C. Platas-Iglesias, S. Castro-García, D. Vázquez-García, A. Fernández and M. Sánchez-Andújar, Inorg. Chem., 2018, 57, 7655–7664 CrossRef PubMed.
- C. J. Carmalt, L. J. Farrugia and N. C. Norman, Z. Anorg. Allg. Chem., 1995, 621, 47–56 CrossRef CAS.
- U. Geiser, H. H. Wang, S. M. Budz, M. J. Lowry, J. M. Williams, J. Ren and M. H. Whangbo, Inorg. Chem., 1990, 29, 1611–1614 CrossRef CAS.
- D. Esteban-Gómez, C. Platas-Iglesias, T. Enríquez-Pérez, F. Avecilla, A. De Blas and T. Rodríguez-Blas, Inorg. Chem., 2006, 45, 5407–5416 CrossRef PubMed.
- A. Ingham, L. Wharton, T. El Sayed, L. Southcott, B. L. McNeil, M. B. Ezhova, B. O. Patrick, M. D. G. Jaraquemada-Peláez and C. Orvig, Inorg. Chem., 2022, 61, 9119–9137 CrossRef CAS PubMed.
- L. M. P. Lima, M. Beyler, R. Delgado, C. Platas-Iglesias and R. Tripier, Inorg. Chem., 2015, 54, 7045–7057 CrossRef CAS PubMed.
- P. Gans, A. Sabatini and A. Vacca, Talanta, 1996, 43, 1739–1753 CrossRef CAS PubMed.
- M. J. Frisch, G. W. Trucks, H. B. Schlegel, G. E. Scuseria, M. A. Robb, J. R. Cheeseman, G. Scalmani, V. Barone, G. A. Petersson, H. Nakatsuji, X. Li, M. Caricato, A. V. Marenich, J. Bloino, B. G. Janesko, R. Gomperts, B. Mennucci, H. P. Hratchian, J. V. Ortiz, A. F. Izmaylov, J. L. Sonnenberg, W. F. Ding, F. Lipparini, F. Egidi, J. Goings, B. Peng, A. Petrone, T. Henderson, D. Ranasinghe, V. G. Zakrzewski, J. Gao, N. Rega, G. Zheng, W. Liang, M. Hada, M. Ehara, K. Toyota, R. Fukuda, J. Hasegawa, M. Ishida, T. Nakajima, Y. Honda, O. Kitao, H. Nakai, T. Vreven, K. Throssell, J. A. Montgomery Jr., J. E. Peralta, F. Ogliaro, M. J. Bearpark, J. J. Heyd, E. N. Brothers, K. N. Kudin, V. N. Staroverov, T. A. Keith, R. Kobayashi, J. Normand, K. Raghavachari, A. P. Rendell, J. C. Burant, S. S. Iyengar, J. Tomasi, M. Cossi, J. M. Millam, M. Klene, C. Adamo, R. Cammi, J. W. Ochterski, R. L. Martin, K. Morokuma, O. Farkas, J. B. Foresman and D. J. Fox, Gaussian 16 Rev. C.01, 2016 Search PubMed.
- J.-D. Chai and M. Head-Gordon, J. Chem. Phys., 2008, 128, 084106 CrossRef PubMed.
- B. Metz, H. Stoll and M. Dolg, J. Chem. Phys., 2000, 113, 2563–2569 CrossRef CAS.
- K. A. Peterson, J. Chem. Phys., 2003, 119, 11099–11112 CrossRef CAS.
- K. A. Peterson, B. C. Shepler, D. Figgen and H. Stoll, J. Phys. Chem. A, 2006, 110, 13877–13883 CrossRef CAS PubMed.
- F. Weigend and R. Ahlrichs, Phys. Chem. Chem. Phys., 2005, 7, 3297–3305 RSC.
- J. Tomasi, B. Mennucci and E. Cancès, J. Mol. Struct.: THEOCHEM, 1999, 464, 211–226 CrossRef CAS.
- J. Tomasi, B. Mennucci and R. Cammi, Chem. Rev., 2005, 105, 2999–3094 CrossRef CAS PubMed.
- E. D. Glendening, A. E. Reed, J. E. Carpenter and F. Weinhold, NBO (version 3.1), Gaussian Inc., Pittsburgh, 2003 Search PubMed.
- P.-Å. Malmqvist and B. O. Roos, Chem. Phys. Lett., 1989, 155, 189–194 CrossRef CAS.
- F. Neese, Wiley Interdiscip. Rev.: Comput. Mol. Sci., 2012, 2, 73–78 CAS.
- F. Neese, Wiley Interdiscip. Rev.: Comput. Mol. Sci., 2018, 8, e1327 Search PubMed.
- M. Reiher, Theor. Chem. Acc., 2006, 116, 241–252 Search PubMed.
- M. Barysz and A. J. Sadlej, J. Mol. Struct.: THEOCHEM, 2001, 573, 181–200 CrossRef CAS.
- L. Visscher and K. G. Dyall, At. Data Nucl. Data Tables, 1997, 67, 207–224 CrossRef CAS.
- C. Angeli, R. Cimiraglia, S. Evangelisti, T. Leininger and J.-P. Malrieu, J. Chem. Phys., 2001, 114, 10252–10264 CrossRef CAS.
- C. Angeli, R. Cimiraglia and J.-P. Malrieu, Chem. Phys. Lett., 2001, 350, 297–305 CrossRef CAS.
- C. Angeli, R. Cimiraglia and J.-P. Malrieu, J. Chem. Phys., 2002, 117, 9138–9153 CrossRef CAS.
- C. Angeli, S. Borini, M. Cestari and R. Cimiraglia, J. Chem. Phys., 2004, 121, 4043–4049 CrossRef CAS PubMed.
- L. Lang, K. Sivalingam and F. Neese, J. Chem. Phys., 2020, 152, 014109 CrossRef CAS PubMed.
- D. A. Pantazis and F. Neese, Theor. Chem. Acc., 2012, 131, 1292 Search PubMed.
- F. Neese, J. Comput. Chem., 2003, 24, 1740–1747 CrossRef CAS PubMed.
- R. Izsák and F. Neese, J. Chem. Phys., 2011, 135, 144105 CrossRef PubMed.
- G. L. Stoychev, A. A. Auer and F. Neese, J. Chem. Theory Comput., 2017, 13, 554–562 CrossRef CAS PubMed.
- D. Maganas, S. Sottini, P. Kyritsis, E. J. J. Groenen and F. Neese, Inorg. Chem., 2011, 50, 8741–8754 CrossRef CAS PubMed.
- M. Atanasov, D. Aravena, E. Suturina, E. Bill, D. Maganas and F. Neese, Coord. Chem. Rev., 2015, 289–290, 177–214 CrossRef CAS.
- A. V. Marenich, C. J. Cramer and D. G. Truhlar, J. Phys. Chem. B, 2009, 113, 6378–6396 CrossRef CAS PubMed.
- J. P. Perdew, K. Burke and M. Ernzerhof, Phys. Rev. Lett., 1996, 77, 3865–3868 CrossRef CAS PubMed.
- C. Adamo and V. Barone, J. Chem. Phys., 1999, 110, 6158–6170 CrossRef CAS.
- J. Tao, J. P. Perdew, V. N. Staroverov and G. E. Scuseria, Phys. Rev. Lett., 2003, 91, 146401 CrossRef PubMed.
- F. Neese, J. Chem. Phys., 2005, 122, 034107 CrossRef PubMed.
- B. A. Heß, C. M. Marian, U. Wahlgren and O. Gropen, Chem. Phys. Lett., 1996, 251, 365–371 CrossRef.
Footnote |
| † Electronic supplementary information (ESI) available: Spectroscopic characterization of the ligands and their precursors, spectrophotometric experiments and structural details of the geometries obtained with DFT. See DOI: https://doi.org/10.1039/d3dt03744d |
| This journal is © The Royal Society of Chemistry 2024 |