
 Open Access Article
 This Open Access Article is licensed under a Creative Commons Attribution-Non Commercial 3.0 Unported Licence
Pyrene fluorescence in 2,7-di(4-phenylethynyl)pyrene-bridged bis(alkenylruthenium) complexes†
Franciska S.
Gogesch
a,
Lea
Bauer
a,
Florian D.
Vollstädt
a,
Michael
Linseis
a,
Laura
Senft
b,
Ivana
Ivanović-Burmazović
b and
Rainer F.
Winter
 *a
*a
aFachbereich Chemie, Universität Konstanz, Universitätsstraße 10, 78457 Konstanz, Germany. E-mail: rainer.winter@uni-konstanz.de
bFachbereich Chemie, Ludwig-Maximilian-Universität München, Butenandtstraße 5-13, Haus D, 81377 München, Germany
First published on 27th November 2023
Abstract
Complexes PyrDPE-RuCl and PyrDPE-Ruacac with a π-extended 2,7-di(4-phenylethynyl)pyrene linker undergo simultaneous one-electron oxidations of their {Ru}-styryl entities. The absence of an intervalence charge-transfer (IVCT) band at intermediate stages, where the mixed-valent, singly oxidized radical cation is present, and spin density confinement to the terminal styryl ruthenium site(s) are tokens of a lack of electronic coupling between the {Ru} entities across the π-conjugated linker. The close similarity of the linker-based π → π* bands in the complexes and the free ligand and their insensitivity towards oxidations at the terminal sites indicate that the central pyrenyl fluorophore is electronically decoupled from the electron-rich {Ru}-styryl termini. As a consequence, the complexes offer stable pyrene-based fluorescence emissions at 77 K, which are red-shifted from that of the linker.
Introduction
Bis(alkenylarylene)-bridged diruthenium complexes of the type [{Ru}2(μ-CH![[double bond, length as m-dash]](https://www.rsc.org/images/entities/char_e001.gif) CH–arylene–CHCH)] ({Ru} = {(PR3)2Cl(CO)(L)Ru}, where L = PR3 or a vacant coordination site, or {Ru} = {(PR3)2(L2)(CO)Ru} with a bidentate monoanionic carboxylate or β-ketoenolate ligand L2) are widely studied with respect to bridge versus metal contributions to the individual redox processes,1,2–5 their polyelectrochromic properties,2,3,6–8 and the extent of charge and spin density delocalization in their one-electron oxidized, mixed-valent states.9–11 As a general trend, bridge contributions to the relevant molecular orbitals (MOs) increase as the π-conjugated linker gets longer. Instructive examples are given by the series arylene = 1,4-phenylene (1),2,12,13 4,4′-biphenylene (2),14,15 stilbene-4,4′-diyl (3),10 4,7-benzo[2,1,3]-thiadiazolediyl (4a), and bis(4-benzothiazol[2,1,3])-ethyne-7,7′-diyl (4b),11 as well as trans,trans-distyrylbenzenediyl (5a) or 1,4-bis(ethynylphenyl)benzenediyl (5b) (see Fig. 1 for structures).4,5,16 Several of the linkers employed in these studies are luminescent as the free or TMS-protected alkynes.17 However, emission from such complexes was only rarely observed.18 In particular, all complexes in Fig. 1 are non-emissive. According to common wisdom, the appended, electron-rich ruthenium end groups quench the emission from the π-conjugated linkers by energy or electron transfer, with the concomitant population of non-emissive excited d- or charge-transfer states.5,13 The turn-on of ligand-based luminescence on detaching the fluorophore from the metal ion was elegantly used to monitor the formation of catalytically competent species from dormant precatalysts.19
CH–arylene–CHCH)] ({Ru} = {(PR3)2Cl(CO)(L)Ru}, where L = PR3 or a vacant coordination site, or {Ru} = {(PR3)2(L2)(CO)Ru} with a bidentate monoanionic carboxylate or β-ketoenolate ligand L2) are widely studied with respect to bridge versus metal contributions to the individual redox processes,1,2–5 their polyelectrochromic properties,2,3,6–8 and the extent of charge and spin density delocalization in their one-electron oxidized, mixed-valent states.9–11 As a general trend, bridge contributions to the relevant molecular orbitals (MOs) increase as the π-conjugated linker gets longer. Instructive examples are given by the series arylene = 1,4-phenylene (1),2,12,13 4,4′-biphenylene (2),14,15 stilbene-4,4′-diyl (3),10 4,7-benzo[2,1,3]-thiadiazolediyl (4a), and bis(4-benzothiazol[2,1,3])-ethyne-7,7′-diyl (4b),11 as well as trans,trans-distyrylbenzenediyl (5a) or 1,4-bis(ethynylphenyl)benzenediyl (5b) (see Fig. 1 for structures).4,5,16 Several of the linkers employed in these studies are luminescent as the free or TMS-protected alkynes.17 However, emission from such complexes was only rarely observed.18 In particular, all complexes in Fig. 1 are non-emissive. According to common wisdom, the appended, electron-rich ruthenium end groups quench the emission from the π-conjugated linkers by energy or electron transfer, with the concomitant population of non-emissive excited d- or charge-transfer states.5,13 The turn-on of ligand-based luminescence on detaching the fluorophore from the metal ion was elegantly used to monitor the formation of catalytically competent species from dormant precatalysts.19
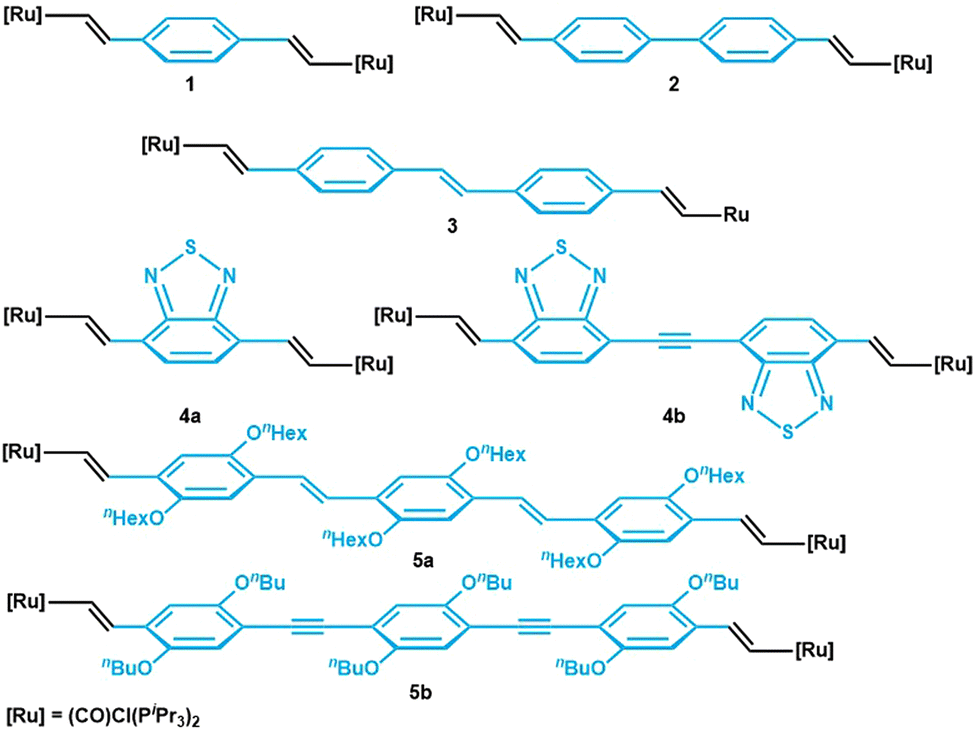 | ||
| Fig. 1 Series of previously reported ruthenium complexes with π-conjugated linkers of different length. | ||
In this study, we present the two diruthenium complexes PyrDPE-RuCl and PyrDPE-Ruacac with a π-extended 2,7-bis[((4-vinylphenyl)ethynyl)]pyrene bridging ligand. In these complexes, the large extension of the linker electronically decouples its pyrenylene core from the terminally appended styryl ruthenium redox sites. Electronic excitation into the π → π* bands of the linker provides stable, ligand-based fluorescence emission from the pristine complexes at 77 K.
Results and discussion
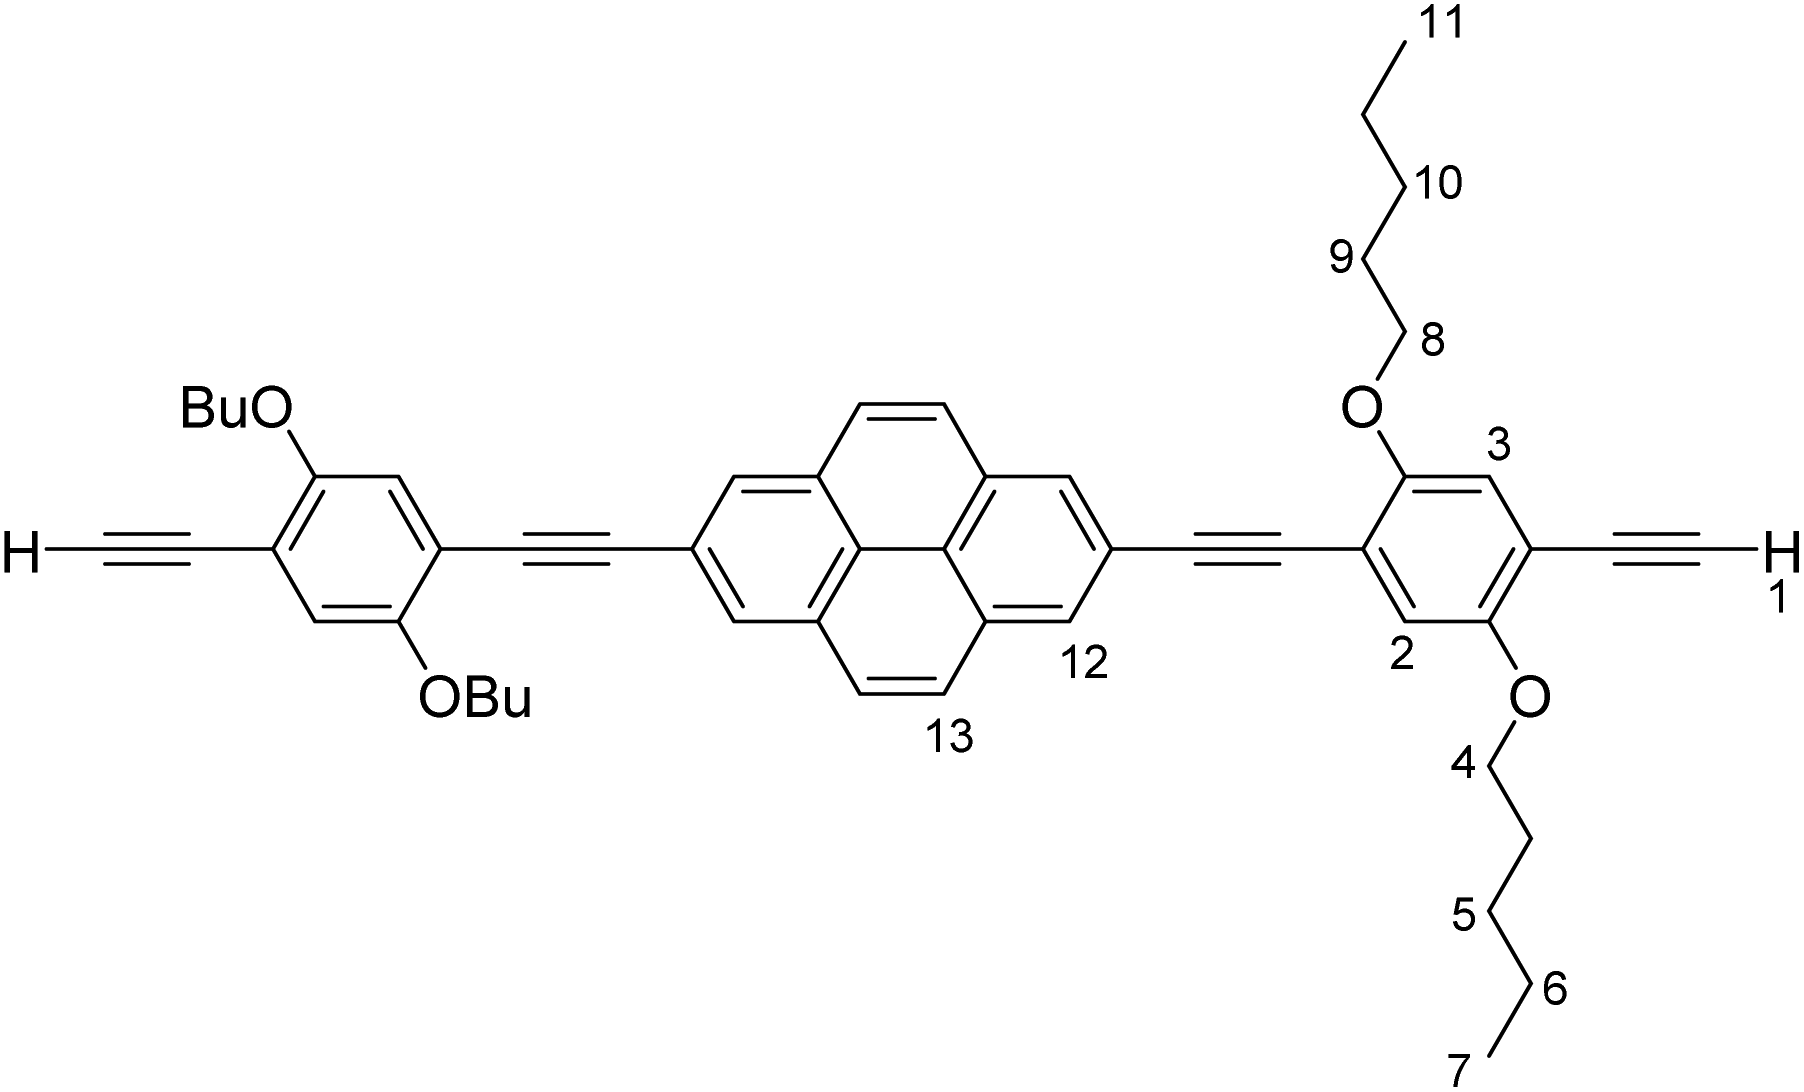
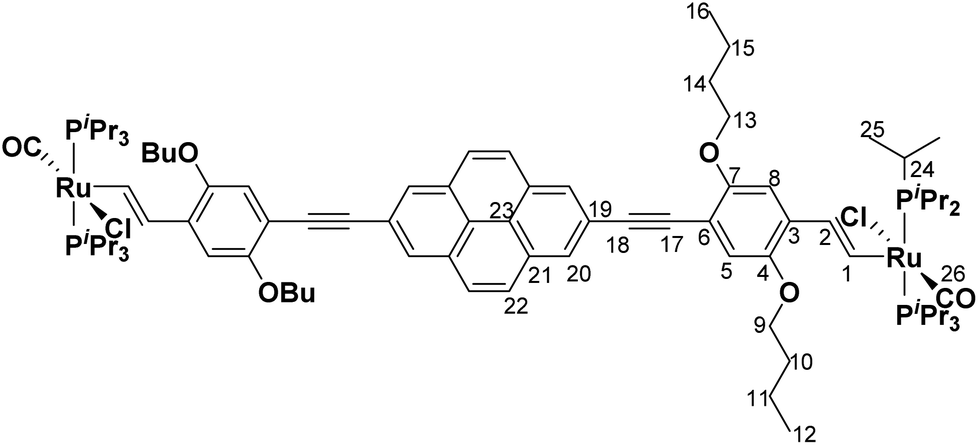
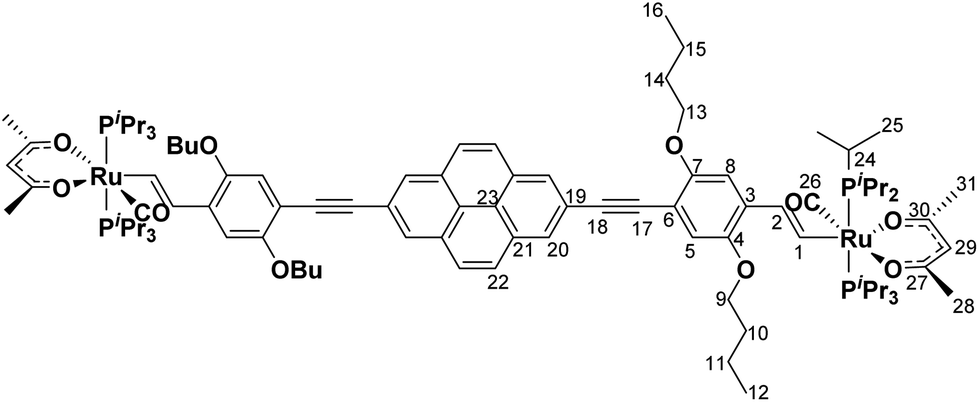
Scheme 1 summarizes the synthetic routes to complexes PyrDPE-RuCl and PyrDPE-Ruacac and their ligand precursors along with their chemical structures. The synthesis of the new dialkyne PyrDPETMS started from 2,7-diethynylpyrene, which was synthesized according to a published procedure.20,21 Coupling with two equivalents (equiv.) of the trimethylsilyl-protected monoalkynyl building block 2,5-dibutoxy-4-iodo-1-(trimethylsilylethynyl)benzene22 under Sonogashira conditions provided PyrDPETMS in a yield of 39%. Deprotection to the free dialkyne PyrDPEH and its treatment with two equiv. of [HRu(CO)Cl(PiPr3)2] resulted in the regio- and stereoselective insertion of the terminal ethynyl functionalities into the Ru–H bond of the hydride complex23 to afford PyrDPE-RuCl. The latter was isolated as a red solid in a yield of 47%. PyrDPE-Ruacac was obtained in 59% yield by substitution of the terminal chloro ligands with in situ generated acetylacetonate (Scheme 1).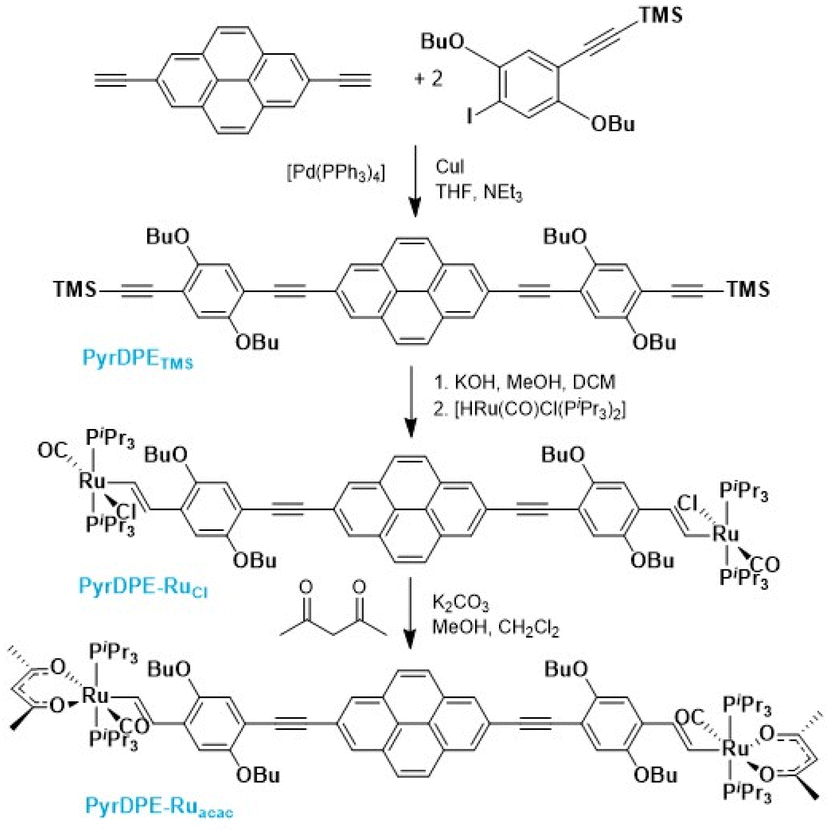 | ||
| Scheme 1 Synthesis and chemical structures of complexes PyrDPE-RuCl and PyrDPE-Ruacac and the ligand precursors. | ||
NMR spectroscopy and mass spectrometry (MS) characterization data are collected in the ESI.† The corresponding spectra are shown as Fig. S2–S12 of the ESI.† Characteristic spectroscopic features are the singlet resonance in their 31P{1H} NMR spectra with chemical shifts δ of 38.8 ppm for PyrDPE-RuCl and 35.6 ppm for PyrDPE-Ruacac, and the two sets of resonances at δ = 9.28 and 7.01 ppm, or δ = 9.54 and 7.47 ppm, for the α and β vinyl protons of PyrDPE-RuCl and PyrDPE-Ruacac (3JHH = 13.3 or 16.6 Hz), respectively. The resonances of the β vinyl protons are split into a triplet-of-doublet by JPH couplings of ca. 2 Hz to the phosphorus nuclei of the PiPr3 ligands. In 13C NMR spectra, the CO resonance of the carbonyl ligands is observed as a triplet at δ = 203.6 ppm for PyrDPE-RuCl, and at δ = 210.1 ppm for PyrDPE-Ruacac with 2JCP = 13.4 or 15.4 Hz.7 Appending the electron-rich ruthenium moieties causes a downfield shift of the closer alkynyl C atom by ca. 2.5 ppm, and downfield shifts of ca. 1.5 ppm for the other alkynyl C and the ipso pyrenyl C atoms, but has only minor effects on the other carbon atoms of the pyrenyl core.
Cyclic and square-wave voltammograms were recorded in the CH2Cl2/0.1 M nBu4N+ PF6− electrolyte in order to explore the redox properties of the two complexes and compare them to those of their protected dialkyne precursor PyrDPETMS. In their cyclic voltammograms, PyrDPE-RuCl and PyrDPE-Ruacac display two widely spaced redox-waves (Fig. 2 and Fig. S14 and S15 of the ESI†). The first wave constitutes a chemically and electrochemically reversible redox couple. The second process is chemically irreversible (or nearly so) at low sweep rates v, but attains at least partial chemical reversibility at higher v. This allowed us to determine the half-wave potentials E1/2 for both oxidations from the average potentials of the anodic forward and cathodic reverse peaks. Comparison shows that coordinative saturation of the {Ru} end-groups decreases the half-wave potential of the first redox couple by 196 mV, but has a smaller effect of 48 mV on the second oxidation (Table 1).
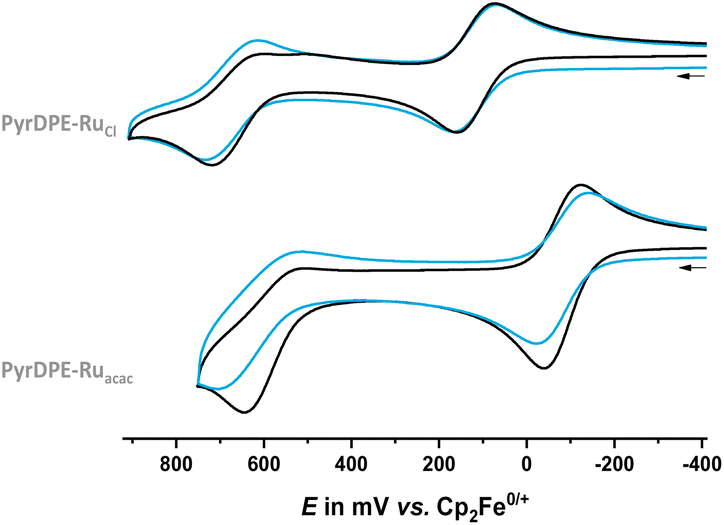 | ||
| Fig. 2 Cyclic voltammograms of PyrDPE-RuCl (top) and PyrDPE-Ruacac (bottom) in CH2Cl2/nBu4N+ PF6− (0.1 M) at T = 293 K at a scan rate v of 100 (black) and 1000 mV s−1 (blue). | ||
|
|
|
ΔE1/2 [mV] | |
|---|---|---|---|
| PyrDPETMS | 840 | n.a. | n.a. |
| PyrDPE-RuCl | 126 | 678 | 552 |
| PyrDPE-Ruacac | −70 | 630 | 700 |
Even the second wave is however found at less positive potential than the first oxidation of the TMS-protected ligand precursor PyrDPETMS, which shows only a single, partially reversible anodic wave at E1/2 = 840 mV (see Fig. S13 of the ESI†).
As will be detailed later, the first wave of complexes PyrDPE-RuCl and PyrDPE-Ruacac corresponds to a two-electron process which involves the electron-rich styryl ruthenium entities. The same also seems to apply to the second oxidation as inferred from the similar heights of the anodic forward peak and probably also to protected alkyne PyrDPETMS, where the outer, electron-rich phenyl rings constitute the most likely redox sites.24 Sizable shifts of oxidation waves to lower potentials and enhanced chemical stabilities of the electrogenerated oxidized forms as compared to the free ligands are common assets of mononuclear ruthenium styryl and arylene-bridged diruthenium complexes.2,6,10,25 The present complexes thus complement the series of 1,4-phenylene-,2 4,4′-biphenylene-,15 4,4′-stilbene-4,4′-diyl-10 and distyrylbenzenediyl- or 1,4-bis(ethynylphenyl)benzenediyl-bridged16 diruthenium complexes with the insertion of a 2,7-diethynylpyrene-diyl unit into the π-conjugated linker. Within this series, the half-wave potential splitting ΔE1/2 between the two consecutive oxidations of the alkenyl ruthenium entities decreases from 250 to 100 mV, and then 49 or 40 mV, until it completely vanishes in the present complexes.
In order to experimentally probe the hypothesis of alkenyl ruthenium-based oxidations and the two-electron nature of the first redox wave, we monitored the oxidation-induced changes in the UV/Vis/NIR and IR/NIR spectra by chemical oxidation and by spectroelectrochemistry (SEC), employing an optically transparent thin-layer electrolysis (OTTLE) cell.26 Redox titrations with simultaneous spectroscopic monitoring and comparison with the SEC results (Fig. S18, S19, S22 and S23 of the ESI†) showed that two equivalents of the chemical oxidant acetylferrocenium hexafluoroantimonate (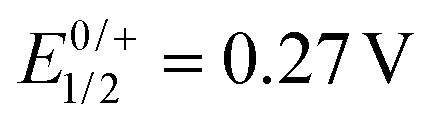 ) or 1,1′-diacetylferrocenium hexafluoroantimonate (
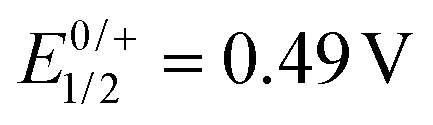 )27 are required in order to achieve full conversion of the neutral complexes to their oxidized forms generated after electrolysis at a potential past the first redox wave (see Fig. S16 and S17 of the ESI†). This proves the two-electron nature of the first and, by inference from the identical peak currents, also the second redox wave of the complexes.
Fig. 3 and 4 compare the mid-IR and UV/Vis/NIR spectra of the neutral and the dicationic complexes. Upon oxidation, the CO stretching vibration of the Ru-bonded carbonyl ligands blue-shifts by 44 (1915 → 1959 cm−1) or 54 cm−1 (1900 → 1954 cm−1). The magnitude of this shift is in the expected range for the full oxidation of a styryl {Ru} unit in a diruthenium divinylarylene complex, i.e. on the conversion of neutral divinylarylene-bridged diruthenium complexes to their dications.2,6,10,15,16,25 The sizable Ru(CO) band shift also confirms that the redox processes are biased towards the termini rather than the central pyrenyl part of the linker. The larger magnitude of the CO band shift in PyrDPE-Ruacac agrees with the notion, that metal contributions to the redox orbitals increase as the {Ru} termini are rendered more electron-rich.
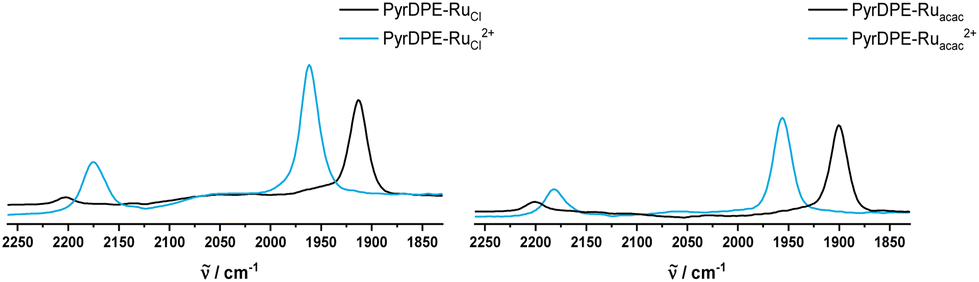 | ||
| Fig. 3 IR spectra of PyrDPE-RuCl and PyrDPE-RuCl2+ (left) and PyrDPE-Ruacac and PyrDPE-Ruacac2+ in CH2Cl2. The dications were generated by chemical oxidaion (see text). | ||
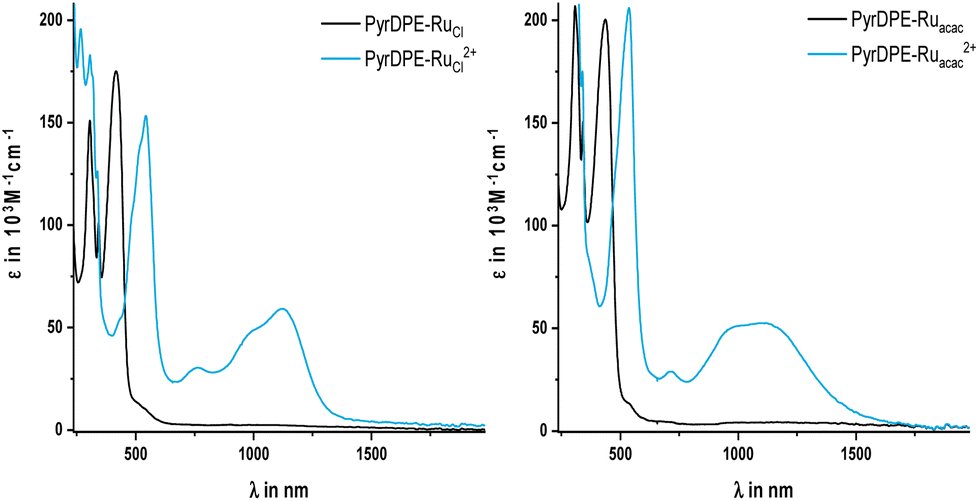 | ||
| Fig. 4 UV/Vis/NIR spectra of chemically oxidized PyrDPE-RuCl and PyrDPE-RuCl2+ (left) and PyrDPE-Ruacac and PyrDPE-Ruacac2+ (right), measured in CH2Cl2. | ||
During oxidation, the C![[triple bond, length as m-dash]](https://www.rsc.org/images/entities/char_e002.gif) C stretching vibration gains in intensity and red-shifts from 2202 to 2175 cm−1 for PyrDPE-RuCl, or to 2181 cm−1 for PyrDPE-Ruacac. The observed intensity increase is also in line with an enhanced polarity at the alkynyl linkages concomitant with the oxidation at the two termini.
C stretching vibration gains in intensity and red-shifts from 2202 to 2175 cm−1 for PyrDPE-RuCl, or to 2181 cm−1 for PyrDPE-Ruacac. The observed intensity increase is also in line with an enhanced polarity at the alkynyl linkages concomitant with the oxidation at the two termini.
Just like the ligand precursor PyrDPETMS, the neutral complexes feature three prominent π → π* absorption bands in their UV/Vis spectra. The latter are located at 416 or 435 nm (ε ca. 180![[thin space (1/6-em)]](https://www.rsc.org/images/entities/char_2009.gif) 000 M−1 cm−1), 340 nm (ε ca. 125000 to 175000 M−1 cm−1), and 305 nm (ε ca. 200000 M−1 cm−1). Attachment of the ruthenium termini does not affect the band pattern, but causes a distinct red-shift of the band at the lowest energy from 379 nm in PyrDPETMS to 416 or 435 nm in PyrDPE-RuCl or PyrDPE-Ruacac, whereas it has no such effect on other two. As the oxidation proceeds, the band at the lowest energy bleaches and is replaced by a new, further red-shifted feature of similar intensity (Fig. 4). In contrast, the UV bands experience only minor changes, apart from some intensity increase for PyrDPE-RuCl. Oxidation of the outer styryl ruthenium entities also causes the emergence of a vibrationally structured NIR band, which extends from 900 to 1600 nm, and of a weaker, separate feature at ca. 750 nm (see also Fig. S22 and S23 of the ESI†). During no stage of the SEC experiments we were able to detect any additional spectroscopic features that would be assignable to the intermittently formed, one-electron oxidized radical cation. The same also holds for the Ru(CO) bands in the IR, where spectra recorded at intermediate stages or after adding one equiv. of the chemical oxidant have profiles that match with those of mixtures of the neutral and dicationic forms of the complexes. Even when both termini oxidize at the same potential and when the comproportionation constant Kc (eqn (1)) assumes a value of 1, the mixed-valent radical cation must be the dominant species in solution near the electrode surface after passage of one equiv. of charge or after treatment of the neutral complexes with one equiv. of oxidant. The lack of any spectroscopic signatures specific of the radical cations thus characterizes PyrDPE-RuCl˙+ and PyrDPE-Ruacac˙+ as mixed-valent systems of Class I according to the scheme of Robin and Day28 with non-interacting, mutually insulated redox sites. The present complexes thus continue the series of bis(alkenylarylene)-bridged diruthenium complexes, where the extent of electronic coupling in the mixed-valent state is seen to taper off with increasing length of the π-conjugated linker, i.e. from intrinsic delocalization in 1,4-phenylene-bridged 1˙+,2 to partial charge localization in the 4,4′-biphenylene- and stilbenyl-4,4′-diyl-bridged complexes 2˙+ and 3˙+ and in 4a,b˙+,10,15 very weak delocalization in one-electron oxidized 5a˙+ and 5b˙+ (Fig. 1), and finally to charge localization in the present complexes.
000 M−1 cm−1), 340 nm (ε ca. 125000 to 175000 M−1 cm−1), and 305 nm (ε ca. 200000 M−1 cm−1). Attachment of the ruthenium termini does not affect the band pattern, but causes a distinct red-shift of the band at the lowest energy from 379 nm in PyrDPETMS to 416 or 435 nm in PyrDPE-RuCl or PyrDPE-Ruacac, whereas it has no such effect on other two. As the oxidation proceeds, the band at the lowest energy bleaches and is replaced by a new, further red-shifted feature of similar intensity (Fig. 4). In contrast, the UV bands experience only minor changes, apart from some intensity increase for PyrDPE-RuCl. Oxidation of the outer styryl ruthenium entities also causes the emergence of a vibrationally structured NIR band, which extends from 900 to 1600 nm, and of a weaker, separate feature at ca. 750 nm (see also Fig. S22 and S23 of the ESI†). During no stage of the SEC experiments we were able to detect any additional spectroscopic features that would be assignable to the intermittently formed, one-electron oxidized radical cation. The same also holds for the Ru(CO) bands in the IR, where spectra recorded at intermediate stages or after adding one equiv. of the chemical oxidant have profiles that match with those of mixtures of the neutral and dicationic forms of the complexes. Even when both termini oxidize at the same potential and when the comproportionation constant Kc (eqn (1)) assumes a value of 1, the mixed-valent radical cation must be the dominant species in solution near the electrode surface after passage of one equiv. of charge or after treatment of the neutral complexes with one equiv. of oxidant. The lack of any spectroscopic signatures specific of the radical cations thus characterizes PyrDPE-RuCl˙+ and PyrDPE-Ruacac˙+ as mixed-valent systems of Class I according to the scheme of Robin and Day28 with non-interacting, mutually insulated redox sites. The present complexes thus continue the series of bis(alkenylarylene)-bridged diruthenium complexes, where the extent of electronic coupling in the mixed-valent state is seen to taper off with increasing length of the π-conjugated linker, i.e. from intrinsic delocalization in 1,4-phenylene-bridged 1˙+,2 to partial charge localization in the 4,4′-biphenylene- and stilbenyl-4,4′-diyl-bridged complexes 2˙+ and 3˙+ and in 4a,b˙+,10,15 very weak delocalization in one-electron oxidized 5a˙+ and 5b˙+ (Fig. 1), and finally to charge localization in the present complexes.
 | (1) |
Confinement of the oxidation to the two termini and the lack of electronic coupling between them are also indicated by EPR spectroscopy. EPR spectra were recorded after adding 0.2 equiv. of ferrocenium hexafluorophosphate (PyrDPE-Ruacac) or acetylferrocenium hexafluoroantimonate (PyrDPE-RuCl), or 2.1 equiv. of acetylferrocenium hexafluoroantimonate as suitable oxidants to solutions of PyrDPE-RuCl or PyrDPE-Ruacac. Adding only 0.2 equiv. of the oxidant to the neutral complexes guarantees that the singly oxidized radical cations are the dominating EPR active species in solution. So generated samples of PyrDPE-RuCl˙+ provided an isotropic EPR signal at giso = 2.017 with detectable hyperfine splittings (hfs) to two 31P nuclei (9.1 G) and one 99/101Ru nucleus (7.5 G). Nearly identical spectra were obtained from samples of two-electron oxidized PyrDPE-RuCl2+ (Fig. 5). This confirms that the unpaired spin density is confined to the {Ru}–CHCH–phenyl sites and localized on only a single ruthenium styryl entity in PyrDPE-RuCl˙+. No resolved hfs can be discerned for samples of six-coordinated PyrDPE-Ruacac˙+/2+, which give an isotropic EPR signal at a slightly higher g value (see Fig. S24–S26 of the ESI† and Table 2), concomitant with larger Ru contributions to the SOMO. The intense EPR signals of the dications likewise agree with the notion of a lack of electronic coupling between the terminal redox sites, so that they act as independent spin centers.
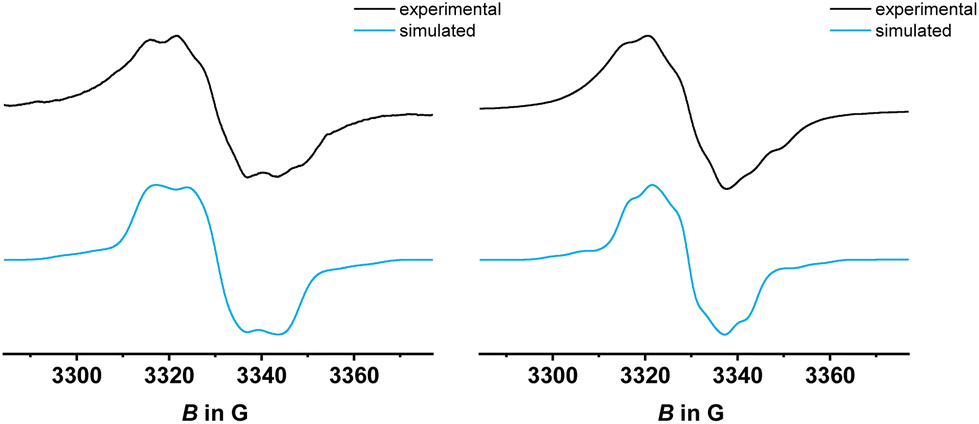 | ||
| Fig. 5 Comparison of experimental and simulated EPR spectra of chemically generated PyrDPE-RuCl˙+ (left) and PyrDPE-RuCl2+ (right), measured in CH2Cl2 at r.t. | ||
(TD)-DFT calculations on slightly truncated PMe3 models of complexes PyrDPE-RuCl and PyrDPE-Ruacac at the pbe1pbe/6-31G(d)PCM (ClCH2–CH2Cl) level of theory29 are fully consistent with our experimental findings. As can bee seen in Fig. 6, the occupied frontier MOs HOMO and HOMO−1 represent the in- and out-of-phase combinations of MOs that are constituted by the {Ru}-styryl entities and the alkynyl linkers. In the absence of electronic coupling, one would expect that the HOMO and HOMO−1 are degenerate. However, small admixtures of pyrene-based π MOs with different nodal properties and energies lift their degeneracy and cause a small energy difference of 0.14 or 0.13 eV between them. The LUMO and LUMO+1 in turn extend over the entire 4,9-di(4-phenylethynyl)pyrene linker or are confined to the pyrenediyl entity.
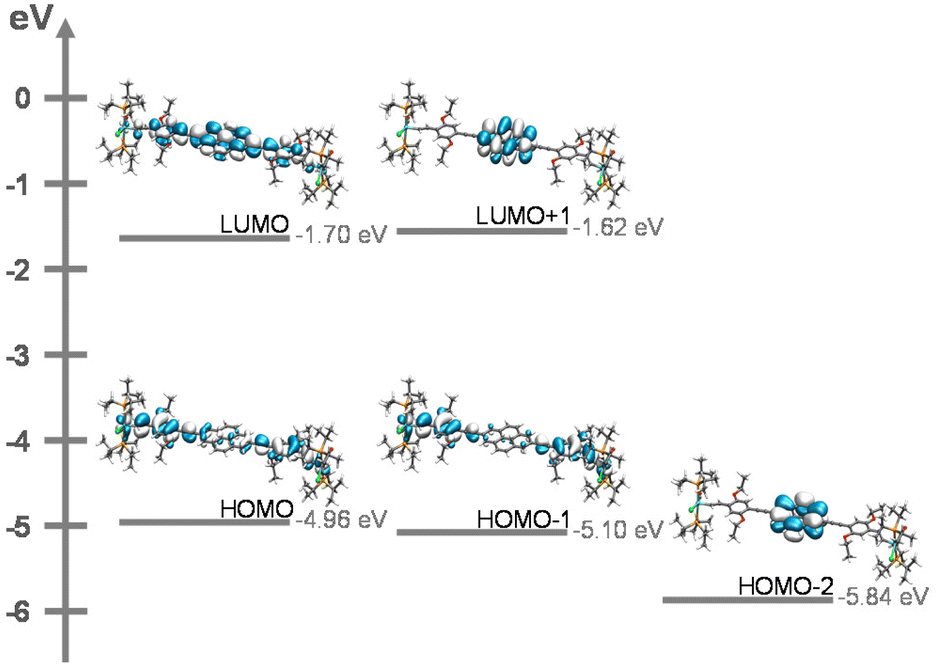 | ||
| Fig. 6 Contour diagrams of HOMO−2 to LUMO+1 of the PMe3 model of complex PyrDPE-RuCl. | ||
TD-DFT calculations provide further insight into the nature of the electronic excitations. Computed transitions, contour diagrams of the involved donor and acceptor orbitals, and the corresponding electron density difference maps (EDDMs) as well as comparisons between experimental and computed spectra of the neutral and dicationic forms of the complexes are shown as Fig. S34 to S44 of the ESI.† Exciting the neutral complexes into the HOMO → LUMO band transfers electron density from the periphery to the inner pyrenediyl segment of the linker. The latter excitation corresponds to the most red-shifted, intense Vis band at ca. 420 nm of the complexes. In contrast, the UV bands result from π → π* excitations between orbitals that extend over the entire linker or are confined to either the outer styryl ruthenium entities or the pyrenediyl unit and do not involve charge transfer. The lack of {Ru} contributions to the ligand π → π* excitations also explains why these bands show only minor shifts from PyrDPETMS and during twofold oxidation.
For the dicationic forms of the complexes, the closed-shell singlet (S), the open-shell singlet (OSS), and triplet (T) states need to be considered. Our calculations place the T state by 62.7 or 54.3 kJ mol−1 below the S state, and by 5.1 or 59.8 kJ mol−1 below the OSS state. As Fig. S36 and S41 of the ESI† show, computed spectra for the T and the OSS states of PyrDPE-RuCl2+ as well as the T state of PyrDPE-Ruacac2+ reproduce the experimentally observed UV/Vis/NIR spectroscopic features very well. The intense NIR band of the dicationic complexes is due to excitations between MOs that are confined to the {Ru} styryl entities and involve the transfer of electron density from the donor-substituted phenyl rings (PyrDPE-RuCl) or the acac coligands (PyrDPE-Ruacac) to the {Ru}–CHCH acceptor units (see Fig. S38, S39 and S43 of the ESI† for the contributing MOs and the EDDMs of the individual transitions). The prominent Vis band at ca. 500 nm likewise involves charge transfer from the ethynylphenylene linkers to the vinyl ruthenium tags.
Given these properties, we mused that electronically decoupling the linker, and particularly the central pyrene fluorophore, from MOs with metal contributions may attenuate the efficacy of reductive emission quenching of pyrene-centered excited states. This prompted us to also study the emissive properties of the two complexes and compare them to those of their dialkyne precursor PyrDPETMS. In a glassy methylcyclohexane matrix at 77 K, excitation into any of the π → π* absorption bands indeed triggers blue fluorescence emission from PyrDPE-RuCl and PyrDPE-Ruacac with a main peak at 460 or 475 nm (see Fig. 7 and Table 3) and an emission envelope that is highly reminiscent of that of pyrenes. While being red-shifted and less-well resolved, the complexeś emissions closely resemble that of PyrDPETMS (λmax,Fl = 427 nm, fluorescence quantum yield ΦFl = 0.17 at r.t.). We also note that the fluorescence lifetimes of the complexes of 45.3 or 45.1 ns, respectively, are smaller than that of 78.5 ns for PyrDPETMS at T = 77 K (similar trends pertain to additional, more short-lived contributors, see Table 3). Excitation spectra recorded at the fluorescence maxima of PyrDPE-RuCl and PyrDPE-Ruacac at T = 77 K match with the respective absorption spectra, but with enhanced resolution of the individual peaks. The resolved vibrational progression of ca. 430 cm−1 is likewise typical of pyrenes30 and resembles that in PyrDPETMS. The excitation spectra of PyrDPETMS and PyrDPE-Ruacac at 77 K display a red-shift of the 0 → 0 peak when compared to the absorption in fluid solution at r.t. We attribute this to lower degrees of conformational freedom and higher proportions of conformers with smaller torsions around the C–C linkages of the π-conjugated backbone at this temperature, which enhances π-conjugation. Such effects were already noted for (oligo)phenylenevinylenes.31
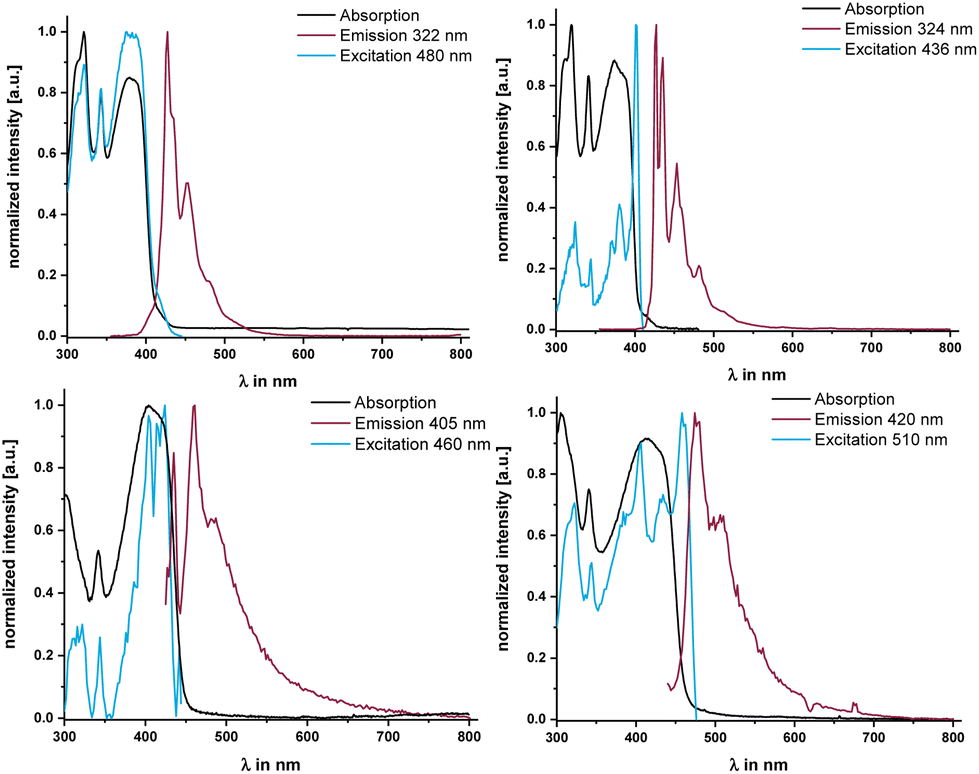 | ||
| Fig. 7 Emission spectra of PyrDPETMS in CH2Cl2 solution at r.t. (top left) and in methylcyclohexane solution at 77 K (top right), and of PyrDPE-RuCl (bottom left) and PyrDPE-Ruacac (bottom right) in methylcyclohexane solution at 77 K. | ||
PyrDPE-RuCl and PyrDPE-Ruacac however proved to be unstable towards irradiation at r.t. in fluid CH2Cl2 solution. Emission spectra recorded under these conditions showed sizable blue-shifts of the original peaks from their positions at 77 K, when luminescence spectra are recorded in CH2Cl2 at r.t. The r.t. emissions resemble that of PyrDPETMS measured under the same conditions closely (see Fig. S27 of the ESI†). Moreover, excitation spectra recorded at the emission maxima and UV/Vis spectra recorded after laser excitation at r.t. do no longer show the characteristic Vis absorption of the complexes at ca. 420 nm, but instead a blue-shifted band akin to that of PyrDPETMS. The same spectral changes are observed when a CH2Cl2 solution of PyrDPE-RuCl is irradiated with a LED lamp at a wavelength of 275 nm. The bleaching of the characteristic Vis absorption is accompanied by the loss of the original vinyl –CHCH– resonances in the 1H NMR spectrum of a photolyzed solution. Both these findings suggest that the ruthenium–alkenyl bonds are cleaved upon r.t. irradiation. IR and NMR spectra recorded from the photolyzed solution suggest that a complex of the type [Ru(CO)2(PiPr3)2(Cl)(X)] with trans-coordinated PiPr3 ligands and mutually cis-disposed ligands Cl and X is formed, where X is neither the original alkenyl ligand nor H (for further details see Fig. S30–S33 and the accompanying explanations in the ESI†).
In conclusion, we have shown that fluorophores embedded in a π-extended bridging ligand can retain their emissive properties, once they are electronically decoupled from electron-rich metal end groups that normally act as quenchers. This adds luminescence spectroscopy to the toolbox available for probing electron (de)localization over π-extended ligands in such complexes.
Materials and methods
Methods
All syntheses were performed with standard Schlenk techniques under an atmosphere of purified nitrogen with dry, distilled, and degassed solvents. Commercially available starting materials were used as received. 4,9-Diethynylpyrene20,21 and 2,5-dibutoxy-4-iodo-1-(trimethylsilylethynyl)benzene22 were prepared according to published literature procedures.For NMR experiments, 1H NMR (400 MHz), 13C NMR (101 MHz), and 31P NMR (162 MHz) spectra were measured on a Bruker Avance III 400 spectrometer, 1H NMR (600 MHz) and 13C NMR (151 MHz) spectra on a Bruker Avance III 600 spectrometer, and 1H NMR (800 MHz), 13C NMR (202 MHz), and 31P NMR (324 MHz) on a Bruker Avance Neo 800 instrument. NMR data are given as follows: chemical shift (δ in ppm), multiplicity (s, singlet; d, doublet; t, triplet; td, triplet of doublets; vt, virtual triplet; vq, virtual quartet; vsext, virtual sextet; m, multiplet), integration, coupling constant (Hz). Unequivocal signal assignments were achieved by 2D NMR experiments. The numbering of the nuclei follows that of the chemical structures displayed with the synthesis protocols.
Mass spectra of organic compounds were recorded on a LTQ Orbitrap Velos instrument (Thermo Scientific) with ESI capable of a resolution of at least 60.000 FWHM in CH2Cl2 as a solvent. The spectrometer was calibrated with the Pierce LTQ Velos ESI Positive Calibration Solution (Thermo Fisher Scientific) prior to every measurement. Detection was done in the positive ion mode. The observed data were compared to simulated MS patterns. Mass spectra of organometallic compounds were recorded on an UHR-TOF Bruker Daltonik maXis plus ESI-quadrupole time-of-flight (qToF) spectrometer at a minimum resolution of 60000 FWHM. Detection was performed in positive ion mode with a source voltage of 3.5 kV and a flow rate of 180 μL h−1. Nitrogen was used as drying gas. For solvent removal, the temperature was set at 180 °C and the temperature of the spray gas was 20 °C. The calibration was done prior to each measurement by direct infusion of low concentrated Agilent ESi-TOF tuning mixture. This gave an m/z range of singly charged peaks of up to 2700 Da.
Cyclic voltammetry was performed under an atmosphere of argon. The voltammograms were recorded using a BASi Epsilon potentiostat and a custom-made air-tight cell as described elsewhere11 with a platinum electrode (∅ = 1.1 mm, BASi). The platinum electrode was polished before each measurement with diamond pastes (particle sizes 1 μm and 0.25 μm) from Buehler & Wirtz. Spiral-shaped AgCl Pt wires were used as the reference and counter electrode. 0.1 M nBu4N+ PF6− in CH2Cl2 was used as the supporting electrolyte. The redox potentials were calibrated against the Cp2Fe/Cp2Fe+ redox couple, which was set as 0 mV.
Spectroeletrochemical measurements were conducted in a custom-made OTTLE cell following the design of Hartl et al.26 It comprises of Pt-mesh working and counter electrodes and a thin silver wire as a pseudoreference electrode. The electrodes are sandwiched in between two CaF2 windows of a conventional liquid IR cell. The working electrode was positioned in the center of the spectrometer beam. The required potential was applied by connecting the cell leads to a Wenking POS2 potentiostat by Bank Elektronik-Intelligent Controls GmbH. As supporting electrolyte, a 0.2 M solution of nBu4N+ PF6− in 1,2-C2H4Cl2 was used. FT-IR spectra were recorded using a Bruker Tensor II FT-IR spectrometer. UV/Vis/NIR spectra were acquired on a TIDAS fiber optic diode-array spectrophotometer (combined MCS UV/NIR and PGS NIR instrumentation) from j&m Analytik AG.
Electron paramagnetic resonance (EPR) studies were conducted on a X-band tabletop spectrometer MiniScope MS 400 by Magnettech GmbH. The complexes were chemically oxidized using ferrocenium hexafluorophosphate (Cp2Fe+ PF6−) or acetylferrocenium hexafluoroantimonate (AcCp2Fe+ SbF6−). Simulation of experimental spectra was performed using the Matlab Easyspin program ‘Garlic’.32
Luminescence spectra and lifetimes as well as quantum yields were measured on a PicoQuant FluoTime 300 spectrometer. The decay lifetimes were adjusted with the FluoFit software. Absolute quantum yields were determined with an integrating sphere within the FluoTime 300 spectrometer.
Computational details
The ground state electronic structures of the full models of all compounds were calculated by density functional theory (DFT) methods using the Gaussian 16 program packages.29 Open shell systems were calculated by the unrestricted Kohn–Sham approach (UKS). Geometry optimization followed by vibrational analysis was performed in solvent media. Solvent effects were described by the polarizable continuum model (PCM) with standard parameters for 1,2-dichloroethane.33,34 The 6-31G(d) polarized double-ζ basis sets35 were employed for all atoms together with the Perdew, Burke, Ernzerhof exchange and correlation functional (pbe0pbe).36,37 The GaussSum program package was used to analyze the results,38 while the visualization of the results was performed with the Avogadro program package.39 Graphical representations of molecular orbitals were generated with the help of GNU Parallel40 and plotted using the vmd program package41 in combination with POV-Ray. Atomic coordinates of the calculated structures are provided in Tables S2–S11 of the ESI.†PyrDPETMS
2,7-Diethynylpyrene20 (116 mg, 0.46 mmol, 1.00 equiv.), 2,5-dibutoxy-4-iodo-1-(trimethylsilylethynyl)benzene22 (432 mg, 0.97 mmol, 2.1 equiv.), Pd(PPh3)4 (57 mg, 0.05 mmol, 0.05 equiv.) and CuI (4 mg, 0.02 mmol, 0.05 equiv.) were suspended in THF (12 mL) and NEt3 (3 mL). The resulting mixture was warmed to 60 °C for 12 h. Water was then added and the solution was extracted with CH2Cl2. The combined organic phases were dried over MgSO4. The crude product was washed with n-hexane to obtain PyrDPETMS (161 mg, 0.18 mmol) as a yellow solid in 39% yield. 1H-NMR (CDCl3, 600 MHz) δ [ppm] = 8.31 (s, 4H, H21), 8.03 (s, 4H, H23), 7.08 (s, 2H, H6), 7.00 (s, 2H, H9), 4.08 (t, 3JHH = 6.4 Hz, 4H, H14), 4.04 (t, 3JHH = 6.4 Hz, 4H, H10), 1.93–1.88 (m, 4H, H15), 1.85–1.80 (m, 4H, H11), 1.69–1.62 (m, 4H, H16), 1.61–1.55 (m, 4H, H12), 1.07 (t, 3JHH = 7.3 Hz, 6H, H17), 1.01 (t, 3JHH = 7.4 Hz, 6H, H13), 0.28 (s, 18H, H1). 13C{1H}-NMR (CDCl3, 151 MHz) δ [ppm] = 154.4 (s, C5), 153.8 (s, C8), 131.3 (s, C22), 128.8 (s, C21), 127.8 (s, C23), 124.1 (s, C24), 121.5 (s, C20), 117.4 (s, C9), 117.2 (s, C6), 114.3 (s, C7), 114.1 (s, C4), 101.2 (s, C3), 100.4 (s, C2), 95.3 (s, C19), 87.0 (s, C18), 69.5 (s, C10/C14), 69.4 (s, C10/14), 31.6 (s, C11/C15), 31.5 (s, C11/C15), 19.5 (s, C12/C16), 19.4 (s, C12/C16), 14.2 (s. C13/C17), 14.1 (s, C13/C17), 0.1 (s, C1).
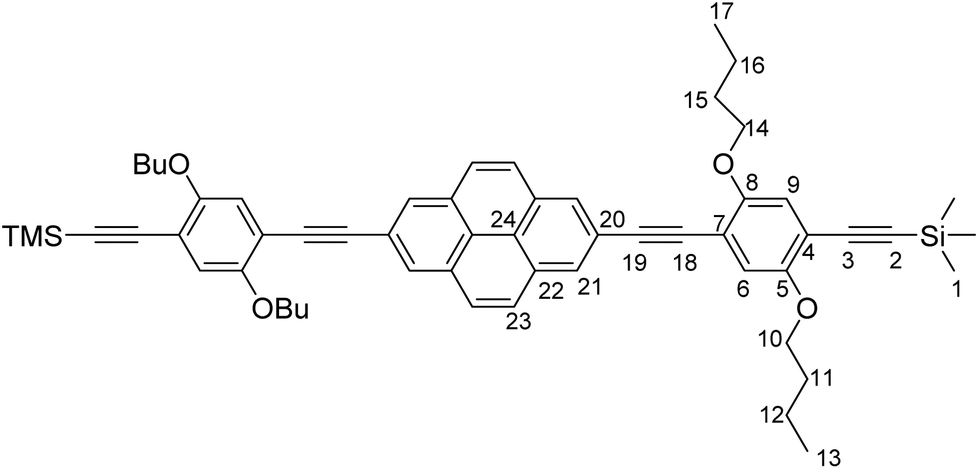
PyrDPEH
PyrDPETMS (104 mg, 0.12 mmol, 1.0 eq.) was dissolved in CH2Cl2 (10 mL) and MeOH (5 mL). A few drops of water and KOH (5 mg) were added and the resulting solution was stirred for 12 h at room temperature. More water was added and the solution was extracted with CH2Cl2. The combined organic phases were dried over MgSO4 and the solvent was removed under reduced pressure to give PyrDPEH in quantitative yield (90 mg, 0.12 mmol). PyrDPEH was used in the next step without further purification. 1H-NMR (CDCl3, 400 MHz) δ [ppm] = 8.32 (s, 2H, H12), 8.04 (s, 2H, H13), 7.11 (s, 2H, H2), 7.04 (s, 2H, H3), 4.11–4.04 (m, 8H, H8/H4), 3.37 (s, 2H, H1), 1.95–1.87 (m, 4H, H9), 1.87–1.81 (m, 4H, H5), 1.81–1.75 (m, 4H, H10), 1.70–1.61 (m, 4H, H6), 1.09–1.04 (m, 6H, H11), 1.04–0.98 (m, 6H, H7).
PyrDPE-RuCl
PyrDPEH (87 mg, 0.12 mmol, 1.0 equiv.) was dissolved in CH2Cl2 (10 mL) and added dropwise to a solution of [HRu(CO)Cl(PiPr3)2] (115 mg, 0.24 mmol, 2.0 equiv.) in CH2Cl2 (10 mL). The reaction mixture was stirred for 12 h at room temperature. The solvent was removed under reduced pressure and the red solid was washed with MeOH (3 × 10 mL) and with n-hexane (3 × 10 mL). PyrDPE-RuCl was obtained as a red solid in 47% yield (97 mg, 0.06 mmol). 1H-NMR (C6D6, 600 MHz) δ [ppm] = 9.28 (d, 2H, 3JHH = 13.3 Hz, H1), 8.33 (s, 4H, H20), 7.61 (s, 4H, H22), 7.29 (s, 2H, H5), 7.27 (s, 2H, H8), 7.01 (td, 2H, 3JHH = 13.3 Hz, 4JHP = 2.1 Hz, H2), 4.10 (t, 4H, 3JHH = 6.5 Hz, H13), 3.72 (t, 4H, 3JHH = 6.4 Hz, H9), 2.73–2.63 (m, 12H, H24), 1.84–1.78 (m, 4H, H14), 1.73–1.67 (m, 4H, H10), 1.62 (vsext, 4H, H15), 1.53 (vsext, 4H, H11), 1.25 (vq, 72H, H25), 0.98 (vq, 12H, H12/16). 13C{1H}-NMR (C6D6, 151 MHz) δ [ppm] = 203.6 (t, 2JCP = 13.4 Hz, C26), 155.6 (s, C7), 155.1 (t, 2JCP = 10.8 Hz, C1), 147.9 (s, C4), 131.7 (s, C21), 130.2 (s, C3), 128.9 (s, C2), 128.1 (s, C20), 128.0 (s, C22), 124.3 (s, C23), 122.8 (s, C19), 117.6 (s, C5), 110.2 (s, C8), 109.5 (s, C6), 94.2 (s, C18), 89.3 (s, C17), 69.3 (s, C13), 68.7 (s, C9), 32.0 (s, C10/C14), 31.9 (s, C10/C14), 24.8 (vt, 1JCP = 9.9 Hz, C24), 20.1 (s, C25), 19.9 (s, C25), 19.8 (s, C11/C15), 19.7 (s, C11/C15), 14.3 (s, C12/C16), 14.2 (s, C12/C16). 31P{1H}-NMR (C6D6, 162 MHz) δ [ppm] = 38.8 (s). ESI MS (CH2Cl2): 1710.6746 m/z ([M]2+, calculated 1710.6750 m/z). Anal. cacld for C90H136Cl2O6P4Ru2: C, 63.18%; H, 8.01%; found: C, 61.69%, H, 8.28%.
PyrDPE-Ruacac
Acetylacetone (44 mg, 0.45 mL, 0.44 mmol, 15.00 equiv.) and K2CO3 in MeOH (15 mL) were warmed for 1 h at 40 °C. The resulting solution was added dropwise to a solution of PyrDPE-RuCl (50 mg, 0.03 mmol, 1.0 equiv.) in CH2Cl2 and the resulting mixture was stirred for 1 h at room temperature. The solution was concentrated under reduced pressure and the residue was collected via centrifugation. The residue was dissolved in CH2Cl2 and insoluble salts were removed by centrifugation. The solvent was removed under reduced pressure and the obtained solid was washed with MeOH (3 × 10 mL). PyrDPE-Ruacac was obtained as a yellow solid in 59% yield (31 mg, 0.01 mmol). 1H-NMR (C6D6, 600 MHz) δ [ppm] = 9.54 (d, 2H, 3JHH = 16.6 Hz, H1), 8.32 (s, 4H, H20), 7.61 (s, 4H, H22), 7.51 (s, 2H, H8), 7.47 (td, 2H, 3JHH = 16.6 Hz, 4JHP = 1.7 Hz, H2), 7.36 (s, 2H, H5), 5.32 (s, 2H, H29), 4.21 (t, 4H, 3JHH = 6.5 Hz, H13), 3.81 (t, 4H, 3JHH = 6.4 Hz, H9), 2.43–2.34 (m, 12H, H24), 1.90 (s, 6H, H29/H31), 1.86–1.80 (m, 4H, H14), 1.79–1.75 (m, 4H, H10), 1.76 (s, 6H, H29/H31), 1.65–1.55 (m, 8H, H11/H15), 1.35 (vq, 36H, H25), 1.25 (vq, 36H, H25), 0.99 (t, 3JHH = 7.4 Hz, 12H, H12/H16). 13C{1H}-NMR (C6D6, 151 MHz) δ [ppm] = 210.0 (t, 2JCP = 15.4 Hz, C26), 188.7 (s, C27/C30), 186.8 (s, C27/C30), 169.3 (t, 2JCP = 11.9 Hz, C1), 155.8 (s, C7), 148.3 (s, C4), 133.2 (s, C3), 131.7 (s, C21), 128.3 (s, C2), 128.1 (s, C20), 127.6 (s, C22), 124.2 (s, C23), 123.0 (s, C19), 118.0 (s, C5), 110.0 (s, C8), 108.6 (s, C6), 100.4 (s, C29), 93.9 (s, C18), 89.8 (s, C17), 69.9 (s, C13), 68.9 (s, C9), 32.2 (s, C10/C14), 32.1 (s, C10/C14), 28.7 (s, C28/30), 28.6 (s, C28/C30), 24.7 (vt, 1JCP = 8.8 Hz, C24), 20.0 (s, C25), 19.9 (s, C11/C15), 19.8 (s, C11/C15), 19.7 (s, C25), 14.3 (s, C12/C16), 14.2 (s, C12/C16). 31P{1H}-NMR (C6D6, 162 MHz) δ [ppm] = 35.6 (s). ESI MS (CH2Cl2): 1838.8261 m/z ([M]+, calculated 1838.8294 m/z). Anal. cacld for C100H150O10P4Ru2: C, 65.34%; H, 8.22%; found: C, 64.85%, H, 8.37%.
Conflicts of interest
There are no conflicts to declare.Acknowledgements
The authors gratefully acknowledge support of this work by the Deutsche Forschungsgemeinschaft (DFG) through Grant Numbers Wi1262/17-1 and INST 40/575-1 FUGG (JUSTUS 2 cluster). We also thank Marcel Geppert and Katharina Deuter for their assistance with the photoluminescence measurements.References
-
(a) J. Maurer, R. F. Winter, B. Sarkar, J. Fiedler and S. Zális, Chem. Commun., 2004, 1900–1901 RSC
; (b) Y.-P. Ou, J. Zhang, Y. Hu, J. Yin, C. Chi and S. H. Liu, Dalton Trans., 2020, 49, 16877–16886 RSC
- J. Maurer, B. Sarkar, B. Schwederski, W. Kaim, R. F. Winter and S. Záliš, Organometallics, 2006, 25, 3701–3712 CrossRef CAS
- X. H. Wu, S. Jin, J. H. Liang, Z. Y. Li, G.-A. Yu and S. H. Liu, Organometallics, 2009, 28, 2450–2459 CrossRef CAS
- Y.-P. Ou, J. Zhang, M. Xu, J. Xia, F. Hartl, J. Yin, G.-A. Yu and S. H. Liu, Chem. – Asian J., 2014, 9, 1152–1160 CrossRef CAS PubMed
- J. Zhang, Y. Ou, M. Xu, C. Sun, J. Yin, G.-A. Yu and S. H. Liu, Eur. J. Inorg. Chem., 2014, 2941–2951 CrossRef CAS
- J. Maurer, M. Linseis, B. Sarkar, B. Schwederski, M. Niemeyer, W. Kaim, S. Zalis, C. Anson, M. Zabel and R. F. Winter, J. Am. Chem. Soc., 2008, 130, 259–268 CrossRef CAS PubMed
- R. Das, M. Linseis, S. M. Schupp, L. Schmidt-Mende and R. F. Winter, Chem. – Eur. J., 2022, 28, e202104403 CrossRef CAS PubMed
-
(a) E. Wuttke, D. Fink, P. Anders, A.-L. Maria Hoyt, W. Polit, M. Linseis and R. F. Winter, J. Organomet. Chem., 2016, 821, 4–18 CrossRef CAS
-
(a) P. Mücke, M. Linseis, S. Záliš and R. F. Winter, Inorg. Chim. Acta, 2011, 374, 36–50 CrossRef
- M. Linseis, S. Záliš, M. Zabel and R. F. Winter, J. Am. Chem. Soc., 2012, 134, 16671–16692 CrossRef CAS PubMed
- N. Rotthowe, J. Zwicker and R. F. Winter, Organometallics, 2019, 38, 2782–2799 CrossRef CAS
- J. Zhang, C.-F. Sun, X.-H. Wu, M.-X. Zhang, J. Yin, G.-A. Yu and S. H. Liu, Int. J. Electrochem. Sci., 2016, 11, 7875–7889 CrossRef CAS
- D.-D. Kong, L.-S. Xue, R. Jang, B. Liu, X.-G. Meng, S. Jin, Y.-P. Ou, X. Hao and S.-H. Liu, Chem. – Eur. J., 2015, 21, 9895–9904 CrossRef CAS
- J. Zhang, M.-X. Zhang, C.-F. Sun, M. Xu, F. Hartl, J. Yin, G.-A. Yu, Li Rao and S. H. Liu, Organometallics, 2015, 34, 3967–3978 CrossRef CAS
- S. Scheerer, N. Rotthowe, O. S. Abdel-Rahman, X. He, S. Rigaut, H. Kvapilová, S. Záliš and R. F. Winter, Inorg. Chem., 2015, 54, 3387–3402 CrossRef CAS PubMed
- F. S. Gogesch, S. Schwab, A. Rehse, M. Linseis, A. Baksi, G. H. Clever and R. F. Winter, Organometallics, 2023, 42, 3085–3098 CrossRef CAS
-
(a) D. A. van Dyke, B. A. Pryor, P. G. Smith and M. R. Topp, J. Chem. Educ., 1998, 75, 615 CrossRef CAS
- L. Flamigni, A. M. Talarico, B. Ventura, R. Rein and N. Solladié, Chem. – Eur. J., 2006, 12, 701–712 CrossRef CAS
-
(a) T. Vorfalt, K. J. Wannowius, V. Thiel and H. Plenio, Chem. – Eur. J., 2010, 16, 12312–12315 CrossRef CAS PubMed
- A. G. Crawford, Z. Liu, I. A. I. Mkhalid, M.-H. Thibault, N. Schwarz, G. Alcaraz, A. Steffen, J. C. Collings, A. S. Batsanov, J. A. K. Howard and T. B. Marder, Chem. – Eur. J., 2012, 18, 5022–5035 CrossRef CAS PubMed
- M. Inouye, M. S. Itoh and H. Nakazumi, J. Org. Chem., 1999, 64, 9393–9398 CrossRef CAS
- A. Harriman, L. J. Mallon, K. J. Elliot, A. Haefele, G. Ulrich and R. Ziessel, J. Am. Chem. Soc., 2009, 37, 13375–13386 CrossRef
-
(a) H. Werner, M. A. Esteruelas and H. Otto, Organometallics, 1986, 5, 2295–2299 CrossRef CAS
-
(a) D.-L. Sun, S. V. Rosokha, S. V. Lindeman and J. K. Kochi, J. Am. Chem. Soc., 2003, 125, 15950–15963 CrossRef CAS PubMed
- O. S. Abdel-Rahman, J. Maurer, S. Záliš and R. F. Winter, Organometallics, 2015, 34, 3611–3628 CrossRef CAS
- M. Krejčik, M. Daněk and F. Hartl, J. Electroanal. Chem., 1991, 317, 179–187 CrossRef
- N. G. Connelly and W. E. Geiger, Chem. Rev., 1996, 96, 877–910 CrossRef CAS PubMed
- M. B. Robin and P. Day, Adv. Inorg. Chem. Radiochem., 1968, 247–422 CrossRef
-
M. J. Frisch, G. W. Trucks, H. B. Schlegel, G. E. Scuseria, M. A. Robb, J. R. Cheeseman, G. Scalmani, V. Barone, G. A. Petersson, H. Nakatsuji, X. Li, M. Caricato, A. Marenich, J. Bloino, B. G. Janesko, R. Gomperts, B. Mennucci, H. P. Hratchian, J. V. Ortiz, A. F. Izmaylov, J. L. Sonnenberg, D. Williams-Young, F. Ding, F. Lipparini, F. Egidi, J. Goings, B. Peng, A. Petrone, T. Henderson, D. Ranasinghe, V. G. Zakrzewski, J. Gao, N. Rega, G. Zheng, W. Liang, M. Hada, M. Ehara, K. Toyota, R. Fukuda, J. Hasegawa, M. Ishida, T. Nakajima, Y. Honda, O. Kitao, H. Nakai, T. Vreven, K. Throssell, J. J. A. Montgomery, J. E. Peralta, F. Ogliaro, M. Bearpark, J. J. Heyd, E. Brothers, K. N. Kudin, V. N. Staroverov, T. Keith, R. Kobayashi, J. Normand, K. Raghavachari, A. Rendell, J. C. Burant, S. S. Iyengar, J. Tomasi, M. Cossi, J. M. Millam, M. Klene, C. Adamo, R. Cammi, J. W. Ochterski, R. L. Martin, K. Morokuma, O. Farkas, J. B. Foresman and D. J. Fox, Gaussian 09, revision D.01, Gaussian, Inc., Wallingford, CT, 2009 Search PubMed
- A. Nakajima, Bull. Chem. Soc. Jpn., 1971, 44, 3272–3277 CrossRef CAS
-
(a) O. Narwark, S. Meskers, R. Peetz, E. Thorn-Csányi and H. Bässler, Chem. Phys., 2003, 294, 1–15 CrossRef CAS
- S. Stoll and A. Schweiger, J. Magn. Reson., 2006, 178, 42–55 CrossRef CAS PubMed
- S. Grimme, J. Antony, S. Ehrlich and H. Krieg, J. Chem. Phys., 2010, 132, 154104 CrossRef
- M. Cossi, N. Rega, G. Scalmani and V. Barone, J. Comput. Chem., 2003, 669–681 CrossRef CAS
- P. C. Hariharan and J. A. Pople, Theor. Chim. Acta, 1973, 28, 213–222 CrossRef CAS
- J. P. Perdew, K. Burke and M. Ernzerhof, Phys. Rev. Lett., 1996, 77, 3865–3868 CrossRef CAS PubMed
- C. Adamo and V. Barone, J. Chem. Phys., 1999, 110, 6158–6170 CrossRef CAS
- N. M. O'Boyle, A. L. Tenderholt and K. M. Langner, J. Comput. Chem., 2008, 29, 839–845 CrossRef
- M. D. Hanwell, D. E. Curtis, D. C. Lonie, T. Vandermeersch, E. Zurek and G. R. Hutchison, J. Cheminf., 2012, 1–17 Search PubMed
- O. Tange, USENIX Mag., 2011, 36, 42–47 Search PubMed
- W. Humphrey, A. Dalke and K. Schulten, J. Mol. Graphics, 1996, 14, 33–38 CrossRef CAS
Footnote |
| † Electronic supplementary information (ESI) available. See DOI: https://doi.org/10.1039/d3dt03114d |
| This journal is © The Royal Society of Chemistry 2024 |