
 Open Access Article
 This Open Access Article is licensed under a
 Creative Commons Attribution 3.0 Unported Licence
Effect of Pt and Ru-based catalysts on the electrochemical hydrodeoxygenation of phenol to cyclohexane†
Jeffrey R.
Page
 ab,
Amol
Pophali
c,
Taejin
Kim
c,
Juan A.
Lopez-Ruiz
de,
Stoyan
Bliznakov
ab and
Julia A.
Valla
*ab
ab,
Amol
Pophali
c,
Taejin
Kim
c,
Juan A.
Lopez-Ruiz
de,
Stoyan
Bliznakov
ab and
Julia A.
Valla
*ab
aDepartment of Chemical and Biomolecular Engineering, University of Connecticut, 191 Auditorium Rd, Unit 3222, Storrs, CT 06269, USA. E-mail: ioulia.valla@uconn.edu
bCenter for Clean Energy Engineering, University of Connecticut, 44 Weaver Rd, Unit 5233, Storrs, CT 06269, USA
cDepartment of Materials Science and Chemical Engineering, Stony Brook University, Stony Brook, NY 11794, USA
dPacific Northwest National Laboratory, Institute for Integrated Catalysis, Energy and Environment Directorate, 902 Battelle Blvd., Richland, WA 99352, USA
eWSU-PNNL Bioproducts Institute, USA
First published on 30th July 2024
Abstract
Electrochemical hydrodeoxygenation (EC-HDO) is a promising method for upgrading biomass derived oxygenates into biofuels at near ambient conditions without the need for external hydrogen (H2). Although the EC-HDO approach has many advantages over conventional thermochemical hydrodeoxygenation (HDO) methods, the selective production of fully deoxygenated hydrocarbons remains a key challenge. In this study we explore the EC-HDO of phenol as a bio-oil-derived model compound using carbon supported metal electrocatalysts in a custom-made divided electrochemical batch cell. We demonstrated EC-HDO of phenol to cyclohexane and investigated the effect of multiple variables, including catalyst type, and cathodic potential to determine their influence on reaction rate, selectivity, and faradaic efficiency (FE). The results obtained show that lab-synthesized, bi-metallic PtRu–C catalyst results in the highest specific EC-HDO rate of 5.05 molcyclohexane h−1 gmetal−1 in comparison to 4.65 molcyclohexane h−1 gmetal−1 and 0.35 molcyclohexane h−1 gmetal−1, measured using mono-metallic Pt–C and Ru–C catalysts, respectively. In addition, the labPtRu–C electrocatalyst achieved >30% selectivity towards cyclohexane while the monometallic Pt and Ru only achieved 25 and 11%, respectively. Operando Raman spectroscopy demonstrated strong evidence for ketone reaction intermediates.
Introduction
Bio-oils derived from the fast pyrolysis of biomass represent a promising source of renewable and sustainable carbon-neutral chemicals and fuels.1 Unfortunately, raw bio-oils are not suitable for end use as fuels due to the presence of reactive, small oxygenates including phenols, carboxylic acids, ketones, and aldehydes.1,2 The reactivity of these compounds make bio-oil unstable and prone to polymerization before use.1 To decrease the oxygen content of the bio-oil, a secondary upgrading step is required.2–10 Several bio-oil upgrading processes have emerged including the traditional hydrodeoxygenation (HDO), catalytic cracking, steam reforming, and esterification.2,11–14 Thermochemical HDO has received significant attention as the most promising process for bio-oil upgrading to biofuels. This process combines high pressure H2 (∼30 MPa) with high temperatures (∼300 °C) to produce aromatic and saturated hydrocarbons.2,4 However, these reaction conditions make HDO an H2 intensive process, and result in catalyst coke formation that causes catalyst deactivation.2In contrast to the thermochemical HDO, electrochemical hydrodeoxygenation (EC-HDO) represents a low-temperature and cost-effective method for upgrading bio-oils at near-ambient reaction conditions ranging from 25–80 °C and atmospheric pressures.15–17 The mild conditions minimize bio-oil polymerization and coke formation, thereby avoiding deactivation.18,19 As the hydrogen used during EC-HDO is generated in situ from water or organic molecules, EC-HDO does not rely on H2 produced from fossil fuels.20 This fact outlines the great opportunity of EC-HDO to lower the capital costs associated with traditional high-temperature and high-pressure processes as well as H2 production, storage, and distribution. Furthermore, EC-HDO serves to create a fully sustainable process wherein electricity generated from renewable sources (wind or solar) is used to generate H2 that is stored as a useable fuel.
EC-HDO reactions are performed at the cathode of an electrochemical cell. Typically, the bio-oil or derived model compound is dissolved in a water-based electrolyte mixture to ensure increased ionic conductivity.17 During EC-HDO, an electrical potential between the anode and cathode of an electrochemical cell causes the oxygen evolution reaction (OER) to occur on the anode producing protons (H+) and electrodes (e−), which are transported to the cathode to either form H2 or hydrogenate a bio-oil derived organic molecule of interest. The EC-HDO reactions are similar to the hydrogenation, hydrogenolysis, and hydrodeoxygenation reactions that occur in conventional thermochemical HDO upgrading processes, yet benefit from in situ hydrogen production and can be carried out at near-ambient conditions.
Nevertheless, the literature is still lacking a fundamental understanding of the EC-HDO reaction pathways.17,19,21,22 In addition, the complex nature of bio-oils requires the use of model compounds to obtain elementary reaction insights. Currently, furfural, and guaiacol have received the greatest research attention for EC-HDO as bio-oil model compounds.15,23–31 Phenol has attracted significant interest in recent years as it is a simple, yet abundant, compound in bio-oils.30–38 While the electrochemical reduction of phenol has been explored in numerous studies, the focus has been on electrochemical hydrogenation (ECH) rather than hydrodeoxygenation (EC-HDO).32,33,36,37,39–41 In this work we focused our studies not only on the hydrogenation, but mostly on hydrodeoxygenation of phenol to cyclohexane. Complete hydrodeoxygenation of oxygenates to hydrocarbons is desired since the latter represent the main components of liquid transportation or aviation bio-fuels. Traditional phenol ECH products (i.e., cyclohexanone and cyclohexanol) represent undesired products for biofuels as they would need a secondary upgrading step to remove oxygen heteroatoms.
Despite the growing interest in bio-oil based electrochemical processes, high selectivity towards fully or partially deoxygenated products remains a significant limitation, hindering biofuel production. Among the most studied model compounds, furfural and guaiacol have both shown to readily undergo hydrodeoxygenation and hydrogenolysis under EC-HDO conditions. The use of Cu-based electrocatalysts and acidic electrolytes (pH < 3) have shown that furfural can be selectively converted to the desired deoxygenated product of methylfuran.42–46 However, at pH > 3 the primary product shifts to furfuryl alcohol, thereby decreasing the deoxygenation efficiency.42 EC-HDO of guaiacol, on the other hand, has revealed fast cleavage of the methoxy group using a variety of catalysts, (Pt, Rh, Au) whereas cleavage of the alcohol group is not typically observed.42
While previous electrochemical studies have demonstrated deoxygenation of furfural,43 there are limited studies exploring electrochemical deoxygenation of phenol in appreciable yields.47 Zhao et al. studied the EC-HDO of phenol and they reported 60% cyclohexane selectivity using Pt-graphite catalyst at 60 °C using acidic electrolyte (0.2 M perchloric acid). However, the authors do not report mass and carbon balances, or the reproducibility of their experiments; hence, it is difficult to determine if the loss of product is responsible for the differences in product selectivity and faradaic efficiency.47 Liu et al. demonstrated 18.6% cyclohexane selectivity after performing phenol EC-HDO with a dual Pt/C and polyoxometalate catalyst system due to increased direct protonation (35 °C, current density 100 mA cm−2, Pt to phenol 1.7 mol%, pH = 0.4).48 While some researchers have reported cyclohexane as a product, others have not measured any cyclohexane.49 The absence of measured phenol content could be caused by several factors including: operating potentials, electrode composition reaction conditions (pH, temperature) and the low solubility of cyclohexane in water. Additionally, it has been hypothesized that the activation barrier for cleavage of the C–O bond in phenol is significantly higher than that of cyclohexanone or cyclohexanol, indicating that low or negligible yields to cyclohexane are due to overpotentials or temperatures that are too low to effectively catalyze hydrogenolysis.27,42
In contrary to the limited literature on EC-HDO of phenol, there are numerous computational and experimental studies that focus on the ECH of phenol. Electrocatalyst selection has shown to be a key factor in phenol ECH performance, wherein a variety of mono-metallic noble (Pt, Pd, Rh, Ru) and transition metals (Cu, Ni, Fe, Co) as well as bi-metallic (PtNi, PtCo) catalysts have been investigated.30,31,36,37,50–52 Sanyal et al. showed that using Rh, Ru, Pd, and Cu-based electrocatalysts in an acetic acid buffer solution, phenol was electrochemical hydrogenated exclusively to cyclohexanol and cyclohexanone.33 Due to its effectiveness in the hydrogen evolution reaction (HER), Pt has been investigated and found to be one of the most active catalysts in bio-oil hydrogenation (ECH).15 However, several studies have reported slow ECH reaction rates at low phenol concentrations most likely attributed to Pt poisoning.32,37,46,50 Ru, on the other hand, has resulted in sluggish ECH kinetics but has shown resistance to poisoning.36,39,53
Despite the benefits and drawbacks of mono-metallic Pt and Ru electrocatalysts, there remains limited research into the effectiveness of bi-metallic PtRu on phenol ECH. Pt–Ru bi-metallic catalysts are widely used in electrochemical reactions such as HER,54 nitrate reduction55 ethylene glycol oxidation,56 ethanol oxidation,57–61 particularly direct methanol fuel cells.62–66 Literature suggests that oxidation of methanol on bi-metallic PtRu catalysts is promoted by the preferential adsorption of methanol (over H2O) onto the Ru active sites and reduced adsorption strength of CO.63,67 Recently PtRu has also been used for the ECH of phenol. Wu et al., and Du et al., have indicated PtRu as a promising electrocatalyst for phenol ECH.36,39 Wu et al. found that PtRu resulted in the highest turnover frequency (TOF) 213.5 h−1 (assuming 100% catalyst dispersion) compared to other mono- and bi-metallic electrocatalysts tested; however, they did not report any cyclohexane production.39 Du et al. found that the bimetallic PtRu catalyst reached the highest phenol conversion during phenol ECH at 96.3% compared to 90.2% and 70.4% for the mono-metallic Pt and Ru, respectively and resulted to nearly no EC-HDO with a cyclohexane selectivity of 1.3% (reaction conditions: 0.2 M H2SO4, 100 mA, 50 °C).36 Very recently Sun et al. studied electrodeposited bimetallic PtRu catalysts for the ECH of phenol finding that the optimal Pt3Ru3 catalyst results in a 100% selectivity to cyclohexanol and 100% conversion of phenol after 9 h at ambient conditions and a current density of 10 mA cm2. The authors suggest that the bimetallic catalyst enables a proton-coupled electron transfer reaction pathway resulting in better hydrogenation performance.
It appears that PtRu–C is a potential candidate for the electrochemical conversion of phenol. However, the fundamental understanding of how this electrocatalyst system works in terms of hydrogenation and, most importantly, hydrodeoxygenation activity is still lacking in literature due to the fact that the important electrochemical reaction parameters (i.e., half-cell potential) and reaction conditions (pH, concentration, temperature, catalyst loading) are not properly controlled, as well as the kinetic and performance analysis (i.e., reporting of rates, calculation of selectivities, mole balance closure) is insufficient. Hence, the objective of our foundational study is to investigate the EC-HDO reaction of phenol on Pt, Ru, and PtRu on carbon support and the primary electrochemical factors that influence the production to cyclohexane, such as half-cell potential and conversion. We performed our experiments in a custom designed electrochemical “H-cell” with an attached organic solvent trap to effectively capture and accurately measure all the volatile products. Lab synthesized Pt–C, Ru–C, PtRu–C, and commercial PtRu–C were comprehensively characterized and tested as electrocatalysts for EC-HDO of phenol. To the best our knowledge this is the first study that demonstrates ≈30% selectivity towards cyclohexane using lab synthesized PtRu–C catalyst, while achieving ≥89% material balances and systematically measuring the EC-HDO performance (i.e., rates and product selectivity) as a function of half-cell potential, electrode composition, and conversion. Furthermore, we couple EC-HDO experiments with operando Raman spectroscopy to identify ketone (possibly cyclohexanone) as the key surface reaction intermediate stabilized by Pt and PtRu.
Materials and methods
Materials
Phenol, cyclohexane, cyclohexanol, cyclohexanone, dichloromethane, isopropyl alcohol, decane, benzene, ethanol, and ruthenium(III) chloride were purchased from Sigma Aldrich. Perchloric acid and chloroplatinic acid was purchased from Fisher Scientific. Nafion 117 and Nafion 5% isopropyl alcohol and water dispersion were purchased from fuel cell store. Spectracarb™ 2050A 0850 GDL was purchased from Engineered Fibers Technology (Shelton, CT). A commercial PtRu on carbon black catalyst (10 wt% Pt, 2 wt% Ru) was obtained from Johnson Matthey and denoted as comPtRu–C. Deionized water was obtained at 18.2 MΩ using an Elga Ultra Pure system. Ultra-high purity H2, helium (He), and argon (Ar) gas were obtained from Air Gas.Catalyst synthesis and electrode preparation
Mono-metallic and bi-metallic catalysts supported on Vulcan carbon (XC72-R) were synthesized by using incipient wetness impregnation method.68 Corresponding metal salts (ruthenium(III) chloride trihydrate and chloroplatinic acid hexahydrate) were dissolved in a mixture of 4![[thin space (1/6-em)]](https://www.rsc.org/images/entities/char_2009.gif) :1 ethanol to benzene. The metal salt solution was then added dropwise to the carbon support until the slurry reached its saturation (i.e., incipient wetness) point. For example, to prepare the labPtRu–C catalyst, 0.1169 g of H2PtCl6·6H2O and 0.0228 g of RuCl3·3H2O were dissolved in 1.5 mL of ethanol and 0.5 mL benzene and added dropwise to 0.4 g of Vulcan carbon (XC72-R) to reach saturation. The catalyst slurry was then allowed to dry overnight at 60 °C before reduction at 350 °C for 3 hours under 50 sccm of H2. In a typical reduction step, we used 0.25 g of untreated catalyst. After reduction, the catalyst was let cool down to room temperature under 50 sccm N2 and then stored in a glass vial.
:1 ethanol to benzene. The metal salt solution was then added dropwise to the carbon support until the slurry reached its saturation (i.e., incipient wetness) point. For example, to prepare the labPtRu–C catalyst, 0.1169 g of H2PtCl6·6H2O and 0.0228 g of RuCl3·3H2O were dissolved in 1.5 mL of ethanol and 0.5 mL benzene and added dropwise to 0.4 g of Vulcan carbon (XC72-R) to reach saturation. The catalyst slurry was then allowed to dry overnight at 60 °C before reduction at 350 °C for 3 hours under 50 sccm of H2. In a typical reduction step, we used 0.25 g of untreated catalyst. After reduction, the catalyst was let cool down to room temperature under 50 sccm N2 and then stored in a glass vial.
Catalyst inks were prepared from the reduced catalyst in a ratio of 10:3 catalyst/Nafion (30% Nafion by dry mass). The total volume of the ink was adjusted so that the dry mass of catalyst/Nafion was 0.010 g mL−1 of ink. For example, in a typical ink preparation 0.14 g of catalyst was added to 0.06 g of Nafion (1.28 mL of 5 wt% Nafion dispersed in 1:1 water to isopropyl alcohol) and dissolved in an additional 14.71 g (18.72 mL) of isopropyl alcohol. The prepared ink was sonicated in an ice bath for 0.5 hours, then ultrasonically sprayed using a custom-modified 3D printer fitted with a Sono-Tek 60 kHz nozzle and a heated bed. Inks were sprayed onto a carbon paper substrate at a constant ink flowrate of 0.75 mL min−1 with the heated bed set to 80 °C. After all ink was sprayed (∼50 passes) the deposition program was stopped, and the catalyst layers were allowed to dry for an additional 0.16 hours at 80 °C before the final weight was recorded. The approximate thickness of the catalyst layer was measured to be ∼20 μm. All electrodes were prepared with a metal loading of 0.0002 gmetal cm−2 based on the metal loadings determined from ICP analysis. The synthesized catalysts were denoted as labPtRu–C, Pt–C, Ru–C.
Catalyst characterization
Surface areas and porosities of prepared catalysts were determined by N2 adsorption–desorption using a Micromeritics ASAP 2020C sorption analyzer. All materials were degassed for 12 h at 120 °C under vacuum. N2 adsorption–desorption isotherms were then gathered at 77 K under a liquid nitrogen environment. Surface areas of samples were calculated using the Brunauer–Emmett–Teller (BET) method, while pore volumes were calculated using the single-point method below P/P0 = 0.99. X-ray diffraction (XRD) patterns of prepared catalysts were obtained using a Bruker D8 Advance powder diffractometer (CuKα radiation source) using a scan rate of 0.5° 2θ. Pt and Ru loadings were determined using a Thermo Scientific iCAP 6500 inductively coupled plasma optical emission spectrometer (ICP-OES). Scanning transmission electron microscopy (STEM) imaging was performed on the as-synthesized samples by using high-resolution F200X FEG TEM/STEM Talos microscope with a field emission source at 200 keV. High-angle dark field (HAADF) images were collected for morphology and particle size distribution study, while EDS maps were collected for the chemical composition and elemental distribution analysis. STEM imaging and EDS mapping were performed after the catalysts underwent reduction in hydrogen at 350 °C. Particle size distribution analysis was performed using ImageJ software. Particle size distribution histograms were created using measurements from 150 particles. X-ray photoelectron spectroscopy (XPS) analysis was performed using a ThermoFisher Alpha-K XPS. Surveys were performed from −10 eV to 1350 eV. The Pt 4f signal was scanned from 64 eV to 87 eV and the Ru 3p signal was scanned from 475 eV to 448 eV. The spectra were calibrated using the C1 peak of carbon at 284.8 eV. Catalyst samples were taken for XPS characterization immediately after reduction as described above.Electrochemical hydrodeoxygenation (EC-HDO) experiments
EC-HDO experiments were conducted in a custom-made two compartment electrochemical H-cell. Anode and cathode were separated by a Nafion 117 membrane. The total liquid volume of the anolyte and catholyte were each 30 mL. N2 gas was continuously purged through the system at a flowrate of 25 sccm. The anode was 1 mm thick Pt foil with geometric area of 2 cm2, while the exposed geometric area of the cathode was 1.77 cm2. An Ag/AgCl/saturated NaCl (BSAI) reference electrode was used to measure the potential of the working electrode. The half-cell potentials presented in this work are IR-corrected at 100%. Before the start of each experiment the cathode was subjected to 0.5 hours of pre-electrolysis to remove surface oxides from the catalyst surface. The cleaning procedure consisted of cycling the cathodic voltage between −0.6 V and 0.78 V vs. Ag/AgCl. Electrochemical impedance spectroscopy (EIS) was performed to determine the high frequency resistance (HFR) and iR correct potential data. EIS measurements were performed at −0.2 V vs. Ag/AgCl with a 20 mV perturbation amplitude and a frequency range of 100 kHz to 10 MHz. Using the HFR determined by EIS potential data was corrected post-experiment. A 250 mL solvent trap filled with 50 mL of n-decane chilled in an ice bath was attached to gas vent of the H-cell and bubbled in the n-decane solution allowing for the collection of any organic compounds evaporated during the length of the electrochemical experiment. A diagram of the “H-cell” used in this study is shown in Fig. 1.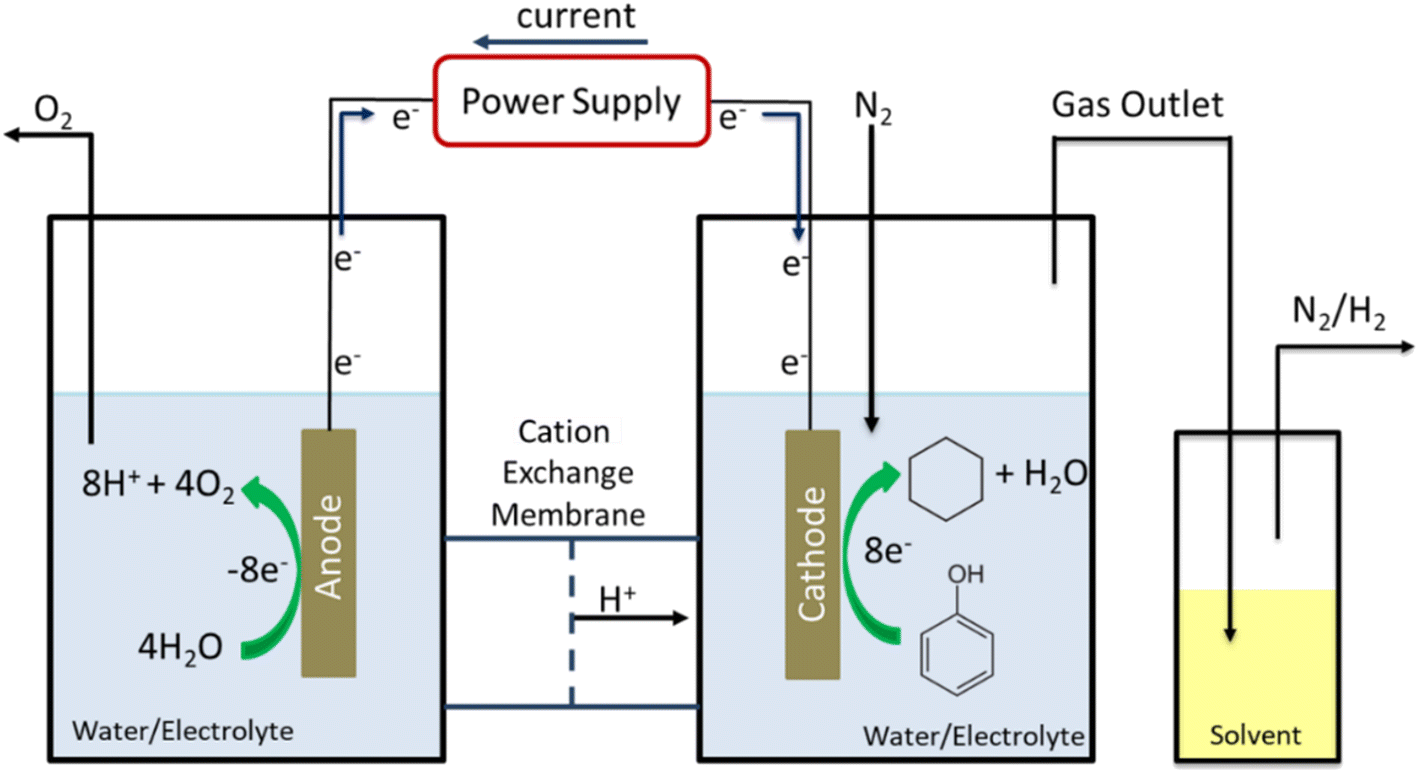 | ||
| Fig. 1 Diagram of the custom-built electrochemical H-cell with solvent trap for the collection of aqueous insoluble volatile organics. | ||
Before the start of each EC-HDO reaction the cathode was filled with 25 mL of catholyte composed of 0.2 M perchloric acid and allowed 1 hour to reach operating temperature under stirring at 800 rpm. After that, 0.096 g of phenol and 5 mL of catholyte were mixed until the phenol was completely dissolved. The 5 ml phenol + catholyte solution was then added to the cathode of the H-cell to achieve 30 mM in the electrolyte solution and allowed to mix for 0.25 hours. An initial sample was taken from the catholyte and solvent trap before the application of a potential to determine the initial concentration of phenol in the cell. Samples were taken from the catholyte and the solvent trap every hour for the duration of the experiment.
All experiments were performed in triplicate and most of them had carbon balance greater than 90%. To further probe the accuracy of the experiments, an H2 balance was obtained. Thus, the outlet of the H-cell was connected to an online mass spectrometer to estimate H2 production due to HER. An experiment was performed without the presence of the phenol to assess the accuracy of the mass spectrometer (Agilent 5975C) at measuring HER. The H2 balance was performed for the labPtRu experiment and was ≈95% after 4 hours of reaction time. A plot of the consumption of H2 based on the detected products from phenol EC-HDO and the production of H2 due to HER can be found in ESI-1.†
Product analysis
Catholyte analysis was performed by liquid–liquid extraction using dichloromethane as the organic solvent. 0.5 mL of catholyte was mixed with 1 mL of dichloromethane and the organic phase was separated from the catholyte for further analysis. Products condensed in the solvent trap were measured by removing 1 mL of sample periodically. Identification of products were performed using an Agilent GC-MS (GC 6975, MS 5973N) equipped with HP-5 column. Helium was used as a carrier gas at a flow rate of 2 sccm. The initial oven temperature of 35 °C was held for 0.0166 hours (1 minute) before the oven was ramped to 80 °C at 0.033 °C per hour before ramping at 10 °C min−1 to 250 °C. Reactant and product concentrations were determined using a GC-FID (Agilent GC 7890) with an HP-5 column calibrated for phenol, cyclohexane, cyclohexanol, and cyclohexanone. The temperature program on the GC-FID was identical to the one on the GC-MS.To assess performance the conversion (eqn (1)), product selectivity (eqn (2)), farday efficiency (FE, eqn (3)), specific ECH rate (eqn (4)), EC-HDO rate (eqn (5)) and TOF (eqn (6)) were calculated.
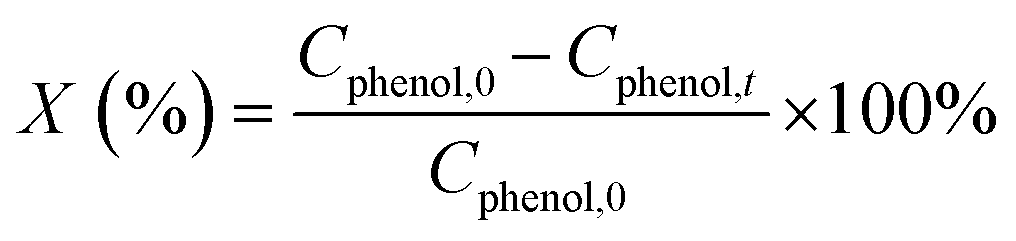 | (1) |
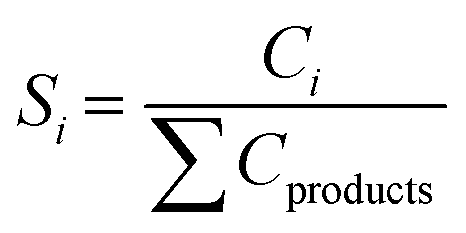 | (2) |
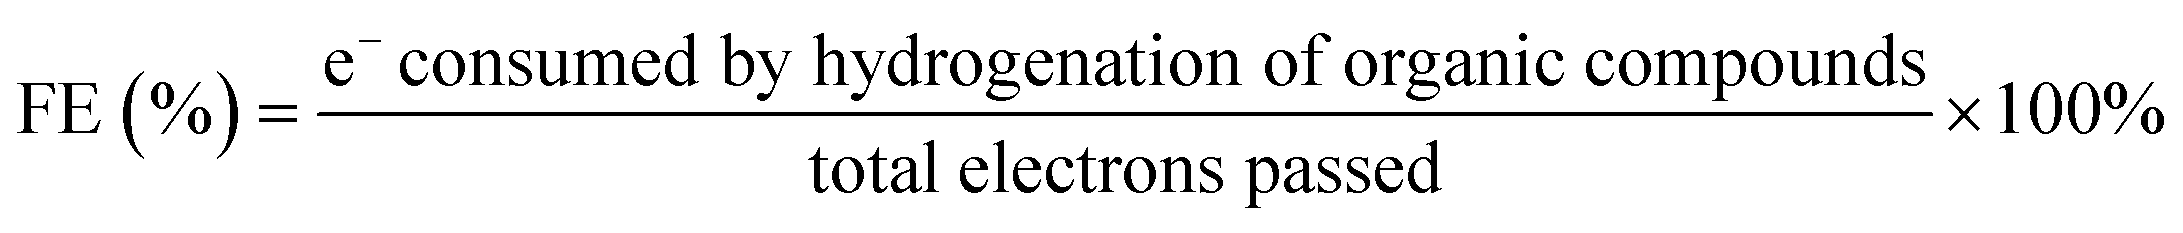 | (3) |
 | (4) |
 | (5) |
 | (6) |
Operando Raman
Raman spectroscopy scans were measured with an operando setup using a Horiba-Jobin Xplora™ PLUS confocal Raman microscope equipped with a thermoelectrically cooled charge coupled device (CCD) array detector and high-grade Olympus MPLN 10× objective. The schematic of this experiment is shown in Fig. 2. The experiments were performed in a custom designed undivided cell that can hold an electrolyte volume of 10 ml. The cell is comprised of: (i) the working electrode (labPtRu–C, Pt–C, and Ru–C) with an exposed area = 1.77 cm2; (ii) the counter electrode (Au); and (iii) the reference electrode (Ag/AgCl). The remaining volume of the cell was filled with 10 ml of electrolyte. Raman measurements were performed on the same sample spot by a visible 532 nm (100 mW) laser. The laser power was filtered (10%) and adjusted for each scan to avoid damaging the catalyst from irradiation. The Raman spectra were collected in two regions viz. 400–2000 and 2000–4000 cm−1 Raman shift regions, and the spectrum was accumulated for 10 scans with spectral acquisition time of 0.000278 hours (10 seconds). The EC-HDO experiment was performed in the operando setup from 0–0.56 V vs. Ag/AgCl and the spectrums were collected at an interval of 0.08 V. The operando Raman spectroscopy experiments for ECH reaction were carried out up to 0.75 hours reaction time to understand the intermediate species and predict the reaction pathway. This reaction time was decided based on the activity data. As a control experiment, ex situ Raman spectroscopy was separately performed for phenol, cyclohexanone, cyclohexanol, cyclohexane, benzene, and bare labPtRu–C catalyst. The collection parameters for these scans were kept the same as for operando Raman spectroscopy.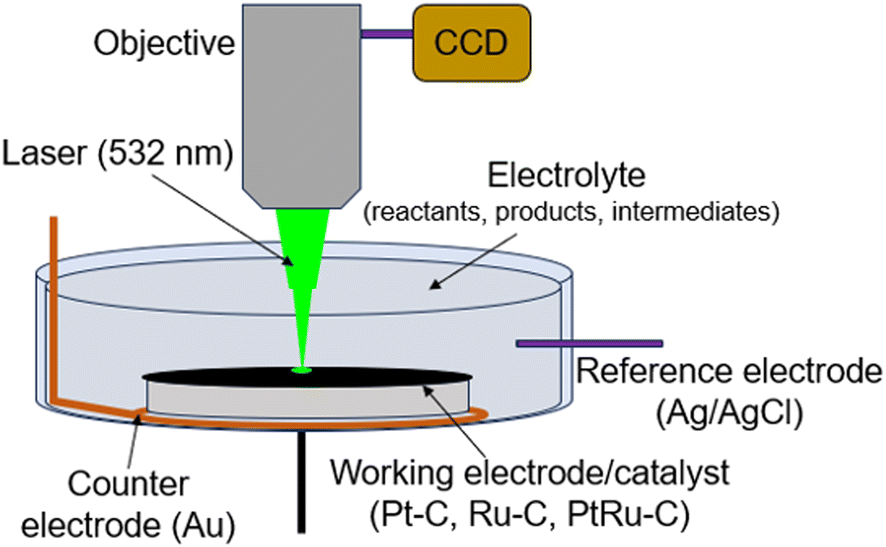 | ||
| Fig. 2 Schematic showing the operando Raman spectroscopy setup including the working, counter, and reference electrodes and the objective, laser, CCD detector. | ||
Results and discussion
Electrocatalyst characterization
The electrocatalysts tested in this work were mono- and bi-metallic Pt and Ru metal nanoparticles on carbon black supports. A comPtRu–C electrocatalyst was obtained from Johnson Matthey as a baseline material. Additionally, labPtRu–C, Pt–C and Ru–C were prepared using incipient wetness impregnation on Vulcan carbon (XC72-R) to investigate the effect of metal on ECH performance. Vulcan carbon has been utilized extensively as catalyst support for electrolyzers and fuel cells owing to its high electrical conductivity. All electrocatalysts were subjected to thermal reduction at 350 °C under H2 prior to characterization and ECH experiments to reduce the catalysts from oxide to metallic nanoparticles.N2 adsorption/desorption, ICP-OES, XRD, XPS, and STEM were used to comprehensively characterize and compare the catalysts of interest. Table 1 shows the surface area properties calculated using the BET surface area method. These results show that the surface area of all the lab synthesized catalysts is higher than that of the commercial catalyst. The surface areas measured for the lab synthesized materials in this study are comparable to similar literature studies for electrocatalysts supported on Vulcan carbon. Metal dispersions were calculated based on the average particle size determined using TEM (Fig. 4) and the most abundant crystal phases (111) for Pt–C, labPtRu–C, comPtRu–C, and (101) for Ru–C using eqn (7).69
 | (7) |
| Catalyst | Surface area (m2 g−1) | Ru content (wt%) | Pt content (wt%) | D p Scherrer (nm) | D p TEM (nm) | 1/Dp (nm−1) | TEM dispersion (%) |
|---|---|---|---|---|---|---|---|
| a As reported by the manufacturer. | |||||||
| comPtRu–C | 96.3 | 2.00a | 10.0a | 1.6 | 2.2 | 0.46 | 53.4 |
| labPtRu–C | 157 | 2.10 | 9.80 | 2.1 | 2.5 | 0.40 | 44.0 |
| Pt–C | 172 | 0.00 | 11.1 | 10.7 | 5.4 | 0.19 | 20.7 |
| Ru–C | 180 | 4.60 | 0.00 | 6.9 | 2.3 | 0.43 | 56.1 |
Fig. 3 shows the XRD patterns of the comPtRu–C, labPtRu–C, Pt–C, and Ru–C catalysts. The XRD patterns confirm the presence of all expected metallic crystalline phases68,70 as well as a carbon (002) reflection at 25° 2θ, attributed to the carbon black support. The (002) reflection of the comPtRu–C electrocatalyst is noticeably sharper than for the lab synthesized electrocatalysts, indicating that the carbon support in the commercial electrocatalyst is more crystalline than the Vulcan XC-72R used in the lab synthesized electrocatalysts and is further consistent with the decreased surface area of the commercial electrocatalyst. The XRD spectra of the Pt–C catalyst shows reflections at 39.5°, 46.4° and 67.5° 2θ degrees, which are consistent with the (111), (200), and (220) phases in the face-centered cubic (FCC) structure of Pt. Ru–C shows all the reflections associated with Ru hexagonal close packed (HCP) crystal structure (100, 101, 002, 102, 110, and 103) at 38.5, 42.3, 44.1, 58.5, 69.5, and 78.5 2θ degrees.
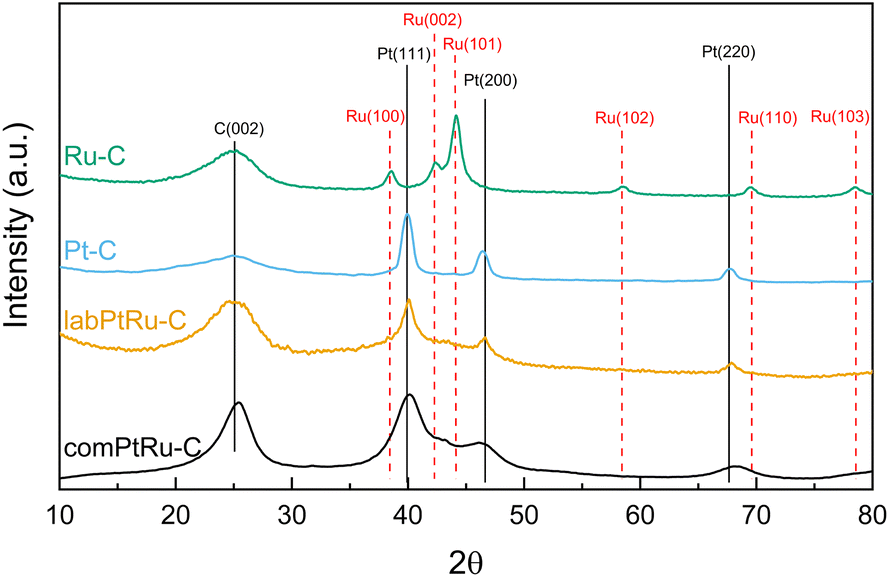 | ||
| Fig. 3 Comparison of the X-ray powder diffraction spectra of commercial and lab synthesized catalysts. | ||
The commercial and labPtRu electrocatalysts contain all Pt–C primary peaks with no reflections associated with the HCP structure of Ru, indicating that Ru has been incorporated into the Pt structure. Additionally, the (111) Pt peak shows a shift from 39.5° 2θ to 40.18° and 40.14° 2θ for the commercial and labPtRu electrocatalysts, respectively, supporting the incorporation of Ru into the Pt crystal structure.68,70 To further prove the incorporation of Ru, the lattice constants were calculated to determine a shift. The lattice constants of the Pt–C, comPtRu–C, and labPtRu–C (111) phases were calculated to be 3.917 Å, 3.891 Å, and 3.900 Å, respectively. The incorporation of the Ru into the Pt(111) crystal structure causes a decrease in the lattice constant, which shifts the Pt(111) reflection towards higher 2θ angles, as seen here.68,70 The absence of new crystal phases indicates that Pt and Ru are not forming intermetallic phases, wherein previous studies on PtRu electrocatalysts have indicated the potential for a substitutional alloy with an FCC crystal structure at Ru concentrations <70%.62 Crystallite grain sizes have been calculated using the Scherrer equation (eqn (7)) for the (111) crystal phase of the electrocatalysts with Pt (Pt–C, labPtRu–C, and comPtRu–C) and (101) for Ru–C.
 | (8) |
Fig. 4 shows TEM images and particle size distributions of the comPtRu–C, labPtRu–C, Ru–C, and Pt–C electrocatalysts. These images confirm that nanoparticles were synthesized on the carbon black support. The estimated average particle sizes for the comPtRu–C, labPtRu–C, Pt–C, and Ru–C electrocatalysts are 2.2, 2.5, 5.4 and 2.3 nm, respectively. These numbers differ from the crystallite sizes calculated using the Scherrer equation above; however, they follow the same trend in which the mono-metallic Pt–C has the largest nanoparticles (5.4 nm) and the comPtRu–C has the smallest (2.2 nm). The Pt–C and Ru–C particle sizes differ by roughly 2× between the values determined from TEM and XRD. This is likely caused by XRD favoring larger particle by weight whereas TEM particle sizing is weighted by number. The differences in particle size may be explained by metal–support or precursor salt support interactions. During reduction at 350 °C under H2 flow, Ru appears to bind stronger to the carbon support than Pt as indicated by the smaller nanoparticle size. That stronger bonding of Ru on carbon might decrease sintering, therefore creating smaller particle sizes. EDS mapping shown in ESI-2† confirms that both Pt and Ru have been deposited on the carbon supports as nanoparticles.
 | ||
| Fig. 4 TEM images and corresponding particle size distributions (insets) of the a) comPtRu–C, b) labPtRu–C, c) Pt–C, and d) Ru–C catalysts. | ||
XPS of the comPtRu–C, labPtRu–C, Pt–C, and Ru–C was performed to assess the oxidation states of the Pt and Ru on the carbon supports. Complete surveys spectra from 1350 eV to 0 eV for the four catalysts of interest are presented in Fig. S3.† The spectra confirmed the presence of all expected peaks including C1, O1, Pt 4f and Ru 3p. Fig. 5 shows the XPS spectra for the Pt 4f and Ru 3p scans. Ru 3p was scanned instead of the more intense Ru 3d (280 eV) due to the overlap between the C1 peak (288 eV). In addition, a Ru 4s signal was observed in the Pt 4f region of the mono-metallic Ru–C catalyst at 75.0 eV for Ru(0) and 75.7 eV for Ru oxide (Fig. S4†).72,73 To the best of our knowledge there is no available standard spectra for fitting the Ru 4s peak. As such, it is difficult to deconvolute the contribution of the Ru 4s at the Pt 4f spectra of the bi-metallic catalysts. Peak fitting of the Pt 4f for the mono-metallic Pt–C can be found in Fig. S5† which consists primarily of Pt(0) 4f7/2 at 71.1 eV, Pt(0) 4f5/2 at 75.2 eV, Pt(II) 4f7/2 at 74.0 eV, and Pt(II) 4f5/2 at 77.9 eV. A shift of the Pt(0) 4f7/2 peak from 71.1 eV to 71.4 eV was observed for both bi-metallic PtRu electrocatalysts. This shift can be attributed to 1) the presence of the Ru 4s peak, 2) Ru–Pt interactions, 3) the presence of additional Pt oxidation states, 4) metal–carbon interactions, or 5) small cluster size effects.74 The Ru 3p signal (Fig. 5b) is comprised of Ru(0) 3p3/2 at 461.2 eV, Ru(0) 3p3/2 at 470.9 eV satellite, Ru oxide 3p3/2 462.5 eV and Ru oxide 3p3/2 465.4 eV satellite. For the labPtRu–C, the Ru 3p signal is shifted toward higher binding energies compared to the Ru–C or the comPtRu–C. Fitting of this signal demonstrate that the Ru–C and commercial PtRu–C consists of 44% Ru oxide, while the labPtRu–C consist of 55% Ru oxide.
 | ||
| Fig. 5 XPS scans of the a) Pt 4f and b) Ru 3p binding energies for the comPtRu–C, labPtRu–C, Pt–C, and Ru–C. Dashed red line represents Pt(0) 4f7/2 at 71.1 eV. | ||
Electrochemical hydrodeoxygenation (EC-HDO) of phenol
EC-HDO experiments were performed using comPtRu–C, labPtRu–C, Pt–C, and Ru–C to establish a baseline for EC-HDO performance and study the effect of catalyst's composition. Fig. 6 shows the measured concentration profiles for phenol EC-HDO at a constant current of 55 mA cm−2 for the four electrocatalysts. Fig. S6† shows cyclic voltammograms collected before the experiments and half-cell potential data collected throughout the EC-HDO reactions and representative Nyquist plots including that of the background Vulcan carbon. The initial phenol concentration for all experiments was 30 ± 4 mM. All four electrocatalysts are active for the EC-HDO of phenol to cyclohexanol, cyclohexanone, and cyclohexane. After 4 hours of EC-HDO at constant current the major product for all four catalysts is cyclohexanol. This is consistent with previous reports on phenol EC-HDO using Pt–C and Ru–C catalysts.30,37,52,53 However, our studies measured cyclohexane concentrations for the comPtRu–C, labPtRu–C, Pt–C, and Ru–C after 4 hours reaction time to be 4.96, 8.47, 6.97 and 1.00 mM, respectively. It should be noted that when EC-HDO was run in the absence of inert gas flow, no cyclohexane was detected in the catholyte, likely due to the high vapor pressure of cyclohexane and its low solubility in water. Fig. S7† shows the product selectivity, carbon balance, and conversion for an experiment performed without gas purging. The carbon balance for this experiment is 65% indicating that the inert gas purge and solvent trap are necessary to accurately measure product composition during phenol EC-HDO. Under these conditions no benzene is detected in the GC-MS. Both bimetallic PtRu–C and mono-metallic Pt–C catalysts result in moderate yields of cyclohexanone at reaction times <3 hours. The mono-metallic Pt–C results in the highest concentration of 5.6 mM (26% selectivity) after 3 hours of reaction time. After an additional 2 hours of reaction time the concentration of cyclohexanone decreases to 2.0 mM, which indicates that it is likely a reaction intermediate. Notably, the concentration of cyclohexanone in the products after 4 hours of EC-HDO is 0.7 mM (selectivity 5%) using the Ru–C catalyst. This is significantly lower than the concentration of cyclohexanone using the mono- or bi-metallic Pt catalysts. | ||
| Fig. 6 Concentration profiles of phenol EC-HDO for a) comPtRu–C, b) labPtRu–C, c) Pt–C, and d) Ru–C (reaction conditions: 50 mL min−1 N2, 60 °C, 0.2 M perchloric acid, 0.2 mg cm−2, constant current 55 mA cm−2). | ||
Fig. 6b shows that the EC-HDO of phenol performed on labPtRu–C reaches 98% conversion after 3 hours of operation. The maximum concentration of 20.4 mM (70% selectivity) cyclohexanol is measured after 3 hours of operation. This observation combined with the phenol conversion being nearly 100% and the cyclohexane concentration continuing to increase, suggests that some cyclohexanol might be converted to cyclohexane. EC-HDO of phenol performed on the Pt–C catalyst (Fig. 6c) appears to reach maximum conversion after 3 hours of reaction. The phenol concentration decreases by 0.9 mM between 3 and 4 hours of reaction. Additionally, the specific ECH rate drops from 15.84 molproducts h−1 gmetal−1 after 1 hour to 5.64 molproducts h−1 gmetal−1 after 4 hours despite not reaching 100% phenol conversion. We hypothesize that this may be due to the poisoning of the Pt–C surface due to adsorption of dehydrated phenol. This is consistent with experiments performed by Singh et al. which showed that Pt catalysts are deactivated by the production of adsorbed dehydrated phenol at temperatures above 50 °C and phenol concentrations below 30 mM.32 A plot of specific EC-HDO and ECH rate as a function of reaction time is reported for the comPtRu–C, labPtRu–C, Pt–C, and Ru–C experiments in ESI-9.†
Table 2 shows phenol conversion, products' selectivity, TOF, specific EC-HDO and ECH rate, faradaic efficiency, and carbon balance for experiments performed using the comPtRu–C, labPtRu–C, Pt–C, Ru–C, and Vulcan carbon catalysts. Experiments using the labPtRu–C catalyst result in the highest phenol conversion of 100%, faradaic efficiency of 35%, and cyclohexane selectivity of 30.8%. Notably, the lab synthesized bi-metallic catalyst outperforms the comPtRu–C. The latter results in lower conversion (80%), faradaic efficiency (28%), and cyclohexane selectivity (28%). The monometallic Pt–C and Ru–C catalysts result in even lower conversion, faradaic efficiency and cyclohexane selectivity compared to the bimetallic PtRu–C catalysts. This suggests that there is synergy between the two metals. Experiments performed using the Ru–C catalyst reveal high selectivity toward cyclohexanol (84.2%). TOF and specific EC-HDO rates were calculated after 1 hour of reaction time to ensure equilibrium has not been reached, thereby serving as standard metrics for comparing catalyst activity. In terms of specific EC-HDO rate, the labPtRu–C results in the highest rate, followed by the comPtRu–C, Pt–C, and the Ru–C with 4.15, 5.05, 4.65, and 0.35 molcyclohexane h−1 gmetal−1, respectively. This trend is further supported by the TOF calculations where EC-HDO using labPtRu–C show the highest TOF followed by Pt–C, comPtRu–C, and Ru–C. This suggests that the bimetallic PtRu–C allows faster reaction rates compared to monometallic Pt–C or Ru–C and that the activity of Pt based electrocatalysts is significantly higher than that of Ru. Experiments performed with the carbon support without metal resulted in no detectable products.
| Catalyst | X (%) | S A (%) | S B (%) | S C (%) | TOF (h−1) | Specific EC-HDO rate (molcyclohexane h−1 gmetal−1) | Specific ECH rate (molproducts h−1 gmetal−1) | FE (%) | CB (%) | E (V vs. Ag/AgCl) |
|---|---|---|---|---|---|---|---|---|---|---|
| a Experiment performed at constant potential. b Reported potentials were iR correct post-experiment. | ||||||||||
| comPtRu–C | 77.7 | 28.0 | 60.3 | 11.7 | 253 | 4.15 | 19.92 | 25.7 | 88.9 | −0.47 |
| labPtRu–C | 100 | 30.8 | 68.2 | 1.1 | 611 | 5.05 | 23.52 | 35.1 | 95.4 | −0.47 |
| Pt–C | 87.4 | 24.9 | 60.8 | 14.3 | 485 | 4.65 | 15.84 | 32.7 | 90.4 | −0.49 |
| Ru–C | 41.6 | 10.5 | 84.2 | 5.3 | 117 | 0.35 | 4.65 | 10.9 | 91.5 | −0.59 |
| Ru–Ca | 12.6 | 18.2 | 73.5 | 7.5 | 60 | 0.27 | 0.33 | 5.1 | 99.2 | −0.46 |
| Vulcan C | 0 | — | — | — | — | — | — | 0 | 96.5 | −0.63 |
Based on these results the electrocatalyst activity trend for phenol EC-HDO is: labPtRu–C > comPtRu–C > Pt–C > Ru–C. Based on the characterization results the primary difference between the lab synthesized and commercial electrocatalyst is the support, metal particle size, and the oxidation states of Ru. BET results showed that the surface area of the lab synthesized electrocatalyst is approximately 60 m2 g−1 higher than the commercial. A higher active surface area would provide better contact with the reaction solution and may explain the higher activity of the catalyst. Additionally, the particle size of the labPtRu–C (2.5 nm) is larger than that of the comPtRu–C (2.2 nm). Previous reports on the EC-HDO of phenol using Pt–C catalysts have found an inverse relationship between particle size and TOF suggesting that the differences in particle size may be partially responsible for the difference in performance.37,75 XPS scans of the Ru 3p signal showed that a higher percentage of the Ru in the lab synthesized catalyst was Ru oxide. The oxidation state of the metal can influence the catalytic activity. However, before EC-HDO the electrode undergoes in situ electrochemical reduction, likely converting the surface oxides of Ru (RuOx) into metallic Ru. Thus, the oxidation state of the catalyst under EC-HDO conditions may be different than what was measured by ex situ XPS. As such we cannot draw accurate conclusions on the effect of Ru oxidation state on the catalyst performance.
The synergistic interaction between Pt and Ru was investigated by changing the ratio between both metals, while keeping the total metal loading constant. The top panels of Fig. 7 show the effect of catalyst composition on the phenol EC-HDO conversion, faradaic efficiency, and carbon balance. The results show that the addition of some Ru to the Pt catalyst results in higher conversion. Thus, the bimetallic catalysts containing 16.5% Ru possess the highest conversion (100%) and the highest faradaic efficiency (35%). However, the catalyst with very high Ru loading (above 30%) showed lower conversion and faradaic efficiency. The catalysts containing 50% and 100% Ru demonstrated only 47% and 12% conversion (at constant potential) respectively. This indicates that higher Ru contents are not beneficial for the EC-HDO reaction. The bottom panels of Fig. 7 show cyclohexane, cyclohexanol and cyclohexanone selectivity as a function of Ru content in the catalyst. The percentage loading of Ru in the bi-metallic catalyst has a direct effect on the product distribution from phenol EC-HDO. As the Ru loading increases the selectivity to cyclohexanol also increases with the mono-metallic Ru–C catalyst having the highest selectivity toward cyclohexanol (84.2%) compared to all the catalysts tested. The Ru loading also appears to have some effect on the cyclohexane selectivity. At low Ru loadings (8 and 16%) the selectivity to cyclohexane is high (higher than for the mono-metallic Pt–C catalyst). However, the cyclohexane selectivity decreases at Ru ratios higher than 30%. For the mono-metallic Ru–C the cyclohexane selectivity is only 10.5%. Based on the data presented in Fig. 7 it is difficult to draw conclusions on the role of Ru on cyclohexanone. Additionally, the results presented in Fig. 7 are included in Table S1† as well as data for specific EC-HDO rate and average potential with respect to catalyst Ru content.
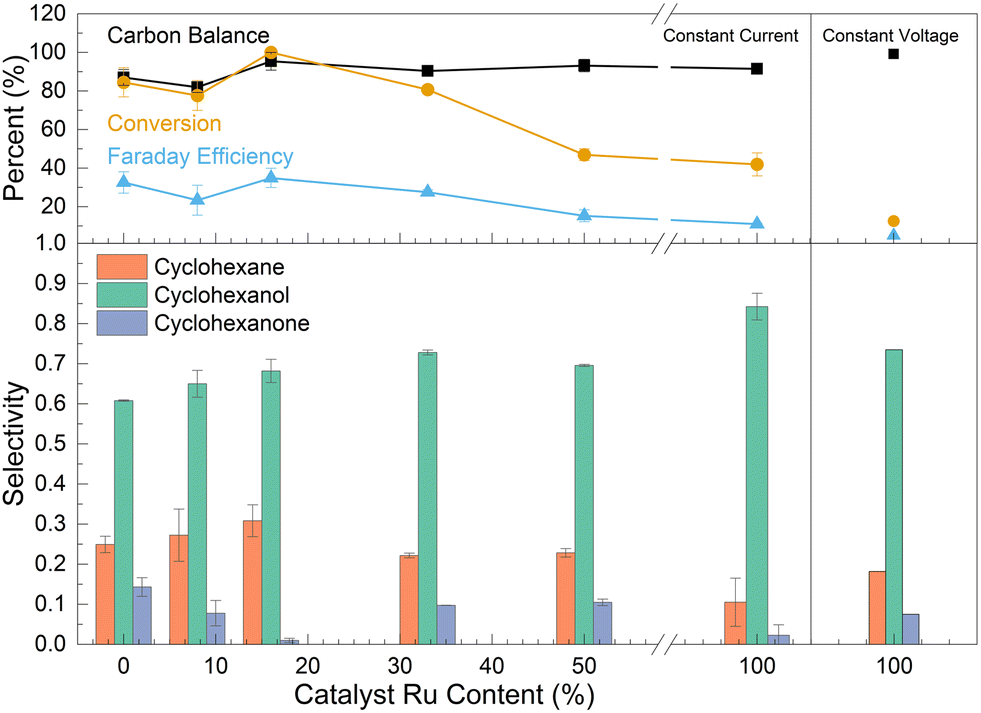 | ||
| Fig. 7 Top panel: Conversion, faradaic efficiency, and carbon balance as a function of Ru content in the catalyst. Bottom panel: Cyclohexane, cyclohexanol and cyclohexanone selectivity as a function of Ru content in the catalyst. All calculated after 4 hours of reaction time. Right two panels refer to data collected from the Ru–C experiment done at constant 0.46 V vs. Ag/AgCl (reaction conditions: 50 mL min−1 N2, 60 °C, 0.2 M perchloric acid, 0.2 mg cm−2, constant current 55 mA cm−2). | ||
Based on our experimental results a comprehensive understanding of the role of Ru on the catalyst and its mechanistic aspects is still unclear and more experiments are needed to provide more concrete conclusions. However, we can provide some hypothesis based on our results and others in literature. As discussed in the Introduction, studies on methanol oxidation suggests that the presence of Ru promotes the adsorption of methanol on the catalyst surface and facilitates the desorption of CO, mitigating catalyst poisoning.63,64,66,76 Similarly, in the context of phenol ECH, studies have indicated that dehydrated phenol species can poison Pt sites, hindering the catalytic performance.32,50 Thus, based on our experimental results, the existing literature on phenol ECH, and the insights from methanol fuel cell research, we hypothesize that the incorporation of Ru in the PtRu–C catalyst may contribute to the observed improvements through two potential mechanisms: a) promoting stronger adsorption of phenol (over water) on the catalyst surface, or b) weakening the adsorption of dehydrated phenol compounds, thereby reducing catalyst poisoning and enhancing the hydrodeoxygenation reactions. Furthermore, a recent study by Du et al. using density functional theory (DFT) calculations has provided additional evidence supporting the positive effects of Ru.36 Their findings indicate that the adsorption energy of phenol increases from 2.32 eV on Pt(111) to 2.49 eV on Pt3Ru(111), suggesting that the presence of Ru may indeed facilitate stronger adsorption of phenol on the catalyst surface. While these hypotheses offer some plausible explanations for the observed synergistic effects of Ru and Pt, further investigation is necessary to elucidate the precise mechanistic role of Ru in the PtRu–C catalyst for EC-HDO reactions.
The effect of half-cell potential on phenol EC-HDO was also studied and the results are shown in Fig. 8. There is a minor change in cyclohexane selectivity at higher overpotentials. The cyclohexane selectivity increases from 25.4% at −0.28 V vs. Ag/AgCl to 30% at −0.46 V vs. Ag/AgCl. Also, it is observed that faradaic efficiency decreases with half-cell potentials. Thus, at −0.28 V vs. Ag/AgCl the faradaic efficiency is 95% and decreases to 35% at −0.46 V vs. Ag/AgCl. That is explained by the fact that the HER is favored at higher overpotentials, which results in more HER, while the fraction of protons that are consumed by the desired EC-HDO reaction is lowered. Higher half-cell potential also leads to higher conversions. Thus, at −0.28 V vs. Ag/AgCl the phenol conversion is 55%, while at −0.46 V vs. Ag/AgCl the conversion increases to 100%, possibly due to the higher amount of hydrogen adsorbed on surface electrodes.
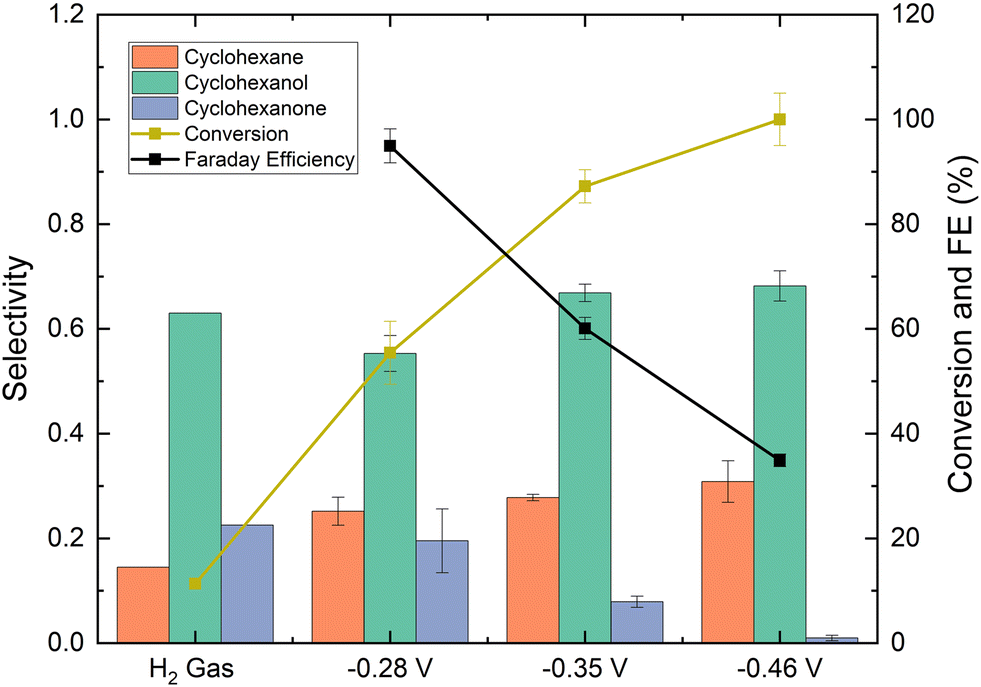 | ||
| Fig. 8 The effect of potential on conversion, faradaic efficiency, and product selectivity. For the experiment labeled “H2 gas”, gaseous H2 was fed into the cell (no potential was applied) (reaction conditions: labPtRu–C, 50 mL min−1 N2, 60 °C, 0.2 mg cm−2, constant potential). The average current densities reported for the −0.28 V, −0.35 V and −0.46 V vs. Ag/AgCl were 9 mA cm−2, 18 mA cm−2 and 54 mA cm−2. | ||
To further assess the effect of half-cell potential on phenol EC-HDO, we performed experiments using H2 gas as the source in the absence of an applied potential. H2 gas bubbled through the H-cell at a flow rate of 25 mL min−1 (equivalent of 3600 mA constant current water electrolysis). As shown in Fig. 8, after 4 hours of reaction the phenol conversion was 12% and the cyclohexane selectivity was 14%. The low conversion was likely due to the lack of adsorbed hydrogen on the catalyst surface. During EC-HDO reactions, surface-bound hydrogen forms through the reduction of protons with electrons on an active site. However, during thermochemical hydrogenation, hydrogen forms through the dissociation of H2 gas. Since H2 gas has a low solubility in water, therefore higher H2 pressures would likely be needed to reach similar phenol conversion levels as the EC-HDO. These were the only experiments where very minor benzene peaks was detected on the GC-MS. However, it was difficult to accurately quantify the benzene concentration.
Operando Raman spectroscopy
The data collected from the operando Raman spectroscopy for EC-HDO reactions is shown in Fig. 9. Low laser power was used in all the tests to avoid catalyst damage, therefore noisy signals and lower precision of peaks were expected. The data collected during EC-HDO reaction over the labPtRu–C are presented in low (Fig. 9a) and high (Fig. 9b) Raman shift regions. In Fig. 9a, the peaks at ∼463 cm−1 and ∼623 cm−1 and belong to ClO3, whereas the peak at ∼929 cm−1 corresponds to the ClO4− vibrations.77 These peaks originate from the presence of electrolyte (perchloric acid) and remain throughout the experimental scans. The dominant peaks at ∼1345 and ∼1594 cm−1 belong to the D-band and G-band of carbon from carbon black used as a support material in the electrocatalysts, respectively.78 This is also confirmed from the ex situ Raman spectra collected for the bare fresh labPtRu–C catalyst (Fig. S9a†). The vibration at ∼1004 cm−1 corresponds to the deformation and stretching modes of the unsaturated aromatic ring, respectively.79 The peak at ∼535 cm−1 corresponds to the vibration from the bending, and the bands at 815 and 1256 cm−1 correspond to the stretching of the hydroxyl group of phenol (Fig. S10a†).79 The stretches observed at ∼834, ∼1065 and ∼1162 cm−1 are attributed to the CH groups involved in the organic compound.79–81 Some minor shifts in these positions of CH stretches are observed with involvement of intermediates/products as the reaction proceeds. To further support that these peaks originate from the EC-HDO of phenol, Fig. S11† shows an experiment performed using the labPtRu–C in the absence of phenol where the cathodic potential was varied from 0 V vs. Ag/AgCl to −0.56 V vs. Ag/AgCl. The results of this experiment supported that none of the new identified bands were the result of HER or changes in the catalyst.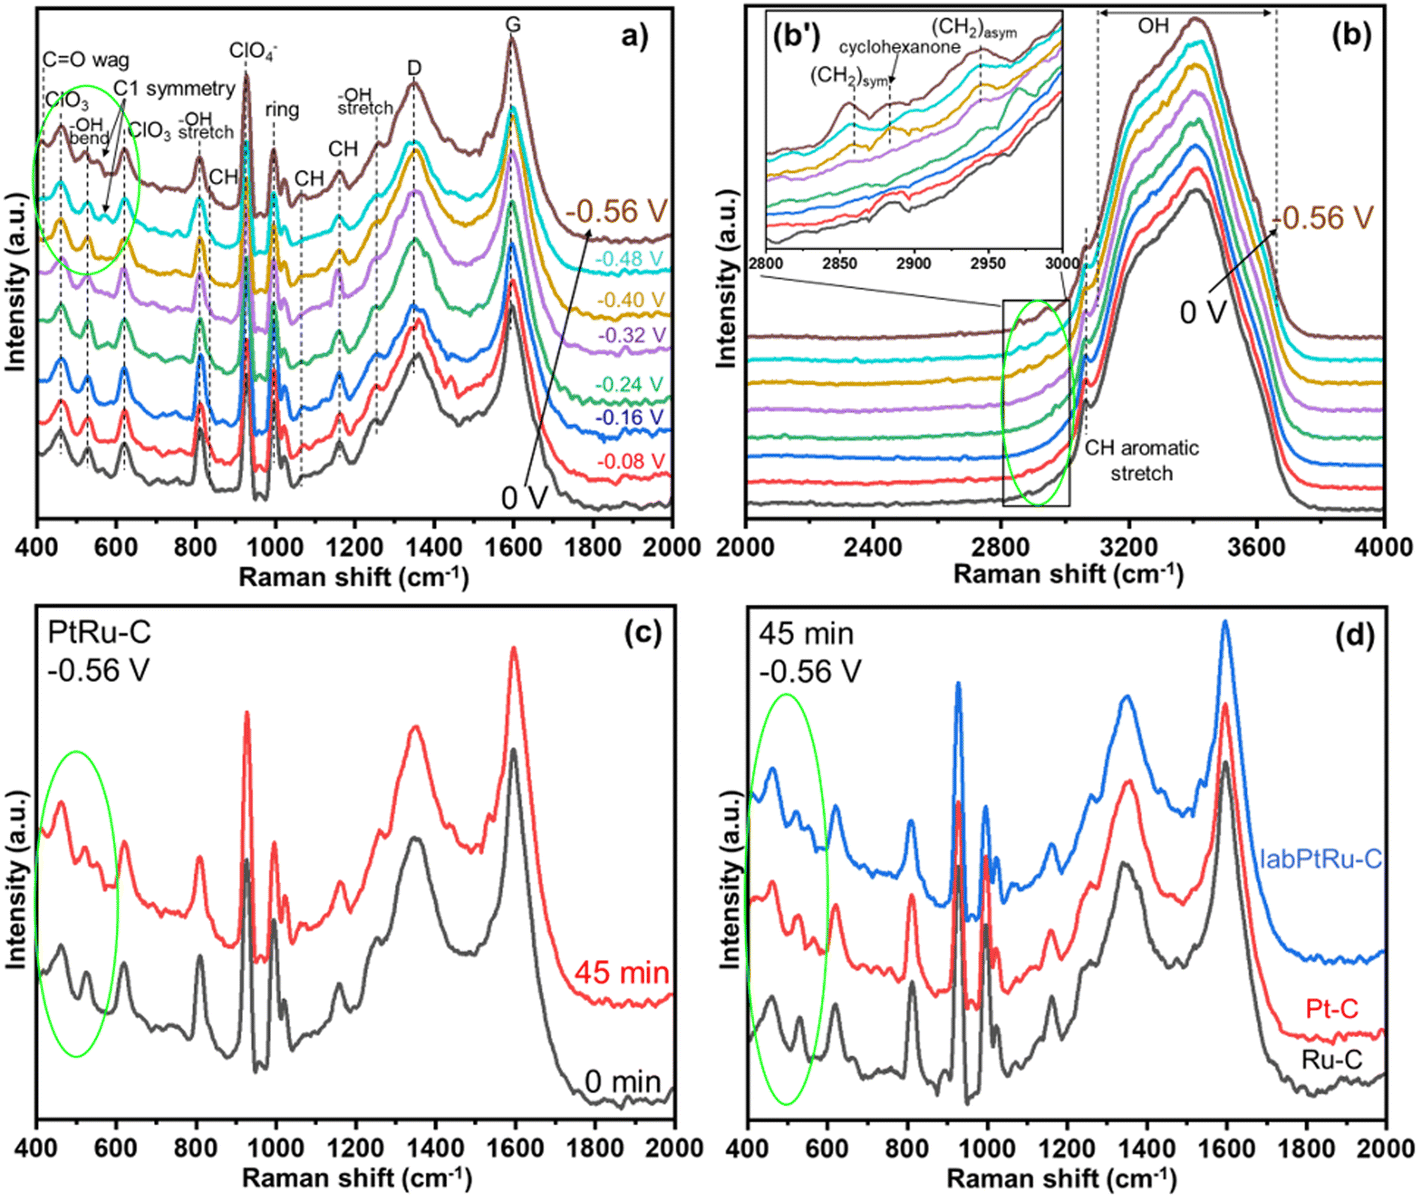 | ||
| Fig. 9 Operando Raman spectroscopy data for (a) EC-HDO on labPtRu–C catalyst with varying voltage at 400–2000 cm−1; (b) EC-HDO on labPtRu–C catalyst with varying voltage at 2000–4000 cm−1; (b′) inset highlights ring hydrogenation shifts at 2000–3000 cm−1 (c) EC-HDO on labPtRu–C catalyst at 0.56 V up to 45 min reaction time; and (d) EC-HDO on Ru–C, Pt–C and labPtRu–C catalysts at 0.56 V and 45 min reaction time. | ||
The spectra for 2000 to 4000 cm−1 Raman shift range are shown in Fig. 9b. A very broad range peak attributed to water from ∼3100 to ∼3650 cm−1 with involvement of OH bending and stretching mode was observed.82 Additionally, a peak was observed at ∼3062 cm−1 that corresponds to the CH aromatic group stretching and was present at all potentials.79 From Fig. 9b′ (inset), additional less intense bands were observed in the 2800–3000 cm−1 range. At higher potentials, three peaks were clearly observed at ∼2860, ∼2890 and ∼2942 cm−1. The broad peak at ∼2890 cm−1 matches the peak for cyclohexanone (Fig. S10b†), confirming that the EC-HDO reaction has proceeded and a ketone intermediate has been produced.81 The peaks at ∼2860 and ∼2942 cm−1 were attributed to the symmetric and asymmetric CH2 stretch.80 Interestingly, these peaks were also present both in cyclohexanol and cyclohexane (Fig. S10b†). The increased intensity and improved resolution of the peaks at higher half-cell potentials indicate that the EC-HDO reaction is progressing and support the co-existence of hydrogenation products such as cyclohexanone, cyclohexanol, and cyclohexane at or near the surface of the electrode. To further clarify, these peak positions are in agreement with the ex situ Raman spectra, separately collected for these compounds (Fig. S10†). Also, these findings for the EC-HDO activity of the labPtRu–C electrocatalyst, show that the intermediates (cyclohexanone and cyclohexanol) and the final products (cyclohexane) are present simultaneously after 45 min of operation time. From careful observation of Fig. 9b′, some deflections in the mentioned range were observed at lower voltages (<0.4 V vs. Ag/AgCl) but masked-up due to lower concentration of the species and the intense OH stretching. Referring back to Fig. 9a, the peaks at ∼409 and ∼560 cm−1 corresponding to the C![[double bond, length as m-dash]](https://www.rsc.org/images/entities/char_e001.gif) O wag and C1 point group symmetry for cyclohexanone are also observed from 0.4 V vs. Ag/AgCl.81 This pattern from 0.4 V vs. Ag/AgCl (and above) in Fig. 9a and b confirms the formation of cyclohexanone, cyclohexanol, and cyclohexane during the ECH reaction on the labPtRu–C catalyst.
O wag and C1 point group symmetry for cyclohexanone are also observed from 0.4 V vs. Ag/AgCl.81 This pattern from 0.4 V vs. Ag/AgCl (and above) in Fig. 9a and b confirms the formation of cyclohexanone, cyclohexanol, and cyclohexane during the ECH reaction on the labPtRu–C catalyst.
To prove this observation, an in situ experiment was performed at 0.56 V vs. Ag/AgCl for 0.75 hours and the obtained data are presented in Fig. 9c. The figure shows that the peaks at ∼409 and ∼560 cm−1 are clearly seen after 0.75 hours reaction time. The appearance of these peaks supports our hypothesis (Fig. 9a, b and b′ and activity data) that cyclohexanone, cyclohexanol, and cyclohexane co-exist in the electrolyte. Furthermore, a similar experiment at 0.56 V vs. Ag/AgCl for 0.75 hours was performed with mono-metallic Pt–C and Ru–C catalysts. The Raman spectra from these experiments are presented in Fig. 9d. The black spectrum corresponds to the EC-HDO of phenol on Ru–C catalyst and shows no peaks at ∼409 and ∼560 cm−1. This observation confirms the absence of cyclohexanone using Ru–C catalysts, which matches well with the results discussed in the EC-HDO of phenol section. In addition, the ECH of phenol on the Ru–C catalyst is studied at different potentials and the results are presented in Fig. S9b.† These results show that there is no appreciable evidence of cyclohexanol in any of the half-cell potentials investigated when Ru–C is used as the catalysts.
The red spectrum in Fig. 9d, is measured for phenol EC-HDO on the Pt–C catalyst. This spectrum clearly shows the presence of the CO wag and C1 peaks at ∼409 and ∼560 cm−1, respectively. The presence of these two peaks confirms that the EC-HDO of phenol reaction on Pt–C catalysts in perchloric acid solutions follows a mechanism that includes cyclohexanone formation. In addition, the reaction of interest on Pt–C catalysts has been studied at various half-cell potentials by in situ Raman spectroscopy and the results are presented in Fig. S9c.† This figure shows that cyclohexanone is only present at 0.56 V vs. Ag/AgCl. The Raman spectrum corresponding to EC-HDO of phenol on labPtRu–C is also added in Fig. 9d for comparison (see the blue curve). The comparison between the Raman spectra measured on the Pt–C and labPtRu–C catalysts, shows that there is a decreased resolution in the peaks at ∼409 and ∼560 cm−1 in the spectrum measured on the labPtRu–C catalyst. This finding indicates that the phenol EC-HDO reaction has higher conversion and selectivity using labPtRu–C catalyst, which can be attributed to the synergistic effect between Pt and Ru.
Based on these results and the absence of benzene observed during the EC-HDO of phenol we hypothesized that cyclohexanone, and possibly cyclohexanol, play an important role in the formation of cyclohexane through the reaction pathways shown in Fig. 10. To further elucidate this mechanism 30 mM cyclohexanone and cyclohexanol were individually subjected to constant potential electrolysis at −0.46 V vs. Ag/AgCl using the labPtRu–C catalyst. The concentration profiles for these experiments can be found in ESI-12.† These results indicated that cyclohexanone is readily converted to cyclohexanol and cyclohexane. However, the selectivity to cyclohexane is 3.3% which is much lower than that of phenol EC-HDO (31%), despite reaching 97.1% conversion after 4 hours. This suggests that while cyclohexanone is likely a direct intermediate for cyclohexanol production from phenol, it might not play a significant role to cyclohexane formation. The specific ECH rate of cyclohexanone conversion was 24.0 molproducts h−1 gmetal−1 similar to that of phenol EC-HDO using the labPtRu–C catalyst (23.53 molproducts h−1 gmetal−1). The EC-HDO of cyclohexanol resulted in near zero cyclohexane formation with the final concentration of cyclohexane after 4 hours of reaction time being 0.1 mM. These two results suggest that an additional intermediate may be responsible for the formation of cyclohexane. Based on literature and the Raman results described above we suggest that this intermediate may be cyclohex-3-enone or other partially hydrogenated ketones. This is supported by Yoon et al. whose DFT calculations indicated that the formation of cyclohexanone during aqueous phase hydrogenation of phenol proceeded through cyclohex-3-enone as an intermediate.41 Additionally, DFT calculations performed by Liu et al. found that deoxygenation of partially hydrogenated phenols is energetically more favorable than that of cyclohexanol or cyclohexanone.83
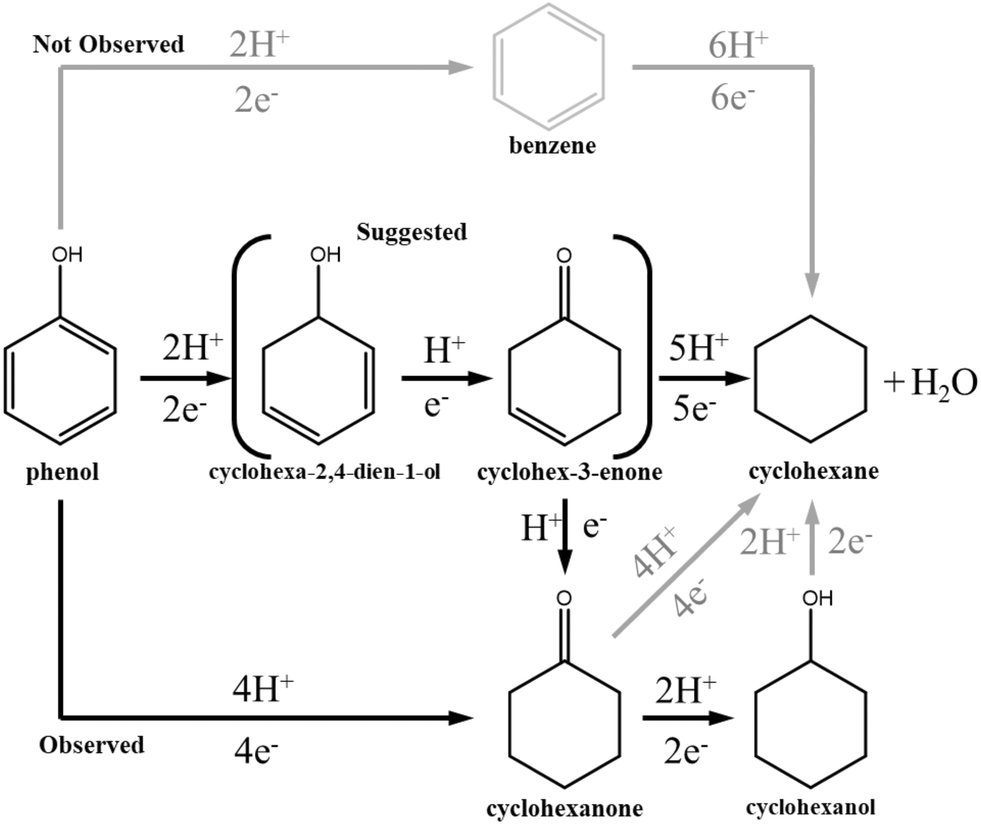 | ||
| Fig. 10 Proposed reaction pathway for the electrochemical conversion of phenol to cyclohexane and cyclohexanol. The suggested pathway for cyclohexane formation is through the cyclohex-3-enone (or some other unsaturated ketone) followed by deoxygenation. Cyclohexanol is likely formed through cyclohexanone. Both cyclohexanone and cyclohexanol can be converted to cyclohexane, however, they are grey as they do not produce appreciable yields of cyclohexane. The formation of cyclohexane through benzene is colored grey as it was not observed during the experiments. | ||
Although more work is needed to elucidate the key intermediate molecules that result in the formation of cyclohexane, based on the performed operando Raman spectroscopy at different potentials, as well as on the activity and selectivity data discussed above, it can still be concluded that the labPtRu–C catalyst results in increased EC-HDO of phenol. This observation outlines the potential of the bi-metallic PtRu–C electrocatalysts for the EC-HDO of biofuels.
Conclusions
In this work we studied the EC-HDO of phenol as an alternative to the traditional thermochemical upgrading HDO. Phenol EC-HDO was performed in a custom designed electrochemical “H-cell” with a solvent trap for cyclohexane detection. Pt, Ru, and bimetallic PtRu were synthesized on carbon black supports and compared to a comPtRu–C electrocatalyst. A comprehensive characterization has been performed using BET, ICP-OES, XRD, TEM, and XPS to reveal the physical, chemical, and morphological characteristics of the catalysts. Constant current and half-cell potential electrolysis experiments were conducted at 55 mA cm−1 and 0.28–0.46 V vs. Ag/AgCl to evaluate the electrocatalysts' activity, selectivity, and faradaic efficiency towards EC-HDO of phenol. In addition, in situ Raman spectroscopy has been performed to investigate the mechanism of EC-HDO on labPtRu–C, Pt–C, and Ru–C electrocatalysts. Based on the results we concluded that the order of electrocatalyst activity for ECH of phenol is: labPtRu–C > comPtRu–C > Pt–C > Ru–C. This order indicates synergy among Pt and Ru. The selectivity for ECH of phenol to cyclohexane conversion for the labPtRu–C was estimated to be 30%, which is one of the highest reported in literature to date. Constant potential electrolysis experiments revealed that higher potential resulted in higher EC-HDO rates, but lower faradaic efficiencies. A minor increase in cyclohexane selectivity was found at higher half-cell potentials. Operando Raman spectroscopy experiments showed that the presence of Pt in the electrocatalyst leads directly to the formation of a ketone intermediate. This study has contributed to knowledge on the EC-HDO of phenol using Pt and Ru mono- and bi-metallic electrocatalysts. We believe that this foundational work unlocks the path to incorporating electrochemical systems into the biofuel production process.Data availability
All data included in this study is available on request from the corresponding author.Conflicts of interest
The authors declare no conflict of interest.Acknowledgements
J. R. P. was partially funded by the Advanced Manufacturing for Energy Systems (AMES) fellowship at the University of Connecticut, funded by the US Department of Energy Advanced Manufacturing Office traineeship program, grant DE-EE0008302. Pacific Northwest National Laboratory is operated by Battelle for the U.S. Department of Energy and this material is based upon work supported in part by the U.S. Department of Energy Bioenergy Technologies Office (BETO) under project No. EE0009269. This work was done under the auspices of the WSU-PNNL Bioproducts Institute, which is a joint research collaboration of Washington State University and the U.S. Department of Energy's Pacific Northwest National Laboratory. T. K. acknowledges funding support from the National Science Foundation (NSF-CBET-2050824).References
- W. N. R. W. Isahak, M. W. M. Hisham, M. A. Yarmo and T. Y. Yun Hin, Renewable Sustainable Energy Rev., 2012, 16, 5910–5923 CrossRef CAS.
- A. O. Oyedun, M. Patel, M. Kumar and A. Kumar, in Chemical Catalysts for Biomass Upgrading, 2020, pp. 35–60 Search PubMed.
- L. Leng, H. Li, X. Yuan, W. Zhou and H. Huang, Energy, 2018, 161, 214–232 CrossRef CAS.
- B. Valle, A. Remiro, N. García-Gómez, A. G. Gayubo and J. Bilbao, J. Chem. Technol. Biotechnol., 2019, 94, 670–689 CrossRef CAS.
- S. Du, D. P. Gamliel, J. A. Valla and G. M. Bollas, J. Anal. Appl. Pyrolysis, 2016, 122, 7–12 CrossRef CAS.
- D. P. Gamliel, G. M. Bollas and J. A. Valla, Fuel, 2018, 216, 160–170 CrossRef CAS.
- D. P. Gamliel, S. Du, G. M. Bollas and J. A. Valla, Bioresour. Technol., 2015, 191, 187–196 CrossRef CAS PubMed.
- D. P. Gamliel, H. J. Cho, W. Fan and J. A. Valla, Appl. Catal., A, 2016, 522, 109–119 CrossRef CAS.
- L. Yu, A. Farinmade, O. Ajumobi, V. T. John and J. A. Valla, Energy Fuels, 2021, 35, 20117–20130 CrossRef CAS.
- D. P. Gamliel, S. Karakalos and J. A. Valla, Appl. Catal., A, 2018, 559, 20–29 CrossRef CAS.
- C. Torri, D. Fabbri, L. Garcia-Alba and D. W. F. Brilman, J. Anal. Appl. Pyrolysis, 2013, 101, 28–34 CrossRef CAS.
- D. P. Gamliel, B. P. Baillie, E. Augustine, J. Hall, G. M. Bollas and J. A. Valla, Microporous Mesoporous Mater., 2018, 261, 18–28 CrossRef CAS.
- S. Masoumi and A. K. Dalai, Energy Convers. Manage., 2021, 231, 113834 CrossRef CAS.
- J. R. Page, H. O. Leclerc, P. Smolitsky, J. P. Esposito, D. P. Theberge, A. Zaker, A. R. Maag, S. Sabnis, E. B. Ledford, J. Coleman, W. Fan, S. Wang, J. Q. Bond, B. Castro-Dominguez and M. T. Timko, ACS Sustainable Chem. Eng., 2022, 10, 5659–5673 CrossRef CAS.
- S. A. Akhade, N. Singh, O. Y. Gutiérrez, J. Lopez-Ruiz, H. Wang, J. D. Holladay, Y. Liu, A. Karkamkar, R. S. Weber, A. B. Padmaperuma, M.-S. Lee, G. A. Whyatt, M. Elliott, J. E. Holladay, J. L. Male, J. A. Lercher, R. Rousseau and V.-A. Glezakou, Chem. Rev., 2020, 120, 11370–11419 CrossRef CAS PubMed.
- G. Chen, L. Liang, N. Li, X. Lu, B. Yan and Z. Cheng, ChemSusChem, 2021, 14, 1037–1052 CrossRef CAS PubMed.
- J. R. Page, Z. Manfredi, S. Bliznakov and J. A. Valla, Materials, 2023, 16, 1–33 CrossRef PubMed.
- B. Zhang, J. Zhang and Z. Zhong, ACS Appl. Energy Mater., 2018, 1, 6758–6763 CrossRef CAS.
- Z. Li, S. Kelkar, L. Raycraft, M. Garedew, J. E. Jackson, D. J. Miller and C. M. Saffron, Green Chem., 2014, 16, 844–852 RSC.
- J. A. Lopez-Ruiz, Y. Qiu, E. Andrews, O. Y. Gutiérrez and J. D. Holladay, J. Appl. Electrochem., 2021, 51, 107–118 CrossRef CAS.
- W. Deng, K. Xu, Z. Xiong, W. Chaiwat, X. Wang, S. Su, S. Hu, J. Qiu, Y. Wang and J. Xiang, Energy Fuels, 2019, 33, 11292–11301 CrossRef CAS.
- S. Hansen, A. Mirkouei and L. A. Diaz, Renewable Sustainable Energy Rev., 2020, 118, 109548 CrossRef CAS.
- F. Menegazzo, P. Canton, F. Pinna and N. Pernicone, Catal. Commun., 2008, 9, 2353–2356 CrossRef CAS.
- K. Koh, U. Sanyal, M. S. Lee, G. Cheng, M. Song, V. A. Glezakou, Y. Liu, D. Li, R. Rousseau, O. Y. Gutiérrez, A. Karkamkar, M. Derewinski and J. A. Lercher, Angew. Chem., Int. Ed., 2020, 59, 1501–1505 CrossRef CAS PubMed.
- Y. Song, U. Sanyal, D. Pangotra, J. D. Holladay, D. M. Camaioni, O. Y. Gutiérrez and J. A. Lercher, J. Catal., 2018, 359, 68–75 CrossRef CAS.
- J. Anibal, A. Malkani and B. Xu, Catal. Sci. Technol., 2020, 10, 3181–3194 RSC.
- Y. P. Wijaya, T. Grossmann-Neuhaeusler, R. D. Dhewangga Putra, K. J. Smith, C. S. Kim and E. L. Gyenge, ChemSusChem, 2020, 13, 629–639 CrossRef CAS PubMed.
- Y. Philip Wijaya, R. D. D. Putra, K. J. Smith, C. Soo Kim and E. L. Gyenge, ACS Sustainable Chem. Eng., 2021, 9, 13164–13175 CrossRef.
- Z. Gu, Z. Zhang, N. Ni, C. Hu and J. Qu, Environ. Sci. Technol., 2022, 56, 4356–4366 CrossRef CAS PubMed.
- M. Garedew, D. Young-Farhat, J. E. Jackson and C. M. Saffron, ACS Sustainable Chem. Eng., 2019, 7, 8375–8386 CrossRef CAS.
- K. Sasaki, A. Kunai, J. Harada and S. Nakabori, Electrochim. Acta, 1983, 28, 671–674 CrossRef CAS.
- N. Singh, Y. Song, O. Y. Gutiérrez, D. M. Camaioni, C. T. Campbell and J. A. Lercher, ACS Catal., 2016, 6, 7466–7470 CrossRef CAS.
- U. Sanyal, K. Koh, L. C. Meyer, A. Karkamkar and O. Y. Gutiérrez, J. Appl. Electrochem., 2021, 51, 27–36 CrossRef CAS.
- K. Amouzegar and O. Savadogo, Electrochim. Acta, 1994, 39, 557–559 CrossRef CAS.
- W. D. Bancroft and A. B. George, J. Electrochem. Soc., 1930, 57, 399–406 CrossRef.
- Y. Du, X. Chen and C. Liang, Mol. Catal., 2023, 535, 112831 CrossRef CAS.
- I. Barth, J. Akinola, J. Lee, O. Y. Gutiérrez, U. Sanyal, N. Singh and B. R. Goldsmith, Chem. Phys., 2022, 156, 1–11 Search PubMed.
- K. Amouzegar and O. Savadogo, J. Appl. Electrochem., 1997, 27, 539–542 CrossRef CAS.
- R. Wu, Q. Meng, J. Yan, H. Liu, Q. Zhu, L. Zheng, J. Zhang and B. Han, J. Am. Chem. Soc., 2022, 144, 1556–1571 CrossRef CAS PubMed.
- S. Mao, Z. Wang, Z. Chen, K. Wu, K. Zhang, Q. Li, H. Yan, G. Lü, G. Huang and Y. Wang, Nano Mater. Sci., 2023, 5, 91–100 CrossRef CAS.
- Y. Yoon, R. Rousseau, R. S. Weber, D. Mei and J. A. Lercher, J. Am. Chem. Soc., 2014, 136, 10287–10298 CrossRef CAS PubMed.
- A. S. May and E. J. Biddinger, ACS Catal., 2020, 10, 3212–3221 CrossRef CAS.
- P. Nilges and U. Schröder, Energy Environ. Sci., 2013, 6, 2925–2931 RSC.
- A. S. May and E. J. Biddinger, ACS Catal., 2020, 10, 3212–3221 CrossRef CAS.
- A. S. May and E. J. Biddinger, Energy Fuels, 2022, 36, 11001–11011 CrossRef CAS.
- A. S. May and E. J. Biddinger, Green Chem., 2023, 25, 8687–8697 RSC.
- B. Zhao, Q. Guo and Y. Fu, Electrochemistry, 2014, 82, 954–959 CrossRef CAS.
- W. Liu, W. You, Y. Gong and Y. Deng, Energy Environ. Sci., 2020, 13, 917–927 RSC.
- L. L. Miller and L. Christensen, J. Org. Chem., 2002, 43, 2059–2061 CrossRef.
- Y. Song, O. Y. Gutiérrez, J. Herranz and J. A. Lercher, Appl. Catal., B, 2016, 182, 236–246 CrossRef CAS.
- J. A. Lopez-Ruiz, E. Andrews, S. A. Akhade, M.-S. Lee, K. Koh, U. Sanyal, S. F. Yuk, A. J. Karkamkar, M. A. Derewinski, J. Holladay, V.-A. Glezakou, R. Rousseau, O. Y. Gutiérrez and J. D. Holladay, ACS Catal., 2019, 9, 9964–9972 CrossRef CAS.
- U. Sanyal, J. Lopez-Ruiz, A. B. Padmaperuma, J. Holladay and O. Y. Gutiérrez, Org. Process Res. Dev., 2018, 22, 1590–1598 CrossRef CAS.
- E. Andrews, J. A. Lopez-Ruiz, J. D. Egbert, K. Koh, U. Sanyal, M. Song, D. Li, A. J. Karkamkar, M. A. Derewinski, J. Holladay, O. Y. Gutiérrez and J. D. Holladay, ACS Sustainable Chem. Eng., 2020, 8, 4407–4418 CrossRef CAS.
- L. Li, G. Zhang, B. Wang, T. Yang and S. Yang, J. Mater. Chem. A, 2020, 8, 2090–2098 RSC.
- Z. Wang, S. D. Young, B. R. Goldsmith and N. Singh, J. Catal., 2021, 395, 143–154 CrossRef CAS.
- K. Dong, H. Pu, T. Zhang, H. Dai, X. Zhao, L. Zhou, K. Wang, Y. Wang and Y. Deng, J. Alloys Compd., 2022, 905, 164231 CrossRef CAS.
- A. Rodríguez-Gómez, E. Lepre, L. Sánchez-Silva, N. López-Salas and A. R. de la Osa, J. Energy Chem., 2022, 66, 168–180 CrossRef.
- S. C. Zignani, V. Baglio, D. Sebastián, S. Siracusano and A. S. Aricò, Electrochim. Acta, 2016, 191, 183–191 CrossRef CAS.
- G. A. Camara, R. B. De Lima and T. Iwasita, Electrochem. Commun., 2004, 6, 812–815 CrossRef CAS.
- H. Li, G. Sun, L. Cao, L. Jiang and Q. Xin, Electrochim. Acta, 2007, 52, 6622–6629 CrossRef CAS.
- A. Sayadi and P. G. Pickup, ECS Trans., 2020, 97, 869–875 CrossRef CAS.
- E. Antolini, Mater. Chem. Phys., 2003, 78, 563–573 CrossRef CAS.
- W. Qiao, X. Huang and L. Feng, Chin. J. Struct. Chem., 2022, 41, 2207016–2207034 CAS.
- L. Dubau, F. Hahn, C. Coutanceau, J. M. Léger and C. Lamy, J. Electroanal. Chem., 2003, 554–555, 407–415 CrossRef CAS.
- T. Iwasita, H. Hoster, A. John-Anacker, W. F. Lin and W. Vielstich, Langmuir, 2000, 16, 522–529 CrossRef CAS.
- S. L. Gojković, T. R. Vidaković and D. R. Durović, Electrochim. Acta, 2003, 48, 3607–3614 CrossRef.
- A. K. Shukla, A. S. Arico, K. M. El-Khatib, H. Kim, P. L. Antonucci and V. Antonucci, Appl. Surf. Sci., 1999, 137, 20–29 CrossRef CAS.
- Y. J. Zhang, A. Maroto-Valiente, I. Rodriguez-Ramos, Q. Xin and A. Guerrero-Ruiz, Catal. Today, 2004, 93–95, 619–626 CrossRef CAS.
- G. Bergeret and P. Gallezot, in Handbook of Heterogeneous Catalysis, 2008, pp. 738–765 Search PubMed.
- X. Zhang and K. Y. Chan, Chem. Mater., 2003, 15, 451–459 CrossRef CAS.
- S. Zhang, Y. Shao, G. Yin and Y. Lin, Appl. Catal., B, 2011, 102, 372–377 CrossRef CAS.
- W. Cai, Y. F. Jiang, J. Zhang, H. Yang, J. Zhang, C. Q. Xu, W. Liu, J. Li and B. Liu, Chem Catal., 2022, 2, 1764–1774 CrossRef CAS.
- D. D. Sarma and C. N. R. Rao, J. Electron Spectrosc. Relat. Phenom., 1980, 20, 25–45 CrossRef CAS.
- E. Antolini, L. Giorgi, F. Cardellini and E. Passalacqua, J. Solid State Electrochem., 2001, 5, 131–140 CrossRef CAS.
- U. Sanyal, Y. Song, N. Singh, J. L. Fulton, J. Herranz, A. Jentys, O. Y. Gutiérrez and J. A. Lercher, ChemCatChem, 2019, 11, 575–582 CrossRef CAS.
- E. Antolini, Mater. Chem. Phys., 2003, 78, 563–573 CrossRef CAS.
- C. I. Ratcliffe and D. E. Irish, Can. J. Chem., 1984, 62, 1134–1144 CrossRef CAS.
- A. Pophali, K. M. Lee, L. Zhang, Y. C. Chuang, L. Ehm, M. A. Cuiffo, G. P. Halada, M. Rafailovich, N. Verma and T. Kim, Chem. Eng. J., 2019, 373, 365–374 CrossRef CAS.
- H. W. Wilson, W. R. MacNamee and J. R. Durig, J. Raman Spectrosc., 1981, 11, 252–254 CrossRef CAS.
- P. Neelakantan, Proc. Natl. Acad. Sci. India A, 1963, 57, 94–102 CrossRef CAS.
- H. Fuhrer, V. B. Kartha, P. J. Krueger, H. H. Mantsch and R. N. Jones, Chem. Rev., 1972, 72, 439–456 CrossRef CAS.
- X. Xue, Z. Z. He and J. Liu, J. Raman Spectrosc., 2013, 44, 1045–1048 CrossRef CAS.
- D. Liu, G. Li, F. Yang, H. Wang, J. Han, X. Zhu and Q. Ge, J. Phys. Chem. C, 2017, 121, 12249–12260 CrossRef CAS.
Footnote |
| † Electronic supplementary information (ESI) available. See DOI: https://doi.org/10.1039/d4cy00634h |
| This journal is © The Royal Society of Chemistry 2024 |