
 Open Access Article
 This Open Access Article is licensed under a
 Creative Commons Attribution 3.0 Unported Licence
Structure–reactivity relations in Cu/ZrO2 catalysed glycerol dehydration to acetol in continuous flow†
Jaime
Mazarío
 a,
Deshetti
Jampaiah
b,
Patricia
Concepción
a,
Pablo
Villasante-Iturria
a,
Karen
Wilson
c,
Adam
Lee
c and
Marcelo E.
Domine
*a
a,
Deshetti
Jampaiah
b,
Patricia
Concepción
a,
Pablo
Villasante-Iturria
a,
Karen
Wilson
c,
Adam
Lee
c and
Marcelo E.
Domine
*a
aInstituto de Tecnología Química (UPV – CSIC), Universitat Politècnica de Valéncia, Consejo Superior de Investigaciones Científicas, Avda. Los Naranjos S/N, 46022, Valencia, Spain. E-mail: mdomine@itq.upv.es
bSchool of Science, RMIT University, Melbourne, VIC3000, Australia
cCentre for Catalysis and Clean Energy, School of Environment and Science, Griffith University, Gold Coast, QLD 4222, Australia
First published on 9th May 2024
Abstract
The selective dehydration of glycerol to hydroxyacetone (acetol) was studied in a continuous flow fixed-bed reactor with CuO supported on monoclinic (m-) or tetragonal (t-) ZrO2 nanoparticles. Catalysts were characterised by ICP, N2 physisorption, powder XRD, HR-TEM and SEM-EDS, N2O titration, and NH3- and CO2-TPD. Quasi-in situ XPS reveals the impact of zirconia phase on copper speciation, with m-ZrO2 preferentially stabilising Cu(I) species, whose presence correlates with enhanced catalytic performance. In situ FTIR of 1,2-propanediol and glycerol evidenced Cu(I) promote desorption of a C![[double bond, length as m-dash]](https://www.rsc.org/images/entities/char_e001.gif) O containing intermediate. Solvent selection strongly influenced catalyst reactivity, with methanol less prone to competitive adsorption than water, and favouring the genesis of Cu(I) species. Cu/m-ZrO2 achieved 60% yield of the desired acetol at 240 °C, maintaining ≥50% yield over three consecutive regeneration cycles, being one of the most efficient catalysts based on earth abundant metals for continuous glycerol dehydration to acetol under the present conditions.
O containing intermediate. Solvent selection strongly influenced catalyst reactivity, with methanol less prone to competitive adsorption than water, and favouring the genesis of Cu(I) species. Cu/m-ZrO2 achieved 60% yield of the desired acetol at 240 °C, maintaining ≥50% yield over three consecutive regeneration cycles, being one of the most efficient catalysts based on earth abundant metals for continuous glycerol dehydration to acetol under the present conditions.
1. Introduction
The limited supply, unequal distribution, and rising emissions from fossil fuels associated with anthropogenic climate change are driving the urgent global search for cleaner and renewable feedstocks for energy and chemicals production.1,2 Biomass, particularly that derived from waste or non-edible plant or algal sources, is the only feasible alternative for the large-scale and sustainable production of chemicals that underpin modern society.3–6 One consequence of efforts to decarbonise the energy sector at the end of the 20th century was the rise in biodiesel use, marketed as a ‘low carbon’ liquid transportation fuel, and an abundance of bio-derived glycerol as the main by-product of commercial transesterification processes. In recent years, biodiesel production has shifted to the hydrotreating of non-edible vegetable oils, waste cooking oils and animal fats, to minimize land use change and associated environmental impacts.7–9 Nonetheless, transesterification remains the dominant commercial route to biodiesel, and there is hence a strong driver to valorise the glycerol by-product to improve biorefinery profitability.10Glycerol transformation to higher value oxygenated chemicals has been extensively studied by catalytic processes, including glycerol carbonate synthesis,11 acrolein synthesis,12 steam reforming,13 glycerol hydrogenolysis,14 and acetalisation, etherification or esterification.15 Consequently, glycerol is regarded as an important platform chemical from which to synthesise bioderived chemicals, notably acetol, a reactive compound for the manufacture of acetic acid,16 lactic acid17 and N-heterocycles.18 Acetol is also an intermediate in the production of propylene glycol, with glycerol dehydration being the rate-limiting step.19,20 Improved fundamental insight and catalyst formulations for selective glycerol dehydration to acetol would thus offer significant techno-economic benefits, and a contribution to meeting 2030 UN SDGs.21 To our knowledge, a reactive distillation system employing copper chromite has proven the most effective,22 but suffers from toxicity and scalability issues. More benign heterogeneous catalysts are reported under continuous flow operation, with copper outperforming monofunctional acid or base catalysts at low temperatures as an energy-efficient and cost-effective option. However, copper metal is often combined with acidic/basic supports, with the resulting bifunctional catalysts active for acetol formation under N2 or H2 atmospheres.
High Cu loading catalysts are reported for glycerol conversion to acetol in the absence of H2, with Sato et al. observing yields close to 90% at 250 °C using a 30 wt% glycerol aqueous solution and Cu–Al2O3 catalyst (Cu![[thin space (1/6-em)]](https://www.rsc.org/images/entities/char_2009.gif) :Al molar ratio = 3:2) prepared by co-precipitation.23 Another Cu:Al (1:1 molar ratio) mixed oxide showed good selectivity to acetol (∼50%) and stability, remaining active for 400 h at 220 °C under 20 bar N2.24,25 La2CuO4 is also an effective catalyst (acetol yield of 76 mol%), albeit using pure glycerol in the vapour phase at 280 °C.26 Unfortunately, the preceding Cu:Al mixed oxide deactivated by coke deposition and copper sintering, while La2CuO4 is incompatible with water and requires glycerol vaporisation at temperatures ≥280 °C before introducing it to a N2 inlet stream. Batiot-Dupeyrat reported a CuMgF2 catalyst containing only 5 wt% Cu able to yield 40% acetol at 260 °C.27 We recently developed a Cu–MgAl mixed oxide catalyst with 10 wt% Cu able to convert glycerol to acetol with 40% yield at 240 °C. Although this catalyst required a dilute (10 wt%) glycerol/MeOH mix, it could perform multiple 9 h reactions with thermal regeneration.28 A CuO/SiO2 catalyst, with improved copper oxide dispersion, shows higher activity (∼60% acetol yield at 240 °C) with a lower Cu loading under more challenging conditions (50 wt% glycerol in MeOH).29 Despite these promising demonstrations, continuous flow glycerol dehydration to acetol remains in its infancy. Copper appears essential for operation at temperatures <300 °C, but there is no consensus on the reaction mechanism or the nature of the active Cu species. Previous studies indicate Cu(I) as the most active oxidation state, and that support acidity regulates glycerol conversion.28,29 The ultimate target is a high and stable yield of acetol from a concentrated glycerol solution at low temperature, in the absence of hydrogen and using low copper loadings.
:Al molar ratio = 3:2) prepared by co-precipitation.23 Another Cu:Al (1:1 molar ratio) mixed oxide showed good selectivity to acetol (∼50%) and stability, remaining active for 400 h at 220 °C under 20 bar N2.24,25 La2CuO4 is also an effective catalyst (acetol yield of 76 mol%), albeit using pure glycerol in the vapour phase at 280 °C.26 Unfortunately, the preceding Cu:Al mixed oxide deactivated by coke deposition and copper sintering, while La2CuO4 is incompatible with water and requires glycerol vaporisation at temperatures ≥280 °C before introducing it to a N2 inlet stream. Batiot-Dupeyrat reported a CuMgF2 catalyst containing only 5 wt% Cu able to yield 40% acetol at 260 °C.27 We recently developed a Cu–MgAl mixed oxide catalyst with 10 wt% Cu able to convert glycerol to acetol with 40% yield at 240 °C. Although this catalyst required a dilute (10 wt%) glycerol/MeOH mix, it could perform multiple 9 h reactions with thermal regeneration.28 A CuO/SiO2 catalyst, with improved copper oxide dispersion, shows higher activity (∼60% acetol yield at 240 °C) with a lower Cu loading under more challenging conditions (50 wt% glycerol in MeOH).29 Despite these promising demonstrations, continuous flow glycerol dehydration to acetol remains in its infancy. Copper appears essential for operation at temperatures <300 °C, but there is no consensus on the reaction mechanism or the nature of the active Cu species. Previous studies indicate Cu(I) as the most active oxidation state, and that support acidity regulates glycerol conversion.28,29 The ultimate target is a high and stable yield of acetol from a concentrated glycerol solution at low temperature, in the absence of hydrogen and using low copper loadings.
Zirconia is well-known to exist as monoclinic and tetragonal polymorphs, which are kinetically stable at room temperature and widely used as catalyst supports or catalysts in their own right.30,31 Literature reports indicate that these polymorphs exhibit distinct acid–base properties and hence catalytic reactivity in e.g. ketonisation32 and cyclodehydration.33 Studies using small probe molecules such as NH3, CO and CO2 have demonstrated a higher concentration of surface hydroxyl groups, stronger Lewis acidity (of Zr4+ cations) and stronger Lewis basicity (of O2− anions) for m-ZrO2.34–36 However, a recent study using a pyridine probe suggests a similar concentration of Lewis acid sites for both polymorphs,37 albeit of higher strength for t-ZrO2, while another reports a significantly higher concentration of acid sites for t-ZrO2 than m-ZrO2.38 The lack of consensus may reflect the variation in synthetic protocol (e.g. choice of precursors, precipitants and thermal processing)39–41 and strong influence of trace impurities (such as yttrium37) on the tetragonal phase stability. Chimentão and co-workers had studied Cu/t-ZrO2 for the batch-wise dehydration of glycerol to acetol, proposing interfacial Cu–Zr sites as key active centers for reaction.42,43 Nevertheless, further investigations are necessary to understand the entire reaction mechanism, the role of catalytic active sites, and whether there may be a role of the ZrO2 polymorph used as support.
Herein, we report the liquid phase, continuous flow dehydration of glycerol to acetol of Cu/ZrO2, and the impact of the support phase on catalytic performance and reaction mechanism. ZrO2 catalyst surface containing the monoclinic phase generates a greater amount of Cu(I) species when glycerol is present, this being related to its highest specific activity towards acetol. This finding also reinforces our previous suggestion that Cu(I) sites are the most crucial species for an efficient Cu-based catalyst aimed at selectively dehydrating glycerol to acetol. Overall, this study highlights several fundamental aspects of the CuO/ZrO2 catalyst system and its mode of action, with important implications for developing more efficient and effective catalysts in the future.
2. Experimental
2.1 Materials
Glycerol (Sigma-Aldrich, 99.5%) was used as reactant. For liquid reaction mixture analyses and in situ experiments, acetol (90%), methyl glycolate (99%), methyl lactate (98%), acetoin (98%), acrolein dimethyl acetal (98%), acetic acid (99%), propionic acid (99.5%), 1,2-propanediol (99.5%), methyl acetate (98%), glyceraldehyde (98%), anhydrous pyridine (99.8%), chlorobenzene (99.9%) and 1,4-butanediol (99%) were supplied by Sigma-Aldrich and used as received. Methanol (99.9%), acetone (99.8%) and hexane (96%) from Scharlab and Milli-Q water (Millipore) were used as solvents. Abelló-Linde S.A. supplied a GC calibration gas mixture (CO, CO2, CH4, C2H4 and H2 in N2), and pure H2, NH3, N2O, CO and CO2. ZrO2 provided by Chempur was calcined at 250 °C for 3 h (heating rate = 3 °C min−1) to remove contaminants. Cu(NO3)2·2.5H2O (99.99%) from Sigma-Aldrich was used as a copper precursor. CuO (>99%) and Cu2O (>99.99%) standards for XPS fitting were supplied by Sigma.2.2 Catalyst preparation
Catalysts were prepared by dispersing copper on m- and t-ZrO2 supports, and a physical mixture of both (60% m-ZrO2:40% t-ZrO2 by weight) designated mxt-ZrO2, by incipient wetness impregnation. The saturation pore volume of each support was first estimated by milli-Q water addition, and the appropriate mass of Cu(NO3)2·2.5H2O dissolved in milli-Q water for a nominal 5.0 wt% Cu loading. This copper solution was then added to each support under stirring, and the resulting slurries then dried at 100 °C for 16 h prior to calcination at 550 °C under static air for 6 h (heating rate 3 °C min−1). Catalysts are designated Cu/m-ZrO2, Cu/t-ZrO2 and Cu/mxt-ZrO2, respectively.
2.3 Catalyst characterization
:1:1 by volume). Thermogravimetric analysis (TGA) and elemental analysis (EA) were also performed to evaluate the organic content post-reaction. TGA was conducted in a Mettler Toledo TGA/SDTA 851 apparatus, with a heating rate of 10 °C min−1 under flowing air. For EA, a Fisons EA1108CHN-S analyser was used, with a sulfanilamide reference.
:total Cu atoms, was calculated by normalising the μmols of H2 consumed in the second reduction (MH2, μmols of H2 per g of catalyst) by the μmols of Cu determined by ICP (MCu, μmol of Cu per g of catalyst):Copper surface area
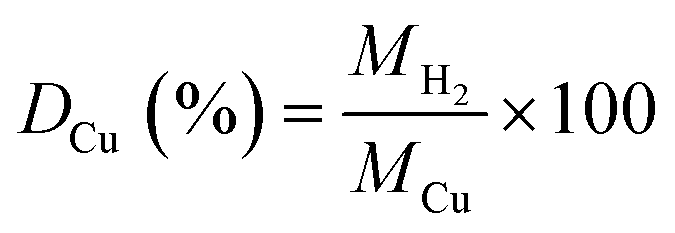
 was calculated according to:
where MH2, SF, NA, CM, and WCu are the μmoles of H2 consumed per mass of catalyst, stoichiometric factor (1 for the reduction of CuO), Avogadro's number (6.022 × 10²³ mol−1), number of Cu atoms per surface area (1.46 × 10¹⁹ atoms per m2) and Cu loading in wt%, respectively. Assuming a spherical morphology, and density of copper ρ of 8.92 g cm−3, the average diameter of Cu particles (

 ) can be estimated according to:
2.4 Catalytic tests
Catalytic experiments for glycerol dehydration were performed in a down flow, stainless steel fixed-bed reactor (25 cm × 0.5 cm internal diameter), with ∼500 mg pelletised catalyst (0.425–0.600 mm diameter) mixed with SiC particles (0.600–0.800 mm) as an inert diluent. The liquid feed was typically a 50:50 by weight mix of glycerol and methanol (MeOH), flowing at 2.0 mL h−1, through the catalyst bed at 240 °C (Fig. S1†). No additional diluent gas was used. Computational simulations to ascertain the physical state and assure feed homogeneity during operation have previously been reported.29 Data collection began when the first drop of liquid was observed at the reactor outlet. Cumulative fractions (representing products formed between e.g. 1–2 h reaction) were collected in a glass vessel in an ice bath; the fraction for 0–1 h reaction was deemed influence by reactor induction/stabilisation and hence disregarded. Control experiments confirmed that reactor operation was free from diffusion limitations (Fig. S2†).
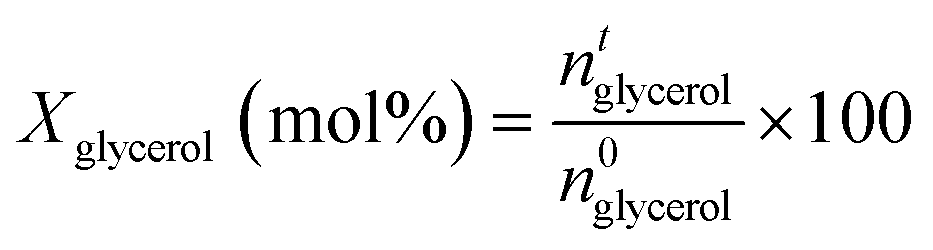
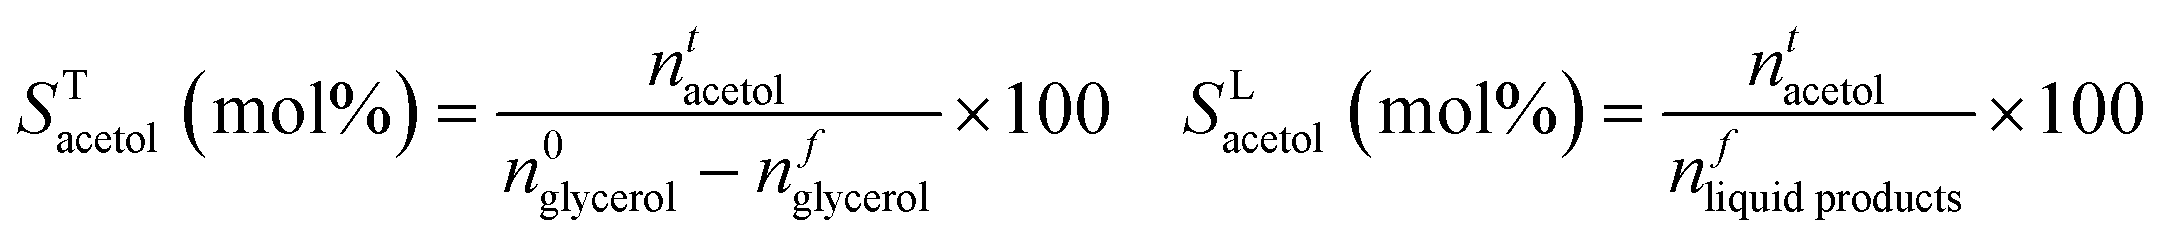
Two gas chromatographs were used to study liquid products. Non-polar compounds and acetol were determined using an Agilent Technologies 7890 A GC with a flame-ionisation detector (FID) and HP-5 MS capillary column (30 m × 250 μm × 0.25 μm). Polar compounds were determined using a Varian CP-3800 with a FID and CARBOWAX capillary column (15 m × 3.2 mm × 0.25 μm film thickness). Representative chromatograms are shown in Fig. S3 and S4.† In both cases internal standards were employed for quantification: chlorobenzene (1 wt% in MeOH) for the HP-5 column; and 1,4-butanediol (1.5 wt% in MeOH) for the CARBOWAX column. Product identification was confirmed by GC-MS using an Agilent 6890 N GC system with HP-5 capillary column, connected to an Agilent 5973 N detector. As previously described, silylation was used to identify some polar compounds by means of an MS detector.29 In selected experiments, the gas fraction was also analysed on a multichannel GC equipped with: a 1.8 m 5A molecular sieve column (with Ar as carrier) and a TCD for H2; a 0.8 m 13X molecular sieve column (with He as carrier) and a second TCD for N2, CO and CO2; and a 50 m Al2O3 column (with He as carrier) and a FID detector for hydrocarbons. Glycerol conversion (X) and the yield (Yi), and selectivity (Si) of product (i) were calculated by analysis of collected fractions from cumulative reaction times (t):
where ai the stoichiometric correction factor for product i. Note that polyglycerols, detected at low conversion, are believed the result of glycerol condensation in the GC injector rather than a reaction product, and hence considered as glycerol. Product selectivity was calculated considering both the glycerol converted (STi) and the total amount of products in the liquid fraction (SLi):

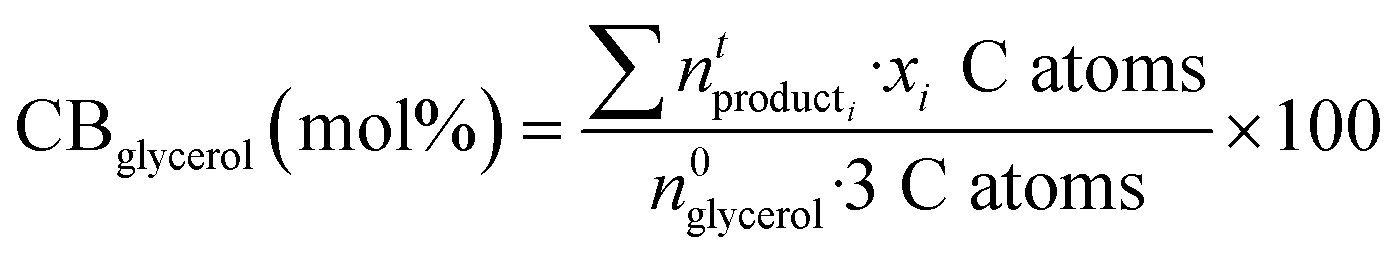
Carbon balances (CB) with respect to glycerol were calculated considering the liquid (GC analysis), gas (GC analysis) and solid (EA and TGA) fractions:
where xi is the number of carbon atoms in product i from glycerol. Although MeOH reacts under reaction conditions, it produces mainly H2 and methyl formate, and hence is not considered in the above calculations. Acetol productivity and specific productivity are defined as μmols acetol produced per unit area (m2 g−1) per minute, and mmols acetol produced per gram of catalyst per hour:


2.5 Spectroscopic studies
:50 by weight glycerol/MeOH mixture was prepared, of which 100 μL was dropped on to 100 mg of Cu/ZrO2 catalyst which was then dried at 50 °C for 20 min. Unmodified and glycerol/MeOH impregnated samples were independently loaded into the spectrometer and transferred to the analysis chamber for spectral acquisition at 25 °C. Samples were then transferred to a separate chamber for heating to 100 °C or 200 °C for 30 min at 10−7 Torr, being cooled to room temperature and transferred back to the analysis chamber after each thermal treatment. Spectra were acquired at 10−9 mbar, with a spot size of 500 × 500 μm. The pass energy was fixed at 80 eV with a step of 0.1 eV. Spectral analysis was performed using CasaXPS V2.3.19 software, a U2 Tougaard background subtraction, and line shapes determined from CuO and Cu2O reference powders. Energy correction of all photoelectron peaks was performed relative to adventitious C 1s XP features at 284.8 eV (in accordance with the NIST X-ray Photoelectron Spectroscopy Database (SRD 20), version 5.0). Cu 2p XP spectra were analysed by linear least squares fitting to weighted reference spectra of pure Cu2O and CuO between ∼930–950 eV (which encompasses the Cu(II) satellite), being more reliable than independently fitting core level and satellite features.
Gas phase studies were performed using 1,2-propanediol to gain insight into the reactivity of polyols over Cu/m-ZrO2 (glycerol's extremely high boiling point of 290 °C made it impossible to study by this means) and corroborate previous reports on related catalysts.28 The sample was first heated to 300 °C under 20 mL min−1 of flowing N2 for 1 h, then in vacuum at 10−4 mbar and 100 °C for 1 h, before cooling down to 25 °C in vacuum. It was then exposed to 1.5 mbar of 1,2-propanediol for 5 min, evacuated at 10−6 bar for 5 min, and finally heated under a static vacuum to 160 °C (5 °C min−1), with IR spectra recorded at 45 min intervals. After the final 45 min at 160 °C, the sample was cooled in vacuum to 25 °C, and exposed to 10 mbar CO with spectral acquisition immediately commenced to minimise potential reduction of surface CuOx species. Competitive adsorption between 1,2-propanediol and MeOH/water solvents on Cu/m-ZrO2 was also studied. The sample was first heated to 150 °C under 7 mL min−1 flowing air, and then cooled to 50 °C under dynamic vacuum. Calibrated MeOH or water doses (2 mbar each reactant) were then introduced until the sample was saturated (determined by IR intensities), after which calibrated doses of 1,2-propanediol were introduced, with IR spectra collected at each stage.
Solvent effects were also examined by impregnating 100 mg of Cu/m-ZrO2 with 100 μL of a liquid mixture of 90 wt% MeOH (or water) and 10 wt% glycerol, this being the maximum amount of glycerol the sample could absorb while remaining a self-supporting wafer. Impregnated samples were dried at 50 °C for 20 min and then IR spectra recorded at 20 °C intervals under static vacuum at temperatures between 25 °C and 160 °C.
3. Results and discussion
3.1 Catalyst characterization
Chemical composition analysis of the as-prepared Cu/ZrO2 materials revealed a common bulk Cu loading ∼5.8 wt% for all samples (Table 1). Specific BET surface areas fell between literature values,32,33 but lower for the monoclinic zirconia than tetragonal zirconia phase as widely reported,33 with the mixed phase close to the arithmetic mean of the pure phases. Pore volumes were small, as expected for non-porous nanocrystals, and likely reflect inter-particle porosity. Values for both pure phase Cu/ZrO2 samples were slightly lower than those of the corresponding unmodified zirconias (Table S1†). Despite modest surface areas, Cu dispersions for both pure phase Cu/ZrO2 were high (∼40%) (Tables 1 and S2†), corresponding to nanoparticles <3 nm diameter, and indicate success of the incipient wetness technique. This high dispersion was confirmed by the absence of reflections for any copper-containing crystalline phase by XRD (Fig. 1), which only evidenced reflections characteristic of the parent monoclinic (JCPDS: 00-037-1484) and tetragonal (JCPDS: 00-017-0923) zirconias (Fig. S5†) for all three Cu/ZrO2 samples.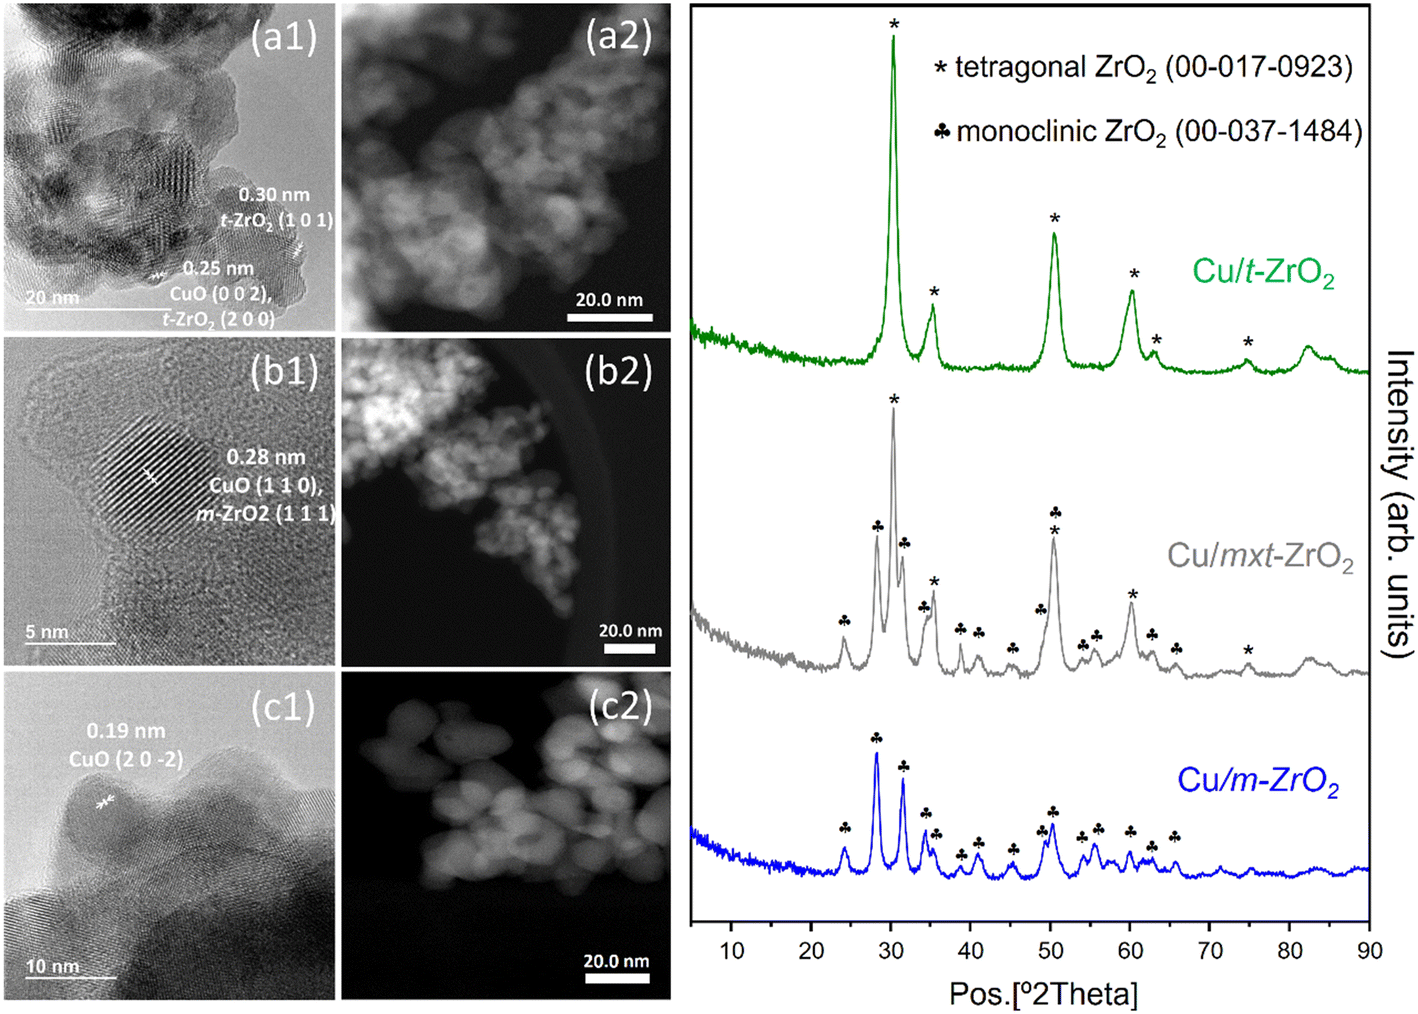 | ||
| Fig. 1 Left: (1) HR-TEM and (2) STEM micrographs of (a) Cu/t-ZrO2, (b) Cu/mxt-ZrO2 and (c) Cu/m-ZrO2. Right: Powder XRD patterns of Cu/ZrO2. | ||
Bright- and dark-field HR-TEM images showed agglomerates of irregularly shaped, sub-30 nm zirconia particles for all Cu/ZrO2 samples. Determination of particle size distributions for copper species was hindered by their poor contrast against the denser, dominant zirconia particles. Nevertheless, some well-defined, sub-5 nm particles, with lattice fringes indicative of monoclinic CuO, were identifiable in all cases, whose dimensions were consistent with those determined by N2O titration (Table 1). Note the presence of other highly dispersed copper phases cannot be discounted based on either HR-TEM or N2O titration results. In fact, elemental mapping of Cu/t-ZrO2 and Cu/m-ZrO2 by EDS (Fig. S6†) confirmed a uniform distribution of (sub-5 nm) copper containing species throughout the zirconia.
Acid–base properties were subsequently explored through NH3- and CO2-TPD (Fig. 2). The former indicated common, strong NH3 desorptions for all three Cu/ZrO2 samples, with a peak maximum at 200 °C characteristic of weak-medium strength.35,46 Cu/t-ZrO2 and Cu/mxt-ZrO2 exhibited a higher proportion of medium strength acid sites (>250 °C) than Cu/m-ZrO2 apparent from broadening of the NH3 desorption peak to higher temperature. Quantification by peak integration revealed total acid site loadings between 115–311 μmolNH3 g−1 and corresponding densities of 1.5–2.5 μmolNH3 m−2 (Table 2), consistent with literature for the unmodified pure zirconias,32,35 albeit decreasing in the order Cu/t-ZrO2 > Cu/mxt-ZrO2 > Cu/m-ZrO2 in contrast to previous reports wherein m-ZrO2 exhibited the higher acid site density.32,35 Interestingly, Cu doping of m-ZrO2 significantly increased acidity relative to the parent support (115 versus 39 μmolNH3 g−1). Similar CO2 desorption profiles were also observed for the parent supports and copper doped samples, with three distinct features observed ascribed to: CO2 adsorbed at weak base sites (surface hydroxyl) to form bicarbonate, desorbing <200 °C; CO2 bound to medium strength base sites (Mx+O2− pairs) to form bidentate carbonate, desorbing between 200 to 350 °C; and CO2 adsorbed at strong base sites (coordinatively unsaturated O2− species) to form multidentate carbonates, desorbing >350 °C.35,47,48 Total base site loadings and densities were comparable to the literature,34,35,48 and showed the opposite trend to acid properties, decreasing in the order Cu/m-ZrO2 > Cu/mxt-ZrO2 > Cu/t-ZrO2 (Table 2). Cu/m-ZrO2 was dominated by weak base sites whereas Cu/t-ZrO2 exhibited a similar proportion of weak:medium:strong base sites. Brønsted/Lewis acid character of the three samples was also studied by pyridine adsorption and desorption at different temperatures (Fig. S7†), with Lewis acidity dominant in all cases (evidenced by strong IR bands at 1445 cm−1, 1480 cm−1 and 1610 cm−1 associated with the molecular species).49
 | ||
| Fig. 2 (a) NH3- and (b) CO2-TPD profiles of Cu/ZrO2 materials. | ||
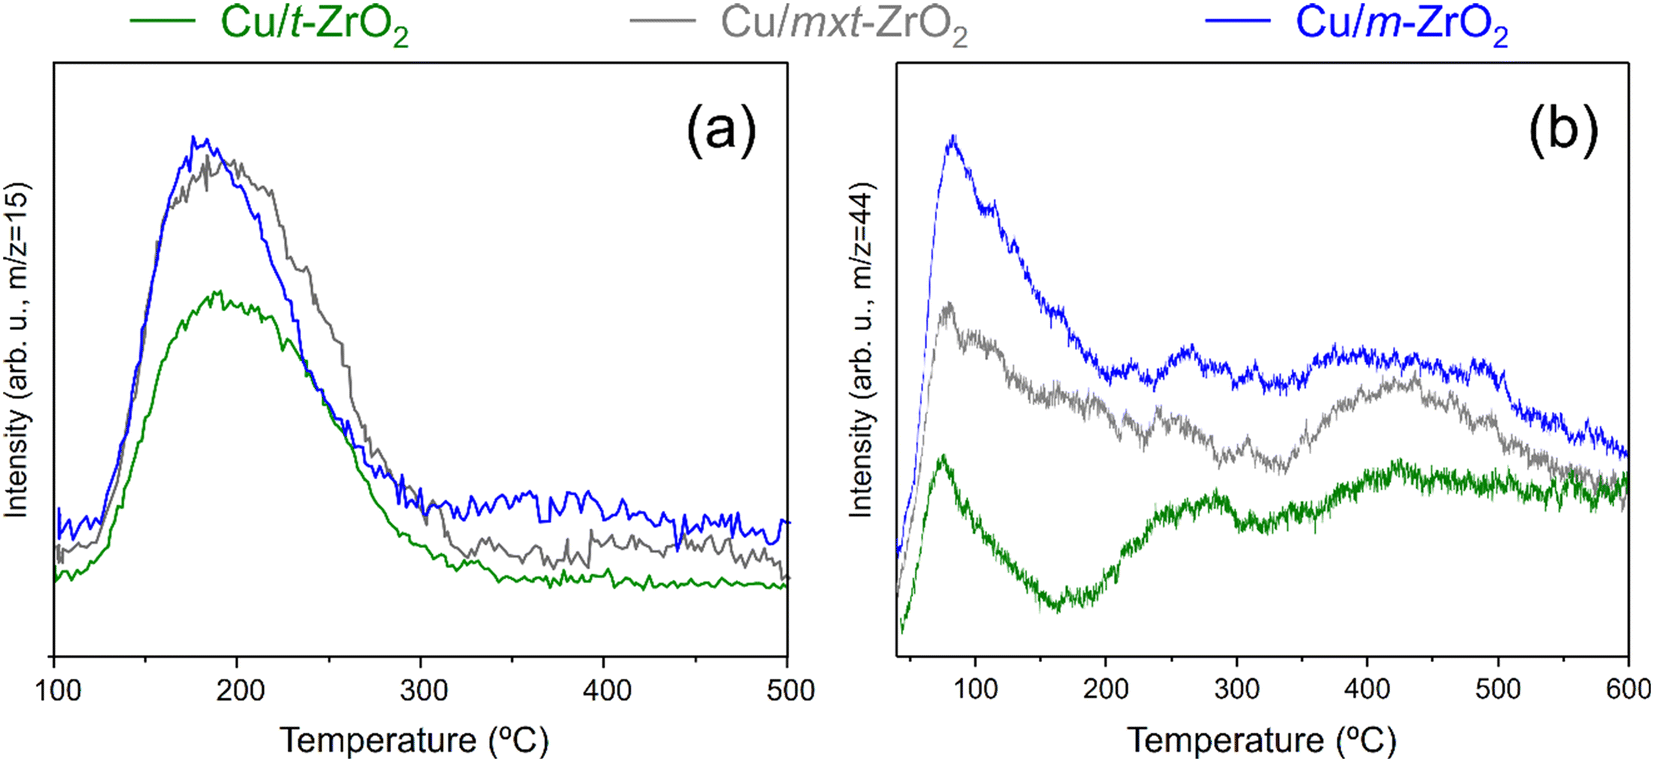
The nature of surface copper species was probed by H2-TPR, with two reduction processes identified for all samples, indicated by peak maxima ∼130–140 °C and ∼170–175 °C (Fig. S8†). These reduction temperatures are significantly lower than typical of bulk CuO (240 °C) or Cu2O (∼280 °C),50–52 indicative of highly dispersed CuxO species in accordance with the lack of corresponding XRD reflections (Fig. 1). Definitive assignment of Cu species from H2-TPR is complex due to their sensitivity to oxidation state, particle size and heating rate,53 however the (similar) reduction profiles of Cu/t-ZrO2 and Cu/mxt-ZrO2 which are dominated by the 130–140 °C peak likely arise from dispersed CuO nanoparticles/clusters.54,55 In contrast, Cu/m-ZrO2 exhibits an approximately equal distribution of reducible copper in the low and high temperature peaks, a characteristic of the stepwise reduction of Cu2+ → Cu+ → Cu0.56 Therefore, it is possible to assign the higher temperature reduction peak to Cu2O, which already suggests that monoclinic zirconia is better able to stabilise Cu(I) species than the tetragonal polymorph.
3.2 Catalytic glycerol dehydration
The preceding Cu/ZrO2 samples were investigated for glycerol dehydration in continuous flow under previously optimised conditions.28,29 Note that although glycerol dehydration can occur via thermal pathways, several studies have documented that such reactions require significantly higher temperature and pressure than used in our work (240 °C and atmospheric pressure). Castelló et al.57 and Gonçalves et al.58 report that pure glycerol is thermally stable until complete evaporation under atmospheric air or nitrogen, and even though additives such as methanol or water can impact the thermal reactivity of glycerol, supercritical conditions are required for these reactions to become significant.59 Previous reports of Cu/ZrO2 catalysts for the batch-wise reaction observed a maximum acetol yield of <10%,42,43 albeit at a lower temperature (190 °C), with selectivity decreasing sharply as a function of reaction time. In contrast, all three Cu/ZrO2 samples in the present study exhibited acetol yields >45% at 240 °C, and almost complete glycerol conversion (Fig. 3a) for 8 h time-on-stream (TOS). Closer examination of the cumulative and time-dependent conversion and acetol selectivity (Fig. 3b–d) reveals that Cu/m-ZrO2 significantly outperformed Cu/t-ZrO2; the former exhibited a selectivity to acetol >60% while the latter remained <50% (resulting in a lower acetol yield). Furthermore, Cu/m-ZrO2 was less prone to deactivation, resulting in a higher carbon balance and lower organic content in both the post-reaction catalyst and associated methanol washing (Fig. 3a). Significant amounts of carbon-rich compounds were detected in methanol washings of the post-reaction Cu/t-ZrO2 (by GC-FID and GC-MS) which itself possessed significant organic content (by EA and TGA, Fig. 3a, light blue segment). Cu/t-ZrO2 thus appears more susceptible to active site poisoning by strongly adsorbed, heavier organic by-products, possibly reflecting its higher loading of (mainly weak and medium Lewis) acid sites (Table 2). | ||
| Fig. 3 (a) Cumulative glycerol conversion (TOS = 1–8 h), liquid products yields (TOS = 1–8 h) and carbon balance (TOS = 0–8 h), (b) cumulative acetol selectivity (TOS = 1–8 h), and (c) time-dependent glycerol conversion, and (d) acetol selectivity, for Cu/ZrO2 catalysts. Reaction conditions: feed = methanol:glycerol (50:50 wt%), flow = 2 mL h−1, 0.5 g catalyst, 240 °C, TOS = 8 h. *Other liquid products include acetoin, acetoin methyl ether, 3-methoxybutanol, hydroxyacetone dimethyl acetal, acetic acid and methyl lactate. **Estimated by TGA and EA, and GC analysis of wash solvent collected from post-reaction catalysts (not determined for Cu/mxt-ZrO2). | ||
In order to eliminate possible artefacts arising from mass-transport limitations under the preceding reaction conditions (optimised for high conversion),28,29 additional reactions were performed using half the loading of Cu/t-ZrO2 and Cu/m-ZrO2 catalysts (0.25 g) for 3 h TOS (Table 3) to examine whether the same product distributions (and hence reaction pathways) were observed. In that sense, reducing the catalyst loading to half could effectively lower the concentration of active sites available for catalysis, thereby with moderate decrease in conversion levels. For both Cu/t-ZrO2 and Cu/m-ZrO2 catalysts, the acetol selectivity with respect to liquid products after 3 h TOS were approximately independent of catalyst loading/glycerol conversion, being ∼65% (0.5 g) vs. 56% (0.25 g) and 72% (0.5 g) and 67% (0.25 g) respectively, from Fig. 3d and Table 3. This indicates that the same reaction mechanism dominated at complete and moderate glycerol conversion. Future studies will compare acetol selectivity under differential conditions for glycerol iso-conversion <20%. Continuous flow operation confers higher glycerol conversion and selectivity to the desired acetol product than reports for similar catalysts in batch.42,43 Over the first 3 h reaction, the Cu/m-ZrO2 catalyst is twice as productive as its Cu/t-ZrO2 counterpart (23 versus 12 mmolacetol gcat−1 h−1) due to higher acetol selectivity and catalyst stability (Fig. 3c and d). The specific productivity for Cu/m-ZrO2 is double that most literature values for glycerol dehydration under continuous flow, and achieved at a lower temperature (see Table 3). If we consider the amount of copper in each of the catalysts to calculate “specific activity” (see section 2.3), it further reinforces the better performance of CuO/m-ZrO2 reported herein (see Table 3). Previous reports suggest that glycerol adsorption and dehydration occur over weak Lewis acid sites.28,29,42 The higher proportion of medium strength Lewis acid sites present in Cu/t-ZrO2 (Fig. 2a) may therefore catalyse undesired side reactions60,61 resulting in deactivation. Glycerol dehydration to acetol is reported over Na-doped metal oxides62 and hydroxyapatites,63 which possess significant solid acidity and basicity, akin to our Cu/m-ZrO2. Pure solid bases promote glycerol condensation into polyglycerols and deactivation.64
| Catalyst, Cu loading in wt% | Glycerol conversion/mol% | Acetol selectivitya/% | Acetol productivity/μmolacetol mcat−2 min−1 | Specific productivity/mmolacetol gcat−1 h−1 | Specific activity/mmolacetol mmol Cu−1 h−1 |
|---|---|---|---|---|---|
|
a With respect to glycerol conversion (values in parenthesis with respect to liquid products). Reaction conditions: methanol:glycerol (50:50 wt%), flow = 2 mL h−1, 0.25 g catalyst, 240 °C, TOS = 1–3 h.
b Flow, 270 °C, 240 min.
c Flow, 250 °C, 120 min.
d Flow, 280 °C, 150 min.
|
|||||
| 6%Cu/m-ZrO2 | 92 | 59 (67) | 5.1 | 23.0 | 25.6 |
| 6%Cu/t-ZrO2 | 71 | 42 (56) | 1.6 | 12.0 | 13.4 |
| 12-Crown-4-ether 25%Cu/SiO2 (ref. 65)b | 100 | 95 | — | 4.4 | 1.1 |
| 16%Cu/Al2O3 (ref. 23)c | 100 | 90 | 1.8 | 12.4 | 5.0 |
| La2CuO4 (19%Cu) (ref. 26)d | 100 | 76 | 103 | 12.3 | 4.2 |
3.3 Copper speciation and reactivity
Quasi in situ XPS and FTIR experiments were conducted to investigate the nature of active sites within the Cu/m-ZrO2 and Cu/t-ZrO2 catalysts. Interaction of the 50:50 vol% glycerol:methanol reaction mixture with the surface of Cu/ZrO2 samples was first examined by incipient wetness impregnation, and subsequent XPS analysis after drying at 50 °C. The impregnated and as-prepared Cu/ZrO2 samples were then each subjected to in vacuum thermal processing to compare their Cu speciation (Fig. 4 and S9†). In all cases, spectral fitting to CuO and Cu2O reference compounds identified two distinct Cu 2p spin–orbit split doublets: one with a 2p3/2 binding energy (BE) of between 932.1–932.6 eV attributed to Cu(0/I) species; and the second with a higher 2p3/2 BE of between 933.8–934.3 eV indicative of Cu(II).66,67 The presence of Cu(II) in all samples was also apparent from the characteristic broad satellite at 943 eV. Quantification of Cu core-level chemical environments, and corresponding Auger parameters, are reported in Table 4. Catalysts impregnated with the reaction mixture exhibited a higher degree of reduction (Cu1+/0:Cu2+ ratio) after heating to 100 °C and 200 °C than their as-prepared counterparts, with the extent of reduction proportional to temperature. The Cu/m-ZrO2 catalyst is more susceptible to reduction of Cu(II) to Cu(0/I) than Cu/t-ZrO2, and exhibited an almost complete loss of Cu(II) after 200 °C annealing of the glycerol/MeOH impregnated surface (Fig. 4b). Auger parameters associated with the low binding energy Cu 2p3/2 peaks ranged between 1847.6 eV and 1848.2 eV, and are hence consistent with the presence of Cu(I) and not Cu(0) in all cases.66,68,69 Note that Cu(I) species have previously been proposed as the active sites for glycerol dehydration to acetol.26–29
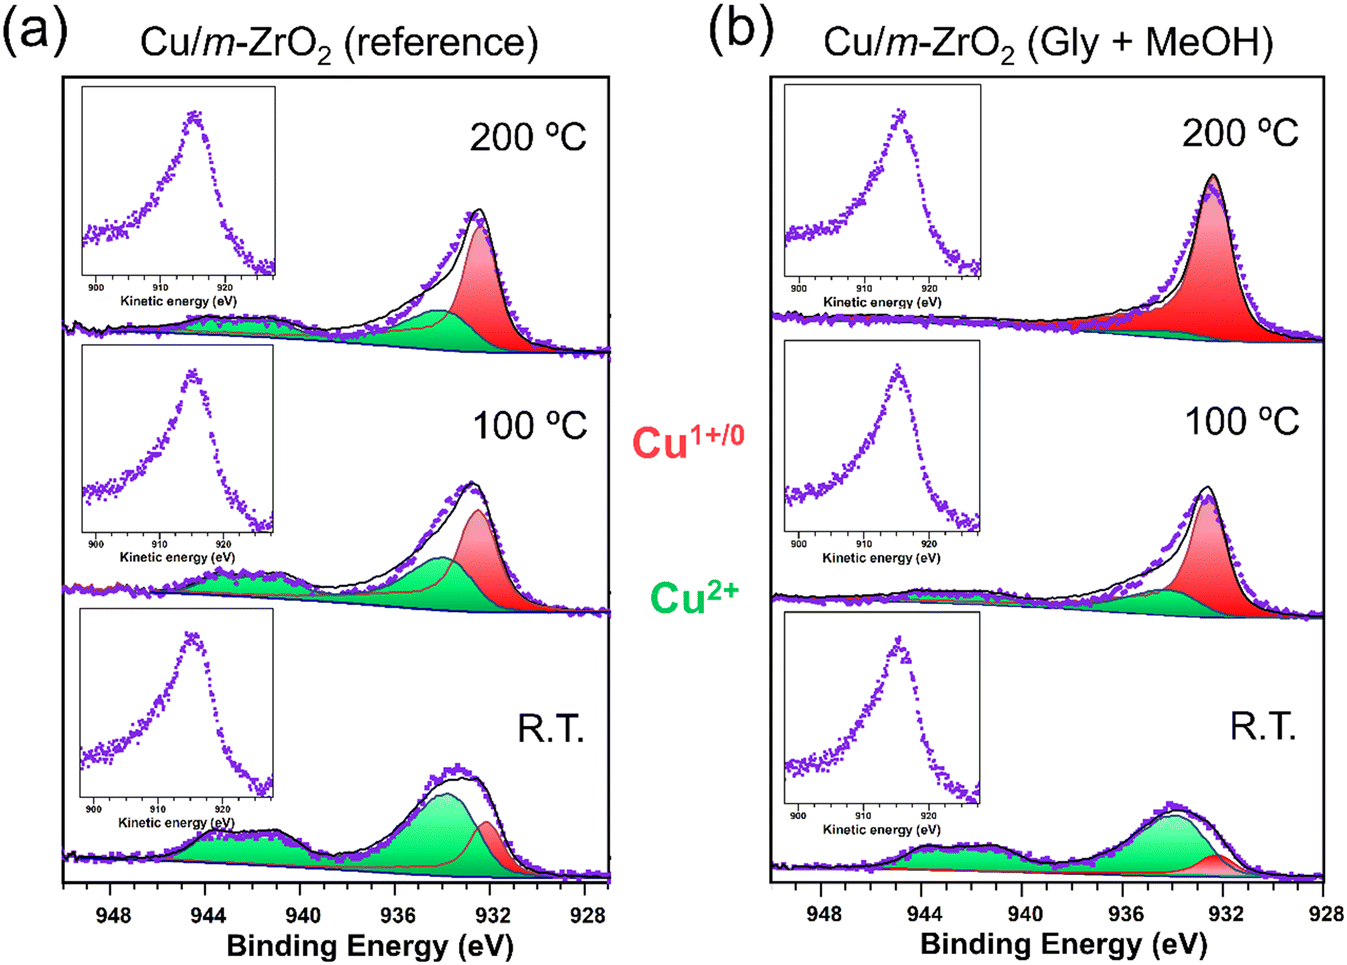 | ||
| Fig. 4 Cu 2p3/2 XP and Cu LMM Auger (embedded images) spectra after different thermal excursions for (a) Cu/m-ZrO2 and (b) Cu/m-ZrO2 catalysts pretreated by impregnated with a glycerol/MeOH mix (50:50 by weight). | ||
| Catalyst | Cu 2p3/2 binding energy/eV | Cu L3M4,5M4,5 kinetic energy/eV | α (eV) | Cu(0/I):Cu(II) |
|---|---|---|---|---|
| a Auger parameter: Cu 2p3/2 XPS binding energy + Cu L3M4,5M4,5 AES kinetic energy. | ||||
| Cu/m-ZrO2 (25 °C) | 932.4 | 915.6 | 1848.0 | 24:76 |
| Cu/m-ZrO2 (100 °C) | 932.5 | 915.5 | 1848.0 | 53:47 |
| Cu/m-ZrO2 (200 °C) | 932.4 | 915.2 | 1847.6 | 61:39 |
| Gly/MeOH + Cu/m-ZrO2 (25 °C) | 932.5 | 915.5 | 1848.0 | 15:85 |
| Gly/MeOH + Cu/m-ZrO2 (100 °C) | 932.7 | 915.1 | 1847.8 | 69:31 |
| Gly/MeOH + Cu/m-ZrO2 (200 °C) | 932.4 | 915.6 | 1848.0 | 91:9 |
| Cu/t-ZrO2 (25 °C) | 932.3 | 915.6 | 1847.9 | 15:85 |
| Cu/t-ZrO2 (100 °C) | 932.3 | 915.6 | 1847.9 | 39:61 |
| Cu/t-ZrO2 (200 °C) | 932.4 | 915.4 | 1847.8 | 56:44 |
| Gly/MeOH + Cu/t-ZrO2 (25 °C) | 932.6 | 915.6 | 1848.2 | 42:58 |
| Gly/MeOH + Cu/t-ZrO2 (100 °C) | 932.5 | 915.3 | 1847.8 | 62:38 |
| Gly/MeOH + Cu/t-ZrO2 (200 °C) | 932.5 | 915.7 | 1848.2 | 74:26 |
The surface reactivity of Cu/m-ZrO2 towards polyols was also explored by FTIR following the vapour phase adsorption of 1,2-propanediol (the high boiling point of glycerol being prohibitive for this study). A saturation adlayer of 1,2-propanediol over Cu/m-ZrO2 at room temperature was progressively heated to 160 °C with IR spectra periodically collected (Fig. 5). The spectra are dominated by stretching modes of carbonate moieties, already present in the FTIR spectra of bare m-ZrO2 (Fig. S13†).70 The intensity of this complex set of bands increases with temperature, which is attributed to the formation of support-mediated intermediates (carbonates and formates), precursors to compounds like acetic acid, formaldehyde, or CO2.71,72 Additionally, two bands are observed at 1703 and 1648 cm−1 assigned to the stretching modes of a carbonyl functional group (likely the terminal carbonyl in glyceraldehyde, Scheme 1), whose intensities monotonically increase with catalyst temperature. A similar carbonyl moiety was observed in our recent report of 1,2-propanediol adsorbed over Cu1+-rich Cu–Mg–AlOx catalysts.28 Similar diol reactivity is observed over m-ZrO2 and its Cu supported analogue at room temperature (Fig. S13†) with aldehyde formation in both cases. However, on the bare support (m-ZrO2), the 1648 cm−1 band associated with reactively-formed aldehyde was more intense suggesting stronger adsorption relative to Cu/m-ZrO2 (1703 cm−1 band); copper appears to destabilise the aldehyde intermediate promoting facile desorption of the acetol product.
 | ||
| Fig. 5 IR spectra of 1,2-propanediol (1.12 mbar) on Cu/m-ZrO2; (black): room temperature; (green): 60 °C; (blue): 120 °C; (red): 160 °C; (grey): 160 °C (after cooling to room temperature and evacuation at 10−6 mbar). For each temperature, the spectrum above is that cooled to room temperature. Reference 1,2-propanediol spectrum shown in Fig. S12.† | ||
 | ||
| Scheme 1 Schematic of proposed bifunctional catalytic dehydration of glycerol to acetol over Cu/ZrO2. | ||
3.4 Influence of ZrO2 phase
The preceding results identify Cu(I) as the likely active phase for glycerol dehydration, and a significant difference in the reactivity of Cu/m-ZrO2 and Cu/t-ZrO2 for acetol production. As catalyst performance does not correlate with acid–base properties, the question arises whether the different zirconia phases influence copper speciation and hence reactivity. Copper XPS data for Cu/t-ZrO2 (Fig. S9†) saturated with a 50:50 wt% glycerol:MeOH mixture and subsequently annealed at various temperatures was hence compared with the corresponding data for Cu/m-ZrO2 (Fig. 4). Two distinct Cu 2p3/2 chemical environments were observed at 932.4 eV and 934.1 eV BE, assigned to Cu(I/0) and Cu(II) species, respectively, for both catalysts. Corresponding Auger parameter (1847.9–1848.2 eV) analysis confirmed Cu(I) as the dominant species on heating ≥100 °C (Fig. 6a and Table 4),67–69 with m-ZrO2 stabilising more Cu(I) species than t-ZrO2. Acetol production scaled with the total amount of surface copper (Fig. 6b), however differences between the two catalysts were diminished when acetol production was normalised to their respective Cu(I) surface content, consistent with this being the active copper species for glycerol dehydration.
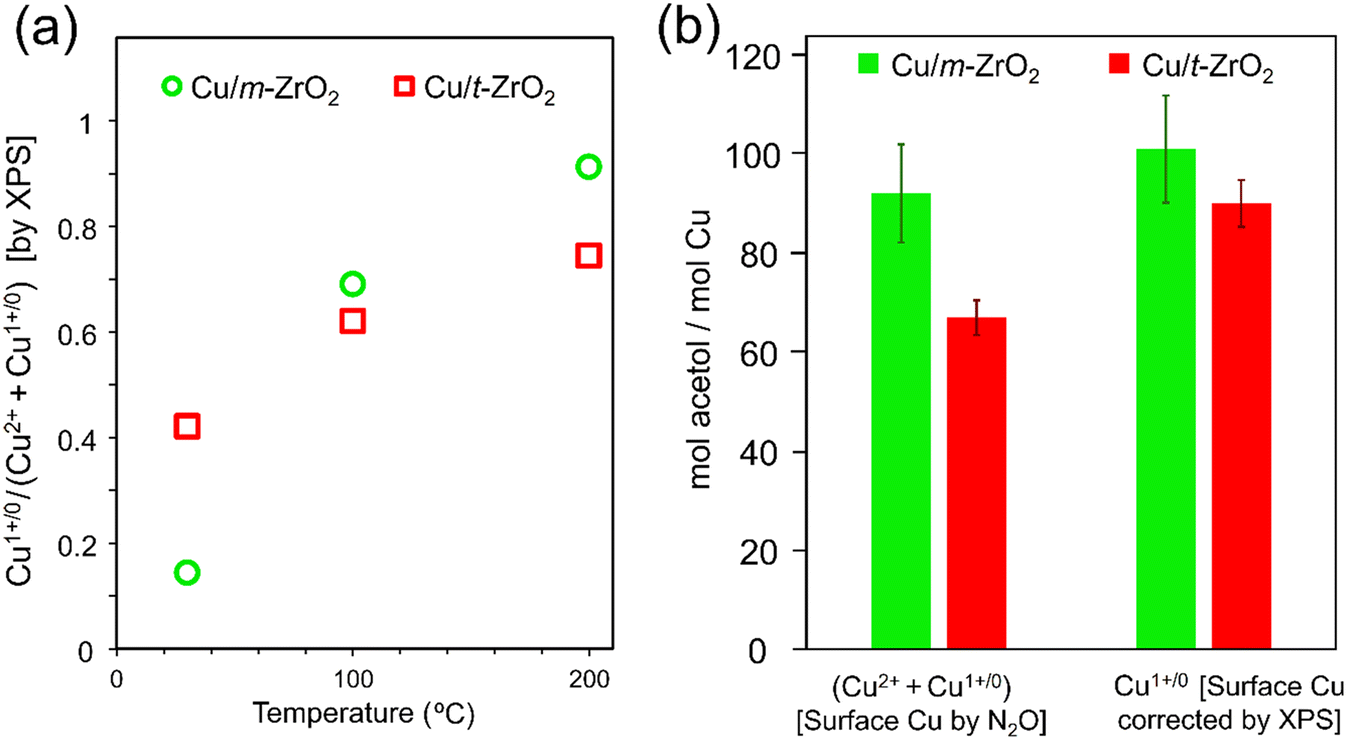 | ||
| Fig. 6 (a) Temperature-dependent surface copper speciation of Cu/m-ZrO2 and Cu/t-ZrO2 pre-saturated with 50:50 wt% glycerol:MeOH. (b) Correlation between surface copper species and turnover number for acetol production: feed = methanol:glycerol (50:50 by weight), flow = 2 mL h−1, 0.50 g catalyst (0.425–0.600 mm), 240 °C, TOS = 1–3 h. Total surface copper derived by N2O titration and Cu(I) from XPS of the 200 °C annealed samples in Fig. 6a. | ||
3.5 Impact of water on glycerol dehydration
The benefit of methanol as solvent in the selective dehydration of glycerol to acetol is previously reported,28 however process sustainability would be improved by partial substitution of the alcohol by water. Additional reactions were therefore performed using the Cu/m-ZrO2 catalyst with different amount of water (Fig. 7). The presence of even 10 wt% H2O strongly suppressed glycerol conversion over the course of 8 h TOS. Although water is expected to promote acetol hydrolysis back to the reactant, the time-dependence of the poisoning was intriguing, and our previous work indicated that methanol plays a role in catalyst activation and the formation of Cu(I) species.28 | ||
| Fig. 7 Glycerol conversion as a function of wt% water over Cu/m-ZrO2. Reaction conditions: feed = methanol:glycerol:water (varied from 50:50:0 to 0:50:50 wt%), flow = 2 mL h−1, 0.5 g catalyst, 240 °C. | ||
An in situ FTIR study was therefore performed of Cu/m-ZrO2 saturated with either water or methanol, prior to the adsorption of gaseous 1,2-propanediol (as a model for polyol), and subsequent evacuation. Vibrational bands associated with 1,2-propanediol were observed for pressures of >0.8 mbar (Fig. 8a) over the methanol-saturated surface, indicating facile displacement of the initial methanol by the more strongly adsorbed diol which remained even under high vacuum. In contrast, 1,2-propanediol pressures >2.5 mbar are required to observe diol bands over the water-saturated surface (Fig. 8b), confirming that water effectively site-block polyols from adsorption over Cu/m-ZrO2.
 | ||
| Fig. 8 FTIR spectra for Cu/m-ZrO2 sample saturated with (a) MeOH or (b) water prior to the adsorption of 1,2-propanediol (1,2-pdo, in gas phase) at different pressures, and subsequent evacuation. *IR bands characteristic of the diol (see Fig. S12† for reference spectra). | ||
Analogous experiments were undertaken for Cu/m-ZrO2 treated with glycerol/water and glycerol/methanol mixtures and then dried at 50 °C (experimental details in sections 2.4.1 and 2.4.2). FTIR evidenced a stronger CO band, indicative of a reactively-formed aldehyde intermediate, at all temperatures for the glycerol/methanol versus glycerol/water treated sample (Fig. 9a). This confirms that water effectively site-blocks glycerol adsorption at active Cu(I) sites necessary for the latter's dehydration. Corresponding Cu XP spectra of Cu/m-ZrO2 treated with the glycerol/water mixture (Fig. 9b) exhibited less surface Cu(I) at 100 °C and 200 °C (Table S3†) than for the same catalyst treated with glycerol/methanol (Fig. 4a), and indicated the presence of small amounts of Cu(0) at 933.6 eV; water promotes partial disproportionation of catalytically active Cu(I) species to Cu(II) and Cu(0) at reaction temperatures compared to methanol (in the presence of glycerol).
 | ||
| Fig. 9 (a) FTIR spectra and (b) Cu 2p3/2 XP and Cu LMM (embedded images) spectra after different thermal excursions in vacuo for Cu/m-ZrO2 pre-treated by impregnation with: (a) MeOH/glycerol (90:10 by weight) or water/glycerol (90:10 by weight); or (b) glycerol/water mix (50:50 by weight). | ||
3.6 Catalyst reusability
The stability of Cu/m-ZrO2 for acetol production from glycerol using a MeOH was examined through extended TOS (Fig. 10a) and recycle studies after 6 h TOS (Fig. 10b). Complete glycerol conversion was achieved for 10 h TOS for an as-prepared catalyst, however the acetol yield slowly fell from a maximum of ∼70% (2 h TOS) to ∼50% (10 h TOS). The loss of acetol selectivity coincides with the accumulation of ∼15 wt% surface carbon (Table 5), indicating poisoning of the Lewis acidic Cu(I) sites that favour dehydration versus e.g. carbon deposits formation over strong Lewis acid or Brønsted acid sites.60 Catalyst regeneration after 6 h TOS was attempted by in situ methanol washing and subsequent calcination under flowing air at 550 °C. The resulting Cu/m-ZrO2 possessed negligible organic residue and had the same copper loading and dispersion (particle size) as the parent catalyst. A repeat experiment wherein regeneration was performed after 8 h TOS also evidenced retention of the crystallinity and reducibility of the parent catalyst (Fig. S11†). Recycle experiments of in situ Cu/m-ZrO2 (after 6 h TOS) revealed that while the drop in acetol yield after the first reaction could not be reversed by a regeneration treatment, the yield could be stabilised at ∼50% for three additional 6 h reactions, an essential criterion for commercial acetol production.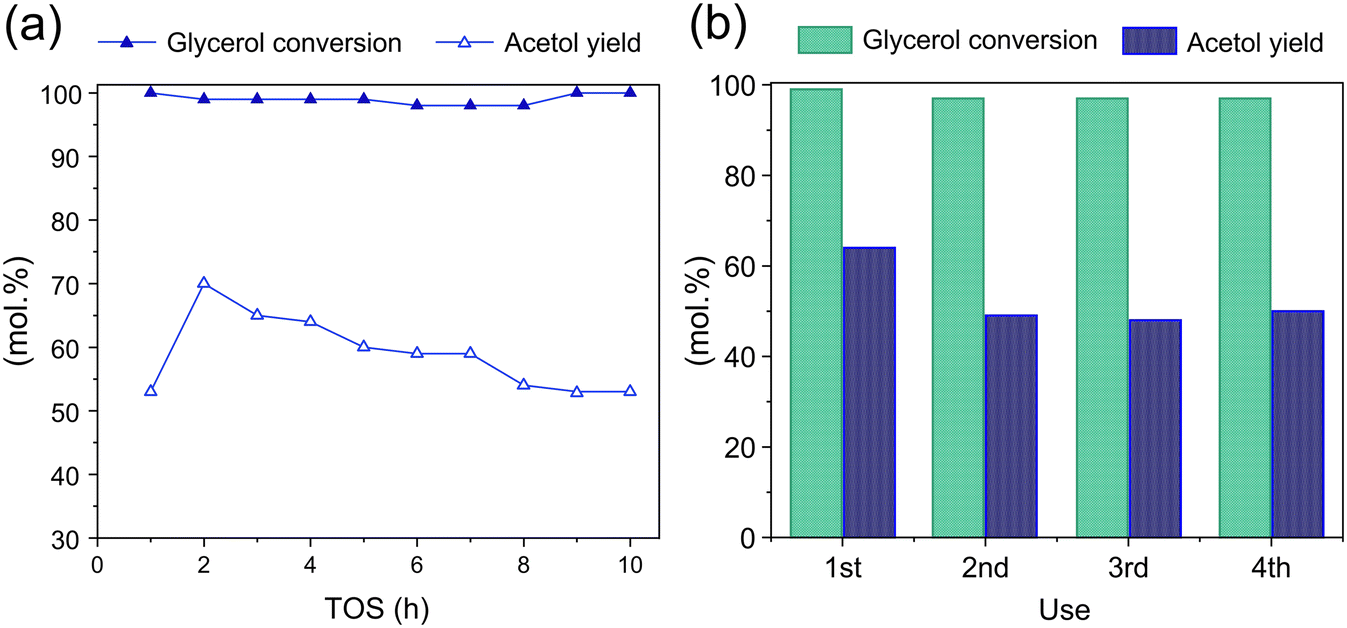 | ||
| Fig. 10 (a) Glycerol conversion and acetol yield as a function of TOS for Cu/m-ZrO2. (b) Mean glycerol conversion and acetol selectivity for consecutive 6 h reaction and in situ regeneration cycles. Reaction conditions: feed = methanol:glycerol (50:50 wt%), flow = 2 mL h−1, 0.5 g catalyst, 240 °C. | ||
| Physicochemical parameter | Cu loadinga/wt% | Surface area (BET)b/m2 g−1 | Organic matterc/wt% | Particle sized/nm |
|---|---|---|---|---|
| a ICP (random error estimated by applying t student (0.98) criterion to three repeat measurements). b N2 porosimetry. c TGA. d N2O chemisorption and H2-TPR. e After 6 h TOS. f After 8 h TOS. Regeneration protocol: reactor flushed at 240 °C with 40 mL of MeOH (2 mL h−1) and subsequent calcination under 50 mL min−1 flowing air at 550 °C for 4 h (heating rate = 10 °C min−1). | ||||
| As-prepared Cu/m-ZrO2 | 4.8 ± 0.2 | 45 | — | 2.7 |
| Post-reaction Cu/m-ZrO2 | n/d | n/d | 14.7e | n/d |
| Regeneratedf Cu/m-ZrO2 | 4.6 ± 0.2 | 42 | 1.8 | 2.3 |
4. Conclusions
Copper-impregnated zirconia polymorphs were examined as solid acid catalysts for the selective dehydration of glycerol to acetol in continuous flow. Similar metal loading (∼6 wt% Cu) resulted in uniformly dispersed CuxO nanoparticles of similar size (<3 nm) over monoclinic (m-), tetragonal (t-) and mixed phase (mxt-) ZrO2 supports. The resulting Cu/ZrO2 materials exhibited mixed acid/base properties, with Cu/m-ZrO2 possessing the lowest acid loading and weakest (Lewis) acidity. Surface copper was mainly present as Cu(II) in as-prepared catalysts, but underwent reduction to predominantly Cu(I) at ≥200 °C and/or in the presence of glycerol and methanol. Glycerol conversion and acetol selectivity/yield at 240 °C were sensitive to the zirconia phase, decreasing in the order Cu/m-ZrO2 > Cu/mxt-ZrO2 > Cu/t-ZrO2. Monoclinic zirconia also conferred the greatest catalyst stability over 8 h time-on-stream. The poorer performance of Cu/t-ZrO2 appears to reflect active site poisoning by strongly adsorbed, heavier organic by-products over its medium-strength Lewis acid sites. Glycerol dehydration proceeds via a surface aldehyde intermediate (likely glyceraldehyde) over zirconia, which is destabilised by surface copper, promoting acetol desorption. Cu(I) is identified as the catalytically active species for acetol production in Cu/m-ZrO2 and Cu/t-ZrO2; the monoclinic phase favours a higher concentration of surface Cu(I) species. The Cu/m-ZrO2 catalyst achieved 60% acetol selectivity and a specific productivity of 23 mmolacetol gcat−1 h−1, surpassing batchwise and flow literature reports at comparable temperature. However, Cu/m-ZrO2 was sensitive to poisoning by water present ≥10 wt%, which prevented glycerol dehydration to the aldehyde intermediate and destabilised surface Cu(I) versus Cu(II). Slow on-stream deactivation of Cu/m-ZrO2 occurs due to the accumulation of carbonaceous matter but is partially reversible by in situ methanol washing and calcination, facilitating complete glycerol conversion and a stable acetol yield of 50% over three recycles. Careful selection of the appropriate support phase is necessary to unlock the potential of a range of copper-catalysed biomass valorisation reactions.Conflicts of interest
There are no conflicts to declare.Acknowledgements
Authors thank grants PGC2018-097277-B-I00 and PID2021-125897-OB-I00 funded by MCIN/AEI/10.13039/501100011033 and by “ERDF A way of making Europe”, and the Australian Research Council for funding (DP200100204, DP200100313, LP190100849). J. M. also thanks Spanish Government (CTQ-2015-67592) for his FPI fellowship. The authors also thank J. M. Salas for his help with IR measurements, and M. Parreño Romero and the Electron Microscopy Service of Universitat Politècnica de València for their support during electron microscopy analyses.References
- BP Statistical Review of World Energy 2022, 71st edition (website), https://www.bp.com/content/dam/bp/business-sites/en/global/corporate/pdfs/energy-economics/statistical-review/bp-stats-review-2022-full-report.pdf, Accessed July 1, 2023.
- P. G. Levi and J. M. Cullen, Environ. Sci. Technol., 2018, 52(4), 1725–1734, DOI:10.1021/acs.est.7b04573.
- G. W. Huber, S. Iborra and A. Corma, Chem. Rev., 2006, 106(9), 4044–4098, DOI:10.1021/cr068360d.
- A. Corma, S. Iborra and A. Velty, Chem. Rev., 2007, 107(6), 2411–2502, DOI:10.1021/cr050989d.
- J. Becker and C. Wittmann, Angew. Chem., Int. Ed., 2015, 54(11), 3328–3350, DOI:10.1002/anie.201409033.
- J. R. Banu, Preethi, S. Kavitha, V. K. Tyagi, M. Gunasekaran, O. P. Karthikeyan and G. Kumar, Fuel, 2021, 302, 121086, DOI:10.1016/j.fuel.2021.121086.
- Z. Utlu, Energy Sources, Part A, 2007, 29, 1295–1304, DOI:10.1080/00908310500434564.
- A. L. Moreira, J. M. Dias, M. F. Almeida and M. C. Alvim-Ferraz, Energy Fuels, 2010, 24(10), 5717–5721, DOI:10.1021/ef100705s.
- J. Costa, M. Almeida, M. Alvim-Ferraz and J. Días, Energy Convers. Manage., 2013, 74, 17–23, DOI:10.1016/j.enconman.2013.04.032.
- S. C. D'Angelo, A. Dall'Ara, C. Mondelli, J. Pérez-Ramírez and S. Papadokonstantakis, ACS Sustainable Chem. Eng., 2018, 6(12), 16563–16572, DOI:10.1021/acssuschemeng.8b03770.
- M. O. Sonnati, S. Amigoni, E. P. Taffin De Givenchy, T. Darmanin, O. Choulet and F. Guittard, Green Chem., 2013, 15(2), 283–306, 10.1039/c2gc36525a.
- B. Katryniok, S. Paul, V. Bellière-Baca, P. Rey and F. Dumeignil, Green Chem., 2010, 12(12), 2079–2098, 10.1039/c0gc00307g.
- B. Dou, Y. Song, C. Wang, H. Chen and Y. Xu, Renewable Sustainable Energy Rev., 2014, 30, 950–960, DOI:10.1016/j.rser.2013.11.029.
- Y. Wang, J. Zhou and X. Guo, Catalytic hydrogenolysis of glycerol to propanediols: A review, RSC Adv., 2015, 5(91), 74611–74628, 10.1039/c5ra11957j.
- N. Rahmat, A. Z. Abdullah and A. R. Mohamed, Renewable Sustainable Energy Rev., 2010, 14(3), 987–1000, DOI:10.1016/j.rser.2009.11.010.
- M. L. de Araújo, D. Mandelli, Y. N. Kozlov, W. A. Carvalho and G. B. Shul'pin, J. Mol. Catal. A: Chem., 2016, 422, 103–114, DOI:10.1016/j.molcata.2016.02.011.
- Y. Wan, M. Zhuang, S. Chen, W. Hu, J. Sun, J. Lin, S. Wan and Y. Wang, ACS Catal., 2017, 7(9), 6038–6047, DOI:10.1021/acscatal.7b01499.
- J. Mazarío, Z. Raad, P. Concepción, C. Cerdá-Moreno and M. E. Domine, Catal. Sci. Technol., 2020, 10(23), 8049–8063, 10.1039/D0CY01423K.
- M. A. Dasari, P. P. Kiatsimkul, W. R. Sutterlin and G. J. Suppes, Appl. Catal., A, 2005, 281(1–2), 225–231, DOI:10.1016/j.apcata.2004.11.033.
- Z. Zhou, X. Li, T. Zeng, W. Hong, Z. Cheng and W. Yuan, Chin. J. Chem. Eng., 2010, 18(3), 384–390, DOI:10.1016/S1004-9541(10)60235-2.
- P. T. Anastas and J. B. Zimmerman, Curr. Opin. Green Sustainable Chem., 2018, 13, 150–153, DOI:10.1016/j.cogsc.2018.04.017.
- C. W. Chiu, M. A. Dasari, G. J. Suppes and W. R. Sutterlin, AIChE J., 2006, 52(10), 3543–3548, DOI:10.1002/aic.10951.
- S. Sato, M. Akiyama, R. Takahashi, T. Hara, K. Inui and M. Yokota, Appl. Catal., A, 2008, 347(2), 186–191, DOI:10.1016/j.apcata.2008.06.013.
- C. V. Rode, M. A. Hengne, A. A. Ghalwadkar, R. B. Mane, P. H. Mohite and H. S. Potdar, Process for preparation of hydroxyacetone or propylene glycol, WO Pat., 2011/138643, 2014 Search PubMed.
- R. B. Mane and C. V. Rode, Org. Process Res. Dev., 2012, 16(5), 1043–1052, DOI:10.1021/op200383r.
- M. Velasquez, A. Santamaria and C. Batiot-Dupeyrat, Appl. Catal., B, 2014, 160–161, 606–613, DOI:10.1016/j.apcatb.2014.06.006.
- S. Célerier, S. Morisset, I. Batonneau-Gener, T. Belin, K. Younes and C. Batiot-Dupeyrat, Appl. Catal., A, 2018, 557, 135–144, DOI:10.1016/j.apcata.2018.03.022.
- J. Mazarío, P. Concepción, M. Ventura and M. E. Domine, J. Catal., 2020, 385, 160–175, DOI:10.1016/j.jcat.2020.03.010.
- J. Mazarío, J. A. Cecilia, E. Rodríguez-Castellón and M. E. Domine, Appl. Catal., A, 2023, 652, 119029, DOI:10.1016/j.apcata.2023.119029.
- P. M. de Souza, R. C. Rabelo-Neto, L. E. Borges, G. Jacobs, B. H. Davis, U. M. Graham, D. E. Resasco and F. B. Noronha, ACS Catal., 2015, 5(12), 7385–7398, DOI:10.1021/acscatal.5b01501.
- F. M. Wako, A. S. Reshad, M. S. Bhalerao and V. V. Goud, Ind. Crops Prod., 2018, 118, 282–289, DOI:10.1016/j.indcrop.2018.03.057.
- H. Jahangiri, A. Osatiashtiani, J. A. Bennett, M. A. Isaacs, S. Gu, A. F. Lee and K. Wilson, Catal. Sci. Technol., 2018, 8, 1134–1141, 10.1039/C7CY02541F.
- X. Zhang, A. I. M. Rabee, M. Isaacs, A. F. Lee and K. Wilson, ACS Sustainable Chem. Eng., 2018, 6(11), 14704–14712, DOI:10.1021/acssuschemeng.8b03268.
- K. Pokrovski, K. Taek Jung and A. T. Bell, Langmuir, 2001, 17(14), 4297–4303, DOI:10.1021/la001723z.
- S. Diang, J. Zhao and Q. Yu, Catalysts, 2019, 9(9), 768, DOI:10.3390/catal9090768.
- D. Ruano, B. M. Pabón, C. Azenha, C. Mateos-Pedrero, A. Mendes, V. Pérez-Dieste and P. Concepción, Catalysts, 2020, 10(9), 1005, DOI:10.3390/catal10091005.
- K. Samson, M. Śliwa, R. P. Socha, K. Góra-Marek, D. Mucha, D. Rutkowska-Zbik, J.-F. Paul, M. Ruggiero-Mikołajczyk, R. Grabowski and J. Słoczyński, ACS Catal., 2014, 4(10), 3730–3741, DOI:10.1021/cs500979c.
- O. Gorban, I. Danilenko, I. Nosolev, E. Abdullayev, A. Islamov, K. Gavrilenko, A. Doroshkevich, O. Shvets and S. Kolotilov, J. Nanopart. Res., 2022, 24, 197, DOI:10.1007/s11051-022-05566-5.
- J. Joo, T. Yu, Y. W. Kim, H. M. Park, F. Wu, J. Z. Zhang and T. Hyeon, J. Am. Chem. Soc., 2003, 125(21), 6553–6557, DOI:10.1021/ja034258b.
- L. Kumari, W. Z. Li, J. M. Xu, R. M. Leblanc, D. Z. Wang, Y. Li, H. Guo and J. Zhang, Cryst. Growth Des., 2009, 9(9), 3874–3880, DOI:10.1021/cg800711m.
- R. Srinivasan, M. B. Harris, S. F. Simpson, R. J. De Angelis and B. H. Davis, J. Mater. Res., 1988, 3, 787–797, DOI:10.1557/JMR.1988.0787.
- R. J. Chimentão, P. Hirunsit, C. S. Torres, M. B. Ordoño, A. Urakawa, J. L. G. Fierro and D. Ruiz, Catal. Today, 2021, 367, 58–70, DOI:10.1016/J.CATTOD.2020.09.031.
- J. Garcés, R. Arrué, N. Novoa, A. F. Peixoto and R. J. Chimentão, Catalysts, 2021, 11(9), 1040, DOI:10.3390/CATAL11091040.
- J. Rouquerol, P. Llewellyn and F. Rouquerol, Stud. Surf. Sci. Catal., 2007, 160, 49–56, DOI:10.1016/S0167-2991(07)80008-5.
- V. P. Pakharukova, E. M. Moroz, D. A. Zyuzin, A. V. Ishchenko, L. Y. Dolgikh and E. Strizhak, J. Phys. Chem. C, 2015, 119(52), 28828–28835, DOI:10.1021/acs.jpcc.5b06331.
- E. M. Albuquerque, L. E. P. Borges, M. A. Fraga and C. Sievers, ChemCatChem, 2017, 9(14), 2675–2683, DOI:10.1002/cctc.201700305.
- C. A. Gaertner, J. C. Serrano-Ruiz, D. J. Braden and J. A. Dumesic, J. Catal., 2009, 266(1), 71–78, DOI:10.1016/j.jcat.2009.05.015.
- I. Prymak, V. N. Kalevaru, S. Wohlrab and A. Martin, Catal. Sci. Technol., 2015, 5(4), 2322–2331, 10.1039/C4CY01400F.
- A. Osatiashtiani, A. F. Lee, D. R. Brown, J. A. Melero, G. Morales and K. Wilson, Catal. Sci. Technol., 2014, 4(2), 333–342, 10.1039/C3CY00409K.
- R. Zhou, T. Yu, X. Jiang, F. Chen and X. Zheng, Appl. Surf. Sci., 1999, 148(3–4), 263–270, DOI:10.1016/S0169-4332(98)00369-9.
- Y. Zhang, C. Chen, X. Lin, D. Li, X. Chen, Y. Zhan and Q. Zheng, Int. J. Hydrogen Energy, 2014, 39(8), 3746–3754, DOI:10.1016/J.IJHYDENE.2013.12.161.
- Z. Wang, Z. Niu, Q. Hao, L. Ban, H. Li, Y. Zhao and Z. Jiang, Catalysts, 2019, 9(1), 35, DOI:10.3390/catal9010035.
- M. F. Luo, Y. J. Zhong, X. Yuan and X. M. Zheng, Appl. Catal., A, 1997, 162(1–2), 121–131, DOI:10.1016/S0926-860X(97)00089-6.
- M. F. Luo, P. Fang, M. He and Y. L. Xie, J. Mol. Catal. A: Chem., 2005, 239(1–2), 243–248, DOI:10.1016/j.molcata.2005.06.029.
- X. Niu, T. Zhao, F. Yuan and Y. Zhu, Sci. Rep., 2015, 5, 9153, DOI:10.1038/srep09153.
- J. Xue, X. Wang, G. Qi, J. Wang, M. Shen and W. Li, J. Catal., 2013, 297, 56–64, DOI:10.1016/j.jcat.2012.09.020.
- M. L. Castelló, J. Dweck and D. A. G. Aranda, J. Therm. Anal. Calorim., 2009, 97, 627–630, DOI:10.1007/s10973-009-0070-z.
- D. Gonçalves, L. Bozzi Barbeiro, P. Tonon de Souza, E. A. Caldas Batista and A. J. de Almeida Meirelles, J. Therm. Anal. Calorim., 2022, 147, 11857–11874, DOI:10.1007/s10973-022-11395-4.
- W. Sakdasri, S. Ngamprasertsith, P. Saengsuk and R. Sawangkeaw, Energy Convers. Manage.: X, 2021, 12, 100145, DOI:10.1016/j.ecmx.2021.100145.
- T. P. Braga, N. Essayem, S. Prakash and A. Valentini, J. Braz. Chem. Soc., 2016, 27(12), 2361–2371, DOI:10.5935/0103-5053.20160134.
- T. P. Braga, N. Essayem and A. Valentini, RSC Adv., 2015, 5(113), 93394–93402, 10.1039/C5RA16166E.
- A. K. Kinage, P. P. Upare, P. Kasinathan, Y. K. Hwang and J. S. Chang, Catal. Commun., 2010, 11(7), 620–623, DOI:10.1016/j.catcom.2010.01.008.
- D. Stošić, S. Bennici, S. Sirotin, C. Calais, J. L. Couturier, J. L. Dubois, A. Travert and A. Auroux, Appl. Catal., A, 2012, 447–448, 124–134, DOI:10.1016/j.apcata.2012.09.029.
- J.-M. Clacens, Y. Pouilloux and J. Barrault, Appl. Catal., A, 2002, 227, 181–190, DOI:10.1016/S0926-860X(01)00920-6.
- S. Sasaki, E. Kurniawan, K. Sato, K. Matsusaka, T. Kojima, T. Hara, Y. Yamada and S. Sato, Appl. Catal., A, 2024, 671, 119561, DOI:10.1016/j.apcata.2024.119561.
- A. G. Sato, D. P. Volanti, D. M. Meira, S. Damyanova, E. Longo and J. M. C. Bueno, J. Catal., 2013, 307, 1–17, DOI:10.1016/j.jcat.2013.06.022.
- X. Li, L. Li, Q. Xia, S. Hong, L. Hao, A. W. Robertson, H. Zhang, T. W. Benedict Lo and Z. Sun, ACS Sustainable Chem. Eng., 2022, 10(19), 6466–6475, DOI:10.1021/acssuschemeng.2c01600.
- M. C. Biesinger, L. W. M. Lau, A. R. Gerson and R. S. C. Smart, Appl. Surf. Sci., 2010, 257, 887–898, DOI:10.1016/j.apsusc.2010.07.086.
- C. D. Wagner, A. V. Naumkin, A. Kraut-Vass, J. W. Allison, C. J. Powell and J. R. J. Rumble, NIST Standard Reference Database 20, Version 3.4 (web version) (http://srdata.nist.gov/xps/), 2003.
- S. T. Korhonen, M. Calatayud and A. O. I. Krause, J. Phys. Chem. C, 2008, 112, 16096–16102, DOI:10.1021/jp803353v.
- V.-L. Yfanti and A. A. Lemonidou, J. Catal., 2018, 368, 98–111, DOI:10.1016/j.jcat.2018.09.036.
- C. Bandinelli, B. Lambiase, T. Tabanelli, J. De Maron, N. Dimitratos, F. Basile, P. Concepción, J. M. López Nieto and F. Cavani, Appl. Catal., A, 2019, 582, 117102, DOI:10.1016/j.apcata.2019.05.036.
Footnote |
| † Electronic supplementary information (ESI) available. See DOI: https://doi.org/10.1039/d4cy00220b |
| This journal is © The Royal Society of Chemistry 2024 |