 Open Access Article
Creative Commons Attribution 3.0 Unported Licence
Mn-promoted MoS2 catalysts for CO2 hydrogenation: enhanced methanol selectivity due to MoS2/MnOx interfaces†
Gustavo A. S.
Alves‡
 a,
Gernot
Pacholik‡
a,
Stephan
Pollitt
a,
Gernot
Pacholik‡
a,
Stephan
Pollitt
 b,
Tobias
Wagner
a,
Raffael
Rameshan
c,
Christoph
Rameshan
 c and
Karin
Föttinger
 *a
*a
aInstitute of Materials Chemistry, TU Wien, Getreidemarkt 9/BC/01, 1060 Vienna, Austria. E-mail: karin.foettinger@tuwien.ac.at
bPaul Scherrer Institut (PSI), Forschungsstrasse 111, 5232 Villigen, Switzerland
cChair of Physical Chemistry, Montanuniversität Leoben, Franz-Josef-Straße 18, 8700 Leoben, Austria
First published on 2nd February 2024
Abstract
Considering the alarming scenario of climate change, CO2 hydrogenation to methanol is considered a key process for phasing out fossil fuels by means of CO2 utilization. In this context, MoS2 catalysts have recently shown to be promising catalysts for this reaction, especially in the presence of abundant basal-plane sulfur vacancies and due to synergistic mechanisms with other phases. In this work, Mn-promoted MoS2 prepared by a hydrothermal method presents considerable selectivity for CO2 hydrogenation to methanol in comparison with pure MoS2 and other promoters such as K and Co. Interestingly, if CO is used as a carbon source for the reaction, methanol production is remarkably lower, which suggests the absence of a CO intermediate during CO2 hydrogenation to methanol. After optimization of synthesis parameters, a methanol selectivity of 64% is achieved at a CO2 conversion of 2.8% under 180 °C. According to material characterization by X-ray Diffraction and X-ray Absorption, the Mn promoter is present mainly in the form of MnO and MnCO3 phases, with the latter undergoing convertion to MnO upon H2 pretreatment. However, following exposure to reaction conditions, X-ray photoelectron spectroscopy suggests that higher oxidation states of Mn may be present at the surface, suggesting that the improved catalytic activity for CO2 hydrogenation to methanol arises from a synergy between MoS2 and MnOx at the catalyst surface.
Introduction
With the alarming scenario of anthropogenic climate change due to persistently high emission levels of CO2 from fossil fuels, Carbon Capture and Utilization (CCU) technologies may play a role in the transition of industry towards a net zero future.1 Moving away from fossil fuels, CO2 could be implemented as an alternative carbon feedstock in a variety of industrial processes.2,3 In this context, the production of methanol has been attracting particular interest, given its current role as a critical building block in the chemical industry and the development of sustainable aviation fuel in the near future.4,5Methanol synthesis from CO-rich syngas derived from natural gas using Cu/ZnO/Al2O3 catalysts has been a well-established industrial process over the past decades. However, replacing fossil resources by alternative carbon sources such as biomass or captured CO2 will require the development of new processes, among which the direct CO2 hydrogenation may play a decisive role. In comparison with the traditional CO-based route, inherent limitations of the CO2 hydrogenation reaction involve its less exothermic character, in addition to the simultaneous production of water.6 Nevertheless, reports from the first industrial plant devoted to CO2 hydrogenation to methanol suggest significant advantages, being less energy-intensive and producing fewer reaction byproducts.7
Similarly as in the conventional methanol synthesis process, copper-based catalysts have been widely regarded as the most effective materials for CO2 hydrogenation. Following extensive research, several structural-property relations have been identified for the Cu/ZnO system.8–10 Although some copper-based catalysts may produce methanol through the Reverse Water-Gas Shift + CO hydrogenation pathway,11,12 the Cu/ZnO interaction has been strongly associated with CO2 hydrogenation via formate intermediate, according to theoretical studies and operando characterization.8,13,14
In addition to such materials, other recent lines of research involve the search for novel catalysts, since the application of copper-based materials is still limited by the instability of the active phase,15 low selectivity to methanol16 and surface poisoning in the presence of sulfur-containing gases.17 In virtue of these issues, non-metallic catalysts such as ZnZrOx (ref. 18) and In2O3 (ref. 19) have attracted growing interest as potential alternatives for this application due to their high stability and selectivity towards methanol.
More recently, similarly selective CO2 hydrogenation to methanol has also been demonstrated using MoS2 catalysts. In contrast with the aforementioned materials which optimally operate above 250 °C, MoS2 can be active at remarkably low temperatures around 180 °C.20 In addition to the more favorable thermodynamics for methanol formation, these mild operation conditions could offer an economical advantage with respect to other catalysts, in the context of large-scale applications. However, CO2 hydrogenation to methanol can only be achieved in MoS2 with specific properties, as under the typical reaction conditions most formulations of pure MoS2 promote the formation of methane instead of methanol. In fact, only in the presence of basal plane S-vacancies CO2 was shown to dissociate to CO and O at low temperatures, thus allowing for selective methanol production without further hydrogenation to methane.20 This suggests that in favor of selective CO2 hydrogenation to methanol, basal-plane sulfur vacancies should be obtained by preparation methods that induce the formation of sheet-like structures instead of edge-rich nanoparticles.
Moreover, in addition to the MoS2 morphology, methanol selectivity can arise due to other effects. In a recent study, a MoS2/ZnS catalyst produced by a solvothermal route involving a metal–organic framework precursor has shown high selectivity to methanol, as a possible result of ZnS blocking MoS2 edge sites, thereby inhibiting CH4 production.21 Therefore, these results suggest that the investigation of synergistic interactions between MoS2 and other promoter compounds deserves closer attention.
In earlier works, MoS2 has been combined with K,22 Co (ref. 23) and Ni (ref. 24) promoters leading to enhanced CO hydrogenation to higher alcohols at pressures around 100 bar. More recently, these promoters were incorporated into the hydrothermal synthesis of MoS2, leading to considerable changes in its catalytic activity for CO and CO2 hydrogenation, as the selectivity can be shifted from CH4 to CO under lower reaction pressures of 20 bar.25
In this work, K and Co promoted-MoS2 are compared with Mn-promoted MoS2 produced by a hydrothermal method. Following catalytic testing for CO2 hydrogenation, Mn-promoted MoS2 is further characterized by XRD, EXAFS, SEM, EDX, and XPS methods, seeking to investigate the main active phases that drive methanol production in the material.
Experimental
Catalyst synthesis
Mn-promoted MoS2 was produced by a hydrothermal method, in which 2.2 g of ammonium heptamolybdate tetrahydrate ((NH4)6Mo7O24·4H2O, Carl Roth, 99%) was dissolved in approximately 20 mL water, together with the appropriate amounts of thiourea (CH4N2S, Merck, 99%) and manganese sulfate monohydrate (MnSO4·H2O, Merck, 99%). After stirring for 30 minutes, the mixture is transferred to an autoclave and kept at 200 °C during 16 h. The precipitate was filtered, washed with water and ethanol, dried under vacuum at room temperature and finally calcined under N2 for 3 h.For the comparison of pure MoS2 with different promoters, Mn(0.5)–MoS2, whose nomenclature refers to the nominal Mn/Mo molar ratio of 0.5, was produced using a CH4N2S![[thin space (1/6-em)]](https://www.rsc.org/images/entities/char_2009.gif) :
:![[thin space (1/6-em)]](https://www.rsc.org/images/entities/char_2009.gif) MnSO4·H2O
MnSO4·H2O![[thin space (1/6-em)]](https://www.rsc.org/images/entities/char_2009.gif) :
:![[thin space (1/6-em)]](https://www.rsc.org/images/entities/char_2009.gif) (NH4)6Mo7O24·4H2O molar ratio of 32
(NH4)6Mo7O24·4H2O molar ratio of 32![[thin space (1/6-em)]](https://www.rsc.org/images/entities/char_2009.gif) :
:![[thin space (1/6-em)]](https://www.rsc.org/images/entities/char_2009.gif) 3.5
3.5![[thin space (1/6-em)]](https://www.rsc.org/images/entities/char_2009.gif) :
:![[thin space (1/6-em)]](https://www.rsc.org/images/entities/char_2009.gif) 1 and a calcination temperature of 500 °C. The analogous synthesis of K(0.5)–MoS2, Co(0.5)–MoS2 and MoS2 is reported elsewhere.25 The optimized Mn(0.3)–MoS2 was produced using a CH4N2S
1 and a calcination temperature of 500 °C. The analogous synthesis of K(0.5)–MoS2, Co(0.5)–MoS2 and MoS2 is reported elsewhere.25 The optimized Mn(0.3)–MoS2 was produced using a CH4N2S![[thin space (1/6-em)]](https://www.rsc.org/images/entities/char_2009.gif) :
:![[thin space (1/6-em)]](https://www.rsc.org/images/entities/char_2009.gif) MnSO4·H2O
MnSO4·H2O![[thin space (1/6-em)]](https://www.rsc.org/images/entities/char_2009.gif) :
:![[thin space (1/6-em)]](https://www.rsc.org/images/entities/char_2009.gif) (NH4)6Mo7O24·4H2O molar ratio of 24
(NH4)6Mo7O24·4H2O molar ratio of 24![[thin space (1/6-em)]](https://www.rsc.org/images/entities/char_2009.gif) :
:![[thin space (1/6-em)]](https://www.rsc.org/images/entities/char_2009.gif) 2.1
2.1![[thin space (1/6-em)]](https://www.rsc.org/images/entities/char_2009.gif) :
:![[thin space (1/6-em)]](https://www.rsc.org/images/entities/char_2009.gif) 1 and a calcination temperature of 400 °C.
1 and a calcination temperature of 400 °C.
Material characterization
X-ray powder diffraction (XRD) was performed in a PANalytical Empyrean. A Cu-LLF X-ray tube (45 kV, 40 mA, CuKα λ1 = 1.5406 A, λ2 = 1.5444 A) and a GaliPIX detector were used in Bragg–Brentano geometry. Scanning Electron Microscopy (SEM) was carried out using a FEI Quanta 250 FEG at a 5 kV voltage. Attached to the same device is an Octane Elite Super detector, which was employed for Energy Dispersive X-Ray (EDX) analysis, carried out at 20 kV.Near-Ambient-Pressure X-ray Photoelectron Spectroscopy (NAP-XPS) was performed with a near ambient-pressure XPS system from SPECS (AlKα source, Phoibos 150 NAP detector) using a sample stage optimized for catalytic measurements.26 The sample was mounted on a quartz sample carrier with steel backplate and heated with a laser. Pretreatment was carried out at 0.75 mbar H2 and 400 °C and reaction conditions were simulated under 1 mbar H2![[thin space (1/6-em)]](https://www.rsc.org/images/entities/char_2009.gif) :
:![[thin space (1/6-em)]](https://www.rsc.org/images/entities/char_2009.gif) CO2 = 3
CO2 = 3![[thin space (1/6-em)]](https://www.rsc.org/images/entities/char_2009.gif) :
:![[thin space (1/6-em)]](https://www.rsc.org/images/entities/char_2009.gif) 1 at 200 °C. Ex situ XPS was carried out using a SPECS u-Focus system (AlKα source, Phoibos 150 WAL detector). XPS data evaluation was carried out with CasaXPS software.27 The peaks were fitted with Gauss–Lorentz (GL) sum functions and a Shirley background was used. All spectra were calibrated for S 2p3/2 = 162.0 eV.28,29
1 at 200 °C. Ex situ XPS was carried out using a SPECS u-Focus system (AlKα source, Phoibos 150 WAL detector). XPS data evaluation was carried out with CasaXPS software.27 The peaks were fitted with Gauss–Lorentz (GL) sum functions and a Shirley background was used. All spectra were calibrated for S 2p3/2 = 162.0 eV.28,29
XAS spectra of the Mn and Mo K-edge were collected at the SuperXAS beamline at PSI. It operated in top-up mode at 2.4 GeV and a ring current of 400 mA. A silicon-coated mirror (which also reduced higher-order harmonics) was used to collimate the polychromatic X-rays from a 2.9 T superbend magnet, which were subsequently monochromatized by a Si(111) channel-cut crystal. The monochromator was rocked at a frequency of 1 Hz resulting in two spectra per second. For Mn K-edge a Si-coated and for Mo K-edge a Rh-coated toroidal mirror focused the beam. The Mn, Mo K-edge absorption spectra were collected in transmission mode using 15 cm long ionization chambers filled with 1 bar of N2 for Mn and 1 bar of N2 plus 1 bar of Ar for Mo. A metal foil was measured simultaneously for absolute energy calibration. Standard background subtraction, interpolation, and averaging were done with the Python-based software ProQEXAFS.30 Normalization and analysis were performed with Demeter.31 The samples were measured in pellet form diluted by cellulose for optimized signal. In addition to the catalysts, commercial samples of MnO (ABCR, 99%) and MnCO3 (ABCR, 95%) were analyzed for comparison.
Catalytic measurements
The catalytic activity was measured on a “micro effi” system of PID Eng&Tech in a fixed bed plug flow steel reactor. For the measurements, 1 g of the pure catalyst was pretreated at 21 bar H2 at 400 °C. The reaction was conducted for 8 h at each temperature under 20% CO2, 60% H2 and 20% He at 21 bar, with a total flow of 5 mLn min−1. The product gas was analyzed by an Inficon Micro GC 3000 using a Plot Q column.Results and discussion
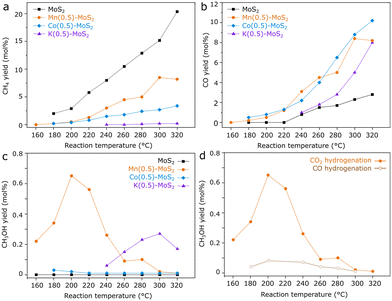
Seeking to identify potentially promising promoters for MoS2 catalysts in CO2 hydrogenation, samples of M-promoted MoS2 (M = K, Co or Mn) have been produced by analogous hydrothermal approaches. Subsequently, their catalytic activity for CO2 hydrogenation was compared with pure MoS2 obtained by the same method, as shown in Fig. 1a–c.As expected, pure MoS2 shows high selectivity for CH4 between 180 and 320 °C, although the activity for CO production through the reverse water-gas-shift reaction becomes prominent above 220 °C. In contrast, the incorporation of K, Co or Mn precursors clearly lowers CH4 and increases CO yields with respect to the pure material over the entire temperature range. Furthermore, Co–MoS2 exhibits negligible methanol yield, while in K–MoS2 some methanol production is observed around 280 °C.
Mn-promoted MoS2, however, shows a distinct performance, with the highest methanol yield occurring at much lower temperatures around 200 °C. While pure MoS2 shows a negligible methanol yield at 180 °C, Mn(0.5)–MoS2 produces methanol with a selectivity of 45% at a CO2 conversion of 0.8% under the same conditions. Furthermore, Fig. 1d shows that methanol production is mostly suppressed when CO is alternatively used as the feed gas, demonstrating that the catalyst cannot produce methanol from CO hydrogenation under these conditions. This observation suggests that a reaction mechanism involving CO as an intermediate can be ruled out.
Therefore, it is likely that methanol is produced via direct CO2 hydrogenation via formate pathway in the presence of the Mn-promoted MoS2 catalyst. Although this finding contrasts with the previously demonstrated CO-based pathway observed for pure MoS2 nanosheets,20 the coexistence of formate and CO intermediates has been already suggested for the MoS2/ZnS catalyst.21 The divergence in these results support the idea that CO2 hydrogenation to methanol in MoS2-based catalysts may undergo distinct pathways due to structural changes and the addition of promoters to MoS2, similarly as observed for copper-based catalysts, for example.11–14
To obtain preliminary insights on the nature of the Mn promoter, characterization of Mn(0.5)-MoS2 was conducted by XRD and in situ NAP-XPS. In Fig. S1,† the XRD pattern of Mn(0.5)–MoS2 shows that the catalyst crystalline structure consists mostly of MoS2,32 MnO,33 and MnO2.34 Differently from previously reported K- and Co-promoted MoS2,25 no other sulfides and sulfates are formed in abundance, as MnS (ref. 35) appears with very low crystallinity in the XRD pattern.
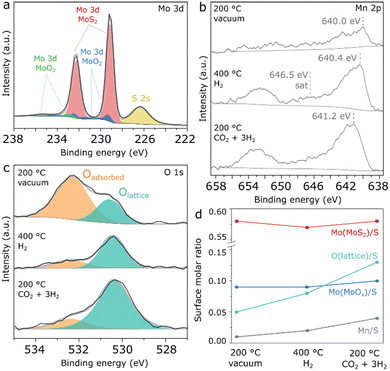
In order to obtain more detailed insights into the surface composition of Mn(0.5)–MoS2 under reaction-relevant conditions, NAP-XPS analysis was carried out firstly under vacuum at 200 °C, followed by H2 flow at 400 °C and CO2 + 3H2 flow at 200 °C. Fig. 2a shows the region comprising Mo 3d and S 2s spectra. A single contribution is observed for sulfur at 226.4 eV, as typically reported for S2− in MoS2.28,29 The Mo 3d region, however, shows a more complex profile with three distinct species, which were fitted in accordance with the characteristic doublet separation of 3.14 eV. Coherently with the observation from XRD, the main Mo surface species consist of Mo4+ associated with MoS2, evidenced by the 3d5/2 peak at 229.1 eV.28,29 Within a similar energy range, Mo4+ from MoO2 is described by two neighboring doublets with different widths, in order to account for the typical asymmetry of MoO2 peaks arising from the distinctive narrow band metallic character of this compound.36 Accordingly, this species is fitted with neighboring 3d5/2 peaks at 229.3 eV and 231.0 eV, and respective 3d3/2 counterparts following area, width and position constraints reported in a previous study. Furthermore, a minor contribution from another doublet is verified, with a 3d5/2 peak at 232.9 eV as a possible result of surface Mo6+ oxides.36,37 Correspondingly, MoS2 produced by an analogous hydrothermal approach without the Mn promoter also presents similar evidences for surface Mo oxides, as seen in Fig. S2.† Since this pure MoS2 sample has shown negligible methanol selectivity, this finding suggests that MoOx should not be responsible for the promoting effect.
As shown in Fig. S3,† the chemical environment of surface Mo and S experiences insignificant changes upon H2 pretreatment and reaction conditions. In Fig. 2b, the Mn 2p region initially shows a doublet with very low intensity, which suggests a low surface concentration of the Mn promoter. However, under H2 treatment at 400 °C, the Mn 2p doublet becomes more prominent, exhibiting a 2p3/2 maximum at 640.4 eV and a satellite feature around 646.5 eV, as possible indicators of Mn2+ in MnO.38 Subsequently, under CO2 + 3H2 flow at 200 °C the Mn 2p doublet is shifted towards higher binding energy by almost 1 eV, suggesting the formation of higher oxidation states such as Mn3+ and Mn4+ at the surface under reaction conditions. However, precise determination and quantification of these phases is challenging in a spectrum with such low intensity due to the complex and asymmetric character of the components associated with manganese oxides.38
In Fig. 2c, the O 1s spectrum shows surface oxygen described by two species: the component at approximately 530.6 eV can be associated with lattice oxygen from Mo or Mn oxides, while the one at 532.3 eV typically refers to surface hydroxyl or organic species.39 Although initially the lattice oxygen component is smaller, it becomes much more prominent than the adsorbed species under pretreatment and reaction conditions.
As a summary of the NAP-XPS analysis, Fig. 2d shows a quantification based on combined survey spectra and high-resolution Mo 3d and O 1s regions. While the components related to MoS2 and MoOx show negligible changes, the Mn/S surface molar ratio increases concurrently with the Olattice/S ratio during H2 pretreatment and reaction conditions, suggesting the formation of surface Mn oxides at the surface under reaction-relevant conditions. Interestingly, Mn2+ appears to coexist with higher Mn oxidation states despite the reducing environment created by H2 and CO2, as a possible consequence of oxygen transferred from bulk to surface or due to the dissociation of CO2 on MnO. Although precise identification of this surface oxidation mechanism is challenging, NAP-XPS analysis suggests that Mn oxides are the key Mn-containing phase under reaction conditions.
Given the promising catalytic activity of Mn-promoted MoS2, the hydrothermal synthesis was further optimized in terms of calcination temperature, content of thiourea and content of Mn precursor. As shown in Fig. S4,† the methanol yield is improved by lowering calcination temperature from 500 °C to 400 °C, the MnSO4·H2O![[thin space (1/6-em)]](https://www.rsc.org/images/entities/char_2009.gif) :
:![[thin space (1/6-em)]](https://www.rsc.org/images/entities/char_2009.gif) (NH4)6Mo7O24·4H2O molar ratio from 3.5
(NH4)6Mo7O24·4H2O molar ratio from 3.5![[thin space (1/6-em)]](https://www.rsc.org/images/entities/char_2009.gif) :
:![[thin space (1/6-em)]](https://www.rsc.org/images/entities/char_2009.gif) 1 to 2.1
1 to 2.1![[thin space (1/6-em)]](https://www.rsc.org/images/entities/char_2009.gif) :
:![[thin space (1/6-em)]](https://www.rsc.org/images/entities/char_2009.gif) 1 and CH4N2S
1 and CH4N2S![[thin space (1/6-em)]](https://www.rsc.org/images/entities/char_2009.gif) :
:![[thin space (1/6-em)]](https://www.rsc.org/images/entities/char_2009.gif) (NH4)6Mo7O24·4H2O from 32
(NH4)6Mo7O24·4H2O from 32![[thin space (1/6-em)]](https://www.rsc.org/images/entities/char_2009.gif) :
:![[thin space (1/6-em)]](https://www.rsc.org/images/entities/char_2009.gif) 1 to 24
1 to 24![[thin space (1/6-em)]](https://www.rsc.org/images/entities/char_2009.gif) :
:![[thin space (1/6-em)]](https://www.rsc.org/images/entities/char_2009.gif) 1.
1.
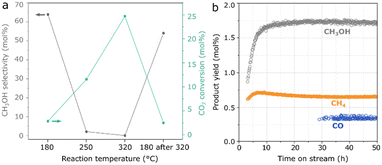
In Fig. 3a, as a result of the optimized hydrothermal method, Mn(0.3)–MoS2 shows a methanol selectivity of 64% with an improved CO2 conversion of 2.8% at 180 °C. At higher temperatures, the formation of CO and CH4 becomes dominant, although further cooling to 180 °C does not lead to an expressive decrease in methanol yield and selectivity. Furthermore, the material also exhibits stable catalytic activity at 180 °C during a 50-hour experiment, as shown in Fig. 3b.
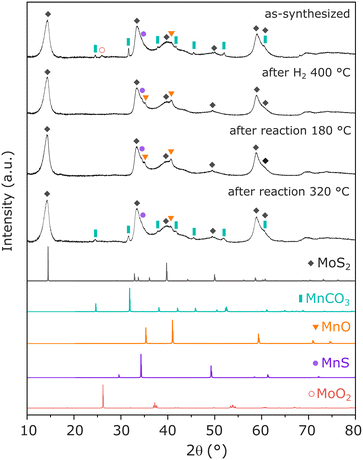
To identify the main Mn-containing phases in the optimized catalyst, XRD and EXAFS have been performed in Mn(0.3)–MoS2 catalyst, following exposure to relevant reaction conditions. In Fig. 4, as-synthesized Mn(0.3)–MoS2 presents a variety of phases. As expected, the main contribution consists of MoS2 (ref. 32) with low crystallinity, which is a typical outcome from the hydrothermal method. The promoter Mn is mostly present in the form of MnCO3 (ref. 40) as a result of the reaction between the Mn precursor and thiourea during the hydrothermal synthesis. Additionally, the diffractogram suggests that minor contributions from MoO2 (ref. 32) and nearly amorphous MnO (ref. 33) and MnS (ref. 35) are also present in the material.
The pretreatment under H2 at 400 °C significantly alters the catalyst structure: although the patterns related to MoS2 and MnS do not experience significant changes, MnCO3 is absent in the pretreated material while a noticeable profile related to MnO (ref. 33) arises. This observation indicates that the pretreatment converts MnCO3 into MnO, in an analogous manner as previously reported under H2 at similar temperatures.41,42 Furthermore, the feature related to MoO2 disappears, possibly indicating amorphization under reducing conditions. All these features are maintained after the material undergoes catalytic reaction at 180 °C, demonstrated to be the optimal condition for CO2 hydrogenation to methanol.
Moreover, after reaction at 320 °C, the material exhibits once again the pattern from MnCO3, indicating that the higher temperature favors the carbonation reaction of MnO in the presence of the CO2 + 3H2 mixture at 21 bar. This phase transformation may be closely associated with the slight catalyst deactivation after reaction at 320 °C, already shown in Fig. 3a.
Given the observation of MnO following catalytic reaction at the ideal conditions for methanol production, this phase can be pointed out as a likely key feature behind the promoting effect of Mn. Nevertheless, due to the possible effect of amorphous Mn-containing species that could remain undetected by XRD, such as other oxides, sulfides or Mn intercalated within MoS2 layers, EXAFS analysis was carried out in order to elucidate the coordination environment of Mn atoms in the catalyst.
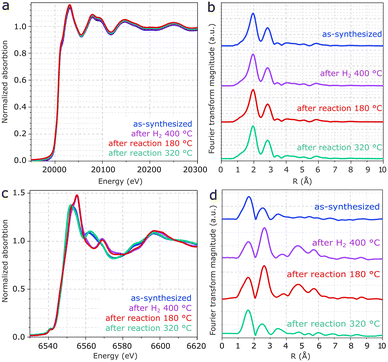
In Fig. 5a, XANES spectra of the Mo edge show negligible differences between the samples. Fig. 5b and S5† show that the Fourier transform of the Mo K-edge exhibits mainly two features related to Mo–S and Mo–Mo, coherently with MoS2.43 As suggested in the EXAFS fitting in Fig. S5 and Table S1,† the higher prominence of the Mo-S coordination with respect to Mo–Mo may be associated with the low crystallinity of MoS2, in line with the XRD patterns and previous EXAFS reports.44,45 Despite the differences observed for Mn, the Mo K-edges remain unchanged regardless of exposure to pretreatment and reaction conditions. Therefore, the result confirms the high stability of MoS2 following reaction conditions and rules out major contributions from Mo oxides to the catalyst composition.
As shown in Fig. 5c, XANES spectra from the Mn K-edge region of Mn(0.3)MoS2 give evidence for considerable changes between as-synthesized and spent catalysts. In Fig. 5d, the corresponding Fourier transforms show 2 main features related to Mn–O and Mn–Mn coordination shells.46,48 Consistently with the presence of MnO observed by XRD after treatment with H2 at 400 °C and reaction at 180 °C, the EXAFS spectrum clearly shows the characteristic profile associated with MnO (ref. 47 and 48) in these two samples, as confirmed by the fitting presented in Fig. S6 and Table S2.†43,45
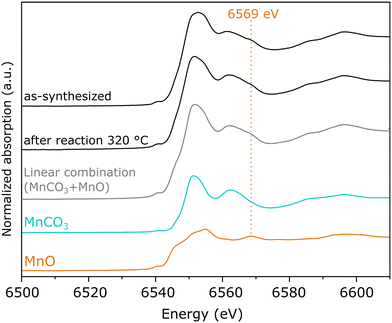
On the other hand, as-synthesized Mn(0.3)MoS2 exhibits a similar XANES spectrum from the one observed after 320 °C reaction, as shown in Fig. 5c. Despite some similarity with the typical XANES profile observed in MnCO3,49 the respective EXAFS data shows considerable differences when compared to a MnCO3 reference in Fig. S7,† which raises the possibility of a more complex composition. In fact, Fig. 6 shows that these XANES spectra may be described as a linear combination of MnCO3 and MnO. A clear indication of this similarity is the distinctive feature of MnO around 6569 eV, which makes the XANES spectra easily distinguishable from those of MnS and other Mn oxides.50 In view of this finding, as-synthesized Mn(0.3)MoS2 is considered to present the Mn promoter in the form of polycrystalline MnCO3 in combination with low-crystallinity MnO, similarly as observed for the material exposed to reaction at 320 °C, since both samples show a weak contribution of the oxide in the XRD patterns in Fig. 4.
Material characterization by XRD and XAS strongly suggests that MoS2 and MnO are the key components related to CO2 hydrogenation to methanol in this catalyst. In order to unveil how these phases are present at the catalyst surface, further characterization was performed by SEM and XPS.
Fig. 7a and S8† show that the Mn(0.3)MoS2 surface is mostly composed of thin MoS2 sheets arranged in a nanoflower morphology, highly similar to MoS2 produced by an analogous hydrothermal synthesis. This aspect is consistent with the broad XRD pattern observed for MoS2, which suggests small crystallites and sparse stacking of MoS2 layers. Moreover, these features coexist with another evident morphology consisting of the micrometer-sized particles shown in more detail in Fig. 6b. After H2 pretreatment and subsequent catalytic reaction at 180 °C, the nanoflower structure associated with MoS2 remains unchanged, as shown in Fig. 6c and d. On the other hand, the larger particles are significantly altered, now featuring a rougher surface with abundant pores in the nanometer range. This finding is consistent with the conversion of MnCO3 into MnO, which releases CO and CO2, thus forming the characteristic porous surface. Such morphology change has also been already reported following exposure of MnCO3 to reducing conditions under similar temperatures.41,42 As demonstrated by XRD and EXAFS analysis of Mn(0.3)MoS2, further increasing reaction temperature to 320 °C induces the partial carbonation of MnO into MnCO3. This effect can also be correlated with the SEM data in Fig. 6e and f, where the characteristic porous surface of MnO is again less prominent.
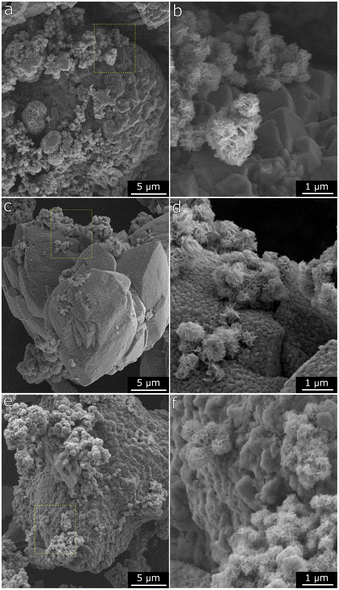 | ||
| Fig. 7 a and b) SEM micrographs of Mn(0.3)–MoS2 after synthesis, c and d) after H2 pretreatment at 400 °C and reaction at 180 °C, e and f) after H2 pretreatment at 400 °C and reaction at 320 °C. | ||
Further evidence for the MoS2/MnO system after H2 pretreatment is shown in Fig. 8, in which the EDX mapping confirms the elemental composition of the nanosheets as mostly Mo and S, while the larger particles are rich in Mn and O. A summary of the EDX spectra contained in the evaluated region is displayed in Fig. S9.†
 | ||
| Fig. 8 a and b) SEM micrograph with the respective EDX element mapping for c) Mo, d) S, e) Mn and f) O atoms for Mn(0.3)–MoS2, after H2 pretreatment at 400 °C. | ||
Finally, further insights into the surface composition of Mn(0.3)–MoS2 are provided by XPS analysis of fresh and used catalysts. In Fig. 9a, the S 2p spectrum shows a unique doublet with the characteristic splitting of 1.2 eV and S 2p3/2 located at 162.0 eV, as typically reported for sulfides such as MoS2. Similarly as observed in the NAP-XPS analysis of Mn(0.5)–MoS2, Fig. 9b indicates that MoS2 (Mo 3d5/2 at 229.1 eV)28,29 coexists with surface MoO2 (Mo 3d5/2 at 229.3 eV and 231.0 eV) as well as MoO3 (Mo 3d5/2 at 232.9 eV),36,37 although MoS2 brings again the most prominent contribution.
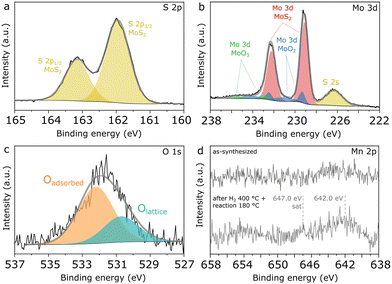 | ||
| Fig. 9 High-resolution XPS spectra of Mn(0.3)–MoS2 showing a) S 2p, b) Mo 3d, c) O 1s and d) Mn 2p regions. | ||
Accordingly, Fig. 9c shows that the O 1s spectrum indicates two distinct contributions: the minor peak at 532.3 eV can be ascribed to adsorbed oxygen from water or surface hydroxyl species, while the most prominent is located at 530.6 eV, associated with Mo and Mn oxides.39 The low intensity of the peak related to lattice oxygen can be correlated with the minor contributions from oxides in the Mo 3d and Mn 2p spectra, thus confirming that metal oxides consist only of a minor contribution to the total surface composition, with MoS2 being the dominant species.
In order to verify possible modifications at the surface of Mn(0.3)MoS2, XPS analysis was also conducted after H2 pretreatment at 400 °C and reaction at 180 °C. As shown in Fig. S10,† these conditions do not promote expressive changes in S 2p, Mo 3d and O 1s regions, suggesting that the surface remains rich in stable MoS2, in line with the strong similarities in the nanosheet morphology observed by SEM both before and after reaction. On the other hand, Fig. 9d shows that a significant change is observed in the Mn 2p region, as the doublet is only visible in the spent catalyst. This effect may be associated with the phase transition from MnCO3 to MnO experienced by the catalyst upon H2 pretreatment, as the higher surface area of the porous MnO could enhance the photoelectron signal related to the Mn species. Even after pretreatment and reaction, the Mn/Mo surface atomic ratio is still approximately 0.1, much lower than the nominal value of 0.3, as a possible outcome of the extensive covering of Mn phases by MoS2 sheets demonstrated by the SEM data.
Furthermore, in the spent catalyst the Mn 2p spectrum is consistent with concurrent MnO and MnOx with higher oxidation states, given the combination of a faint satellite feature related to MnO near 647.0 eV and the 2p3/2 peak located around 242.0 eV.38 Since XRD and EXAFS characterization give evidence of MnO as the only Mn oxide phase in the material, these oxidized MnOx species are understood to be limited to the catalyst surface.
In previous research, S-vacancies in MoS2 have been strongly associated with its catalytic activity, and their presence at the surface can be usually verified by XPS. According to quantification based on Mo 3d and S 2s regions shown in Fig. 9b, an approximate S/Mo ratio of 1.7 is calculated considering only the Mo component associated with MoS2. This low value may be associated with abundant sulfur vacancies formed during calcination under N2, as it does not change significantly after H2 pretreatment and reaction.
Moreover, given that abundant basal plane sulfur vacancies have been strongly suggested as active sites for CO2 hydrogenation to methanol,20 an oxygen chemisorption experiment coupled with in situ DRIFTS has been performed in an attempt to distinguish between edge- and basal plane sulfur vacancies. However, as shown in Fig. S11,† the results indicate no visible changes in the vibrational spectrum before and after O2 flow. Although this suggests a limited concentration of basal plane sulfur vacancies in the catalyst with respect to previous reports, the presence of other surface metal oxides such as MoOx and MnOx introduces overlapping vibrational bands that may hinder the detection of the typical features related to oxygen chemisorption on sulfur vacancies.
In summary, characterization of Mn(0.3)–MoS2 upon hydrothermal synthesis indicates that the Mn promoter is initially present as a combination of MnCO3 and low-crystallinity MnO. Subsequently, H2 pretreatment fully converts the carbonate into MnO, although higher oxidation states for Mn may be present at the surface. This MoS2/MnOx character is maintained after reaction at 180 °C. Even though increasing reaction temperature to 320 °C leads to partial carbonation of MnO, only a mild catalyst deactivation is observed.
Despite the correlation of MoS2/MnOx with catalytic activity, it is challenging to evaluate if MnCO3 plays any role in catalytic activity, as here this phase always coexists with MnO, as demonstrated by XANES analysis. In light of these findings, CO2 hydrogenation to methanol may be associated with the synergy between MoS2 and MnOx, while pure MoS2 obtained by an analogous synthesis approach shows negligible selectivity for methanol.
In view of recent findings, MoS2 growth in the vicinity of MnOx might explain the improved methanol selectivity, since edge-blocking effects could inhibit the production of CH4 in MoS2 edges.21 Therefore, further studies with simpler MoS2/MnOx systems and detailed characterization of S-vacancies will be important for understanding the interplay between MoS2 and MnOx during CO2 hydrogenation to methanol.
In comparison with other MoS2-based materials presented in Table S3† such as few-layer MoS2,20 MoS2/ZnS (ref. 21) and Cu/MoS2@SiO2,51 the Mn(0.3)–MoS2 catalyst has a moderate methanol selectivity at lower or comparable CO2 conversion levels. Accordingly, as shown in the SEM results, MoS2 is not well dispersed with the Mn promoter phase, which would explain the notable production of the CH4 byproduct related to pure MoS2. Therefore, this suggests MoS2/MnOx catalysts could be further improved by employing synthesis methods that enhance the dispersion of these phases and their surface area.
Conclusions
In summary, this work demonstrates that Mn-promoted MoS2 presents promising properties as a catalyst for CO2 hydrogenation to methanol. Even though its catalytic activity is lower than in some other MoS2-based catalysts, a sharp increase in methanol selectivity is observed in comparison with pure MoS2 obtained by an analogous hydrothermal synthesis method. This improvement suggests a promoting effect of Mn, which may be closely associated with the presence of Mn oxides, according to material characterization. More specifically, the optimized catalyst contains MnO as the main Mn phase, although surface characterization indicates that Mn2+ coexists with higher oxidation states under reaction-relevant conditions. This finding suggests that the limited selectivity to methanol could be further improved in catalysts with abundant MoS2/MnOx interfaces.Furthermore, given the importance of basal plane S-vacancies in MoS2 catalysts for CO2 hydrogenation to methanol,20 it can be speculated that MoS2/MnOx interfaces facilitate this reaction in Mn-promoted MoS2, possibly due the blockage of MoS2 edge sites, as previously observed for a MoS2/ZnS system.21 Therefore, further characterization focused on S-vacancies is necessary for a deeper understanding of such edge-blocking mechanism between MoS2 and metal-oxides. Moreover, the evidence for direct CO2 hydrogenation without a CO intermediate in Mn-promoted MoS2, differently as in pure MoS2 nanosheets,20 emphasizes the importance of investigating reaction mechanisms with more detail in future work.
Author contributions
Conceptualization: G. P., K. F. and G. A. S. A. Methodology: G. P. and K. F. Formal analysis: G. A. S. A., G. P. and S. P. Investigation: G. A. S. A., G. P., S. P., T. W., C. R. and R. R. Writing – original draft preparation: G. A. S. A. and G. P. Writing – review & editing: G. A. S. A. and K. F. Supervision: K. F. Funding acquisition: K. F.Conflicts of interest
There are no conflicts to declare.Acknowledgements
The authors acknowledge the support from the doctoral school CO2Refinery, the Swiss Light Source (SLS) for providing beamtime at the SuperXAS beamline at the Paul Scherrer Institute, the Analytical Instrumentation Center (AIC), the X-ray Center (XRC) and the University Service Facility for Transmission Electron Microscopy (USTEM) at TU Wien. S. P. acknowledges NCCR Catalysis (grant number 180544), a National Centre of Competence in Research funded by the Swiss National Science Foundation for his funding. The authors acknowledge TU Wien Bibliothek for financial support through its Open Access Funding Programme.References
- IPCC Climate Change 2023: Synthesis Report. Contribution of Working Groups I, II and III to the Sixth Assessment Report of the Intergovernmental Panel on Climate Change. IPCC, Geneva, Switzerland, 2023.
- C. Hepburn, E. Adlen, J. Beddington, E. A. Carter, S. Fuss, N. Mac Dowell, J. C. Minx, P. Smith and C. K. Williams, Nature, 2019, 575, 87–97 CrossRef CAS PubMed
.
- W. Gao, S. Liang, R. Wang, Q. Jiang, Y. Zhang, Q. Zheng, B. Xie, C. Y. Toe, X. Zhu, J. Wang, L. Huang, Y. Gao, Z. Wang, C. Jo, Q. Wang, L. Wang, Y. Liu, B. Louis, J. Scott, A.-C. Roger, R. Amal, H. He and S.-E. Park, Chem. Soc. Rev., 2020, 49, 8584–8686 RSC
.
-
F. Dalena, A. Senatore, A. Marino, A. Gordano, M. Basile and A. Basile, in Methanol, Elsevier, 2018, pp. 3–28 Search PubMed
.
- K. S. Ng, D. Farooq and A. Yang, Renewable Sustainable Energy Rev., 2021, 150, 111502 CrossRef CAS
.
- M. Bowker, ChemCatChem, 2019, 11, 4238–4246 CrossRef CAS PubMed
.
- D. S. Marlin, E. Sarron and Ó. Sigurbjörnsson, Front. Chem., 2018, 6, 446 CrossRef CAS PubMed
.
- S. Kattel, P. J. Ramírez, J. G. Chen, J. A. Rodriguez and P. Liu, Science, 2017, 355, 1296–1299 CrossRef CAS PubMed
.
- M. Behrens, F. Studt, I. Kasatkin, S. Kühl, M. Hävecker, F. Abild-Pedersen, S. Zander, F. Girgsdies, P. Kurr, B.-L. Kniep, M. Tovar, R. W. Fischer, J. K. Nørskov and R. Schlögl, Science, 2012, 336, 893–897 CrossRef CAS PubMed
.
- X. Jiang, X. Nie, X. Guo, C. Song and J. G. Chen, Chem. Rev., 2020, 120, 7984–8034 CrossRef CAS PubMed
.
- J. Graciani, K. Mudiyanselage, F. Xu, A. E. Baber, J. Evans, S. D. Senanayake, D. J. Stacchiola, P. Liu, J. Hrbek, J. F. Sanz and J. A. Rodriguez, Science, 2014, 345, 546–550 CrossRef CAS PubMed
.
- J. Yu, M. Yang, J. Zhang, Q. Ge, A. Zimina, T. Pruessmann, L. Zheng, J.-D. Grunwaldt and J. Sun, ACS Catal., 2020, 10, 14694–14706 CrossRef CAS
.
- F. Studt, M. Behrens, E. L. Kunkes, N. Thomas, S. Zander, A. Tarasov, J. Schumann, E. Frei, J. B. Varley, F. Abild-Pedersen, J. K. Nørskov and R. Schlögl, ChemCatChem, 2015, 7, 1105–1111 CrossRef CAS
.
- X.-K. Wu, G.-J. Xia, Z. Huang, D. K. Rai, H. Zhao, J. Zhang, J. Yun and Y.-G. Wang, Appl. Surf. Sci., 2020, 525, 146481 CrossRef CAS
.
- M. B. Fichtl, D. Schlereth, N. Jacobsen, I. Kasatkin, J. Schumann, M. Behrens, R. Schlögl and O. Hinrichsen, Appl. Catal., A, 2015, 502, 262–270 CrossRef CAS
.
- Z. Chen, J. Wen, Y. Zeng, M. Li, Y. Tian, F. Yang, M. M.-J. Li, P. Chen, H. Huang, D. Ye and L. Chen, Appl. Catal., B, 2024, 340, 123192 CrossRef CAS
.
- A. M. Beale, E. K. Gibson, M. G. O'Brien, S. D. M. Jacques, R. J. Cernik, M. Di Michiel, P. D. Cobden, Ö. Pirgon-Galin, L. van de Water, M. J. Watson and B. M. Weckhuysen, J. Catal., 2014, 314, 94–100 CrossRef CAS
.
- J. Wang, G. Li, Z. Li, C. Tang, Z. Feng, H. An, H. Liu, T. Liu and C. Li, Sci. Adv., 2017, 3, e1701290 CrossRef PubMed
.
- J. Wang, G. Zhang, J. Zhu, X. Zhang, F. Ding, A. Zhang, X. Guo and C. Song, ACS Catal., 2021, 11, 1406–1423 CrossRef CAS
.
- J. Hu, L. Yu, J. Deng, Y. Wang, K. Cheng, C. Ma, Q. Zhang, W. Wen, S. Yu, Y. Pan, J. Yang, H. Ma, F. Qi, Y. Wang, Y. Zheng, M. Chen, R. Huang, S. Zhang, Z. Zhao, J. Mao, X. Meng, Q. Ji, G. Hou, X. Han, X. Bao, Y. Wang and D. Deng, Nat. Catal., 2021, 4, 242–250 CrossRef CAS
.
- S. Zhou and H. C. Zeng, ACS Catal., 2022, 12, 9872–9886 CrossRef CAS
.
- F. Zeng, X. Xi, H. Cao, Y. Pei, H. J. Heeres and R. Palkovits, Appl. Catal., B, 2019, 246, 232–241 CrossRef CAS
.
- J. Iranmahboob, D. O. Hill and H. Toghiani, Appl. Catal., A, 2002, 231, 99–108 CrossRef CAS
.
- D. Li, C. Yang, N. Zhao, H. Qi, W. Li, Y. Sun and B. Zhong, Fuel Process. Technol., 2007, 88, 125–127 CrossRef CAS
.
- G. Pacholik, L. Enzlberger, A. Benzer, R. Rameshan, M. Latschka, C. Rameshan and K. Föttinger, J. Phys. D: Appl. Phys., 2021, 54, 324002 CrossRef CAS
.
- R. Rameshan, A. Nenning, J. Raschhofer, L. Lindenthal, T. Ruh, H. Summerer, A. Opitz, T. Martin Huber and C. Rameshan, Crystals, 2020, 10, 947 CrossRef CAS
.
- N. Fairley, V. Fernandez, M. Richard-Plouet, C. Guillot-Deudon, J. Walton, E. Smith, D. Flahaut, M. Greiner, M. Biesinger, S. Tougaard, D. Morgan and J. Baltrusaitis, Appl. Surf. Sci. Adv., 2021, 5, 100112 CrossRef
.
- M. A. Baker, R. Gilmore, C. Lenardi and W. Gissler, Appl. Surf. Sci., 1999, 150, 255–262 CrossRef CAS
.
- N. P. Kondekar, M. G. Boebinger, E. V. Woods and M. T. McDowell, ACS Appl. Mater. Interfaces, 2017, 9, 32394–32404 CrossRef CAS PubMed
.
- A. H. Clark, J. Imbao, R. Frahm and M. Nachtegaal, J. Synchrotron Radiat., 2020, 27, 551–557 CrossRef PubMed
.
- B. Ravel and M. Newville, J. Synchrotron Radiat., 2005, 12, 537–541 CrossRef CAS PubMed
.
- R. G. Dickinson and L. Pauling, J. Am. Chem. Soc., 1923, 45, 1466–1471 CrossRef CAS
.
- S. Sasaki, K. Fujino and Y. Takeuchi, Proc. Jpn. Acad., Ser. B, 1979, 55, 43–48 CrossRef CAS
.
- A. Bolzan, C. Fong, B. Kennedy and C. Howard, Aust. J. Chem., 1993, 46, 939 CrossRef CAS
.
- H. Ott, Z. Kristallogr. – Cryst. Mater., 1926, 63, 222–230 CrossRef CAS
.
- D. O. Scanlon, G. W. Watson, D. J. Payne, G. R. Atkinson, R. G. Egdell and D. S. L. Law, J. Phys. Chem. C, 2010, 114, 4636–4645 CrossRef CAS
.
- A. R. Mouat, T. L. Lohr, E. C. Wegener, J. T. Miller, M. Delferro, P. C. Stair and T. J. Marks, ACS Catal., 2016, 6, 6762–6769 CrossRef CAS
.
- E. S. Ilton, J. E. Post, P. J. Heaney, F. T. Ling and S. N. Kerisit, Appl. Surf. Sci., 2016, 366, 475–485 CrossRef CAS
.
- X. Xia, S. Deng, D. Xie, Y. Wang, S. Feng, J. Wu and J. Tu, J. Mater. Chem. A, 2018, 6, 15546–15552 RSC
.
- R. W. G. Wyckoff, Am. J. Sci., 1920, 4-50, 317–360 CrossRef
.
- F. Liu, J. Li, C. Chen, D. Ning, J. Yang, Z. Chu, X. Mao and Y. Lan, Res. Chem. Intermed., 2022, 48, 3007–3018 CrossRef CAS
.
- X.-Y. Pei, D.-C. Mo, S.-S. Lyu, J.-H. Zhang and Y.-X. Fu, J. Mater. Sci.: Mater. Electron., 2018, 29, 11982–11990 CrossRef CAS
.
- Z. Liu, K. Nie, X. Qu, X. Li, B. Li, Y. Yuan, S. Chong, P. Liu, Y. Li, Z. Yin and W. Huang, J. Am. Chem. Soc., 2022, 144, 4863–4873 CrossRef CAS PubMed
.
- M. Polyakov, M. Vandernberg, T. Hanft, M. Poisot, W. Bensch, M. Muhler and W. Grunert, J. Catal., 2008, 256, 126–136 CrossRef CAS
.
- H. Zhang, H. Lin, Y. Zheng, Y. Hu and A. MacLennan, Appl. Catal., B, 2015, 165, 537–546 CrossRef CAS
.
- Y. J. Lee, R. J. Reeder, R. W. Wenskus and E. J. Elzinga, Phys. Chem. Miner., 2002, 29, 585–594 CrossRef CAS
.
- F. W. Fenta, B. W. Olbasa, M.-C. Tsai, M. A. Weret, T. A. Zegeye, C.-J. Huang, W.-H. Huang, T. S. Zeleke, N. A. Sahalie, C.-W. Pao, S. Wu, W.-N. Su, H. Dai and B. J. Hwang, J. Mater. Chem. A, 2020, 8, 17595–17607 RSC
.
- H. Wang, Z. Huang, Z. Jiang, Z. Jiang, Y. Zhang, Z. Zhang and W. Shangguan, ACS Catal., 2018, 8, 3164–3180 CrossRef CAS
.
- Y. J. Lee, R. J. Reeder, R. W. Wenskus and E. J. Elzinga, Phys. Chem. Miner., 2002, 29, 585–594 CrossRef CAS
.
- A. Ristić, M. Mazaj, I. Arčon, N. Daneu, N. Zabukovec Logar, R. Gläser and N. N. Tušar, Cryst. Growth Des., 2019, 19, 3130–3138 CrossRef
.
- S. Zhou, W. Ma, U. Anjum, M. Kosari, S. Xi, S. M. Kozlov and H. C. Zeng, Nat. Commun., 2023, 14, 5872 CrossRef CAS PubMed
.
Footnotes |
| † Electronic supplementary information (ESI) available. See DOI: https://doi.org/10.1039/d3cy01711g |
| ‡ These authors have contributed equally to this work. |
| This journal is © The Royal Society of Chemistry 2024 |

