 Open Access Article
Creative Commons Attribution 3.0 Unported Licence
Heterogeneous catalytic oxidation of furfural with hydrogen peroxide over a niobia catalyst†
Wander Y.
Perez-Sena
a,
Maëlle
Paya
a,
Kari
Eränen
a,
Robert
Lassfolk
b,
Lucas
Lagerquist
c,
Narendra
Kumar
a,
Atte
Aho
a,
Antonio
D'Angelo
 ad,
Tapio
Salmi
a,
Johan
Wärnå
a and
Dmitry Yu.
Murzin
 *a
*a
aLaboratory of Industrial Chemistry and Reaction Engineering, Johan Gadolin Process Chemistry Centre, Åbo Akademi University, FI-20500 Turku/Åbo, Finland. E-mail: dmurzin@abo.fi
bTurku Centre for Chemical and Molecular Analytics, Åbo Akademi University, FI-20500 Turku/Åbo, Finland
cLaboratory of Organic Chemistry, Johan Gadolin Process Chemistry Centre, Åbo Akademi University, FI-20500 Turku/Åbo, Finland
dProcess and Systems Engineering Laboratory, Åbo Akademi University, FI-20500 Turku/Åbo, Finland
First published on 29th February 2024
Abstract
Furfural is a very interesting bio-based platform molecule that can be derived from the pentoses found in hemicelluloses, such as xylose and arabinose. Furfural displays significant potential as a source for the production of various chemicals. By oxidizing furfural with hydrogen peroxide, a range of products can be obtained, including diacids such as succinic and maleic acids, as well as lactones such as 2(5H)-furanone. In this study, the oxidation of furfural was conducted using niobia as a heterogeneous catalyst, which displayed an interesting behavior, giving 2,3-dihydroxybutanedioic acid (tartaric acid) as the main oxidation product. Other typical oxidation products, namely succinic acid and 2(5H)-furanone were also obtained in moderate concentrations. Tartaric acid and the rest of the oxidation products were identified by GS-MS, 1H NMR and 13C NMR. A wide range of conditions were screened to reveal the catalytic behavior of the system, enabling furfural consumption and formation of tartaric acid. Additionally, a plausible reaction network was established based on a previously proposed mechanism and experimental observations that accounted for the production of tartaric acid.
1 Introduction
Over the past few decades, significant efforts have been dedicated to the development of alternative technologies for producing fuels and chemicals, while reducing reliance on petrochemical resources. Biomass has emerged as a source of renewable materials and energy, owing to its abundance and renewable character.1,2 Therefore, transformation of biomass into value-added products has become a top priority for the global sustainable development. Relevant chemicals can be obtained by applying the biorefinery concept,3 in which the biomass is fractionated and the obtained macromolecules are refined further to smaller components. For instance, the C5–C6 sugars after hydrolysis of polysaccharides can be subjected to further rearrangement by partial removal of oxygen atoms generating a variety of renewable platform compounds including furfural, 5-hydroxymethylfurfural (HMF), lactic acid, and levulinic acid.4Furfural, derived from the hemicellulose fraction of biomass,1,5,6 has emerged as a key platform molecule4 due to its versatility and high degree of functionality.6 In the recent years, there has been significant interest in valorizing furfural from both industrial and academic sectors, owing to its market availability, as it is currently produced at a large-scale from abundant and readily available agricultural waste such as bagasse, rice husk and corn cobs.7,8 Furfural, traditionally obtained through a two-step process involving acid hydrolysis of lignocellulosic biomass followed by the dehydration of pentoses, has demonstrated a significant market potential as a source of fuel components and C4–C5 chemicals, such as 2-methylfuran, tetrahydrofuran, valerolactones, butyrolactones, and dicarboxylic acids,4,7,9 many of which are mainly produced from petroleum sources.9
Numerous chemical and bio-routes exist to valorize furfural as a so-called bio-based platform molecule. Some of those methods reported in the literature6 include hydrogenation,10,11 aldol condensation,12,13 amination,14 oxidative esterification,15 as well as gas-16 and liquid-phase17–19 oxidations. Among these approaches, selective oxidation of furfural with hydrogen peroxide offers a promising pathway to various C4 chemical intermediates and products.20 The liquid-phase oxidation of furfural with hydrogen peroxide produces lactones (e.g. furanones) and dicarboxylic acids (e.g. succinic, malic acid, furoic and maleic acid). Formic acid is generated as a byproduct during oxidation process. Moreover, both succinic and maleic acids can be dehydrated to their corresponding anhydrides at elevated temperatures. These C4 molecules have numerous novel applications,4 such as plant growth regulators, bactericides, plasticizers, monomers and components of biodegradable plastics (e.g., polybutylene succinate, polyurethanes). It is also possible to upgrade them further to C4 chemical intermediates via stoichiometrically efficient hydrogenation,21 thus providing bio-based substitutes for these multimillion ton per year products, currently made almost entirely from fossil-based feedstock.4
The selectivity of the furfural oxidation leans toward one or various specific products depending on the catalyst. When acidic catalysts containing Brønsted acid sites17,20,22 are used, for example, ion exchange resins (e.g. Amberlyst-15, Smopex-101), sulfated zirconia and sulphonated functionalized materials, the main oxidation products are succinic acid and 2(5H)-furanone. Catalysts containing Lewis acid sites,23,24 for example TS-1, typically allow better yields of maleic acid, even if, in some cases Lewis acids can also be selective towards succinic acid.25 Some other ways of converting furfural to oxidation products exist, such as using biological routes that involve microorganisms, including bacteria and fungi.26,27 These processes, conducted under aerobic or anaerobic conditions,28–32 are capable of converting pentoses and their derivatives (e.g., furfural, HMF) into value-added products, such as furan-2,5-dicarboxylic acid (FDCA), furoic acid, and furfuryl alcohol.27,33 The performance and selectivity of microorganisms can be improved through genetic modification methods.27
This work explores oxidation of furfural with hydrogen peroxide using niobia as a heterogeneous catalyst, allowing a dramatic switch of the product selectivity from succinic and maleic acids to tartaric acid, never reported before in open literature. Various niobium oxide catalysts were synthesized and evaluated. The kinetic profiles were investigated, which required application of a complex analytic approach, comprising 1H NMR, 13C NMR, GC-MS, HPLC for the identification and quantification of the products. A range of physico-chemical methods (e.g., HRTEM, acidity measurements by FTIR-pyridine, nitrogen physisorption, SEM-EDS, ICP-EOS and XPS) were utilized to characterize the synthesized catalytic materials, to explain the obtained results, and to construct a reaction network.
2 Experimental section
2.1 Materials and chemicals
Furfural (99%), maleic acid (≥99.9%), DL-tartaric acid (99%), DL-malic acid (≥99%), malonic acid (99%), formic acid (≥99.9%), fumaric acid (≥99.9%), succinic acid (≥99.9%), 2(5H)-furanone (98%), 2-furoic acid (98%), niobium(V) oxide (99.9%), niobium(V) chloride (99%), silica gel 60, tetraethyl orthosilicate (TEOS) (98%), 1-propanol (≥99.9%) and PEG–PPG–PEG (Pluronic P123), were all purchased from Sigma Aldrich. 5-Hydroxy-2(5H)-furanone (≥95%) was provided by Activate Scientific. Hydrogen peroxide (>30% w/v) and hydrochloric acid (≥37%) were acquired from Fisher Scientific.2.2 Catalyst preparation
The catalytic materials were prepared following well-established synthesis procedures described in literature.342.3 Catalyst characterization
The surface morphology of the niobium materials was elucidated using high resolution transmission electron microscopy (HRTEM), with a JEM 1400 plus microscope to record the electron microphotographs. Other morphological studies were performed by scanning electron microscopy (SEM) and elemental analysis (EDS) in a Zeiss Leo Gemini 1530 device to determine the surface structure and the metal content, respectively. Nitrogen physisorption at −196 °C was carried out in a Micrometrics 3Flex-3500 instrument to estimate the specific surface areas and pore size distributions of the various catalysts. Specific surface areas were calculated using the BET method, while the pore size distributions and the total pore volume (micro and meso) were estimated using the NLDFT method. The micro pore volume was calculated for 0 to 2 nm pore size range, while the mesoporous volume was calculated for 2 to 50 nm pore size range. X-ray diffraction (XRD) characterization was performed at room temperature using a Cu source of X-ray in a Panalytical Empyrean diffractometer equipped with a PiXcel3D solid state detector. The acidities of the different catalytic materials was determined by Fourier transform infrared spectroscopy (FTIR) with pyridine (≥99.9%) as a probe molecule in an ATI Mattson FTIR Infinity Series spectrometer. The catalyst, pressed to a disk (10–30 mg), was outgassed at 450 °C for 1 h and thereafter the temperature was decreased to 100 °C and background spectra were recorded. Pyridine adsorption was carried out at 100 °C for 30 min. Pyridine was then desorbed at 250, 350 and 450 °C for 1 h, the spectra of the sample were recorded in between every desorption temperature at 100 °C. The quantitative amounts of the Brønsted (1545 cm−1) and Lewis (1450 cm−1) acid sites were calculated with the constants of Emeis.38 The oxidation state of Nb was determined by X-ray photoelectron spectroscopy using a NEXSA XPS (Thermo Fischer Scientific) device by applying Al Kα radiation. The peaks deconvolution was made with XPSPeak4.1 software, prior to deconvolution, Shirley background was subtracted from the data. Inductively coupled plasma-optical emission spectrometry (ICP-OES) was performed in a PerkinElmer Optima 5300 DV instrument to determine metal content in the reaction mixture during catalyst stability experiments, by digesting the samples in a mixture of 30% HCl (Sigma-Aldrich), 65% HNO3 (Sigma-Aldrich) and 50% HBF4 (Sigma-Aldrich) mixture.2.4 Oxidation experiments
Furfural oxidation experiments were carried out in a 100 ml jacketed glass reactor equipped with a condenser and mechanical stirring. The reaction temperature was tracked with a thermocouple at the interior of the reactor vessel, and it was kept constant by an external thermostat device. In a typical oxidation experiment, furfural (16.6–60.8 mmol) was introduced into the reactor, followed by 80 ml of water as the solvent and a determined amount of catalyst (0.5–3 g). The mixture was heated up and once the desired reaction temperature (60–90 °C) was reached, a 30 w/v% hydrogen peroxide solution, corresponding to the desired furfural-to-hydrogen peroxide molar ratio (1![[thin space (1/6-em)]](https://www.rsc.org/images/entities/char_2009.gif) :
:![[thin space (1/6-em)]](https://www.rsc.org/images/entities/char_2009.gif) 2–1
2–1![[thin space (1/6-em)]](https://www.rsc.org/images/entities/char_2009.gif) :
:![[thin space (1/6-em)]](https://www.rsc.org/images/entities/char_2009.gif) 8), was poured into the reactor either at once or dropwise at a specific flowrate using a syringe pump.
8), was poured into the reactor either at once or dropwise at a specific flowrate using a syringe pump.
Periodically withdrawn samples were filtered using 0.45 μm syringe filters. Subsequent analysis was done by high-performance liquid chromatography (HPLC) in a Agilent 1100 instrument equipped with an Aminex HPX-87H column and 0.005 M H2SO4 solution as the mobile phase. A refractive index detector was used for quantification. The analysis of the samples was carried out at 55 °C and 0.5 mL min−1 flowrate. Prior to analysis, calibration of all reagents and products was performed using commercially available standards.
A total organic carbon (TOC) balance was calculated for each experiment to follow the distribution of carbon during the reaction. The TOC was calculated as it follows:
 | (1) |
3 Results and discussion
3.1 Catalyst characterization results
The surface areas of the niobia catalysts are reported in Table 1. Niobium oxide from commercial source displayed an extremely low surface area <1 m2 g−1, while the synthesized niobium oxide displayed a higher surface area of 43 m2 g−1. The synthesized silica supported niobia prepared by the evaporation–impregnation method exhibited on the contrary, a larger surface (273 m2 g−1) mainly due to utilization of silica as a matrix. The same trend was observed for Nb-SBA-15 materials, giving, as expected even larger surface areas ranging from 420 m2 g−1 to 514 m2 g−1. Neat SBA-15 displayed a surface area of 658 m2 g−1. The nitrogen physisorption isotherms and the pore size distributions of all the catalytic materials are displayed in Fig. S1 and S2,† respectively. The materials exhibit type IV isotherms, classified according to IUPAC as per the guidelines.39 Notably, Nb-SBA-15 and Nb2O5(comm) exhibit a hysteresis loop H1, while Nb2O5(meso) and Nb–SiO2 showed the H2 type loop. Additionally, the pore size distributions reveal the presence of both microporosity and mesoporosity across all samples, except for the commercial niobium oxide, which did not exhibit porosity.| Catalyst | S BET (m2 g−1) | V T (cm3 g−1) | V m (%) | Nb (%) | Si/Nb |
|---|---|---|---|---|---|
| Notes: SBET: specific surface area calculated using BET method, VT; total pore volume (micro + meso) calculated by the non-local density functional theory (DFT), Vm; percentage of mesoporous volume (calculated in the pore size range 2–50 nm), Nb and Si/Nb: atomic percent of niobium and Si to Nb ratio determined by EDS. | |||||
| Nb2O5(comm) | <1 | — | — | 22.4 | — |
| Nb2O5(meso) | 43 | 0.12 | 92 | 23.6 | — |
| Nb–SiO2 | 273 | 0.35 | 83 | 3.5 | 8 |
| Nb-SBA-15(5) | 420 | 0.56 | 86 | 5.4 | 5 |
| Nb-SBA-15(8) | 437 | 0.68 | 87 | 3.9 | 7 |
| Nb-SBA-15(12) | 514 | 0.79 | 86 | 2.4 | 12 |
| Nb-SBA-15(23) | 500 | 0.72 | 85 | 1.6 | 19 |
| SBA-15 | 658 | 0.82 | 82 | 0 | — |
The pore volumes of the catalytic materials are reported in Table 1. All the materials exhibit a comparable percentage of mesopores relative to the total volume, which aligns with the reported values for Nb-SBA-15.37 Otherwise, important differences in the total volumes are noticed in the following order; Nb-SBA-15 > Nb–SiO2 > Nb2O5(meso) > Nb2O5(comm), reflecting the nature of materials, i.e. supported vs. bulk materials.
The EDS analysis in Table 1 provides quantification of the atomic niobium content, determined as a relative percentage with the rest of the observed elements being O, Si and Al (as an impurity <0.5%). Notably, neat niobium oxides (Nb2O5(comm) and Nb2O5(meso)) demonstrated nearly identical relative metal amounts, approximately 23%. The supported niobia catalysts: Nb–SiO2, Nb-SBA-15(5), Nb-SBA-15(8), Nb-SBA-15(12), and Nb-SBA-15(23), exhibited varying relative percentages of niobium, namely 3.5%, 5.4%, 3.9%, 2.4%, and 1.6%, respectively, which correspond to Si/Nb ratios of 8, 5, 7, 12 and 19, indicating a good agreement with the nominal loadings used during synthesis.
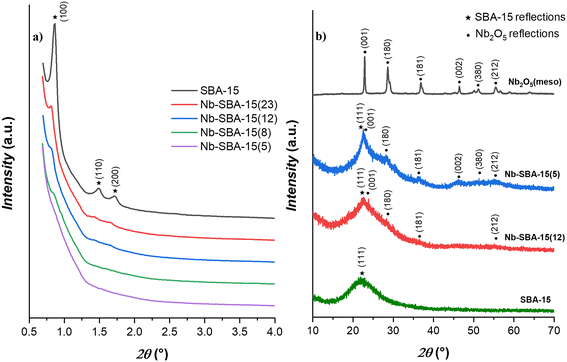
Fig. 1 illustrates the X-ray diffraction (XRD) patterns for the Nb-SBA-15 catalytic materials. In Fig. 1a, the low-angle patterns exhibit characteristic reflection peaks for the mesoporous SBA-15 in the 0.5–4° 2θ range. These peaks include a prominent reflection (100) and two minor reflections (110) and (200). However, as the niobium loading increases, these reflections gradually diminish, indicating some level of decrease in the structural order of the SBA-15 support.
Fig. 1b, which presents the wide-angle patterns, offers further insights into the niobium incorporation to SBA-15. It is evidenced that at a higher niobium loading (Nb-SBA-15(5)), the catalytic materials begin to exhibit discernible reflections associated to the niobia phase. Conversely, a lower niobium loading (Nb-SBA-15(12)) results in poorly defined niobia peaks, suggesting a high degree of dispersion within the SBA-15 framework.40
High resolution transmission electron microscopy (HRTEM) was utilized to examine the textural properties of the various niobium catalysts, with the resulting micrographs displayed in Fig. 2. Commercial Nb2O5 catalysts (Fig. 2a) exhibited a very bulky structure41 with no apparent porosity, which explains the very low surface area determined by nitrogen physisorption analysis of this material. Conversely, the synthesized Nb2O5 catalyst (Fig. 2b) contained finer particles with a higher level of porosity and observable mesoporous structures, primarily due to the synthesis procedure employing a structure-directing agent (Pluronic P123). Irregular porosity is visible in the transmission electron micrographs of Nb–SiO2 catalyst (Fig. 2c), which is typical for the SiO2 support. Nb-SBA-15 (Fig. 2d) displayed clear features of mesoporous materials with a highly ordered and uniform porosity. In contrast with the XRD analysis, the micrographs suggest that addition of a metal during the synthesis of SBA-15 material did significantly impact the expected mesostructured characteristics.37
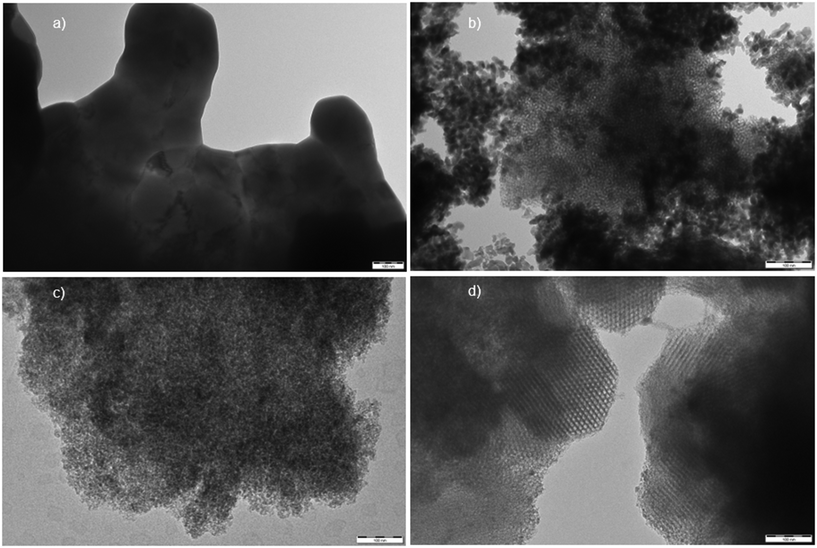 | ||
| Fig. 2 Transmission electron micrographs of the niobium containing catalysts (spacebar = 100 nm): a) Nb2O5(comm) b) Nb2O5(meso) c) Nb–SiO2 d) Nb-SBA-15. | ||
The particle size distributions of the Nb-SBA-15 materials, as determined by HRTEM, are depicted in Fig. S3.† Among various samples, Nb-SBA-15(5) and Nb-SBA-15(8) exhibited the largest niobium cluster sizes, with the mean particle sizes of 19.3 nm and 18.4 nm, respectively. Notably, Nb-SBA-15 materials with lower metal loading ratios (Si/Nb = 12 and 23) displayed smaller mean particle sizes and narrower size distributions. This observation suggests that employing higher metal loading in the synthesis of Nb-SBA-15 leads to formation of larger niobium particle sizes.
The morphological features of the catalytic materials investigated using scanning electron microscopy (SEM) are illustrated in Fig. S4.† The commercial Nb2O5 displayed very large and agglomerated particles with no apparent porous structures, while the synthesized Nb2O5 consisted of small particles that assembled and formed porous domains. The Nb–SiO2 catalyst also displayed fine particles. The Nb-SBA-15 material exhibited a typical for SBA-15 rope-like structure42 with a periodic porosity. These observations are consistent with the TEM analysis results.
Acidity of the catalytic materials was determined using FTIR with pyridine, and the results are reported in Table 2. The commercial niobia oxide exhibited a non-acidic nature, with measured values falling within the range of an analytical error. Similarly, the Nb–SiO2 catalyst displayed low acidity with a total acidity of only 6 μmol g−1. In contrast, the synthesized mesostructured niobia (Nb2O5(meso)) demonstrated significantly higher acidity compared to the commercial counterpart with total acidity of 50 μmol g−1. Both Brønsted and Lewis acid sites were observed in this material.
| Catalyst | BASa (μmol g−1) | LASa (μmol g−1) | TAS (μmol g−1) |
|---|---|---|---|
| Notes: BAS, Brønsted acid sites; LAS, Lewis acid sites; TAS, total acid sites. Measurement of pyridine adsorption–desorption was performed at 250 °C, 350 °C and 450 °C, corresponding to weak (data at 250 °C minus data at 350 °C), medium (data at 350 °C minus data at 450 °C) and strong (data at 450 °C) acid sites, respectively.a Mainly weak acid sites. | |||
| Nb2O5(comm) | 0 | 0 | 0 |
| Nb2O5(meso) | 26 | 23 | 50 |
| Nb–SiO2 | 1 | 5 | 6 |
| Nb-SBA-15(5) | 3 | 23 | 26 |
| Nb-SBA-15(8) | 2 | 22 | 24 |
| Nb-SBA-15(12) | 1 | 26 | 27 |
| Nb-SBA-15(23) | 3 | 18 | 21 |
The Nb-SBA-15 catalysts primarily featured Lewis acid sites. Interestingly, the total acidity (TAS values) of the Nb-SBA-15 materials remained unaffected by deposition of niobium metal. This phenomenon is explained by formation of larger particles with a higher metal loading, as evident from the particle size distributions (Fig. S3†).
These results align with findings from previous studies,37,43 where is suggested that the metal dopant is the main contributor to the acidity observed in Nb-SBA-15 materials, since siliceous SBA-15 is well established as neutral support material.44
3.2 Catalyst activity
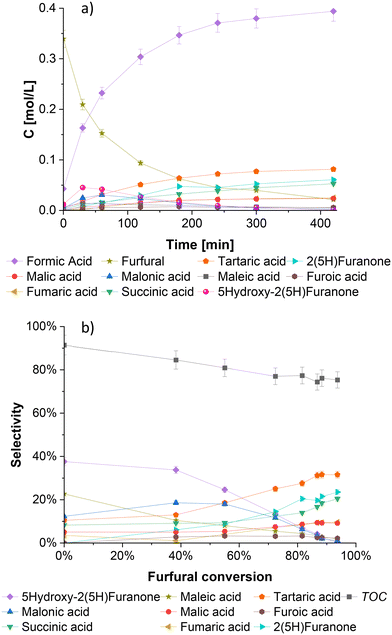
Fig. 3a shows a typical kinetic profile of furfural oxidation on the SBA-15 supported niobium catalyst. The reaction is characterized by a rapid consumption of furfural and immediate formation of formic acid, generated primarily by a direct cleavage of furfural at the beginning of the reaction. Moreover, formic acid can also be produced by degradation of various dicarboxylic products that appear later during the reaction.18 Malonic acid and 5-hydroxy-2(5H)-furanone are immediately formed at the beginning of the experiment, but after the first hour of the reaction, their concentrations decrease rapidly, suggesting their roles as intermediates for the formation of other products.In contrast with the typical heterogeneous catalysts used for the liquid phase oxidation of furfural, namely acidic ionic exchange resins (e.g. Amberlyst-15, Smopex-101, Dowex, Amberlite IR 120H) and some metal oxides and silicates (Al2O3, S-ZrO2, TS-1), typically yielding 2(5H)-furanone, succinic and maleic acids as the major oxidation products, the use of niobium catalyst in the furfural oxidation resulted in tartaric acid as the main product. Notably, tartaric acid has never been observed as a major oxidation product of this process and is usually present in negligible quantities.19,45,461H NMR, 13C NMR and GC-MS (quality: 99) techniques provided clear identification of tartaric acid formation. Some spectra are shown in Fig. S5–S8† for tartaric acid and other oxidation products.
From Fig. 3a it is also observed that 2(5H)-furanone and succinic acid are the second major products from the furfural oxidation on niobium catalyst. Other products such as malic and malonic acids, are present at lower concentrations.
The distribution of products is displayed in Fig. 3b, where the intermediate nature of 5-hydroxy-2(5H)-furanone is clearly visualized. At the beginning of the reaction when the conversion of furfural is low, a high selectivity of 5-hydroxy-2(5H)-furanone is observed, however, as the reaction advances towards a higher furfural conversion, the selectivity of 5-hydroxy-2(5H)-furanone decreases considerably. A similar tendency is evidenced for the selectivities of maleic and malonic acids, indicating their further conversion to other products. Furthermore, when the reaction progresses and a higher furfural conversion is attained, the selectivity for tartaric acid, 2(5H)-furanone and succinic acid increase to maximal values of 32%, 24% and 20%, respectively, with 94% furfural conversion after 7 hours of reaction.
In addition to tartaric acid, 2(5H)-furanone and succinic acid, the selectivity of the final products, fumaric and maleic acids are ca. 10% each by the end of the experiment. The rest of the oxidation products were generated in inferior quantities.
The total carbon balance (TOC) of the liquid phase is illustrated in Fig. 3b, with the values ranging between 91% and 75% from the start to the end of the reaction. A slight and steady decrease of TOC during the reaction can be attributed to degradation reactions, giving gaseous products, and the presence of unidentified components in trace amounts that are difficult to quantify by HPLC. The formation of CO2 from the decomposition of formic acid and short-chain carboxylic acids, has been reported in a previous publication of our group.20 The amount of carbon that escapes in this way can reach up to 18% of the total initial value, depending on the reaction conditions.
Fig. 4 compares the catalytic performance of various niobium catalysts in terms of furfural consumption and tartaric acid production. A blank experiment was conducted as a reference. The consumption rates of furfural increased in the following order: Nb-SBA-15 > Nb2O5(meso) > Nb–SiO2 > Nb2O5(comm) > blank. A similar trend was observed for the generation of tartaric acid. The difference in the behavior of the niobia catalysts can be attributed to their varying properties, particularly the acidity. The consumption rate constant of furfural calculated by a first order kinetics approximation demonstrated a near-linear increase in the correlation with the Lewis acidity of the catalyst, as illustrated in Fig. S9.† Nb-SBA-15 and Nb2O5(meso) displayed the best performances, possibly due to their higher Lewis acidity compared to the other catalysts. This was evident in the case of the commercial pure niobium oxide, which exhibited no acidity (Table 2) and 23% niobium metal as determined by EDS (Table 1).
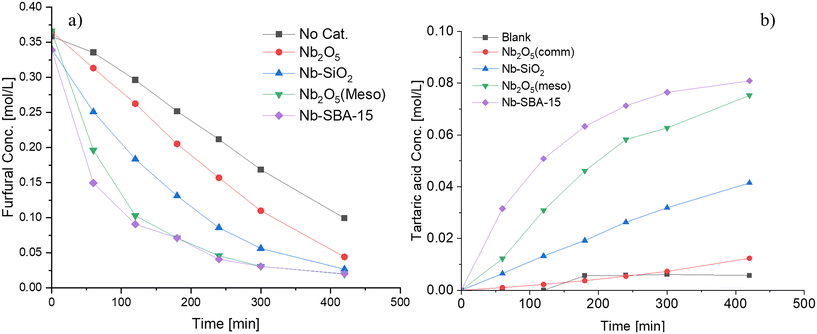 | ||
Fig. 4 Furfural oxidation with different niobium catalysts in a batch mode at 80 °C, Fu![[thin space (1/6-em)]](https://www.rsc.org/images/entities/char_2009.gif) : :![[thin space (1/6-em)]](https://www.rsc.org/images/entities/char_2009.gif) HP = 1 HP = 1![[thin space (1/6-em)]](https://www.rsc.org/images/entities/char_2009.gif) : :![[thin space (1/6-em)]](https://www.rsc.org/images/entities/char_2009.gif) 4, 1 g of catalyst t and 700 rpm; a) furfural consumption b) tartaric acid formation. 4, 1 g of catalyst t and 700 rpm; a) furfural consumption b) tartaric acid formation. | ||
Based on these results, Nb-SBA-15 was identified as the most effective catalyst among the tested ones for the formation of tartaric acid. Further investigations were conducted with this material by synthesizing it with varying nominal amounts of metal to determine its influence on the reaction. The catalytic results are depicted in Fig. 5, illustrating that Si/Nb nominal ratio had almost no effect on the furfural conversion, while the generation rate of tartaric acid was slightly different. Increasing the amount of niobium in the catalyst did not provide any improvement in performance for the Si/Nb nominal ratio exceeding 12. However, a slightly lower tartaric acid concentration was observed when a low nominal amount of niobium was incorporated into SBA-15 (i.e. Si/Nb = 23). The reason for such a behavior is attributed to the almost equal acidities of these materials (Table 2).
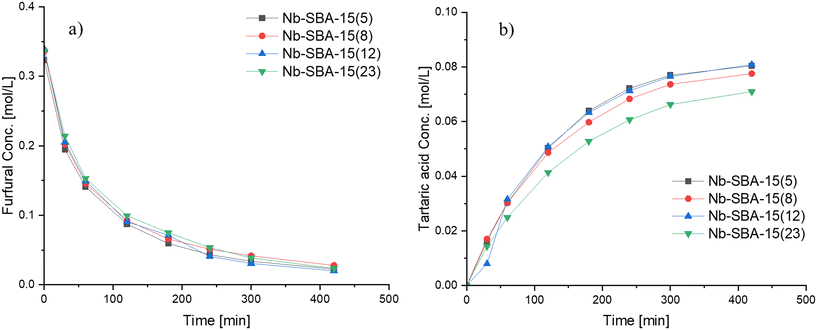 | ||
Fig. 5 Influence of nominal metal loading of Nb-SBA-15 on furfural oxidation in a batch mode at 80 °C, Fu![[thin space (1/6-em)]](https://www.rsc.org/images/entities/char_2009.gif) : :![[thin space (1/6-em)]](https://www.rsc.org/images/entities/char_2009.gif) HP = 1 HP = 1![[thin space (1/6-em)]](https://www.rsc.org/images/entities/char_2009.gif) : :![[thin space (1/6-em)]](https://www.rsc.org/images/entities/char_2009.gif) 4, 1 g of catalyst and 700 rpm; a) furfural consumption b) tartaric acid formation. 4, 1 g of catalyst and 700 rpm; a) furfural consumption b) tartaric acid formation. | ||
3.3 Influence of reaction conditions
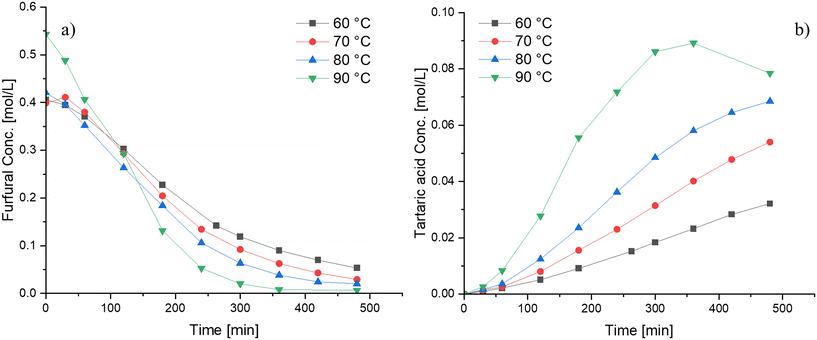
The influence of various reaction parameters on furfural oxidation using Nb-SBA-15 was investigated in detail. The reaction temperature was varied from 60 °C to 90 °C with the results displayed in Fig. 6. As expected, it was observed that the furfural conversion increases with temperature, and the same tendency was evidenced for tartaric acid yield, however, when high temperatures (i.e. 90 °C) were used, the tartaric acid concentration decreased after 7 h of reaction. The reason for the decline in the tartaric acid concentration might be favorable conditions for secondary reactions (i.e. tartaric acid degradation) to smaller molecules such as formic acid, which further decomposes to CO2 and H2O. From Fig. 6, the apparent activation energy for furfural oxidation, determined by its consumption at different temperatures, was calculated from the slope of the Arrhenius plots and found to be approximately 22 kJ mol−1. This value is relatively low when compared to other catalytic systems such as sulfonated resins20 and sulfated zirconia.18The effect of the hydrogen peroxide-to-furfural molar ratio is depicted in Fig. 7. Increasing the molar ratio above 4![[thin space (1/6-em)]](https://www.rsc.org/images/entities/char_2009.gif) :
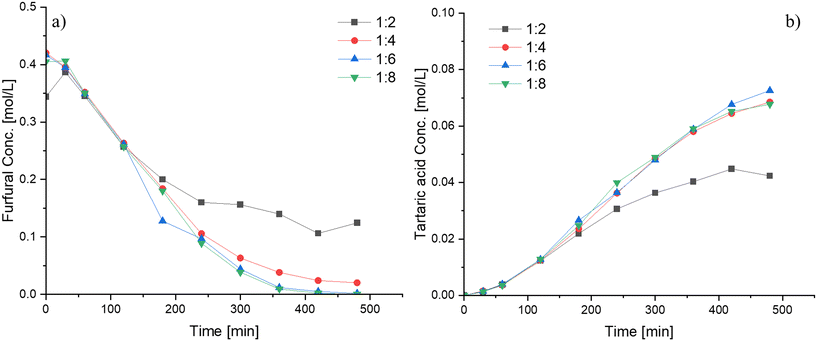
:![[thin space (1/6-em)]](https://www.rsc.org/images/entities/char_2009.gif) 1 does not seem to have any significant effect on the furfural conversion and the tartaric acid yield. Conversely, for a lower molar ratio (Fu
1 does not seem to have any significant effect on the furfural conversion and the tartaric acid yield. Conversely, for a lower molar ratio (Fu![[thin space (1/6-em)]](https://www.rsc.org/images/entities/char_2009.gif) :
:![[thin space (1/6-em)]](https://www.rsc.org/images/entities/char_2009.gif) HP = 1
HP = 1![[thin space (1/6-em)]](https://www.rsc.org/images/entities/char_2009.gif) :
:![[thin space (1/6-em)]](https://www.rsc.org/images/entities/char_2009.gif) 2), a lower furfural consumption rate and subsequently a lower tartaric acid formation rate were observed. An explanation for the needed high amounts of hydrogen peroxide lies in the reaction network of the furfural transformations to various products (Scheme 1), where it is presumed that hydrogen peroxide is used in stoichiometric amounts in several successive steps before the formation of the final products. Additionally, it should be noted that a parallel catalytic hydrogen peroxide decomposition occurs within the system, leading to the consumption of a portion of this reactant as evidenced from Fig. S10.† Consequently, to ensure favorable conditions for furfural oxidation, it is necessary to maintain high levels of hydrogen peroxide throughout the reaction.
2), a lower furfural consumption rate and subsequently a lower tartaric acid formation rate were observed. An explanation for the needed high amounts of hydrogen peroxide lies in the reaction network of the furfural transformations to various products (Scheme 1), where it is presumed that hydrogen peroxide is used in stoichiometric amounts in several successive steps before the formation of the final products. Additionally, it should be noted that a parallel catalytic hydrogen peroxide decomposition occurs within the system, leading to the consumption of a portion of this reactant as evidenced from Fig. S10.† Consequently, to ensure favorable conditions for furfural oxidation, it is necessary to maintain high levels of hydrogen peroxide throughout the reaction.
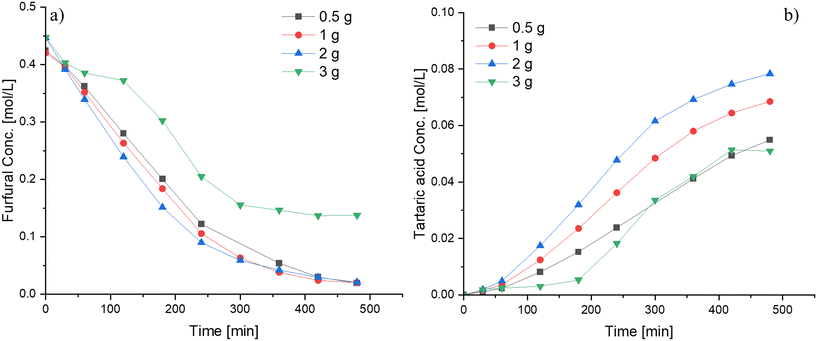
A modest increase in the furfural consumption was observed when the catalyst amount was varied between 0.5 and 2 g (12.5–50 wt% with respect to furfural), whereas the tartaric acid production exhibited a more pronounced response within this range (Fig. 8). However, the catalyst loading exhibits a non-proportional relationship with the reaction rate (Fig. S11†), a behavior atypical for heterogeneous catalytic systems. This phenomenon is attributed to the favorable conditions for mass transfer primarily due to the high viscosity of the reaction mixture when loaded with substantial catalyst amounts. A clear example of this behavior can be observed during the oxidation of furfural at a catalyst loading of 3 g. At such a high loading, the reaction medium adopted a slurry-like paste consistency during the experiment, in which diffusion to the active sites becomes hindered, leading to a suppressed catalytic performance compared to experiments with a lower catalyst loading. Hence, it is preferable to use low catalyst loadings to achieve optimal performance.
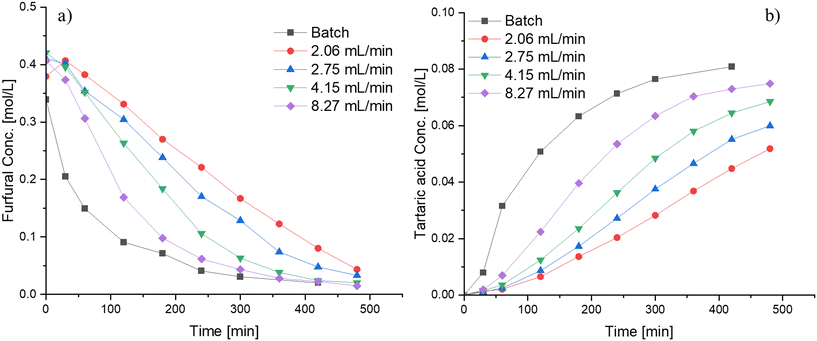
The reaction was carried out primarily in a semibatch operation mode by adding the hydrogen peroxide drop-wise over a period of time, but some experiments were also performed in a batch mode. Fig. 9 displays the influence of varying the flow rate of hydrogen peroxide addition and compares both modes of operation (batch and semibatch). Faster kinetics is observed in the conversion of furfural as well as in the formation of tartaric acid when high flowrates are utilized, probably because of the high amount of hydrogen peroxide present at the beginning of the reaction, elevating the reaction rate. Therefore, even a better performance is observed when the reaction is carried out in a batch setup, resulting in faster furfural consumption and faster tartaric acid production.
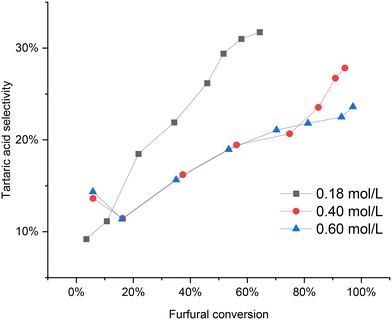
Fig. 10 illustrates the impact of varying the initial furfural concentration. At a low concentration of 0.18 mol L−1, the furfural conversion reached around 70% by the end of the reaction. Conversely, higher initial furfural concentrations exhibited nearly complete conversion, approaching 100%. Interestingly, it was observed that the tartaric acid selectivity improved at lower initial furfural concentrations compared to higher concentrations (0.40 and 0.60 mol L−1). However, the profiles for the 0.4 mol L−1 and 0.6 mol L−1 initial furfural concentrations were quite similar, with a slightly higher tartaric acid selectivity observed for the 0.4 mol L−1 concentration at the end of the reaction.
3.4 Catalyst stability
The stability of the Nb-SBA-15 catalyst was evaluated through two different sets of experiments (Fig. 11). In the first set, once the reaction had been completed, the solid catalyst was recovered from the reaction mixture by filtration and washed several times with water to remove the excess of oxidation products from the catalyst surface. Afterwards, the catalyst was dried overnight and reused in successive experiments.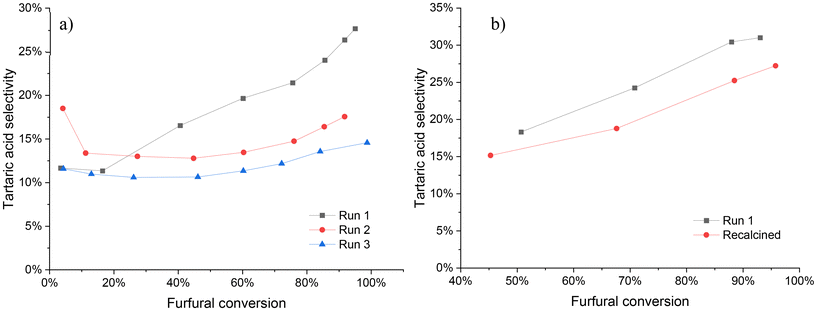 | ||
Fig. 11 Catalyst stability tests under batch condition at 80 °C, Fu![[thin space (1/6-em)]](https://www.rsc.org/images/entities/char_2009.gif) : :![[thin space (1/6-em)]](https://www.rsc.org/images/entities/char_2009.gif) HP = 1 HP = 1![[thin space (1/6-em)]](https://www.rsc.org/images/entities/char_2009.gif) : :![[thin space (1/6-em)]](https://www.rsc.org/images/entities/char_2009.gif) 4, 1 g of catalyst and 700 rpm; a) washed catalyst at 7 h of reaction b) recalcined catalyst at 6 h of reaction. 4, 1 g of catalyst and 700 rpm; a) washed catalyst at 7 h of reaction b) recalcined catalyst at 6 h of reaction. | ||
In the second set of experiments, the recovered catalyst was washed with water, dried overnight, and calcined at 550 °C with a heating rate of 1 °C min−1 for 6 h. The recalcined catalyst was subsequently used in the reaction. This recalcination process aimed to restore the catalytic activity and stability by removing any possible carbonaceous residues and other unwanted species that might have accumulated on the surface during the reaction.
Upon reusing the catalyst after washing and drying (illustrated in Fig. 11a), a decrease in its performance, mainly in the selectivity was evidenced. Although the furfural conversion remained nearly the same (run 1 = 95%, run 2 = 93%, run 3 = 99%) by the end of the reaction (7 h), a significant decrease in tartaric acid selectivity was observed after the second reuse, which continued to decline at a lower percentage in the third reuse. These observations suggest that the catalyst undergoes some level of deactivation during the first experiment.
The stability of Nb-SBA-15 catalyst was further evaluated by calcining the washed and dried catalyst to remove any potential organic contaminants from its surface, as shown in Fig. 11b. Interestingly, a very similar activity profile was obtained upon comparing it to the experiment with fresh catalyst, with furfural conversions of 93% and 97% for the fresh and recalcined catalyst, respectively, by the end of the reaction. However, the tartaric acid selectivity was still found to decrease after calcination, indicating that some degree of catalyst deactivation might persist even after calcination.
The oxidation state of niobia during the stability test was determined with XPS analysis, and the results are presented in Fig. S12.† The XPS spectra of the fresh, spent, and recalcined catalysts revealed a doublet for the Nb 3d5/2 and Nb 3d3/2 bands at 207.47 and 210.03 eV, respectively.47,48 These findings indicate that the niobia catalyst maintains a Nb5+ state throughout the reaction and that no transformation to other niobium species takes place.
To further investigate the cause of deactivation, ICP-EOS analysis was performed, with the results summarized in Table 3. After six hours of the reaction, it was observed that a certain amount of niobium species had leached from the catalytic material into the liquid phase. The impact of niobium loading on the SBA-15 material was previously discussed in section 3.2 (Fig. 5), and it was observed to have almost no influence on the activity, however, a negative effect on tartaric acid selectivity was evidenced. Hence, it can be assumed that niobium leaching is one of factors contributing to catalyst deactivation, as the catalyst activity remains nearly unaffected while only selectivity is compromised during the stability experiments.
| Nb (mg L−1) | ||
|---|---|---|
| Avg. | Std. | |
| Reaction mixture after 6 h | 6.71 | 0.10 |
3.5 Reaction network
The furfural oxidation network on a niobia catalyst was elucidated based on experimental observations and a previous analysis,18 in which it was suggested that the oxidation proceeds through the Baeyer–Villiger oxidation mechanism.46 In the first step, furfural is transformed into furfural-α-hydroxyhydroperoxide, which is subsequently transformed into furoic acid or 2-furanol and formic acid. The oxidation experiment of furoic acid (Fig. S13†) revealed formation of almost all the products derived from furfural oxidation, indicating that a route exist in which furoic acid is converted further, probably to 2-furanol as a key intermediate. The decarboxylation process of furoic acid to produce 2-furanol has been previously described in a DFT analysis by Gong et al.49After the formation of 2-furanol, it undergoes subsequent reactions to form other intermediates and the main products. It is presumed that the unstable 2-furanol is further converted into 5-hydroxy-2(5H)-furanone and isomerized to 2(5H)-furanone and 2(3H)-furanone through parallel and competitive pathways. The oxidation process of 5-hydroxy-2(5H)-furanone was observed to be responsible for the formation of maleic acid (Fig. S14†), while succinic acid is assumed to be mainly formed from 2(3H)-furanone,25 since oxidation experiments with 5-hydroxy-2(5H)-furanone and 2(5H)-furanone (Fig. S14 and S15†) resulted in negligible quantities of this product.
The experimental results for the oxidation of succinic acid are presented in Fig. S16.† No additional oxidation products were observed throughout the experiment, suggesting that succinic acid is a highly stable compound that does not undergo further transformations under the investigated reaction conditions. In contrast, maleic acid is known to undergo reversible isomerization to fumaric acid under acidic conditions.18Scheme 1 also illustrates a potential pathway for the generation of malic acid, which was observed at low concentrations in the catalytic system.
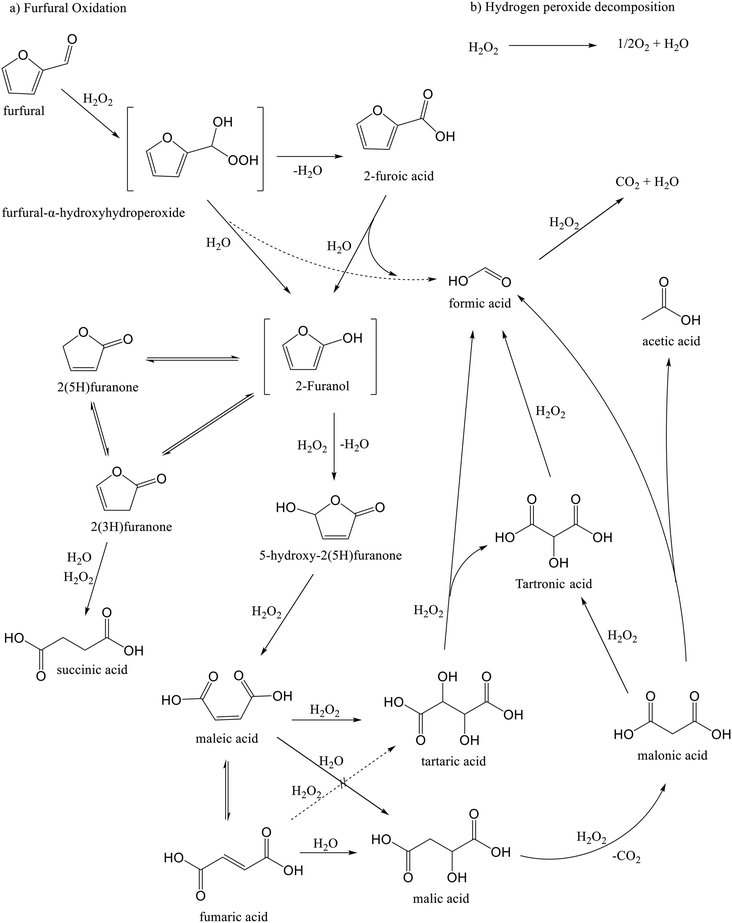 | ||
| Scheme 1 Simplified reaction network for furfural oxidation with hydrogen peroxide over niobia-containing catalyst. | ||
The reaction network depicted in Scheme 1 presumes that tartaric acid can be formed through two main pathways: oxidation of fumaric and maleic acids. While both pathways are chemically the same and have been reported to exist,50 it was necessary to perform oxidation experiments of fumaric and maleic acids to verify those routes at the studied reaction conditions. Oxidation of maleic acid (Fig. 12a) resulted in the rapid generation of large amounts of tartaric acid, along with trace amounts of formic and malic acids, while the oxidation of fumaric acid (Fig. 12b) produced very low amounts of tartaric acid, along with maleic acid formed by isomerization and trace amounts of formic and malic acids. These results indicate that tartaric acid is primarily formed via the oxidation of maleic acid during furfural oxidation on Nb-SBA-15 catalyst.
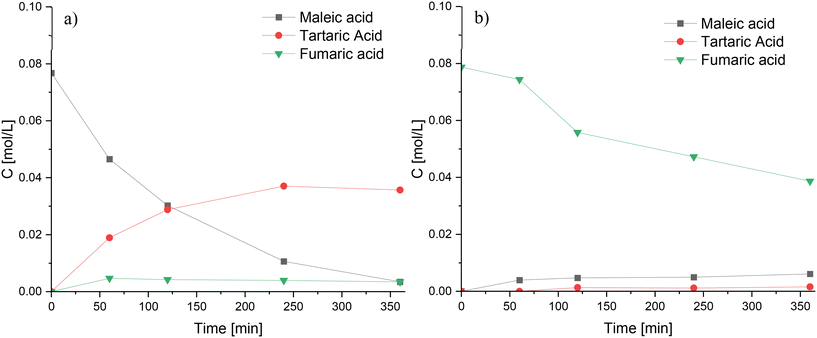 | ||
Fig. 12 Oxidation experiments of maleic acid and fumaric acid using Nb-SBA-15 at 80 °C, Fu![[thin space (1/6-em)]](https://www.rsc.org/images/entities/char_2009.gif) : :![[thin space (1/6-em)]](https://www.rsc.org/images/entities/char_2009.gif) HP = 1 HP = 1![[thin space (1/6-em)]](https://www.rsc.org/images/entities/char_2009.gif) : :![[thin space (1/6-em)]](https://www.rsc.org/images/entities/char_2009.gif) 4, 1 g of catalyst and 700 rpm; a) maleic acid oxidation b) fumaric acid oxidation. 4, 1 g of catalyst and 700 rpm; a) maleic acid oxidation b) fumaric acid oxidation. | ||
Additional oxidation experiments were conducted to gain a deeper understanding of the reaction network. For example, the oxidation of tartaric acid (Fig. S17†) resulted in partial degradation to tartronic and formic acid, which was assumed to be the main route,51,52 however, other unidentified compounds were present, too. The oxidation of malic acid primarily yielded malonic and acetic acids as the main products (Fig. S18†). Furthermore, oxidation of malonic acid, displayed in Fig. S19,† predominantly produced tartronic, formic, and acetic acids. Based on these observations, it is suggested that malonic acid is derived from malic acid53–56 and can further undergo either conversion to tartronic acid57 or cleavage into formic and acetic acids.54,56 Otherwise, it is worth highlighting that there might be alternative routes for the formation of malonic acid, as evidenced by its presence at the early stages of the furfural oxidation on Nb-SBA-15 (Fig. 3).
It is important to note that the reaction network depicted in Scheme 1 provides a simplified representation of the actual, more intricate mechanism, which typically involves a series of rearrangements and tautomeric transformations, as well as the formation and disappearance of short-lived compounds, which might be challenging to detect and quantify.46,58 Additionally, it is worth mentioning that the product distribution and formation pathways can vary significantly depending on the specific catalyst and reaction conditions employed, as has been demonstrated in prior studies.17,18,24,59
4 Conclusions
Furfural oxidation with hydrogen peroxide in the presence of niobia catalysts was explored. Notably, this study revealed a substantial production of tartaric acid as the main oxidation product, which has never been reported at such high quantities in the actual system. Alongside tartaric acid, other typical oxidation products, such as succinic acid and 2-(5H)furanone, were detected in significant quantities, leading to a product distribution.Among the various synthesized niobia catalysts, Nb-SBA-15 exhibited the most promising performance in terms of furfural consumption and tartaric acid production. This superior catalytic behavior was attributed to the Lewis acidity of the catalyst, property that displayed an almost linear relationship with the rate of furfural consumption.
A compressive reaction network was established based on the experimental observations. Individual experiments were conducted with each of the reaction products, and it was determined that the tartaric acid formation in the system primarily occurs through the oxidation of maleic acid.
Conflicts of interest
There are no conflicts to declare.Acknowledgements
The work is a part of the activities of the Johan Gadolin Process Chemistry Centre (PCC). The financial support from the Research Council of Finland (Academy of Finland) is gratefully acknowledged (Johan Wärnå and Tapio Salmi, Academy Professor's grants 319002, 320115, 345053).References
- N. W. Dulie, B. Woldeyes, H. D. Demsash and A. S. Jabasingh, An Insight into the Valorization of Hemicellulose Fraction of Biomass into Furfural: Catalytic Conversion and Product Separation, Waste Biomass Valoriz., 2021, 12(2), 531–552, DOI:10.1007/s12649-020-00946-1.
- R. A. Sheldon, Green and Sustainable Manufacture of Chemicals from Biomass: State of the Art, Green Chem., 2014, 16(3), 950–963, 10.1039/C3GC41935E.
- F. Cherubini, The Biorefinery Concept: Using Biomass Instead of Oil for Producing Energy and Chemicals, Energy Convers. Manage., 2010, 51(7), 1412–1421, DOI:10.1016/j.enconman.2010.01.015.
- X. Li, P. Jia and T. Wang, Furfural: A Promising Platform Compound for Sustainable Production of C4 and C5 Chemicals, ACS Catal., 2016, 6(11), 7621–7640, DOI:10.1021/acscatal.6b01838.
- Y. Luo, Z. Li, X. Li, X. Liu, J. Fan, J. H. Clark and C. Hu, The Production of Furfural Directly from Hemicellulose in Lignocellulosic Biomass: A Review, Catal. Today, 2019, 319, 14–24, DOI:10.1016/j.cattod.2018.06.042.
- R. Mariscal, P. Maireles-Torres, M. Ojeda, I. Sádaba and M. L. Granados, Furfural: A Renewable and Versatile Platform Molecule for the Synthesis of Chemicals and Fuels, Energy Environ. Sci., 2016, 9(4), 1144–1189, 10.1039/C5EE02666K.
- G. Machado, S. Leon, F. Santos, R. Lourega, J. Dullius, M. E. Mollmann and P. Eichler, Literature Review on Furfural Production from Lignocellulosic Biomass, Nat. Resour., 2016, 7(3), 115–129, DOI:10.4236/nr.2016.73012.
- M. Kabbour and R. Luque, Chapter 10 - Furfural as a Platform Chemical: From Production to Applications, in Biomass, Biofuels, Biochemicals, ed. S. Saravanamurugan, A. Pandey, H. Li and A. Riisager, Elsevier, 2020, pp. 283–297, DOI:10.1016/B978-0-444-64307-0.00010-X.
- Y. N. Palai, A. Fukuoka and A. Shrotri, Unlocking the Potential of 5-Hydroxy-2(5H)-Furanone as a Platform for Bio-Based Four Carbon Chemicals, ACS Catal., 2024, 2545–2551, DOI:10.1021/acscatal.3c04872.
- Y. Wang, D. Zhao, D. Rodríguez-Padrón and C. Len, Recent Advances in Catalytic Hydrogenation of Furfural, Catalysts, 2019, 9(10), 796, DOI:10.3390/catal9100796.
- Z. Liu, X. Tong, J. Liu and S. Xue, A Smart Catalyst System for the Valorization of Renewable Furfural in Aliphatic Alcohols, Catal. Sci. Technol., 2016, 6(4), 1214–1221, 10.1039/C5CY01195G.
- I. Sádaba, M. Ojeda, R. Mariscal, J. L. G. Fierro and M. L. Granados, Catalytic and Structural Properties of Co-Precipitated Mg–Zr Mixed Oxides for Furfural Valorization via Aqueous Aldol Condensation with Acetone, Appl. Catal., B, 2011, 101(3), 638–648, DOI:10.1016/j.apcatb.2010.11.005.
- O. Kikhtyanin, V. Kelbichová, D. Vitvarová, M. Kubů and D. Kubička, Aldol Condensation of Furfural and Acetone on Zeolites, Catal. Today, 2014, 227, 154–162, DOI:10.1016/j.cattod.2013.10.059.
- K. Saini, S. Kumar, H. Li, S. A. Babu and S. Saravanamurugan, Advances in the Catalytic Reductive Amination of Furfural to Furfural Amine: The Momentous Role of Active Metal Sites, ChemSusChem, 2022, 15(7), e202200107, DOI:10.1002/cssc.202200107.
- F. Menegazzo, M. Manzoli, A. di Michele, E. Ghedini and M. Signoretto, Supported Gold Nanoparticles for Furfural Valorization in the Future Bio-Based Industry, Top. Catal., 2018, 61(18), 1877–1887, DOI:10.1007/s11244-018-1003-5.
- X. Li, J. Ko and Y. Zhang, Highly Efficient Gas-Phase Oxidation of Renewable Furfural to Maleic Anhydride over Plate Vanadium Phosphorus Oxide Catalyst, ChemSusChem, 2018, 11(3), 612–618, DOI:10.1002/cssc.201701866.
- H. Choudhary, S. Nishimura and K. Ebitani, Metal-Free Oxidative Synthesis of Succinic Acid from Biomass-Derived Furan Compounds Using a Solid Acid Catalyst with Hydrogen Peroxide, Appl. Catal., A, 2013, 458, 55–62, DOI:10.1016/j.apcata.2013.03.033.
- D. Yu. Murzin, E. Bertrand, P. Tolvanen, S. Devyatkov, J. Rahkila, K. Eränen, J. Wärnå and T. Salmi, Heterogeneous Catalytic Oxidation of Furfural with Hydrogen Peroxide over Sulfated Zirconia, Ind. Eng. Chem. Res., 2020, 59(30), 13516–13527, DOI:10.1021/acs.iecr.0c02566.
- L. A. Badovskaya, V. M. Latashko, V. V. Poskonin, E. P. Grunskaya, Z. I. Tyukhteneva, S. G. Rudakova, S. A. Pestunova and A. V. Sarkisyan, Catalytic Oxidation of Furan and Hydrofuran Compounds. 7. Production of 2(5H)-Furanone by Oxidation of Furfural with Hydrogen Peroxide and Some of Its Transformations in Aqueous Solutions, Chem. Heterocycl. Compd., 2002, 38(9), 1040–1048, DOI:10.1023/A:1021288711593.
- F. Saleem, P. Müller, K. Eränen, J. Warnå, D. Yu Murzin and T. Salmi, Kinetics and Modelling of Furfural Oxidation with Hydrogen Peroxide over a Fibrous Heterogeneous Catalyst: Effect of Reaction Parameters on Yields of Succinic Acid, J. Chem. Technol. Biotechnol., 2017, 92(9), 2206–2220, DOI:10.1002/jctb.5248.
- X. Li, W. Wan, S. Kattel, J. G. Chen and T. Wang, Selective Hydrogenation of Biomass-Derived 2(5H)-Furanone over Pt-Ni and Pt-Co Bimetallic Catalysts: From Model Surfaces to Supported Catalysts, J. Catal., 2016, 344, 148–156, DOI:10.1016/j.jcat.2016.09.027.
- U. Thubsuang, S. Chotirut, K. Nuithitikul, A. Payaka, N. Manmuanpom, T. Chaisuwan and S. Wongkasemjit, Oxidative Upgrade of Furfural to Succinic Acid Using SO3H-Carbocatalysts with Nitrogen Functionalities Based on Polybenzoxazine, J. Colloid Interface Sci., 2020, 565, 96–109, DOI:10.1016/j.jcis.2020.01.001.
- S. Shi, H. Guo and G. Yin, Synthesis of Maleic Acid from Renewable Resources: Catalytic Oxidation of Furfural in Liquid Media with Dioxygen, Catal. Commun., 2011, 12(8), 731–733, DOI:10.1016/j.catcom.2010.12.033.
- N. Alonso-Fagúndez, I. Agirrezabal-Telleria, P. L. Arias, J. L. G. Fierro, R. Mariscal and M. López Granados, Aqueous-Phase Catalytic Oxidation of Furfural with H 2 O 2: High Yield of Maleic Acid by Using Titanium Silicalite-1, RSC Adv., 2014, 4(98), 54960–54972, 10.1039/C4RA11563E.
- Y. N. Palai, A. Shrotri and A. Fukuoka, Selective Oxidation of Furfural to Succinic Acid over Lewis Acidic Sn-Beta, ACS Catal., 2022, 12(6), 3534–3542, DOI:10.1021/acscatal.1c05348.
- M. Krystof, M. Pérez-Sánchez and P. Domínguez de María, Lipase-Mediated Selective Oxidation of Furfural and 5-Hydroxymethylfurfural, ChemSusChem, 2013, 6(5), 826–830, DOI:10.1002/cssc.201200954.
- K. Kawanabe, R. Aono and K. Kino, 2,5-Furandicarboxylic Acid Production from Furfural by Sequential Biocatalytic Reactions, J. Biosci. Bioeng., 2021, 132(1), 18–24, DOI:10.1016/j.jbiosc.2021.03.001.
- H. Ran, J. Zhang, Q. Gao, Z. Lin and J. Bao, Analysis of Biodegradation Performance of Furfural and 5-Hydroxymethylfurfural by Amorphotheca Resinae ZN1, Biotechnol. Biofuels, 2014, 7(1), 51, DOI:10.1186/1754-6834-7-51.
- P. Wang, J. E. Brenchley and A. E. Humphrey, Screening Microorganisms for Utilization of Furfural and Possible Intermediates in Its Degradative Pathway, Biotechnol. Lett., 1994, 16(9), 977–982, DOI:10.1007/BF00128637.
- M. E. Diaz De Villegas, P. Villa, M. Guerra, E. Rodriguez, D. Redondo and A. Martinez, Conversion of Furfural into Furfuryl Alcohol by Saccharomyces Cervisiae 354, Acta Biotechnol., 1992, 12(4), 351–354, DOI:10.1002/abio.370120420.
- Y. Zhang, B. Han and T. C. Ezeji, Biotransformation of Furfural and 5-Hydroxymethyl Furfural (HMF) by Clostridium Acetobutylicum ATCC 824 during Butanol Fermentation, New Biotechnol., 2012, 29(3), 345–351, DOI:10.1016/j.nbt.2011.09.001.
- Y. Yan, C. Bu, Q. He, Z. Zheng and J. Ouyang, Efficient Bioconversion of Furfural to Furfuryl Alcohol by Bacillus Coagulans NL01, RSC Adv., 2018, 8(47), 26720–26727, 10.1039/C8RA05098H.
- V. Kumar Vaidyanathan, K. Saikia, P. Senthil Kumar, A. Karanam Rathankumar, G. Rangasamy and G. Dattatraya Saratale, Advances in Enzymatic Conversion of Biomass Derived Furfural and 5-Hydroxymethylfurfural to Value-Added Chemicals and Solvents, Bioresour. Technol., 2023, 378, 128975, DOI:10.1016/j.biortech.2023.128975.
- M. Ziolek, Niobium-Containing Catalysts—the State of the Art, Catal. Today, 2003, 78(1), 47–64, DOI:10.1016/S0920-5861(02)00340-1.
- D. Ruiz, A. Aho, P. Mäki-Arvela, N. Kumar, H. Oliva and D. Yu. Murzin, Direct Amination of Dodecanol over Noble and Transition Metal Supported Silica Catalysts, Ind. Eng. Chem. Res., 2017, 56(45), 12878–12887, DOI:10.1021/acs.iecr.7b03580.
- C. Tagusagawa, A. Takagaki, S. Iguchi, K. Takanabe, J. N. Kondo, K. Ebitani, S. Hayashi, T. Tatsumi and K. Domen, Highly Active Mesoporous Nb–W Oxide Solid-Acid Catalyst, Angew. Chem., Int. Ed., 2010, 49, 1128–1132, DOI:10.1002/anie.200904791.
- M. Trejda, A. Tuel, J. Kujawa, B. Kilos and M. Ziolek, Niobium Rich SBA-15 Materials – Preparation, Characterisation and Catalytic Activity, Microporous Mesoporous Mater., 2008, 110(2), 271–278, DOI:10.1016/j.micromeso.2007.06.015.
- C. A. Emeis, Determination of Integrated Molar Extinction Coefficients for Infrared Absorption Bands of Pyridine Adsorbed on Solid Acid Catalysts, J. Catal., 1993, 141(2), 347–354, DOI:10.1006/jcat.1993.1145.
- K. S. W. Sing, Reporting Physisorption Data for Gas/Solid Systems with Special Reference to the Determination of Surface Area and Porosity (Recommendations 1984), Pure Appl. Chem., 1985, 57(4), 603–619, DOI:10.1351/pac198557040603.
- Â. Silva, K. Wilson, A. F. Lee, V. C. dos Santos, A. C. Cons Bacilla, K. M. Mantovani and S. Nakagaki, Nb2O5/SBA-15 Catalyzed Propanoic Acid Esterification, Appl. Catal., B, 2017, 205, 498–504, DOI:10.1016/j.apcatb.2016.12.066.
- E. L. S. Ngee, Y. Gao, X. Chen, T. M. Lee, Z. Hu, D. Zhao and N. Yan, Sulfated Mesoporous Niobium Oxide Catalyzed 5-Hydroxymethylfurfural Formation from Sugars, Ind. Eng. Chem. Res., 2014, 53(37), 14225–14233, DOI:10.1021/ie501980t.
- J. Wang, H. Ge and W. Bao, Synthesis and Characteristics of SBA-15 with Thick Pore Wall and High Hydrothermal Stability, Mater. Lett., 2015, 145, 312–315, DOI:10.1016/j.matlet.2015.01.113.
- K. Peng, X. Li, X. Liu and Y. Wang, Hydrothermally Stable Nb-SBA-15 Catalysts Applied in Carbohydrate Conversion to 5-Hydroxymethyl Furfural, Mol. Catal., 2017, 441, 72–80, DOI:10.1016/j.mcat.2017.04.034.
- C. Pizzolitto, E. Ghedini, S. Taghavi, F. Menegazzo, G. Cruciani, M. Peurla, K. Eränen, I. Heinmaa, A. Aho, N. Kumar, D. Y. Murzin, T. Salmi and M. Signoretto, Acid Sites Modulation of Siliceous-Based Mesoporous Material by Post Synthesis Methods, Microporous Mesoporous Mater., 2021, 328, 111459, DOI:10.1016/j.micromeso.2021.111459.
- F. Ahmadi, L. Zarrin, S. Sharifnia and S. N. Hosseini, Analyzed and Proposed Mechanism of Photocatalytic Degradation of Furfural at TiO2 Nano-Particles by HPLC-UV and LC-Mass Methods, J. Liq. Chromatogr. Relat. Technol., 2014, 37(12), 1750–1762, DOI:10.1080/10826076.2013.809543.
- L. A. Badovskaya and V. V. Poskonin, Rearrangements and Tautomeric Transformations of Heterocyclic Compounds in Homogeneous Reaction Systems Furfural–H2O2–Solvent, Russ. J. Gen. Chem., 2018, 88(8), 1568–1579, DOI:10.1134/S1070363218080030.
- M. Saha, S. Ghosh, S. Paul, B. Dalal and S. K. De, Nb-Dopant-Induced Tuning of Optical and Electrical Property of Anatase TiO2 Nanocrystals, ChemistrySelect, 2018, 3(23), 6654–6664, DOI:10.1002/slct.201800434.
- Z. Yang, X. Lu, W. Tan, J. Zhao, D. Yang, Y. Yang, Y. He and K. Zhou, XPS Studies of Nitrogen Doping Niobium Used for Accelerator Applications, Appl. Surf. Sci., 2018, 439, 1119–1126, DOI:10.1016/j.apsusc.2017.12.214.
- L. Gong, N. Agrawal, A. Roman, A. Holewinski and M. J. Janik, Density Functional Theory Study of Furfural Electrochemical Oxidation on the Pt (1 1 1) Surface, J. Catal., 2019, 373, 322–335, DOI:10.1016/j.jcat.2019.04.012.
- N. A. Milas and E. M. Terry, Oxidation of Fumaric and of Maleic Acid to Tartaric acid. 1, J. Am. Chem. Soc., 1925, 47(5), 1412–1418, DOI:10.1021/ja01682a028.
- M. Ibert, F. Marsais, N. Merbouh and C. Brückner, Determination of the Side-Products Formed during the Nitroxide-Mediated Bleach Oxidation of Glucose to Glucaric Acid, Carbohydr. Res., 2002, 337(11), 1059–1063, DOI:10.1016/S0008-6215(02)00072-1.
- A. C. Clark, P. D. Prenzler and G. R. Scollary, Impact of the Condition of Storage of Tartaric Acid Solutions on the Production and Stability of Glyoxylic Acid, Food Chem., 2007, 102(3), 905–916, DOI:10.1016/j.foodchem.2006.06.029.
- A. Danion, J. Disdier, C. Guillard and N. Jaffrezic-Renault, Malic Acid Photocatalytic Degradation Using a TiO2-Coated Optical Fiber Reactor, J. Photochem. Photobiol., A, 2007, 190(1), 135–140, DOI:10.1016/j.jphotochem.2007.03.022.
- L. Oliviero, J. Barbier, D. Duprez, H. Wahyu, J. W. Ponton, I. S. Metcalfe and D. Mantzavinos, Wet Air Oxidation of Aqueous Solutions of Maleic Acid over Ru/CeO2 Catalysts, Appl. Catal., B, 2001, 35(1), 1–12, DOI:10.1016/S0926-3373(01)00226-0.
- A. Drif, A. Pineda, D. Morvan, V. Belliere-Baca, K. D. O. Vigier and F. Jérôme, Catalytic Oxidative Dehydrogenation of Malic Acid to Oxaloacetic Acid, Green Chem., 2019, 21(17), 4604–4608, 10.1039/C9GC01768B.
- M. I. Franch, J. A. Ayllón, J. Peral and X. Domènech, Fe(III) Photocatalyzed Degradation of Low Chain Carboxylic Acids: Implications of the Iron Salt, Appl. Catal., B, 2004, 50(2), 89–99, DOI:10.1016/j.apcatb.2003.12.024.
- S. Barkin, M. Bixon, R. M. Noyes and K. Bar-eli, On the Oxidation of Malonic Acid by Ceric Ions, Int. J. Chem. Kinet., 1978, 10(6), 619–636, DOI:10.1002/kin.550100608.
- L. A. Badovskaya and L. V. Povarova, Oxidation of Furans (Review), Chem. Heterocycl. Compd., 2009, 45(9), 1023–1034, DOI:10.1007/s10593-009-0390-8.
- S. R. Kubota and K.-S. Choi, Electrochemical Valorization of Furfural to Maleic Acid, ACS Sustainable Chem. Eng., 2018, 6(8), 9596–9600, DOI:10.1021/acssuschemeng.8b02698.
Footnote |
| † Electronic supplementary information (ESI) available. See DOI: https://doi.org/10.1039/d3cy01686b |
| This journal is © The Royal Society of Chemistry 2024 |

